This research project was submitted in partial fulfillment of the requirements for the Degree of Bachelor of Business Science Actuarial at Strathmore University.
Gerard Wandera, Deputy Director, Kenya School of Government (KSG)Geneva Declaration
"Policing Contemporary Kenya- KPR and Private Security"
Regional Review Conference on the Geneva Declaration on Armed Violence and Development
Nairobi, Kenya | 26-27 November 2014
http://www.genevadeclaration.org/2014rrc/rrckenya/programme.html
James Ngului, Deputy Director, Kenya National Focal Point on Small Arms and L...Geneva Declaration
Session on "Controlling the tools of violence"
Regional Review Conference on the Geneva Declaration on Armed Violence and Development
Nairobi, Kenya | 26-27 November 2014
http://www.genevadeclaration.org/2014rrc/rrckenya/programme.html
BUDGET AND BUDGETARY CONTROL PRACTICES OF SOME SELECTED CREDIT UNIONS WITHIN ...Michael Owusu Ackom
According to Elliott (1986), Credit Unions essentially reverse the normal corporate financial objective of maximizing profit since they are expected to pay so much on savings and charge so little on loans. Therefore for Credit Unions to achieve a high level of organizational performance there should be effective and efficient use of resources. Budget and budgetary controls has been emphasized as a viable tool for ensuring effective and efficient use of organizational resource. The problem that normally arises is whether the budget and budgetary control practices of the Credit Unions comply with the best practices of budgeting.This study is a multiple case study, exploratory and descriptive research. The instrument used in gathering the data for this study is an interview guide. After data collection, analysis and processing was done by the use of computer programmes such as Microsoft Word and Excel. The research reveals that, the 60% of the Credit Unions have strategic plans which makes them more proactive than reactive in dealing with issues, ensures effective allocation of resources and inspires the budget. Also, annual budget was common to all the Unions and the bottom-up approach to budgeting was mostly used. Incremental budgeting was mostly prepared by the selected Unions, and budget committees as well as budget manuals were almost non-existent. Comparing budget figures with actual, and conducting variance analysis were the two most carried out monitoring and control activities. The selected Credit Unions comply fairly with the best standards in budget and budgetary control. The major challenges faced by the Unions were poor forecasting, time consuming, inability to achieve targets, difficulty in determining the cause of variance and identifying who to reward and who to punish. The Credit Unions should do more in motivating their management to produce budgets that are credible and challenging, educating the staff on the purpose of budgets, engaging dedicated budget specialist as well as tying people to specific budget target.
Habibu m.sc management dissertation on islamic insurance (takaful)ksssssmb
ABSTRACT
Islamic insurance is a substitute of conventional insurance. It is an option for people whose religious belief has discouraged them to patronize risk management products that are characterized with elements of uncertainty, interest rate and other non-religious complied principles. The study, however, aims at exploring the factors influencing Islamic Insurance (Takaful) services consumption in Kano Metropolis, Nigeria. This is to examine a given research problem by answering these questions which are: To what extent does building public awareness of Takaful services have significant effect on Takaful services consumption? To what extent does the level of public attitude have significant effect on the Takaful services consumption? To what extent does the level of public perception have significant effect on the Takaful services consumption? To what extent does the level of public trust and confidence reposed on Takaful operators have significant effect on Takaful services consumption? And finally, how does the level of Takaful operators’ capacity and competences have significant effect on Takaful services consumption? The five (5) Hypotheses formulated and the research objectives are in line with the research problem’ questions raised. The study’s design is survey research in which the exploratory method is employed using questionnaire and unstructured observation as the means for collecting primary data of the study. The research’s sample size is 411 where 384 represent actual and potential customers and 27 are the staff/agents of Takaful operators in Kano Metropolis. The study has analyzed the data using chi-square statistical tool. The findings of the study indicate that all the five (5) Null Hypothesis formulated are rejected. The results have discovered that the independent variables: public awareness of Takaful services, public attitude, public perception, public trust and confidence upon Takaful operators, capacity and competences of Takaful operators; have significant effect on the dependent variable (Takaful services consumption) in Kano Metropolis. It is therefore recommended: that all the stakeholders in Islamic insurance (Takaful) businesses shall put hands together and harness the available resources to promote the business; that the stakeholders shall embark on the attitudinal change campaign aims at making public to understand the need for purchasing Takaful services as a means of employing risk management and that the existing operators shall have to do a lot in creating a unique identity which can make the Takaful so different from conventional insurance so as to establish favorable perception of the subject matter; that there shall be needs for creating business trust and confidence between the public and the operators; and the stakeholders in the industry shall provide the needed capital investments which can enable the Takaful business to be well established and be capable in winning more customers. This would
how to sell pi coins in South Korea profitably.DOT TECH
Yes. You can sell your pi network coins in South Korea or any other country, by finding a verified pi merchant
What is a verified pi merchant?
Since pi network is not launched yet on any exchange, the only way you can sell pi coins is by selling to a verified pi merchant, and this is because pi network is not launched yet on any exchange and no pre-sale or ico offerings Is done on pi.
Since there is no pre-sale, the only way exchanges can get pi is by buying from miners. So a pi merchant facilitates these transactions by acting as a bridge for both transactions.
How can i find a pi vendor/merchant?
Well for those who haven't traded with a pi merchant or who don't already have one. I will leave the telegram id of my personal pi merchant who i trade pi with.
Tele gram: @Pi_vendor_247
#pi #sell #nigeria #pinetwork #picoins #sellpi #Nigerian #tradepi #pinetworkcoins #sellmypi
what is the future of Pi Network currency.DOT TECH
The future of the Pi cryptocurrency is uncertain, and its success will depend on several factors. Pi is a relatively new cryptocurrency that aims to be user-friendly and accessible to a wide audience. Here are a few key considerations for its future:
Message: @Pi_vendor_247 on telegram if u want to sell PI COINS.
1. Mainnet Launch: As of my last knowledge update in January 2022, Pi was still in the testnet phase. Its success will depend on a successful transition to a mainnet, where actual transactions can take place.
2. User Adoption: Pi's success will be closely tied to user adoption. The more users who join the network and actively participate, the stronger the ecosystem can become.
3. Utility and Use Cases: For a cryptocurrency to thrive, it must offer utility and practical use cases. The Pi team has talked about various applications, including peer-to-peer transactions, smart contracts, and more. The development and implementation of these features will be essential.
4. Regulatory Environment: The regulatory environment for cryptocurrencies is evolving globally. How Pi navigates and complies with regulations in various jurisdictions will significantly impact its future.
5. Technology Development: The Pi network must continue to develop and improve its technology, security, and scalability to compete with established cryptocurrencies.
6. Community Engagement: The Pi community plays a critical role in its future. Engaged users can help build trust and grow the network.
7. Monetization and Sustainability: The Pi team's monetization strategy, such as fees, partnerships, or other revenue sources, will affect its long-term sustainability.
It's essential to approach Pi or any new cryptocurrency with caution and conduct due diligence. Cryptocurrency investments involve risks, and potential rewards can be uncertain. The success and future of Pi will depend on the collective efforts of its team, community, and the broader cryptocurrency market dynamics. It's advisable to stay updated on Pi's development and follow any updates from the official Pi Network website or announcements from the team.
What website can I sell pi coins securely.DOT TECH
Currently there are no website or exchange that allow buying or selling of pi coins..
But you can still easily sell pi coins, by reselling it to exchanges/crypto whales interested in holding thousands of pi coins before the mainnet launch.
Who is a pi merchant?
A pi merchant is someone who buys pi coins from miners and resell to these crypto whales and holders of pi..
This is because pi network is not doing any pre-sale. The only way exchanges can get pi is by buying from miners and pi merchants stands in between the miners and the exchanges.
How can I sell my pi coins?
Selling pi coins is really easy, but first you need to migrate to mainnet wallet before you can do that. I will leave the telegram contact of my personal pi merchant to trade with.
Tele-gram.
@Pi_vendor_247
how can I sell pi coins after successfully completing KYCDOT TECH
Pi coins is not launched yet in any exchange 💱 this means it's not swappable, the current pi displaying on coin market cap is the iou version of pi. And you can learn all about that on my previous post.
RIGHT NOW THE ONLY WAY you can sell pi coins is through verified pi merchants. A pi merchant is someone who buys pi coins and resell them to exchanges and crypto whales. Looking forward to hold massive quantities of pi coins before the mainnet launch.
This is because pi network is not doing any pre-sale or ico offerings, the only way to get my coins is from buying from miners. So a merchant facilitates the transactions between the miners and these exchanges holding pi.
I and my friends has sold more than 6000 pi coins successfully with this method. I will be happy to share the contact of my personal pi merchant. The one i trade with, if you have your own merchant you can trade with them. For those who are new.
Message: @Pi_vendor_247 on telegram.
I wouldn't advise you selling all percentage of the pi coins. Leave at least a before so its a win win during open mainnet. Have a nice day pioneers ♥️
#kyc #mainnet #picoins #pi #sellpi #piwallet
#pinetwork
The European Unemployment Puzzle: implications from population agingGRAPE
We study the link between the evolving age structure of the working population and unemployment. We build a large new Keynesian OLG model with a realistic age structure, labor market frictions, sticky prices, and aggregate shocks. Once calibrated to the European economy, we quantify the extent to which demographic changes over the last three decades have contributed to the decline of the unemployment rate. Our findings yield important implications for the future evolution of unemployment given the anticipated further aging of the working population in Europe. We also quantify the implications for optimal monetary policy: lowering inflation volatility becomes less costly in terms of GDP and unemployment volatility, which hints that optimal monetary policy may be more hawkish in an aging society. Finally, our results also propose a partial reversal of the European-US unemployment puzzle due to the fact that the share of young workers is expected to remain robust in the US.
Introduction to Indian Financial System ()Avanish Goel
The financial system of a country is an important tool for economic development of the country, as it helps in creation of wealth by linking savings with investments.
It facilitates the flow of funds form the households (savers) to business firms (investors) to aid in wealth creation and development of both the parties
If you are looking for a pi coin investor. Then look no further because I have the right one he is a pi vendor (he buy and resell to whales in China). I met him on a crypto conference and ever since I and my friends have sold more than 10k pi coins to him And he bought all and still want more. I will drop his telegram handle below just send him a message.
@Pi_vendor_247
how to sell pi coins effectively (from 50 - 100k pi)DOT TECH
Anywhere in the world, including Africa, America, and Europe, you can sell Pi Network Coins online and receive cash through online payment options.
Pi has not yet been launched on any exchange because we are currently using the confined Mainnet. The planned launch date for Pi is June 28, 2026.
Reselling to investors who want to hold until the mainnet launch in 2026 is currently the sole way to sell.
Consequently, right now. All you need to do is select the right pi network provider.
Who is a pi merchant?
An individual who buys coins from miners on the pi network and resells them to investors hoping to hang onto them until the mainnet is launched is known as a pi merchant.
debuts.
I'll provide you the Telegram username
@Pi_vendor_247
Latino Buying Power - May 2024 Presentation for Latino CaucusDanay Escanaverino
Unlock the potential of Latino Buying Power with this in-depth SlideShare presentation. Explore how the Latino consumer market is transforming the American economy, driven by their significant buying power, entrepreneurial contributions, and growing influence across various sectors.
**Key Sections Covered:**
1. **Economic Impact:** Understand the profound economic impact of Latino consumers on the U.S. economy. Discover how their increasing purchasing power is fueling growth in key industries and contributing to national economic prosperity.
2. **Buying Power:** Dive into detailed analyses of Latino buying power, including its growth trends, key drivers, and projections for the future. Learn how this influential group’s spending habits are shaping market dynamics and creating opportunities for businesses.
3. **Entrepreneurial Contributions:** Explore the entrepreneurial spirit within the Latino community. Examine how Latino-owned businesses are thriving and contributing to job creation, innovation, and economic diversification.
4. **Workforce Statistics:** Gain insights into the role of Latino workers in the American labor market. Review statistics on employment rates, occupational distribution, and the economic contributions of Latino professionals across various industries.
5. **Media Consumption:** Understand the media consumption habits of Latino audiences. Discover their preferences for digital platforms, television, radio, and social media. Learn how these consumption patterns are influencing advertising strategies and media content.
6. **Education:** Examine the educational achievements and challenges within the Latino community. Review statistics on enrollment, graduation rates, and fields of study. Understand the implications of education on economic mobility and workforce readiness.
7. **Home Ownership:** Explore trends in Latino home ownership. Understand the factors driving home buying decisions, the challenges faced by Latino homeowners, and the impact of home ownership on community stability and economic growth.
This SlideShare provides valuable insights for marketers, business owners, policymakers, and anyone interested in the economic influence of the Latino community. By understanding the various facets of Latino buying power, you can effectively engage with this dynamic and growing market segment.
Equip yourself with the knowledge to leverage Latino buying power, tap into their entrepreneurial spirit, and connect with their unique cultural and consumer preferences. Drive your business success by embracing the economic potential of Latino consumers.
**Keywords:** Latino buying power, economic impact, entrepreneurial contributions, workforce statistics, media consumption, education, home ownership, Latino market, Hispanic buying power, Latino purchasing power.
how can i use my minded pi coins I need some funds.DOT TECH
If you are interested in selling your pi coins, i have a verified pi merchant, who buys pi coins and resell them to exchanges looking forward to hold till mainnet launch.
Because the core team has announced that pi network will not be doing any pre-sale. The only way exchanges like huobi, bitmart and hotbit can get pi is by buying from miners.
Now a merchant stands in between these exchanges and the miners. As a link to make transactions smooth. Because right now in the enclosed mainnet you can't sell pi coins your self. You need the help of a merchant,
i will leave the telegram contact of my personal pi merchant below. 👇 I and my friends has traded more than 3000pi coins with him successfully.
@Pi_vendor_247
Even tho Pi network is not listed on any exchange yet.
Buying/Selling or investing in pi network coins is highly possible through the help of vendors. You can buy from vendors[ buy directly from the pi network miners and resell it]. I will leave the telegram contact of my personal vendor.
@Pi_vendor_247
USDA Loans in California: A Comprehensive Overview.pptxmarketing367770
USDA Loans in California: A Comprehensive Overview
If you're dreaming of owning a home in California's rural or suburban areas, a USDA loan might be the perfect solution. The U.S. Department of Agriculture (USDA) offers these loans to help low-to-moderate-income individuals and families achieve homeownership.
Key Features of USDA Loans:
Zero Down Payment: USDA loans require no down payment, making homeownership more accessible.
Competitive Interest Rates: These loans often come with lower interest rates compared to conventional loans.
Flexible Credit Requirements: USDA loans have more lenient credit score requirements, helping those with less-than-perfect credit.
Guaranteed Loan Program: The USDA guarantees a portion of the loan, reducing risk for lenders and expanding borrowing options.
Eligibility Criteria:
Location: The property must be located in a USDA-designated rural or suburban area. Many areas in California qualify.
Income Limits: Applicants must meet income guidelines, which vary by region and household size.
Primary Residence: The home must be used as the borrower's primary residence.
Application Process:
Find a USDA-Approved Lender: Not all lenders offer USDA loans, so it's essential to choose one approved by the USDA.
Pre-Qualification: Determine your eligibility and the amount you can borrow.
Property Search: Look for properties in eligible rural or suburban areas.
Loan Application: Submit your application, including financial and personal information.
Processing and Approval: The lender and USDA will review your application. If approved, you can proceed to closing.
USDA loans are an excellent option for those looking to buy a home in California's rural and suburban areas. With no down payment and flexible requirements, these loans make homeownership more attainable for many families. Explore your eligibility today and take the first step toward owning your dream home.
Assessing Determinants of Public Pension System Reform in Kenya
1. ASSESSING THE DETERMINANTS OF PUBLIC PENSION SYSTEM REFORM IN
KENYA
BY
OKOTH GEORGE OWINO
Student Number: 071194
A research project submitted in partial fulfilment of the requirements for the Degree of
Bachelor of Business Science Actuarial at Strathmore University
School of Finance and Applied Economics
Strathmore University
Nairobi, Kenya
November, 2015
This Research Project is available for Library use on the understanding that it is copyright
material and that no quotation from the Research Project may be published without proper
acknowledgement.
3. ii
ACKNOWLEDGEMENT
This research project would not have been possible without the assistance of various parties. First
and foremost, I would like to thank God for enabling me to have the necessary strength and patience
as I worked on this research project. I would also like to thank Strathmore University for the
opportunity to undertake the study and for availing the necessary materials. Many thanks to Dr
Carolyn Njenga for significant supervision, advice, encouragement, guidance, and mentorship
throughout the project. Lastly, I express utmost gratitude and special thanks to my family and
friends, especially Susan Manya and Kiganya Grace, who offered relentless encouragement and
support throughout the entire semester. The product of this research project would not have been
possible without all of them.
4. iii
ABSTRACT
In recent years many countries around the world have either undertaken or are seriously
considering a pension reform due to various factors. This study was done to try and establish the
key factors Kenya should consider when undertaking a public pension system reform. Data was
collected from 2005 to 2013. Time series regression analysis was conducted with the NSSF fund
value growth as the dependent variable and the following independent variables: central
government debt, pension debt, external debt, gross savings as percentage of GDP, contributions
growth rate, age dependency and life expectancy. The regression analysis was used to determine
the relationship between the dependent variable and the independent variables. The study found a
significant relationship between the NSSF fund value growth and central government debt, pension
debt, gross savings as percentage of GDP, life expectancy and age dependency ratio, indicating
that pension reforms have generally been effected because of economic and demographic factors.
The study recommends that policies should be put into place to better manage pension
contributions, pension debt and the age dependency ratio, to increase the sustainability and
robustness of the NSSF.
5. iv
TABLE OF CONTENTS
DECLARATION.................................................................................................................................................i
ACKNOWLEDGEMENT.................................................................................................................................ii
ABSTRACT.......................................................................................................................................................iii
LIST OF FIGURES..........................................................................................................................................vi
LIST OF TABLES...........................................................................................................................................vii
LIST OF ABBREVIATIONS ........................................................................................................................viii
CHAPTER ONE ................................................................................................................................................ 1
INTRODUCTION.............................................................................................................................................. 1
1.1. Background of the study.................................................................................................................... 1
1.2. Situational Analysis and the Current Pension System in Kenya................................................... 2
1.2.1. Kenya’s population and employment structure...................................................................... 2
1.2.2. Relevant macro-economic ......................................................................................................... 3
1.2.3. Relevant financial sector data................................................................................................... 3
1.2.4. Current Pensions System in Kenya .......................................................................................... 3
1.3. Problem Statement............................................................................................................................. 4
1.4. Research Objective ............................................................................................................................ 5
1.5. Research Questions............................................................................................................................ 5
1.6. Significance of the Study ................................................................................................................... 5
CHAPTER TWO ............................................................................................................................................... 6
LITERATURE REVIEW ................................................................................................................................. 6
2.1. Introduction........................................................................................................................................ 6
2.2. Determinants of Pension Reforms.................................................................................................... 6
2.2.1. Political Factors.......................................................................................................................... 6
2.2.2. Economic Factors....................................................................................................................... 7
2.2.3. Demographic Factors................................................................................................................. 8
2.2.4. Other Factors.............................................................................................................................. 8
2.3. Reforms............................................................................................................................................... 8
2.3.1. Chilean Pension Reform............................................................................................................ 8
2.3.2. Nigerian Pension Reform .......................................................................................................... 9
2.3.3. UK Pension Reform ................................................................................................................... 9
2.4. Kenyan Pension Reform to date ....................................................................................................... 9
2.5. Summary........................................................................................................................................... 10
CHAPTER THREE......................................................................................................................................... 11
RESEARCH METHODOLOGY ................................................................................................................... 11
3.1. Introduction........................................................................................................................................... 11
3.2. Research Design .................................................................................................................................... 11
3.3. Population of the Study ........................................................................................................................ 11
3.4. Sample Size and Sampling Procedures............................................................................................... 11
6. v
3.5. Data Collection...................................................................................................................................... 12
3.6. Data Analysis......................................................................................................................................... 12
CHAPTER FOUR............................................................................................................................................ 13
DATA PRESENTATION AND ANALYSIS OF FINDINGS...................................................................... 13
4.1. Introduction........................................................................................................................................... 13
4.2. Analysis of Data and Presentation of Findings .................................................................................. 13
4.2.1. NSSF Fund Value Growth (FVG) ................................................................................................ 13
4.2.2. Pension Debt (PD).......................................................................................................................... 13
4.2.3. Central Government Debt (as a percentage of GDP) (CGD)..................................................... 14
4.2.4. Gross Savings (as a percentage of GDP) (GS)............................................................................. 14
4.2.5. External Debt (ED) ........................................................................................................................ 15
4.2.6. Dependency Ratio (DR)................................................................................................................. 15
4.2.7. Age of Contributors (AGE)........................................................................................................... 16
4.2.8. Contributions Growth (CGR)....................................................................................................... 16
4.3. Descriptive Analysis.............................................................................................................................. 17
4.4. Correlation Analysis ............................................................................................................................. 18
4.5. Regression Analysis .............................................................................................................................. 18
4.6. Summary and Interpretation of Findings........................................................................................... 20
CHAPTER FIVE ............................................................................................................................................. 22
SUMMARY, CONCLUSIONS AND RECOMMENDATIONS.................................................................. 22
5.1. Summary................................................................................................................................................ 22
5.2. Conclusions............................................................................................................................................ 22
5.3. Policy Recommendations...................................................................................................................... 23
5.4. Limitations of the Study ....................................................................................................................... 24
5.5. Suggestions for Further Research ....................................................................................................... 24
REFERENCES................................................................................................................................................. 25
7. vi
LIST OF FIGURES
Figure 1: A Taxonomy of Social Security Systems ......................................................................................... 2
8. vii
LIST OF TABLES
Table 1: Classification of Retirement Benefit Schemes in Kenya.................................................................. 4
Table 2: NSSF Fund Value Growth ............................................................................................................... 13
Table 3: Pension Debt...................................................................................................................................... 14
Table 4: Central Government Debt................................................................................................................ 14
Table 5: Gross Savings (as % of GDP) .......................................................................................................... 15
Table 6: External Debt .................................................................................................................................... 15
Table 7: Age Dependency Ratio...................................................................................................................... 16
Table 8: Life Expectancy................................................................................................................................. 16
Table 9: Contributions Growth ...................................................................................................................... 17
Table 10: Summary Statistics ......................................................................................................................... 17
Table 11: Correlation Matrix ......................................................................................................................... 18
Table 12: Regression Statistics ....................................................................................................................... 19
Table 13: Anova ............................................................................................................................................... 19
Table 14: Summary Output ............................................................................................................................ 19
9. viii
LIST OF ABBREVIATIONS
AKI- Association of Kenya Insurers
GDP- Gross Domestic Product
IMF- International Monetary Fund
NSE- Nairobi Stock Exchange
NSITF- Nigerian Social Insurance and Trust Fund
NSSF- National Social Security Fund
OECD- Organization for Economic Cooperation and Development
PAYG- Pay-as-you-go
RBA- Retirement Benefits Authority
10. 1
CHAPTER ONE
INTRODUCTION
1.1. Background of the study
A pension fund, also known as a superannuation fund in some countries, is a form of institutional
investor which collects pools and invests funds contributed by sponsors and beneficiaries to
provide for the future pension entitlements of beneficiaries (Davis, 1995). The main purpose of
pension funds is to provide means for individuals to accumulate savings during their productive
and working life in preparation for financing of their needs when they retire from active
employment. Pension funds make payments to beneficiaries either by means of a lump sum or by
provision of an annuity, while also supplying funds to corporations and governments for
investment.
Generally around the world, there is growing need to have a sustainable growth of pension funds
due to growing populations. Most countries are experiencing change in demographic trends such
as increasing life expectancy, increasing longevity risk1
, and reduced fertility rates that seem to
threaten the sustainability of traditional pay-as-you-go pension systems (Awino, 2013). If the
demographic trends continue, the pension contributions from the working population will be
insufficient to support the elderly. In response, many countries are increasingly reforming their
pension systems towards partial or full funding. Another motivator for countries to reform their
pension systems include the belief that growth of pension funds will contribute to economic
development, by promoting national savings and capital market development (Meng & Pfau,
2010).
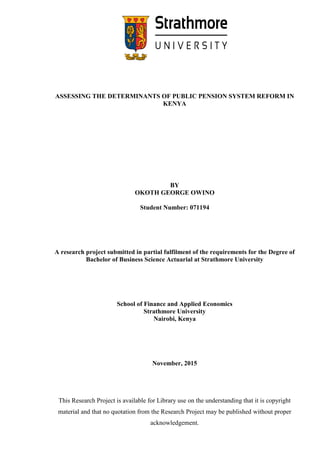
Lindbeck and Persson (2003) classified pension systems under three key dimensions: type of
benefit (defined benefit versus defined contribution2
), type of financing (funded versus unfunded3
)
and type of actuarial fairness (non-actuarial versus actuarial4
). The classification can be
summarised in a graph where system I represents a non-actuarial unfunded PAYG pension system;
1
Risk attached to the increasing life expectancy of pensioners and policyholders which may eventually translate to higher
than expected pay-out-ratios.
2
In a defined contribution system the definition of final amount of pension is unknown but how much is contributed each
year while working is known whereas defined benefit system the definition of the final amount of pensions is agreed and
known to the individual.
3
In a funded system, aggregate benefits are financed by a tax on currently working generations whereas in a fully funded
system benefits are financed directly from returns on previously accumulated pension funds.
4
Actuarial fairness refers to the existence of a link between contributions paid and benefits received.
11. 2
system II a quasi-actuarial unfunded system; system III a non-actuarial funded system; and system
IV a fully funded actuarial system.
Figure 1: A Taxonomy of Social Security Systems
In principle, a defined benefit or defined contribution system can be placed anywhere along the
trapezoid. In practice, however, it is virtually impossible to find a defined benefit system in position
II or IV. Pension reforms can therefore be summarized as a shift from a system of type I to one of
type II ,III, or IV or finding the best mix with intention of enhancing efficiency, equity, financial
stability and political sustainability (Baroni, 2007).
1.2. Situational Analysis and the Current Pension System in Kenya
1.2.1. Kenya’s population and employment structure
Kenya’s population at the last census in 2009 was indicated at 38.6m. The population is currently
estimated at 45.9m5
and is projected to increase to 85m by 2050. The proportion of the population
above age 55 is estimated at 6% whilst 41% of the population is estimated to be below age 15.
Kenya’s population is thus young, but is projected to age and by the time today’s labour force
entrants retire, the proportion of the population above age 55 is expected to almost triple. The
dependency ratio6
is also expected to increase from 15% to 35% by 2050 (United Nations, 2013).
Total employment outside rural small scale farming and pastoral activities increased from 13.5m
in 2013 to 14.3m in 2014. Of this, the formal sector comprised of 2.5m (or 17.3% of the total
employment) and the informal sector7
which covers informal urban and the agricultural workers
5
Source: Economic Survey 2015
6
Ratio of elderly to active workforce
7
Informal Sector- Commonly referred to as ‘jua kali’ sector
12. 3
comprised 82.7% of total recorded labour force. More importantly, the economy generated a total
of 799.7 thousand new jobs, in both the formal and informal sectors.
1.2.2. Relevant macro-economic8
Kenya’s GDP was estimated to have expanded by 5.3% in 2014, compared to a growth of 5.7% in
2013. Government monetary policy has been directed at attaining and maintaining inflation rate of
5%, though actual inflation was 6.9% in 2014.
1.2.3. Relevant financial sector data9
In East and Central Africa, Kenya has a relatively more development financial services sector with
close to 45 banking institutions and a similar number of insurance companies. Over the past five
years, there has been a rapid growth in the customer base of banks and in the growth of consumer
banking products. The level of penetration of life insurance remains low at less than 2% of GDP.
During the past few years, Kenya has made important progress towards improving the financial
markets, including the dematerialization of securities, automated trading, introduction of risk rating
agencies and the introduction of new performance measurement indices, all of which have
improved the investment environment in which pension schemes operate in.
The Government Bond market has expanded significantly in the last seven years with bond tenors
ranging from 1 to 15 years and in 2008 seeing the introduction of a 20 year fixed rate Government
bond. Interest rate remained stable, with the 91-day Treasury bill rate settling at 8.58% in
December 2014. The Nairobi Stock Exchange has also experienced significant growth with
volumes of shares traded recording a growth of 38.5% from Ksh 156 billion in 2013 to Ksh 216
billion in 2014. NSE 20 share index rose from 4, 927 points in 2013 to 5,113 points in December
2014.
Kenya also has a vibrant cooperative sector with over 11,000 registered cooperatives, a
membership of over 7 million and assets estimated at Ksh 30 billion.
1.2.4. Current Pensions System in Kenya
The current retirement benefits system in Kenya can be classified into the following scheme types:
8
Source: Economic Survey 2015
9
Source: Economic Survey 2015
13. 4
Table 1: Classification of Retirement Benefit Schemes in Kenya
Scheme Type NSSF Public Service
Pension
Schemes
Occupational
Schemes
Individual
Schemes
Legal Structure Act of
Parliament
Act of
Parliament
Established
under Trust
Established
under Trust
Membership Employees in
formal sector
establishments
excluding
public service
employees
All public
service
employees,
including civil
servants,
teachers and
disciplined
forces. Separate
schemes for
armed forces
Formal sector
workers in
companies that
operate
retirement
schemes
Open to all on
voluntary basis
Funding Funded Non funded Funded Funded
Regulation RBA Act of
Parliament
RBA RBA
Criteria used to assess the aspects of the current pensions system:
a) Adequacy – benefits are sufficient to prevent old age poverty and provide reliable means to
smooth lifetime poverty for the vast majority of the population
b) Affordability – both within the financing capacity of individuals and society
c) Sustainability – financial soundness over an appropriate time horizon under a broad set of
reasonable assumptions.
d) Robustness – capacity to withstand major shocks, such as significant shifts in economic
prospects or demographic trends.
1.3. Problem Statement
Many developing countries are undertaking pension system reforms either to replicate systems
existing in developed countries or to adopt the three-pillar system proposed by World Bank in 1994
(Mudrazja, 2006). World Bank proposed the three-pillar after studying Chilean pension reform and
concluding that there is a causal relationship between Chilean-style pension and economic
performance, therefore causing countries to adopt the system with belief that the reform will boost
economic development and increase savings.
According to Brooks (2005) countries have also reformed their pension systems due to the global
trend of aging and also due to regional influence from countries with stronger economies. Countries
are generally reforming their pension systems not because of their unique socio-economic and
political circumstances but because of the general urge to replicate what works well in other
14. 5
countries. This study therefore seeks to establish the key factors Kenya needs to consider when
undertaking public pension system reforms.
1.4. Research Objective
To analyse the determinants of pension reforms in order to establish which factors will be relevant
to consider when undertaking public pension system reforms in Kenya.
1.5. Research Questions
The study is guided by the following research questions:
1. What are the key determinants of pension reforms?
2. What factors are relevant for the decision to undertake pension system reforms in Kenya?
1.6. Significance of the Study
Currently in Kenya the coverage of existing pension system is still low with less than 15% of active
work force having a pension saving plan, leaving 85% of the working force with no form of
retirement saving (Source RBA). The coverage is mostly in the formal sector leaving behind
informal and agricultural sectors uncovered. The low coverage is mainly attributed to non-
mandatory requirement for employer to sponsor a pension scheme. Other factors that have
contributed to low coverage are: individual retirement pension benefit plans not being popular
country wide and fast growing informal sector than the formal sector.
All these factors contribute to the urgent legislative and government intervention to increase the
level of pension penetration in the country to generate enough fund that can be of economic
importance to all sectors of development. It is from low pension penetration level in the country
that it can be justified to have a mandatory pension system that requires employees to subscribe to
supplementary pension schemes. However, the nature and structure of such systems in terms of
design and delivery may differ depending on key issues addressed such as: coverage of the scheme,
contribution levels, cost distribution, means of scheme introduction, and the establishment of
ceilings and floors.
The findings of the study will therefore assist the government to know factors that affect the
performance and growth of pension funds. The government will also be able to put in place any
appropriate regulations and policies to enhance a sustainable growth of pension funds.
15. 6
CHAPTER TWO
LITERATURE REVIEW
2.1. Introduction
This study seeks to examine the relevance of various factors underlying the decision of countries
to undertake a pension reform. This section therefore generally introduces and/or critically
questions literature that are relevant to the research objective and research questions.
2.2. Determinants of Pension Reforms
This section gives a critical analysis of literature that highlight on general conditions that prompt
some countries to reform their pension system. The conditions are then related to the current
situation in Kenya.
2.2.1. Political Factors
One key finding has been that although globalization means that countries face increasingly similar
economic challenges, they are still so different that there is not a single type of national social
security system that would be the most appropriate for all countries (Scharpf, 2000). This
represents a strong argument against the quest for “one-size-fits-all” policy. In addition, this
argument has been reinforced by the fact that even those countries that have reformed their pension
systems opted for different models of reform, depending on their particular pre-reform economic
and political conditions (Mesa-Lago, 2001). Difference in national security systems is evident in
East Africa where Kenya, Uganda and Tanzania have close to similar economic challenges but the
countries opt for different models of reform.
A popular notion has always been that the less democratic a government of a certain country, the
more likely a substantial reform of national social security. This has been mostly based on the
theoretical expectation that decision making is centralized in non-democratic regimes. The
argument has been supported by the comparison of several democracies in Latin America with
Chile in the time of reform, where the reforms in democratic countries were either more modest or
did not occur (Kay, 1999). Further support has come from a quantitative analysis of the relationship
between the level of democracy and the likelihood of pension reform from the sample of all
countries that did any pension reforms (Brooks, 2002). Galasso and Profeta (2003) came to similar
conclusions for European countries, as they observed that delegating pension policy to the
European Commission could facilitate reforms due to the inherent characteristics of lesser
accountability of the commission. The arguments have however being developed focusing on few
16. 7
countries, so it is hard to make generalizations on a global scale. Nevertheless, the findings
underpin an important point. It is likely that increased likelihood of pension reform in a less
democratic country is just a special case of a general rule, which would be that any decision is
easier to be made in a less democratic country.
The other political factor given serious attention is peer dynamics. Historical experience shows
how the number of countries deciding to introduce a pension system in any region of the world
decisively grew after one or several dominant countries in the region decided to introduce it
(Orenstein, 2003). Orenstein finds evidence that the policy diffusion of pension reform in recent
years follows the same pattern with the influential regional models playing a key role in the
proliferation of pension reform. Boeri (2003) also finds out that Central and East European
Countries and the new European Union members are likely to opt for social models similar to those
in the European Union.
Another political factor recognized as important for both the decision of undertaking pension
reforms, as well as the particular model of reform is the role of different players and interest groups
on the political scene. The strength of the president for Latin American countries (Madrid, 2002)
or by the level of party fragmentation in the legislative arm of power is found to be positively
correlated to the decision to undertake pension reform (James & Brooks, 2001). The World Bank
has emerged as the most important player on a global scale. The strength of the World Bank’s
influence has been found both in theory and empirical studies of pension reforms to be positively
correlated with pension reform decisions and the degree of pension system privatization. The
Kenyan pension system has been structured towards the Multi-Pillar System proposed by World
Bank in 1994. The Multi-Pillar system involves a strategy to reform simultaneously a country’s
public, private and occupational systems.
2.2.2. Economic Factors
Generally there have been many studies about the impact of pension reforms on the economic
performance of countries. To mention but a few, Brooks (2002) in his study identified that the size
of debt to GDP ratio has a negative correlation with decision to reform national social security
systems. This reluctancy has been associated with the necessary transitional costs that occur with
pension reform, and which pose a bigger burden and a greater financial risk for those governments
that are already significantly indebted.
Many governments believe that introduction of defined contribution pension schemes will
generally boost savings, develop capital markets and reduce governmet contingent liabilities
(Mesa-Lago & Muller, 2002). However, this may not be the case in Kenya since there are personal
17. 8
pension gaps, which are closely associated with growing informal sector, low paying jobs and
increasing self employement as indicated by the 2015 Economic Survey. These gaps are likely to
still lead to poverty and hardships for the elderly population and inflated future government welfare
expenditure.
2.2.3. Demographic Factors
Aging and deteriorating old-age dependency ratio10
have been cited by the pension reform
proponents as argubly the most important reason for undertaking pension reform ever since
Averting the Old Age Crisis (World Bank, 1994). Occasionally, though, demographic factors like
aging are taken into account, and found to be positively correlated with the pension reform decision
(Brooks, 2005). Cases where demographic factors are given the central place in a study, like the
one by Galaso and Profeta (2003) who studied the political consequences of aging in several
leading OECD countries, are not so common.
2.2.4. Other Factors
Besides the political, economic and demographic factors, some authors tried to point to several
other factors that might have contributed to the pension reform decision. One such factor is
expectation of (economic) crisis (Weyland, 1998), which gives importance to the psychological
factors in explaining pension reform. Another factor is culture, which was found to be a statistically
siginificant explanatory variable in a study done by Simmons and Elkins (2004).
2.3. Reforms
2.3.1. Chilean Pension Reform
Chile reformed its pension system in 1981 by replacing a public pay-as-you-go system with a new
complusory system of individual funded and privately owned pension accounts based on defined
contribution principles. In 1994, World Bank in its article Averting the Old Age Crisis suggested
that the Chilean pension reform proved that a shift of pension provisions from the public to the
private sector and from PAYG to defined contribution would maintain social protection while
increasing economic growth via the deepening of financial markets. However, the Chilean reform
proved to be unsuccessful as originally assumed. Although the Chilean system increased the
number of workers contributing for their pensions, the level and length of contributions and
subsequent expected pension benefits remained on average quite low (Feldstein, 1998). The system
delivered poverty pensions rather old age security to most contributors. In reaction to the coverage
gaps of the funded system, the Chilean government reformed the system further by introducing a
10
Dependency ratio in Kenya can be defined as the ratio of people aged 60 and above to people aged 18-59.
18. 9
new public and tax-financed social pension system in order to provide additional income for current
and future pensioners with very small funded pensions (Riesco, 2009).
2.3.2. Nigerian Pension Reform
The Nigerian 2004 reform was inspired by the Chilean experience. Nigeria attempted to replicate
the 1981 Chilean pension reform. Before 2004, Nigeria had its formal sector covered by a pay-as-
you-go pension scheme, the Nigerian Social Insurance and Trust Fund (NSITF). NSITF’s scope
and coverage was limited compared to those of public sector schemes. Only some large enterprises
offered access to the scheme and NSITF’s accumulated capital and pensions payouts were low
whereas administrative expenses were high (ILO, 2006). The resulting pattern of pension
provisions was highly fragmented and the avaiable data suggested that only 10 percent (4.8milllion
out about 48million) of the Nigerian workforce belonged to the formal employment sector, out of
which about 3.7 million also belonged to a pension scheme (Casey, 2009). The main draw-back
being the implementation challenges.
2.3.3. UK Pension Reform
In 2004, the UK also reformed its pension system. The reform stipulated that all employers were
obligated to offer a qualifying workplace pension scheme and automatically enroll eligible
employees with an increase in contribution rates (Taylor-Gooby, 2005).
2.4. Kenyan Pension Reform to date
The Kenyan pension system has undergone a number of major reforms all directed to maintain
long-term sustainability. In this section, an analysis of literature on pension reforms in Kenya,
mostly reforms on the NSSF, is given.
The first major reform made in the pension sector was the introduction of the Retirement Benefits
Act in 1997. The Act was introduced to strengthen the governance, management and effectiveness
of the NSSF and of the occupational pension sector (Sundeep, 2008). The reform was simply aimed
at bettering the operations of the NSSF. According to Odundo (2003) the need for the reform was
due to the fact that the retirement benefits sector had poor administative and investment of scheme
funds with particular concerns on concentration of investments, particulary in real property.
Odundo further pointed out that disclosure and accountability were lacking and that the NSSF had
also been riddled with governance issues and concerns over its payment of benefits. Sundeep
(2008) added that the 1997 reform was made due to little effective regulation and supervision. The
interests of retirement scheme members and their beneficiaries were not sufficiently protected.
There was concern about the design and financial viability of certain schemes in the country.
19. 10
Generally, the issues mentioned by Odundo and Sundeep were some of the major reasons for the
1997 reform in the Kenyan pension sector.
In 2000, further reforms were made through the establishment of the Retirement Benefits
Authority. The Retirement Benefits Authority marked the beginning of a regulated, organized and
more responsible retirement benefits sector in Kenya (Sundeep, 2008). The main aim of RBA
according to the Act was to improve protection of members’ benefits and improve governance of
schemes. The Act did not address issues concerning benefit adequacy, sustainability and robustness
of the NSSF.
The reforms made up until 2000 had a positive impact on the occupational pension sector but the
NSSF’s overall levels of coverage and benefit adequacy were poor. Poor levels of coverage,
inadequate benefits and many other factors like demographic aging, changing in social fabric of
the country, changes in employment structures, behavioural obstacles to saving and the need for a
coordinated reform strategy motivated the 2012 NSSF bill to be proposed. The bill was enacted in
2013 to address the loop-holes in the Kenyan pension system that were not adequately addressed
in the previous reforms. A study by Olukuru and Masinde (2014) anaylzed the impact of the NSSF
Act of 2013 on the Kenyan pension industry. Their study asserted that the newly set 6 per cent
contribution is sufficient to meet the welfare conditions of Kenyans. The study, however, did not
consider the factors that prompt pension reforms and if the reforms made are linked to the changing
demographic and economic trends.
2.5. Summary
From the literature reviewed, it can be clearly seen that there are many factors that motivate pension
reforms. The factors highlighted and other circumstances have caused many countries around the
world, developed and developing, to reform their pension system and set new policies with the
objective of having a sustainable and robust pension industry. The literature review has also
highlighted reforms in the Kenyan pension industry and the factors that prompted the reforms. The
study will be focused on Kenya and the main aim will be to determine revelant factors to consider
when undertaking further reforms. The study is simply meant to inform issues such as: further
increasing contribution rates, lowering benefits, allowing later retirement with the same benefits
and increasing savings.
20. 11
CHAPTER THREE
RESEARCH METHODOLOGY
3.1. Introduction
This chapter gives the methodology that was used to accomplish the already established research
objective. Under this chapter the research design, target population, sampling design, sample size,
data collection and analysis, are briefly discussed. According to Kothari (2004), research
methodology is a way to systematically solve the research problem. It examines the various steps
that are generally adopted by a researcher in studying the research problem.
3.2. Research Design
Rajendra (2008) defines research design as the linkage and organization of conditions for collection
and analysis of data in a manner that aims at combining relevance to the research purpose with
economy in the procedure. He further argues that research design focuses on the structure of an
enquiry, which leads to the minimization of the chance of drawing the wrong casual inferences
from the data. This study was a case study of the NSSF, investigating the key factors to consider
when reforming the public pension system. This design was most appropriate for a single unit of
study because it offers a detailed in depth analysis of the subject of investigation. According to
Mugenda and Mugenda (2003), a case study involves a careful and complete examination of a
social unit, institution, family, cultural group or an entire community and embraces depth rather
than breadth of the study. The primary purpose of a case study is to determine factors and
relationships among the variables identified in the study.
3.3. Population of the Study
According to Vanderstoep and Johnston (2009) the population is the universe of people to which
the study can be generalized. The population can simply be the entire spectrum of a system or
process of interest. According to the Retirement Benefits Authority (2014) there are 1216
registered pension funds in Kenya. The target population consisted of all registered pension
schemes.
3.4. Sample Size and Sampling Procedures
The study focused on the NSSF since it is the largest pension scheme in Kenya and it has audited
annual financial statements that are readily available.
21. 12
3.5. Data Collection
The study used secondary data. The secondary data was quantitative in nature and collected from
the annual financial statements of the NSSF and World Development Indicators Reports. All data
was sourced from the internet.
3.6. Data Analysis
A multiple regression model was used to analyze the data collected. The regression analysis was
done using the regression model below:
𝐹𝑉𝐺 = 𝛽0 + 𝛽1 𝑃𝐷 + 𝛽2 𝐶𝐺𝐷 + 𝛽3 𝐺𝑆 + 𝛽4 𝐸𝐷 + 𝛽5 𝐷𝑅 + 𝛽6 𝐴𝐺𝐸 + 𝛽7 𝐶𝐺𝑅 + 𝜀
In short form:
𝑅𝐸𝐹𝑂𝑅𝑀 = 𝛼 + 𝛽𝐸𝐶𝑂𝑁𝑖 + 𝛾𝑃𝑂𝐿𝑖 + 𝛿𝐷𝐸𝑀𝑂𝐺𝑖 + 𝜀𝑖
Where 𝑅𝐸𝐹𝑂𝑅𝑀 is the probability of reform and this is measured using the fund value growth-
assuming that when a reform is made there is significant change in the fund value growth rate;
𝐸𝐶𝑂𝑁𝑖 is the economic factors measured using pension debt (PD), central government debt as a
percentage of GDP (CGD) and gross savings as a percentage of GDP (GS); 𝑃𝑂𝐿𝑖 is the political
factors measured using external debt (ED); 𝐷𝐸𝑀𝑂𝐺𝑖 is the demographic factors measured using
age dependency ratio (DR), life expectancy (AGE) and contributions growth rate (CGR); and 𝜀𝑖 is
the error term. The terms α, β, ϒ and δ represent the intercept in the regression and the sensitivity
of fund value growth on each of the factors.
The t-tests at 85% confidence level was used to determine the statistical significance of the constant
term, α, and the coefficient terms, β, γ and δ. The F-tests was used to determine whether the
regression is of statistical importance at 85% confidence interval. The coefficient of determination,
𝑅2
, and the adjusted 𝑅2
was used to determine how much variation in the dependent variables is
explained by variation in the independent variables. The analysis was done using Excel 2013.
22. 13
CHAPTER FOUR
DATA PRESENTATION AND ANALYSIS OF FINDINGS
4.1. Introduction
In this chapter, the focus is on the presentation of data and interpretation of the findings. It presents
the analysis of the data and the regression analysis results. The data is presented and analysed, then
compared with other similar studies done on the subject matter of this study.
4.2. Analysis of Data and Presentation of Findings
4.2.1. NSSF Fund Value Growth (FVG)
The values of the fund value are as reported in the audited financial statements of the NSSF. The
figures are presented in Table 2 below. The highest fund value growth of 22.15 was reported in
2013 and the lowest growth was reported in 2009.
Table 2: NSSF Fund Value Growth
Year Fund Value (KES. ‘000) Fund Value Growth (%)
2004 54,247,164
2005 63,467,619 17.00
2006 71,824,668 13.20
2007 81,310,870 13.18
2008 90,508,481 11.31
2009 82,147,889 -9.24
2010 98,606,651 20.04
2011 110,365,142 11.92
2012 110,461,612 0.09
2013 134,932,875 22.15
(Source: NSSF Financial Statements)
4.2.2. Pension Debt (PD)
Pension debt was measured as the current liabilities of the NSSF as reported in the audited financial
statements. Table 3, in the next page, provides the extracted figures. The pension debt has generally
being on a rising trend and this can be attributed to more people retiring than those joining the
scheme.
23. 14
Table 3: Pension Debt
Year Current Liabilities (KES. ‘000)
2005 1,722,851
2006 1,636,556
2007 1,355,228
2008 1,492,079
2009 1,745,772
2010 2,221,540
2011 4,371,493
2012 5,854,131
2013 4,193,043
(Source: NSSF Financial Statements)
4.2.3. Central Government Debt (as a percentage of GDP) (CGD)
Claims on central government as a percentage of GDP was used to measure the central government
debt. According to World Bank (2014) claims on central government include all loans to central
government institutions net of all deposits. The extracted figures are presented in the Table 4 below.
Table 4: Central Government Debt
Year Claims on Central Govt. Debt (% of GDP)
2005 9.28
2006 7.93
2007 6.90
2008 6.22
2009 7.97
2010 11.42
2011 8.45
2012 9.85
2013 8.65
(Source: World Development Indicators Report)
4.2.4. Gross Savings (as a percentage of GDP) (GS)
Figures on savings presented in the Table 5, in the next page, were obtained from the World
Development Indicators Report. World Bank (2014) calculates gross savings as gross national
income less total consumption, plus net transfers. Gross savings as a percentage of GDP has
generally been on a declining trend since the country’s total consumption has been increasing
through the years.
24. 15
Table 5: Gross Savings (as % of GDP)
Year Gross Savings (as % of GDP)
2005 16.84
2006 16.01
2007 16.55
2008 13.79
2009 14.51
2010 13.27
2011 10.86
2012 11.21
2013 11.78
(Source: World Development Indicators Report)
4.2.5. External Debt (ED)
External debt was measured using external debt stocks. World Bank (2014) defines external debt
stock as total external debt owed to non-residents repayable in currency, goods, or services. Total
external debt is the sum of public, publicly guaranteed, and private nonguaranteed long-term debt,
use of IMF credit, and short-term debt. Short-term debt includes all debt having an original maturity
of one year or less and interest in arrears on long-term debt. The figures are presented in the Table
6 below.
Table 6: External Debt
Year Total External Debt Stocks (KES. ‘000)
2005 489,809,358
2006 481,670,421
2007 506,407,838
2008 526,242,737
2009 664,414,491
2010 697,343,249
2011 913,586,977
2012 997,942,996
2013 1,160,202,727
(Source: World Development Indicators Report)
4.2.6. Dependency Ratio (DR)
Dependency ratio was used to account for changes in the population make up. Dependency ratio is
the ratio of dependents (people younger than 18 or older than 60) to the working-age population
(those between ages 18-60). Data presented in Table 7, in the next page, are shown as the proportion
25. 16
of dependents per 100 working-age population. The age dependency ratio has been declining
through the years due increasing working age population and reduced fertility rates.
Table 7: Age Dependency Ratio
Year Age Dependency Ratio (% of working-age
population)
2005 84.03
2006 83.65
2007 83.33
2008 83.09
2009 82.89
2010 82.71
2011 82.47
2012 82.20
2013 81.86
(Source: World Development Indicators Report)
4.2.7. Age of Contributors (AGE)
Life expectancy of Kenya was used as a proxy for the variable of age. This was used due to the
difficulty of establishing the ages of the contributors to the NSSF. The life expectancy data are
presented in Table 8 below. When life expectancy is short, it is expected that contributions will be
less and this may affect the reforms to be made. Life expectancy has been generally increasing due
to improved healthcare, better access to education and technological advancements.
Table 8: Life Expectancy
Year Age (Years)
2005 54.70
2006 55.60
2007 56.59
2008 57.61
2009 58.62
2010 59.55
2011 60.37
2012 61.08
2013 61.68
(Source: World Development Indicators Report)
4.2.8. Contributions Growth (CGR)
Contributions variable was captured by the values in the audited financial statements of the NSSF.
The contributions growth was used as a proxy for the number of individuals joining/exiting the
fund. The values are presented in Table 9 in the next page. Contributions receivable growth has
26. 17
been fluctuating through the years with the highest and lowest values been recorded in 2007 and
2011 respectively. The NSSF had more people joining in 2007 thus the high contributions growth
rate.
Table 9: Contributions Growth
Year Contributions Receivable
(KES. ‘000)
Contributions Receivable
Growth (%)
2004 3,847,119
2005 4,267,576 10.93
2006 4,552,895 6.69
2007 5,445,691 19.61
2008 5,670,353 4.13
2009 6,317,984 11.42
2010 6,789,513 7.46
2011 6,838,451 0.72
2012 7,266,410 6.26
2013 7,800,358 7.35
(Source: NSSF Financial Statements)
4.3. Descriptive Analysis
This study was based on the NSSF fund value growth (FVG) as the dependent variable. The
independent variables were: pension debt (PD), central government debt as a percentage of GDP
(CGD), gross savings as a percentage of GDP (GS), external debt (ED), dependency ratio (DR),
life expectancy (AGE), and contributions growth rate (CGR). The data analysed was in relation to
the NSSF. Table 10 below provides the summary statistic for each variable of the study.
Table 10: Summary Statistics
FVG PD CGD GS ED DR Age CGR
Mean 0.11 2732521444.44 8.52 13.87 713068977207.50 82.92 58.42 0.08
Std. error 0.03 545878281.18 0.52 0.76 82824436230.18 0.23 0.82 0.02
Median 0.13 1745772000 8.45 13.79 664414490813.96 82.89 58.62 0.07
Std. Dev 0.10 1637634843.53 1.56 2.29 248473308690.55 0.69 2.47 0.05
Kurtosis 1.26 (0.24) 0.42 (1.62) (0.71) (0.63) (1.34) 2.10
Skewness (1.23) 1.10 0.44 0.00224 0.81 0.11 (0.20) 1.04
Range 0.31 4498903000 5.20 5.98 678532305297.27 2.17 6.99 0.19
Min (0.09) 1355228000 6.22 10.86 481670421446.01 81.86 54.70 0.01
Max 0.22 5854131000 11.42 16.84 1160202726743.28 84.03 61.68 0.20
(Source: Research Findings)
27. 18
4.4. Correlation Analysis
Table 11 below provides a summary of the correlation among the variables. As shown in Table 11,
there was strong positive correlation between: external debt and pension debt, r = 0.878;
dependency ratio and gross savings, r = 0.909; gross savings and contributions growth rate, r =
0.693; age and pension debt, r = 0.801; and between age and external debt, r = 0.926. The
relationship between external debt and pension debt, and age and external debt was spurious in that
there was no causation between the variables. Strong positive correlations between age and pension
debt, dependency ratio and gross savings, and gross savings and contributions growth rate were
expected. Increased contributions leads to increased savings, which also increases in line with
increasing dependency ratio. Increasing dependency ratio implies that the working age population
should set aside more in order to cater for the needs of the older and younger population.
Weak positive correlation was realized between fund value growth and external debt, r = 0.039,
implying that external debt does not affect the NSSF fund value growth rate; fund value growth
and gross savings, r = 0.071; and between fund value and dependency ratio, r = 0.066. Strong
negative correlation was realized between gross savings and pension debt, r = -0.853, implying that
there is reduced need for pensions when individuals save more on their own and also there is
reduced need for saving when individuals contribute more to pensions; gross savings and external
debt, r = -0.871, implying that there’s reduced need for external debt when the country saves more
and vice versa; dependency ratio and external debt, r = -0.929; age and gross savings, r = -0.936;
and between age and dependency ratio, r = -0.991.
Table 11: Correlation Matrix
FVG PD CRG ED GS DR Age CGD
FVG 1
PD -0.09854 1
CRG -0.07229 -0.48808 1
ED 0.039155 0.878568 -0.4144 1
GS 0.070769 -0.85252 0.693646 -0.8711 1
DR 0.065646 -0.78106 0.393678 -0.92999 0.909077 1
Age -0.08908 0.800874 -0.43885 0.92625 -0.93609 -0.99147 1
CGD 0.188962 0.405415 -0.18334 0.358805 -0.31032 -0.26373 0.3465 1
(Source: Research Findings)
4.5. Regression Analysis
Table 14 provides the results of the regression analysis with the NSSF fund value growth as the
dependent variable. The constant term was 205.60370 which was significant, t = 5.24108, p < 0.15.
The coefficient of pension debt (PD) was 0.00000, which was significant, t = -5.20212, p < 0.15.
28. 19
The coefficient of contributions growth rate (CRG) was not significant, t = 3.94503, p > 0.15. The
coefficient of external debt (EDS) was also not significant, t = 3.58094, p > 0.15. The coefficient
of gross savings (GS) was significant, t = -4.89803, p < 0.15. The coefficient of age dependency
ratio (DR) was significant, t = -4.98426, p < 0.15. The coefficient of life expectancy (Age) was
significant, t = -5.70185, p < 0.15. Finally, the coefficient of central government debt (CGD) was
significant, t = 5.67418, p < 0.15.
Figures provided in Table 12 and Table 13 show that the whole regression was not statistically
significant and the variation in pension debt, contributions growth rate, external debt, gross savings,
age dependency ratio, life expectancy and central government debt weakly explains the variation
in the NSSF fund value growth, F = 6.379044, p > 0.15, and 𝑅2
= 0.9781.
Table 12: Regression Statistics
Multiple R 0.988987251
R Square 0.978095783
Adjusted R Square 0.824766261
Standard Error 0.041364021
Observations 9
(Source: Research findings)
Table 13: Anova
Df SS MS F Significance
F
Regression 7 0.076401016 0.010914 6.379044 0.296055207
Residual 1 0.001710982 0.001711
Total 8 0.078111999
(Source: Research findings)
Table 14: Summary Output
Variable Coefficients Std. Error t-statistic p-value
Intercept 205.60370 39.22928 5.24108 0.12002
PD 0.00000 0.00000 -5.20212 0.12090
CRG 4.60815 1.16809 3.94503 0.15804
ED 0.00000 0.00000 3.58094 0.17336
GS -0.46170 0.09426 -4.89803 0.12821
DR -1.80589 0.36232 -4.98426 0.12605
Age -0.87211 0.15295 -5.70185 0.11053
CGD 0.13000 0.02291 5.67418 0.11106
(Source: Research findings)
29. 20
The regression model was found to be:
𝐹𝑉𝐺 = 205.60370 + 0.000000(𝑃𝐷) + 4.60815(𝐶𝑅𝐺)
+ 0.0000(𝐸𝐷) – 0.46170(𝐺𝑆) – 1.80589(𝐷𝑅) – 0.87211(𝐴𝐺𝐸)
+ 0.13000(𝐶𝐺𝐷)
Which simplifies to:
𝐹𝑉𝐺 = 205.60370 + 4.60815(𝐶𝑅𝐺) – 0.46170(𝐺𝑆) – 1.80589(𝐷𝑅) – 0.87211(𝐴𝐺𝐸)
+ 0.13000(𝐶𝐺𝐷)
With FVG as fund value growth rate which was a proxy for reform under the assumption that a
reform results in a significant change in fund value growth rate, PD as pension debt, CRG as
contributions growth rate, ED as external debt, GS as gross savings, DR as age dependency ratio,
AGE as life expectancy and CGD as central government debt.
4.6. Summary and Interpretation of Findings
The findings of the regression analysis indicate a significant relationship exists between pension
debt, gross savings, dependency ratio, life expectancy, central government debt on one side and
the NSSF fund value growth on the other side. The results also indicate a weak relationship between
contributions growth rate and external debt, and the NSSF fund value growth.
Results of demographic variables, age dependency ratio and life expectancy, are in line with initial
expectations that an aging population is bound to influence the pension reform decision. These
results of demographic variables confirm the findings of World Bank (1994) and Brooks (2005)
that attributed pension system reforms to demographic factors like aging and increasing age
dependency ratio. Brooks (2005) argued that there is a higher probability of undertaking a pension
reform when dependency ratio increases. Increasing dependency ratio implies that there are more
retirees and also more people in the society moving closer to retirement, resulting to pension
schemes having liabilities that will fall due within a short duration. The short-term liabilities
significantly affect pension schemes’ liquidity and thus reforms are necessary to guarantee the
schemes’ solvency.
Results of economic variables are also in line with initial expectations. Increasing pension debt and
central government debt imply that the country in under increasing pressure to undertake pension
reform in order to have a larger pool of funds to try and minimize borrowing. This result opposes
Brooks’ argument in her 2002 paper that debt has a negative correlation with decision to reform
30. 21
national social security systems. According to Brooks (2002), governments that are significantly
indebted are unable to finance the transitional costs that occur with pension reform.
External debt had no influence on pension reform, and this result was quite surprising. Initially, it
was expected that increasing external debt would influence pension reform since the country would
be exposed to international pressures. The result was however consistent with results obtained by
Mudrazja (2006) when he performed an analysis across 95 countries and concluded that external
debt had no influence on pension reform in any of the countries in the study.
31. 22
CHAPTER FIVE
SUMMARY, CONCLUSIONS AND RECOMMENDATIONS
5.1. Summary
Public pension system reform has become one of most important economic and political issues in
recent years. Consequently, this has spurred interest of policy analyst who have tried to evaluate
different reform proposals as well as to determine factors contributing to the pension reform.
Building on their analysis, this study focused on examining the following question: what factors
are relevant for the decision to undertake pension system reform in Kenya?
In order to answer the question, the study examined different economic, political and demographic
factors, and evaluated their contribution to the pension reform decision. Data was collected for nine
years beginning 2005 and ending 2013. Correlation analysis was done to find out co-movements
among the variables. Regression analysis was done by analyzing how the three factors affect the
decision to undertake pension system reform. Other than the regression model, statistics like t-
tests, F-tests and the co-efficient of determination were used to find out the strength of the
regression analysis model.
The regression results found that there was a significant relationship between economic and
demographic variables and the decision to undertake pension reform. The co-efficient of pension
debt, central government debt, gross savings as a percentage of GDP, age dependency ratio and
life expectancy were statistically significant indicating that they all affected the decision to
undertake pension reform. Co-efficient of contributions growth rate and external debt were on the
other hand not statistically significant. The whole regression model was not statistically significant
basing on the F-test which showed that the p-value of the regression was larger than the critical
level. The variation in the independent variable poorly explained the variation in the NSSF fund
value growth, implying that more variables could be considered.
5.2. Conclusions
From the findings of this research, the following conclusion are made. First, the relationship
between the decision to undertake pension reform and external debt was not statistically significant.
This means that external borrowing does not really influence or affect the decision to undertake
pension system reform in Kenya. However there are many other political factors, which are
difficult to quantify, that can affect the decision to undertake pension system reform.
32. 23
Second, there was a significant relationship between demographic variables and the decision to
undertake pension system reform. This leads to the conclusion that the change in population make-
up can trigger a public pension system reform. This is true since the Kenyan government changed
the retirement age from 55 to 60, due to improving life expectancy, in order for individuals to work
longer and contribute more to pension schemes.
Third, there was also a significant relationship between economic variables and the decision to
undertake public pension system reform. The level of central government debt and pension debt to
some extent indicate the level and limits of the government to finance a pension system reform.
Finally, the whole regression analysis was not statistically significant indicating that there are other
factors, other than those investigated in this research that seem to affect the decision of a pension
system reform.
5.3. Policy Recommendations
Based on the findings of this study, the following recommendations arise. First, the NSSF needs to
put contributions of pensioners to more productive investments other than just keeping the funds
safely for the pensioners. The irresponsiveness of the fund value growth to pension contribution
growth could indicate that the funds do not contribute to growth of the total fund value. Reforms
should be effected to allow better investment of pension contributions to generate higher returns
and boost fund value growth.
Secondly, there is need to check on pension debt and central government debt as they affect the
fund value growth and the decision to undertake a pension system reform. Policies should be put
in place limiting pension debt and encouraging effective asset-liability matching to generally
minimize the need for a system reform. Kenya should not constantly reform its pension system due
to increasing pension debt, instead it should come up with effective strategies to manage debt and
other risks associated with pension schemes.
Thirdly, the government should come up with effective policies that would help reduce the age
dependency ratio. For example, the government can promote agriculture and entrepreneurship
among the elderly in the society to assist them have a source of income. Such an initiative can in
the long run reduce the need for government benefits and this can minimize strain on the NSSF.
33. 24
5.4. Limitations of the Study
This study has various limitations. First, the study covered a few years, precisely only nine years.
The findings may not be elaborate enough and applicable in the future. The results given by this
study are therefore limited to the nine years of the data collected.
Secondly, the study did not show if a causal relationship exists between the dependent variable and
the independent variables. The study only indicated if the relationship between variables is positive
or negative and if the relationship was significant. A causality test can be performed to establish
which variables causes another and this can help draw more relevant conclusions of the study.
Finally, the study only focused on Kenya. Results can be stronger and of higher utility if the study
considered other countries, for example countries in East African region. An East African study
can be more useful than a Kenyan study since more relationships and trends can be establish.
5.5. Suggestions for Further Research
The findings of this study can be improved if the study is expanded to cover a longer period of
time and the forecasted into the future. Further research can be carried out on the same topic but
using data across a longer period of time, with the assumption that more data will provide better
results.
The study can also be expanded to cover more countries with the aim of determining whether there
is a causal relationship between the dependent variable and the independent variables in the various
countries. This will help generate generalized results and also determine key determinants of
pension reform that cut across all countries.
34. 25
REFERENCES
Awino, M. O. (2013). Determinants of Performance of Pension Funds in Kenya. Nairobi.
Baroni, E. (2007). Pension Systems and Pension Reform in an Aging Society.
Boeri, T. (2003). Social Policy Models in Transition: Why are they so different from one another? Washington:
World Bank.
Brooks, S. (2002). Social Protection and Economic Integration: The Politics of Pension Reform in an Era of
Capital Mobility. Comparative Political Studies, 491-523.
Brooks, S. (2005). Interdependent and Domestic Foundations of Policy Change: The Diffusion of Pension
Privatization Around the World. International Studies Quarterly, 49, 273-294.
Casey. (2009). Pensions in Nigeria: The Perfomance of New System of Personal Accounts. Geneva.
Davis, E. (1995). "Pension Funds, Retirement-Income Security and Capital Markets, on International
Perspective". Oxford University Press.
Feldstein, M. (1998). Privatizing Social Security. Chicago: The University of Chicago Press.
Galasso, V., & Profeta, P. (2003). Lessons for an Aging Society: the Political Sustainability of Social Security
Systems. Milano: Innocenzo Gasparini Institute for Economic Research.
Gregorio, I., & Ian, T. (2009). How the Financial Crisis Affects Pensions and Insurance and Why the Impacts
Matter. IMF.
ILO. (2006). Report to the Government: Actuarial Assessment of NSIFT. Geneva.
James, E., & Brooks, S. (2001). The Political Economy of Structural Pension Reform. Washington: World Bank.
Kay, S. J. (1999). Unexpected Privatizations: Politics and Social Security Reform in the Southern Cone.
Comparative Politics, 403-422.
Kenya National Bureau of Statistics. (2015). Economic Survey 2015. Nairobi: Government of Kenya.
Kothari, C. (2004). Research methodology, methods and techniques (2nd Ed). New Delhi: K K Gupta.
Lindbeck, A., & Persson, M. (2003). The Gains from Pension Reform. Journal of Economic Literature, 41.
Madrid, R. L. (2002). The Politics and Economics of Pension Privatization in Latin America. Latin American
Research Review, 159-182.
Meng, A., & Pfau, W. (2010). The Role of Pension Funds in Capital Market.
Mesa-Lago, C. (2001). Structural reform of social security pensions in Latin America. International Social
Security Review, 67-92.
Mesa-Lago, C., & Muller, K. (2002). The Politics of Pension Reform in Latin America. Journal of Latin
American Studies, 687-715.
Mudrazja, S. (2006). Assessing Pension System Reform: Theory and Empirical Evidence. Washington DC:
Georgetown University.
Mugenda, O., & Mugenda, A. (2003). Research Methods: Quantitative and Qualitative Approaches. Nairobi:
Acts Press.
Odundo, E. (2003). Public Pension Fund Management.
Olukuru, J., & Masinde, V. (2014). Impacts of Pension Reforms on the Kenyan Pension Industry. European
Scientific Journal, 63-78.
35. 26
Orenstein, M. A. (2003). Mapping the Diffusion of Pension Innovation in Pension Reform in Europe.
Washington: World Bank.
Retirement Benefits Authority. (2014). Registered Pension Funds in Kenya. Nairobi: RBA.
Riesco, I. A. (2009). Development Welfare State and Social Change in Chile. UK: Houndmills.
Scharpf, F. (2000). The viability of advanced welfare states in the international economy: vulnerabilities and
options. Journal of European Public Policy, 7(2), 190-228.
Simmons, B., & Elkins, Z. (2004). The Globalization of Liberalization: Policy Diffusion in the International
Political Economy. American Political Science Review, 98, 171-189.
Taylor-Gooby, P. (2005). Ageing and Pension Reforms around the World-UK Pension Reform. Edward Elgar
Publishing Limited.
United Nations. (2013). World Population Prospects: The 2012 Revision. New York: Department of Economic
and Social Affairs, Population Division.
Vanderstoep, S. W., & Johnston, D. D. (2009). Research Methods for everyday life: blending qualitative and
quantitative approaches. San Fransisco: Jossey-Bass.
Weyland, K. (1998). The Political Fate of Market Reform in Latin America, Africa and East Europe.
International Studies Quarterly, 42, 645-673.
World Bank. (1994). Averting the Old Age Crisis: Policies to Protect the Old and Promote Growth. Washington:
World Bank and Oxford University Press.
World Bank. (2014). World Development Indicators. World Bank.