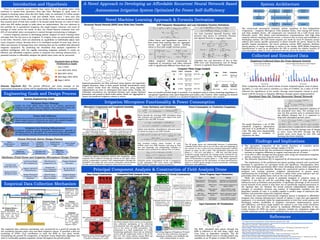
● The micropiece component of the system functions at complete power
self-sufficiency at an excess wattage margin of 25.8%
● Empirical data found that the autonomous irrigation system operates at a 68.8%
increase in irrigation efficiency in organic crop mass per mL of water.
● From 10% to 90% through the first growth cycle using the autonomous irrigation
system, irrigation error drops by over 43%
● The Alternate Hypothesis (H1
) is supported by all theoretical and empirical data
The implications of the performed and patent-pending research and constructed
prototype in agriculture are extremely broad and significant. Demographics show
that water shortages particularly affect warm developing nations where agricultural
irrigation is at its most primitive. Because the constructed system is designed to
integrate into existing primitive irrigation infrastructure in poorer areas,
implementing the technology is not limited to solely richer areas anymore and can
potentially solve the global water crisis at the root of its problems.
While the constructed system is primarily designed to conserve water in
irrigation, it can also be used for controlling usage volumes of other agricultural
substances such as fertilizers and pesticides. A significant advantage of the recurrent
neural network of the system is that there are no specifically required parameters in
the inputted data set. Because the neural network independently isolates the
strength of correlation between any number of independent variables and the
dependent variable of color, it is readily capable to predict usage of substances like
fertilizer and pesticides along with irrigation volume.
Because the constructed autonomous irrigation system is designed to affordably
integrate into existing infrastructure instead of replace it with new and expensive
equipment, it is extremely viable for implementation in both first world nations and
developing nations. Scalability in irrigation micropiece implementation, power
self-sufficiency, and drone range enables the system to not only avoid restrictions
based on farm size, but also operate at maximum efficiency regardless of size.
Lastly, because the RNN can accept a dynamic variable set, equipment usage and
variable collection can be tailored to individual farm and environmental needs.
Cluster Pixels Properties
23.52% (62,99,52)
ΔE = 3.8
Initial
HSV
Adjusted
Brightness
Final HSV
Adjusted
109 43 39 -44.2 109 43 30
Cluster Pixels Properties HSV
1.52% (81,110,61)
ΔE = 3.8
89 41 66
22.00% (40,62,35)
ΔE = 2.3
111 43 37
43.52% (29,32,32)
ΔE = 0.4
133 6 13
14.96% (69,69,69)
ΔE = 1.4
182 5 28
There is no necessity more valuable than water, but as the global water crisis
continues to spread from American cities like Flint, Michigan to small towns in
Uganda to booming Asian cities like New Delhi, India, an estimated 2.8 billion people
are prevented from accessing a safe and reliable water source. I have seen this
problem first-hand in India, where all of my family is from, and was shocked to find
that massive plots of land were unable to be farmed solely because of a lack of water
while over 190 million people in India alone are malnourished. The true solutions to
this problem lie in agricultural irrigation, the single largest consumer and cause of
wastage of water across the world. In fact, the United Nations estimates that over
42% of total global water consumption is wasted through overwatering or leakages.
Current irrigation systems in developing nations compose of water-carrying tubes
and pipes that line the area to be irrigated. To irrigate, holes are systematically made
in the tubes. However, there are absolutely no capabilities to individually adjust each
crop’s irrigation volume. Because there is no intelligent analysis of each crop, there is
often vast amounts of wastage from over-watering that can be rectified with advanced
irrigation equipment. By combining the boundless data analysis capabilities of
artificial intelligence with the rapidly innovating irrigation methods to create an
efficient and affordable irrigation system to integrate into existing infrastructure, a
potential solution to affordably mitigate the global water crisis can be uncovered.
Alternate Hypothesis (H1
): The growth efficiency and water wastage of the
constructed autonomous system will be significantly different from current methods.
A Novel Approach to Developing an Affordable Recurrent Neural Network Based
Autonomous Irrigation System Optimized for Power Self-Sufficiency
Introduction and Hypothesis
Engineering Goals and Design Process
Novel Machine Learning Approach & Formula Derivation
System Architecture
Collected and Simulated Data
Findings and Implications
References
Principal Component Analysis & Construction of Field Analysis Drone
Empirical Data Collection Mechanism
Irrigation Micropiece Functionality & Power ConsumptionMinimize Water Wastage
Amidst the worst global water crisis in our history, agricultural
irrigation is the largest source of irrigation. The constructed system will
be designed to minimize wastage without sacrificing efficiency.
Power Self-Sufficient
Because the constructed system will be designed for developing nations
where reliable sources of electricity are scarce, the scalable micropiece
portion must operate at complete power self-sufficiency.
Integrate into Existing Infrastructure
Completely replacing existing agricultural infrastructure, especially in
developing nations, is impractical. The constructed system will integrate
into and enhance existing infrastructure for maximum affordability.
Derive
Mathematical
Formula
Integrate
Neural Net
Algorithms
Program AI
Algorithms
Accept Server
Requests via
LAN
Aggregate
Output For
Return
Calculate and
Optimize Loss
Regularize
Inputted Data
When comparing the data of total volume of water irrigated/organic mass of plants
(g/mML), a t-test was used to calculate a p-value of 0.00013. An a-value of 0.05
reflected the significance of the results. Average mass/irrigation volume in g/mL
shows a 68.8% increase in irrigation efficiency through system implementation.
“13.7: Electric Generators and Back Emf.” Physics LibreTexts, Libretexts, 18 Nov. 2019.
https://phys.libretexts.org/Bookshelves/University_Physics/Book%3A University Physics (OpenStax)/Map%3A University Physics
“Agriculture at a Crossroads.” Global Agriculture, 2019.
https://www.globalagriculture.org/report-topics/water.html
Dormido, Hannah. “These Countries Are the Most at Risk From a Water Crisis.” Bloomberg.com, Bloomberg, 6 Aug. 2019.
https://www.bloomberg.com/graphics/2019-countries-facing-water-crisis/
Karpathy, Andrej. The Unreasonable Effectiveness of Recurrent Neural Networks. 21 May 2015.
https://karpathy.github.io/2015/05/21/rnn-effectiveness/
“Multispectral Imaging Flies High to Help Boost Crop Yields.” Physics World, MicaSense, 20 Aug. 2019.
https://physicsworld.com/a/multispectral-imaging-flies-high-to-help-boost-crop-yields/
Patterson, Dan, and Anisha Nandi. “5G Explained: How It Works, Who It Will Impact, and When We'll Have It.” CBS News, 21 Feb. 2019.
https://www.cbsnews.com/news/5g-explained-how-it-works-who-it-will-impact-and-when-well-have-it/
f(x) is the exponential regression equation of
the simulated error data. The average error
over the first growth cycle is calculated from
the definite integral, but it is expected to
drop with subsequent growth cycles.
f’(x) is used to find the average rate of change
in error. From 10%-90% through the first
growth cycle, error drops by over 43% and
learning rate slows similarly.
The graph illustrates a set of 200
simulated irrigation adjustments
and error % in predicted vs. future
color. The data were exponentially
regressed with a trendline to
regularize the data.
Return Result
to Sender
Construct and
Solder Base Drone
Design and Print
Micropiece Shell
Support LAN Wi-Fi
Communication
Develop Full
Cross-Component
Communication
Load Linux-Based
OS to Raspberry Pi
Program Hardware
Data Input
Wire Electrical
Components to Pi
Design Waterproof
Connection to Flux
Generator
Program Request
Parse to Irrigation
Adjustment
Wire DC Servo
Motor to Arduino
Nano Controller
System Engineering Goals
Neural Network Server Design Process
Hardware (Field Drone and Irrigation Micropiece) Design Process
Set Up LAN For
Requests By IP
Makeblock Orion
Communicate with
computer to send
sensor data input
and give hardware
instructions.
Camera
Capture images for
computer analysis
for HSV color data
input of plant.
Computer
Connected via USB
cable. Responsible
for data analysis
and AI algorithms
to convert plant
color to suggested
irrigation volume.
Peristaltic Pump
Receive irrigation
information from
Orion board and
pump exact water
volume over plant.
DC Stepper Motor +
Power Driver
Receive instructions with
plant location. Rotate on
step count over plant
taking 12V input from
Makeblock Orion board.
The empirical data collection mechanism was constructed as a proof-of-concept for
the correlation between plant color and ideal irrigation volume. It provided a data set
consisting of 2700+ (x,y) coordinates to train the RNN on true plant trends,
streamlining the process for integration. A Dynamic Linear Regression algorithm was
used to continually optimize irrigation volume throughout the growth period.
Empirical Collected Data Set From Spinach Growth
Simulated Data Set Testing Recurrent Neural Network
SQL Database
Neural
Network
User Sensors
RFID Reader
DC Servo
Motor
Field Drone
User iOS
Device
Irrigation
Micropiece
Server
Localhost IP
Worldwide Ratio of Water
Withdrawals to Supply
Low (<10%)
Low-Mid (10%-20%)
Mid (20%-40%)
Mid-High (40%-80%)
High (>80%)
The constructed autonomous irrigation system comprises of four independent
components - Irrigation Micropiece, Field Analysis Drone, User-Facing iOS Device,
and Data Analysis Server. All components are connected via a LAN (Local Area
Network) router. This allows near-instantaneous communication with high data
capacity without requiring internet access, a resource that is scarce and unreliable in
developing nations. All LAN based requests are made by local IP (internet proxy)
address and contain specific parameters to direct towards the server. Based on the
specific request parameters, the server performs various RNN analysis, database
search queries, or image encodings to return to the sender. RFID (Radio Frequency
Identification) is used as an alternative for GPS to provide the relative location of
each micropiece, which is cross-referenced with the server for absolute location.
Local Area Network Router
Utilize linear and logarithmic regression to
find trends from existing data set, aggregate
trends, and logistically regress resulting
values to find node weight between points.
Adjust empirical volume proportional to
magnitude of correlation only when collected
color is significantly different than ideal color.
Use tanh (rescaled sigmoid) function with
previous data points as activation function
and sigmoid function to aggregate output.
Calculate loss and derivative of loss to find
RNN error and instantaneous rate of change
of error to optimize future RNN iterations.
Inputted parameters are first activated using logistic and hyperbolic
tangent functions. Data is then passed through intermediate nodes
that extract trends from the existing data sets using regression
regularization en route to subsequent data input nodes. Finally, the
individual correlations are calculated between each unique inputted
parameter and passed to final nodes nodes, which are aggregated to
output the predicted irrigation volume to return.
Once an base64 encoded image is received, it is analyzed using k-means clustering algorithms to
extrapolate significant intra-pixel disparities and isolate color clusters. After isolating the desired
color, it is adjusted to conform to a standard brightness for consistent color analysis.
Recurrent Neural Network (RNN) Inter-Node Data Transfer RNN Parameter Manipulation and Loss Calculation Function Derivations
Computer Vision Image Analysis
Input Source Purpose
Photoresistance
(RNN Param.)
Photoresistor +
1μF Capacitor
Translate to environmental
light and color adjustments
Temperature
(RNN Param.)
DHT11 Temp
Sensor
Track outside temperature in
degrees Celsius
Image
(RNN Param.)
720p Logitech
Webcam
Send as B64 for image
analysis to extract color
RFID Tag
(Location Param.)
MFRC522 RFID
Reader
Receive micropiece unique
ID as ASCII for location
Relative XY
Location
LAN Request
Over Server
Convert RFID to relative
location for movement
High-capacity motor
controllers to regulate
AC current to motors
MT2204 Brushless
motors responsible
for high speed flight
Motors and motor
controllers soldered
together at 3 joints
Power regulation
board to supply
current to motors
PRB soldered to motors at 2 joints (+ and -
side) along with +/- clip for battery
connection. Responsible for full flight.
PRB/Motor circuit attached to carbon fiber
drone frame. Base for F3 6DOF Flight
Controller and Raspberry Pi circuits.
Base Drone Construction Completed Field Analysis Drone Raspberry Pi Circuit Construction Drone Program Input Parameters
Input Parameters 4D Visualization
The 850+ simulated data points through the
RNN is reflected in 4D with Heat, Light, and
Crop Color as dependent variables. The 4D
visualization allows users to visually project any
variables on an XY plane to isolate 2D trends.
Raspberry Pi used as
central data processor for
circuit, drone movement,
and LAN communication
Individual electric circuit of
DHT11 Temperature Sensor
to update variable for server
Individual electric circuit
of Photoresistor + 1μF
Capacitor to map to
environmental light
Individual electric circuit of
MFRC522 RFID reader to
scan micropiece RFID for
relative drone location
Full wiring diagram of Raspberry Pi based
circuit for data collection of program
dependent variables, user feedback and
LAN communication to server.
The Field Analysis Drone serves as the primary
data collection mechanism of by collecting
environmental and crop specific data points to
feed to the server as RNN parameters. The
mechanism is a dual combination of a fully
functioning quadcopter drone and an electrical
circuit with all components wired to the Pi for
data I/O. The drone utilizes unique RFID tag
that maps to a relative location coordinate.
The 3D graph shows the relationship between 2 independent
variables (water flow rate in m/s on the x-axis and amperage of
the current on the y-axis) and the resulting dependent variable
(power in watts on the z-axis). The intersection between red
plane x = 1.52 m/s, teal plane y = 220 mA, and blue power
production graph represents the average power induced by the
axial magnetic flux of the turbine. The linear distance from this
point of intersection to green plane z = 4.38 watts represents
the power consumer by the micropiece. At these specifications,
there is a 25.8% excess margin in power production, indicating
full power-self-sufficiency.
Power Consumption vs. Production ComparisonPower Derivation and Calculation
Derive formula for necessary EMF calculation using
only collected and accessible term inputs from base
magnetic flux and EMF formulas.
Collect and calculate circumference and area terms
of turbine for plug-in into EMF formula.
Plug standard turbine values (number of coils,
B-field, area) into EMF function and plug in flow
rate and amperage into independent variables to
calculate power produced by induced flux of turbine.
Calculate power consumption of the 2 components
in the micropiece (DC servo motor and ESP8226
WiFi module). Compare to power production.
Micropiece Components and Completed Assembly
Full wiring diagram of the Arduino
Nano based circuit for the
micropiece. A NodeMCU board was
used for the built in ESP8226 module.
3D modeling (STL) file of printed
components. Components are used
to protect turbine and allow for
water flow regulated by circuit.
Completed irrigation micropiece without tube integration. Axial
magnetic flux is induced through the turbine on the right, where
current is generated to power LAN communication through the
NodeMCU and adjust the servo motor orientation, which allows
for full control of dynamic irrigation volume from the server.

Research Poster

  • 1.
    ● The micropiececomponent of the system functions at complete power self-sufficiency at an excess wattage margin of 25.8% ● Empirical data found that the autonomous irrigation system operates at a 68.8% increase in irrigation efficiency in organic crop mass per mL of water. ● From 10% to 90% through the first growth cycle using the autonomous irrigation system, irrigation error drops by over 43% ● The Alternate Hypothesis (H1 ) is supported by all theoretical and empirical data The implications of the performed and patent-pending research and constructed prototype in agriculture are extremely broad and significant. Demographics show that water shortages particularly affect warm developing nations where agricultural irrigation is at its most primitive. Because the constructed system is designed to integrate into existing primitive irrigation infrastructure in poorer areas, implementing the technology is not limited to solely richer areas anymore and can potentially solve the global water crisis at the root of its problems. While the constructed system is primarily designed to conserve water in irrigation, it can also be used for controlling usage volumes of other agricultural substances such as fertilizers and pesticides. A significant advantage of the recurrent neural network of the system is that there are no specifically required parameters in the inputted data set. Because the neural network independently isolates the strength of correlation between any number of independent variables and the dependent variable of color, it is readily capable to predict usage of substances like fertilizer and pesticides along with irrigation volume. Because the constructed autonomous irrigation system is designed to affordably integrate into existing infrastructure instead of replace it with new and expensive equipment, it is extremely viable for implementation in both first world nations and developing nations. Scalability in irrigation micropiece implementation, power self-sufficiency, and drone range enables the system to not only avoid restrictions based on farm size, but also operate at maximum efficiency regardless of size. Lastly, because the RNN can accept a dynamic variable set, equipment usage and variable collection can be tailored to individual farm and environmental needs. Cluster Pixels Properties 23.52% (62,99,52) ΔE = 3.8 Initial HSV Adjusted Brightness Final HSV Adjusted 109 43 39 -44.2 109 43 30 Cluster Pixels Properties HSV 1.52% (81,110,61) ΔE = 3.8 89 41 66 22.00% (40,62,35) ΔE = 2.3 111 43 37 43.52% (29,32,32) ΔE = 0.4 133 6 13 14.96% (69,69,69) ΔE = 1.4 182 5 28 There is no necessity more valuable than water, but as the global water crisis continues to spread from American cities like Flint, Michigan to small towns in Uganda to booming Asian cities like New Delhi, India, an estimated 2.8 billion people are prevented from accessing a safe and reliable water source. I have seen this problem first-hand in India, where all of my family is from, and was shocked to find that massive plots of land were unable to be farmed solely because of a lack of water while over 190 million people in India alone are malnourished. The true solutions to this problem lie in agricultural irrigation, the single largest consumer and cause of wastage of water across the world. In fact, the United Nations estimates that over 42% of total global water consumption is wasted through overwatering or leakages. Current irrigation systems in developing nations compose of water-carrying tubes and pipes that line the area to be irrigated. To irrigate, holes are systematically made in the tubes. However, there are absolutely no capabilities to individually adjust each crop’s irrigation volume. Because there is no intelligent analysis of each crop, there is often vast amounts of wastage from over-watering that can be rectified with advanced irrigation equipment. By combining the boundless data analysis capabilities of artificial intelligence with the rapidly innovating irrigation methods to create an efficient and affordable irrigation system to integrate into existing infrastructure, a potential solution to affordably mitigate the global water crisis can be uncovered. Alternate Hypothesis (H1 ): The growth efficiency and water wastage of the constructed autonomous system will be significantly different from current methods. A Novel Approach to Developing an Affordable Recurrent Neural Network Based Autonomous Irrigation System Optimized for Power Self-Sufficiency Introduction and Hypothesis Engineering Goals and Design Process Novel Machine Learning Approach & Formula Derivation System Architecture Collected and Simulated Data Findings and Implications References Principal Component Analysis & Construction of Field Analysis Drone Empirical Data Collection Mechanism Irrigation Micropiece Functionality & Power ConsumptionMinimize Water Wastage Amidst the worst global water crisis in our history, agricultural irrigation is the largest source of irrigation. The constructed system will be designed to minimize wastage without sacrificing efficiency. Power Self-Sufficient Because the constructed system will be designed for developing nations where reliable sources of electricity are scarce, the scalable micropiece portion must operate at complete power self-sufficiency. Integrate into Existing Infrastructure Completely replacing existing agricultural infrastructure, especially in developing nations, is impractical. The constructed system will integrate into and enhance existing infrastructure for maximum affordability. Derive Mathematical Formula Integrate Neural Net Algorithms Program AI Algorithms Accept Server Requests via LAN Aggregate Output For Return Calculate and Optimize Loss Regularize Inputted Data When comparing the data of total volume of water irrigated/organic mass of plants (g/mML), a t-test was used to calculate a p-value of 0.00013. An a-value of 0.05 reflected the significance of the results. Average mass/irrigation volume in g/mL shows a 68.8% increase in irrigation efficiency through system implementation. “13.7: Electric Generators and Back Emf.” Physics LibreTexts, Libretexts, 18 Nov. 2019. https://phys.libretexts.org/Bookshelves/University_Physics/Book%3A University Physics (OpenStax)/Map%3A University Physics “Agriculture at a Crossroads.” Global Agriculture, 2019. https://www.globalagriculture.org/report-topics/water.html Dormido, Hannah. “These Countries Are the Most at Risk From a Water Crisis.” Bloomberg.com, Bloomberg, 6 Aug. 2019. https://www.bloomberg.com/graphics/2019-countries-facing-water-crisis/ Karpathy, Andrej. The Unreasonable Effectiveness of Recurrent Neural Networks. 21 May 2015. https://karpathy.github.io/2015/05/21/rnn-effectiveness/ “Multispectral Imaging Flies High to Help Boost Crop Yields.” Physics World, MicaSense, 20 Aug. 2019. https://physicsworld.com/a/multispectral-imaging-flies-high-to-help-boost-crop-yields/ Patterson, Dan, and Anisha Nandi. “5G Explained: How It Works, Who It Will Impact, and When We'll Have It.” CBS News, 21 Feb. 2019. https://www.cbsnews.com/news/5g-explained-how-it-works-who-it-will-impact-and-when-well-have-it/ f(x) is the exponential regression equation of the simulated error data. The average error over the first growth cycle is calculated from the definite integral, but it is expected to drop with subsequent growth cycles. f’(x) is used to find the average rate of change in error. From 10%-90% through the first growth cycle, error drops by over 43% and learning rate slows similarly. The graph illustrates a set of 200 simulated irrigation adjustments and error % in predicted vs. future color. The data were exponentially regressed with a trendline to regularize the data. Return Result to Sender Construct and Solder Base Drone Design and Print Micropiece Shell Support LAN Wi-Fi Communication Develop Full Cross-Component Communication Load Linux-Based OS to Raspberry Pi Program Hardware Data Input Wire Electrical Components to Pi Design Waterproof Connection to Flux Generator Program Request Parse to Irrigation Adjustment Wire DC Servo Motor to Arduino Nano Controller System Engineering Goals Neural Network Server Design Process Hardware (Field Drone and Irrigation Micropiece) Design Process Set Up LAN For Requests By IP Makeblock Orion Communicate with computer to send sensor data input and give hardware instructions. Camera Capture images for computer analysis for HSV color data input of plant. Computer Connected via USB cable. Responsible for data analysis and AI algorithms to convert plant color to suggested irrigation volume. Peristaltic Pump Receive irrigation information from Orion board and pump exact water volume over plant. DC Stepper Motor + Power Driver Receive instructions with plant location. Rotate on step count over plant taking 12V input from Makeblock Orion board. The empirical data collection mechanism was constructed as a proof-of-concept for the correlation between plant color and ideal irrigation volume. It provided a data set consisting of 2700+ (x,y) coordinates to train the RNN on true plant trends, streamlining the process for integration. A Dynamic Linear Regression algorithm was used to continually optimize irrigation volume throughout the growth period. Empirical Collected Data Set From Spinach Growth Simulated Data Set Testing Recurrent Neural Network SQL Database Neural Network User Sensors RFID Reader DC Servo Motor Field Drone User iOS Device Irrigation Micropiece Server Localhost IP Worldwide Ratio of Water Withdrawals to Supply Low (<10%) Low-Mid (10%-20%) Mid (20%-40%) Mid-High (40%-80%) High (>80%) The constructed autonomous irrigation system comprises of four independent components - Irrigation Micropiece, Field Analysis Drone, User-Facing iOS Device, and Data Analysis Server. All components are connected via a LAN (Local Area Network) router. This allows near-instantaneous communication with high data capacity without requiring internet access, a resource that is scarce and unreliable in developing nations. All LAN based requests are made by local IP (internet proxy) address and contain specific parameters to direct towards the server. Based on the specific request parameters, the server performs various RNN analysis, database search queries, or image encodings to return to the sender. RFID (Radio Frequency Identification) is used as an alternative for GPS to provide the relative location of each micropiece, which is cross-referenced with the server for absolute location. Local Area Network Router Utilize linear and logarithmic regression to find trends from existing data set, aggregate trends, and logistically regress resulting values to find node weight between points. Adjust empirical volume proportional to magnitude of correlation only when collected color is significantly different than ideal color. Use tanh (rescaled sigmoid) function with previous data points as activation function and sigmoid function to aggregate output. Calculate loss and derivative of loss to find RNN error and instantaneous rate of change of error to optimize future RNN iterations. Inputted parameters are first activated using logistic and hyperbolic tangent functions. Data is then passed through intermediate nodes that extract trends from the existing data sets using regression regularization en route to subsequent data input nodes. Finally, the individual correlations are calculated between each unique inputted parameter and passed to final nodes nodes, which are aggregated to output the predicted irrigation volume to return. Once an base64 encoded image is received, it is analyzed using k-means clustering algorithms to extrapolate significant intra-pixel disparities and isolate color clusters. After isolating the desired color, it is adjusted to conform to a standard brightness for consistent color analysis. Recurrent Neural Network (RNN) Inter-Node Data Transfer RNN Parameter Manipulation and Loss Calculation Function Derivations Computer Vision Image Analysis Input Source Purpose Photoresistance (RNN Param.) Photoresistor + 1μF Capacitor Translate to environmental light and color adjustments Temperature (RNN Param.) DHT11 Temp Sensor Track outside temperature in degrees Celsius Image (RNN Param.) 720p Logitech Webcam Send as B64 for image analysis to extract color RFID Tag (Location Param.) MFRC522 RFID Reader Receive micropiece unique ID as ASCII for location Relative XY Location LAN Request Over Server Convert RFID to relative location for movement High-capacity motor controllers to regulate AC current to motors MT2204 Brushless motors responsible for high speed flight Motors and motor controllers soldered together at 3 joints Power regulation board to supply current to motors PRB soldered to motors at 2 joints (+ and - side) along with +/- clip for battery connection. Responsible for full flight. PRB/Motor circuit attached to carbon fiber drone frame. Base for F3 6DOF Flight Controller and Raspberry Pi circuits. Base Drone Construction Completed Field Analysis Drone Raspberry Pi Circuit Construction Drone Program Input Parameters Input Parameters 4D Visualization The 850+ simulated data points through the RNN is reflected in 4D with Heat, Light, and Crop Color as dependent variables. The 4D visualization allows users to visually project any variables on an XY plane to isolate 2D trends. Raspberry Pi used as central data processor for circuit, drone movement, and LAN communication Individual electric circuit of DHT11 Temperature Sensor to update variable for server Individual electric circuit of Photoresistor + 1μF Capacitor to map to environmental light Individual electric circuit of MFRC522 RFID reader to scan micropiece RFID for relative drone location Full wiring diagram of Raspberry Pi based circuit for data collection of program dependent variables, user feedback and LAN communication to server. The Field Analysis Drone serves as the primary data collection mechanism of by collecting environmental and crop specific data points to feed to the server as RNN parameters. The mechanism is a dual combination of a fully functioning quadcopter drone and an electrical circuit with all components wired to the Pi for data I/O. The drone utilizes unique RFID tag that maps to a relative location coordinate. The 3D graph shows the relationship between 2 independent variables (water flow rate in m/s on the x-axis and amperage of the current on the y-axis) and the resulting dependent variable (power in watts on the z-axis). The intersection between red plane x = 1.52 m/s, teal plane y = 220 mA, and blue power production graph represents the average power induced by the axial magnetic flux of the turbine. The linear distance from this point of intersection to green plane z = 4.38 watts represents the power consumer by the micropiece. At these specifications, there is a 25.8% excess margin in power production, indicating full power-self-sufficiency. Power Consumption vs. Production ComparisonPower Derivation and Calculation Derive formula for necessary EMF calculation using only collected and accessible term inputs from base magnetic flux and EMF formulas. Collect and calculate circumference and area terms of turbine for plug-in into EMF formula. Plug standard turbine values (number of coils, B-field, area) into EMF function and plug in flow rate and amperage into independent variables to calculate power produced by induced flux of turbine. Calculate power consumption of the 2 components in the micropiece (DC servo motor and ESP8226 WiFi module). Compare to power production. Micropiece Components and Completed Assembly Full wiring diagram of the Arduino Nano based circuit for the micropiece. A NodeMCU board was used for the built in ESP8226 module. 3D modeling (STL) file of printed components. Components are used to protect turbine and allow for water flow regulated by circuit. Completed irrigation micropiece without tube integration. Axial magnetic flux is induced through the turbine on the right, where current is generated to power LAN communication through the NodeMCU and adjust the servo motor orientation, which allows for full control of dynamic irrigation volume from the server.