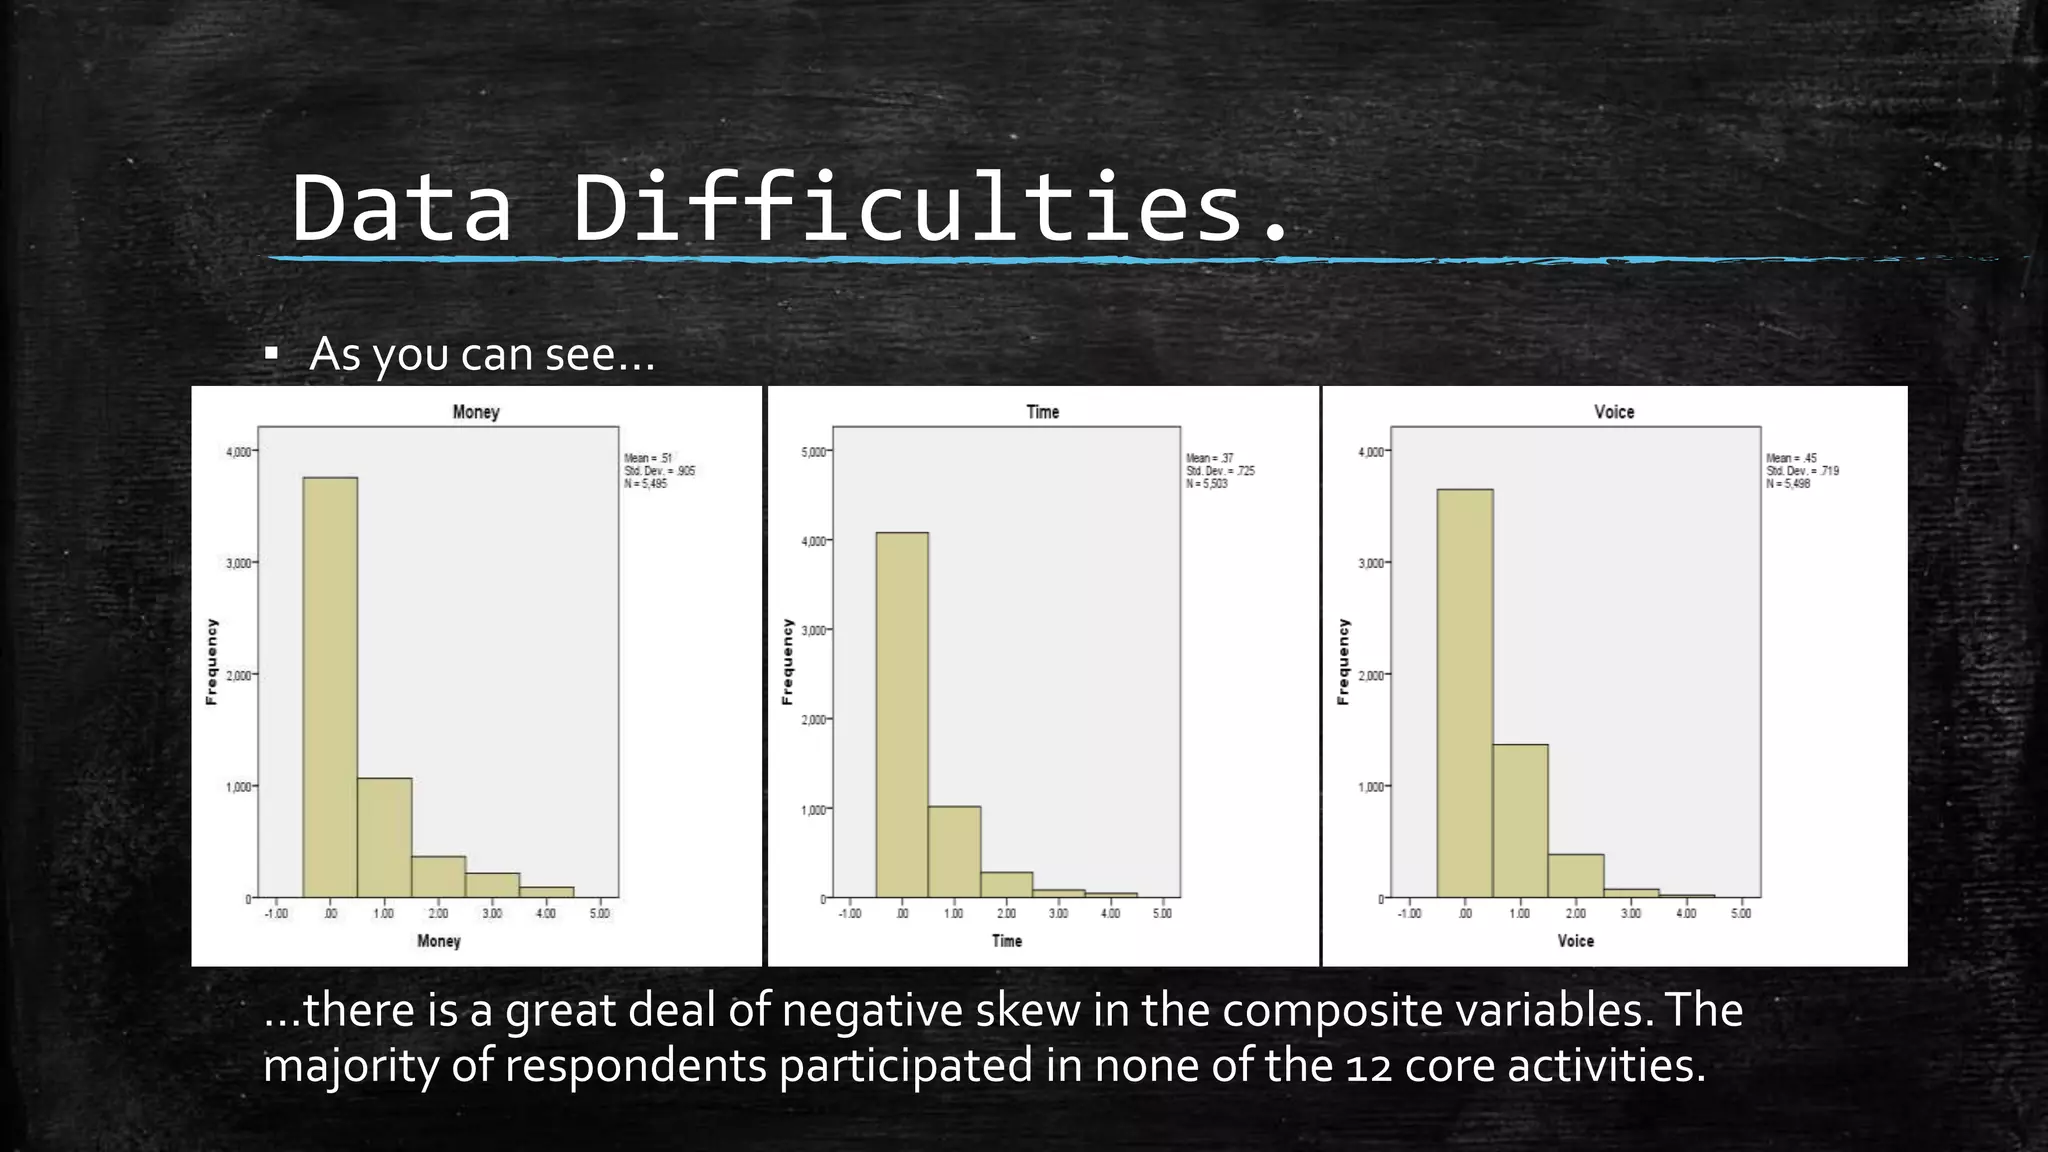
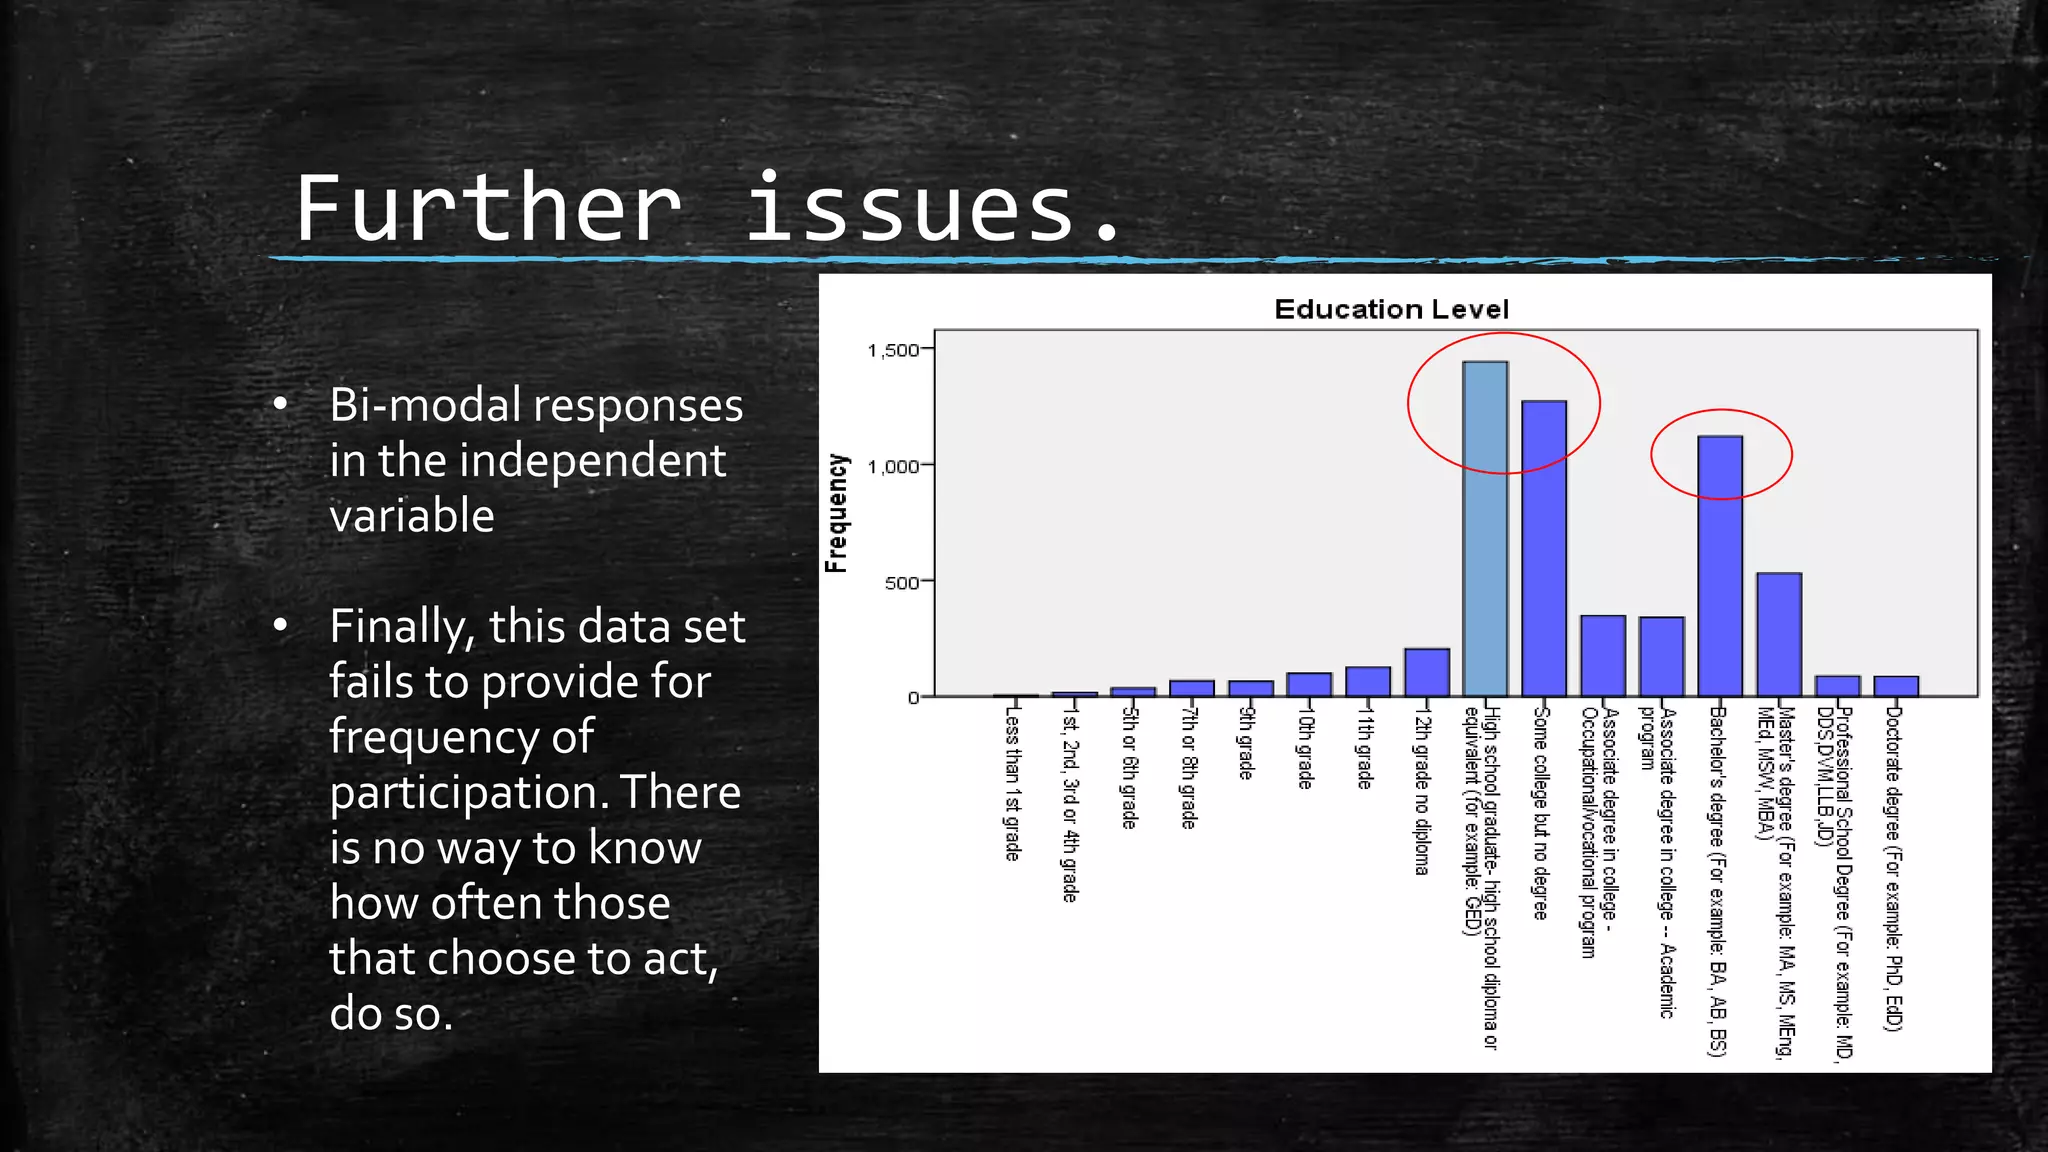
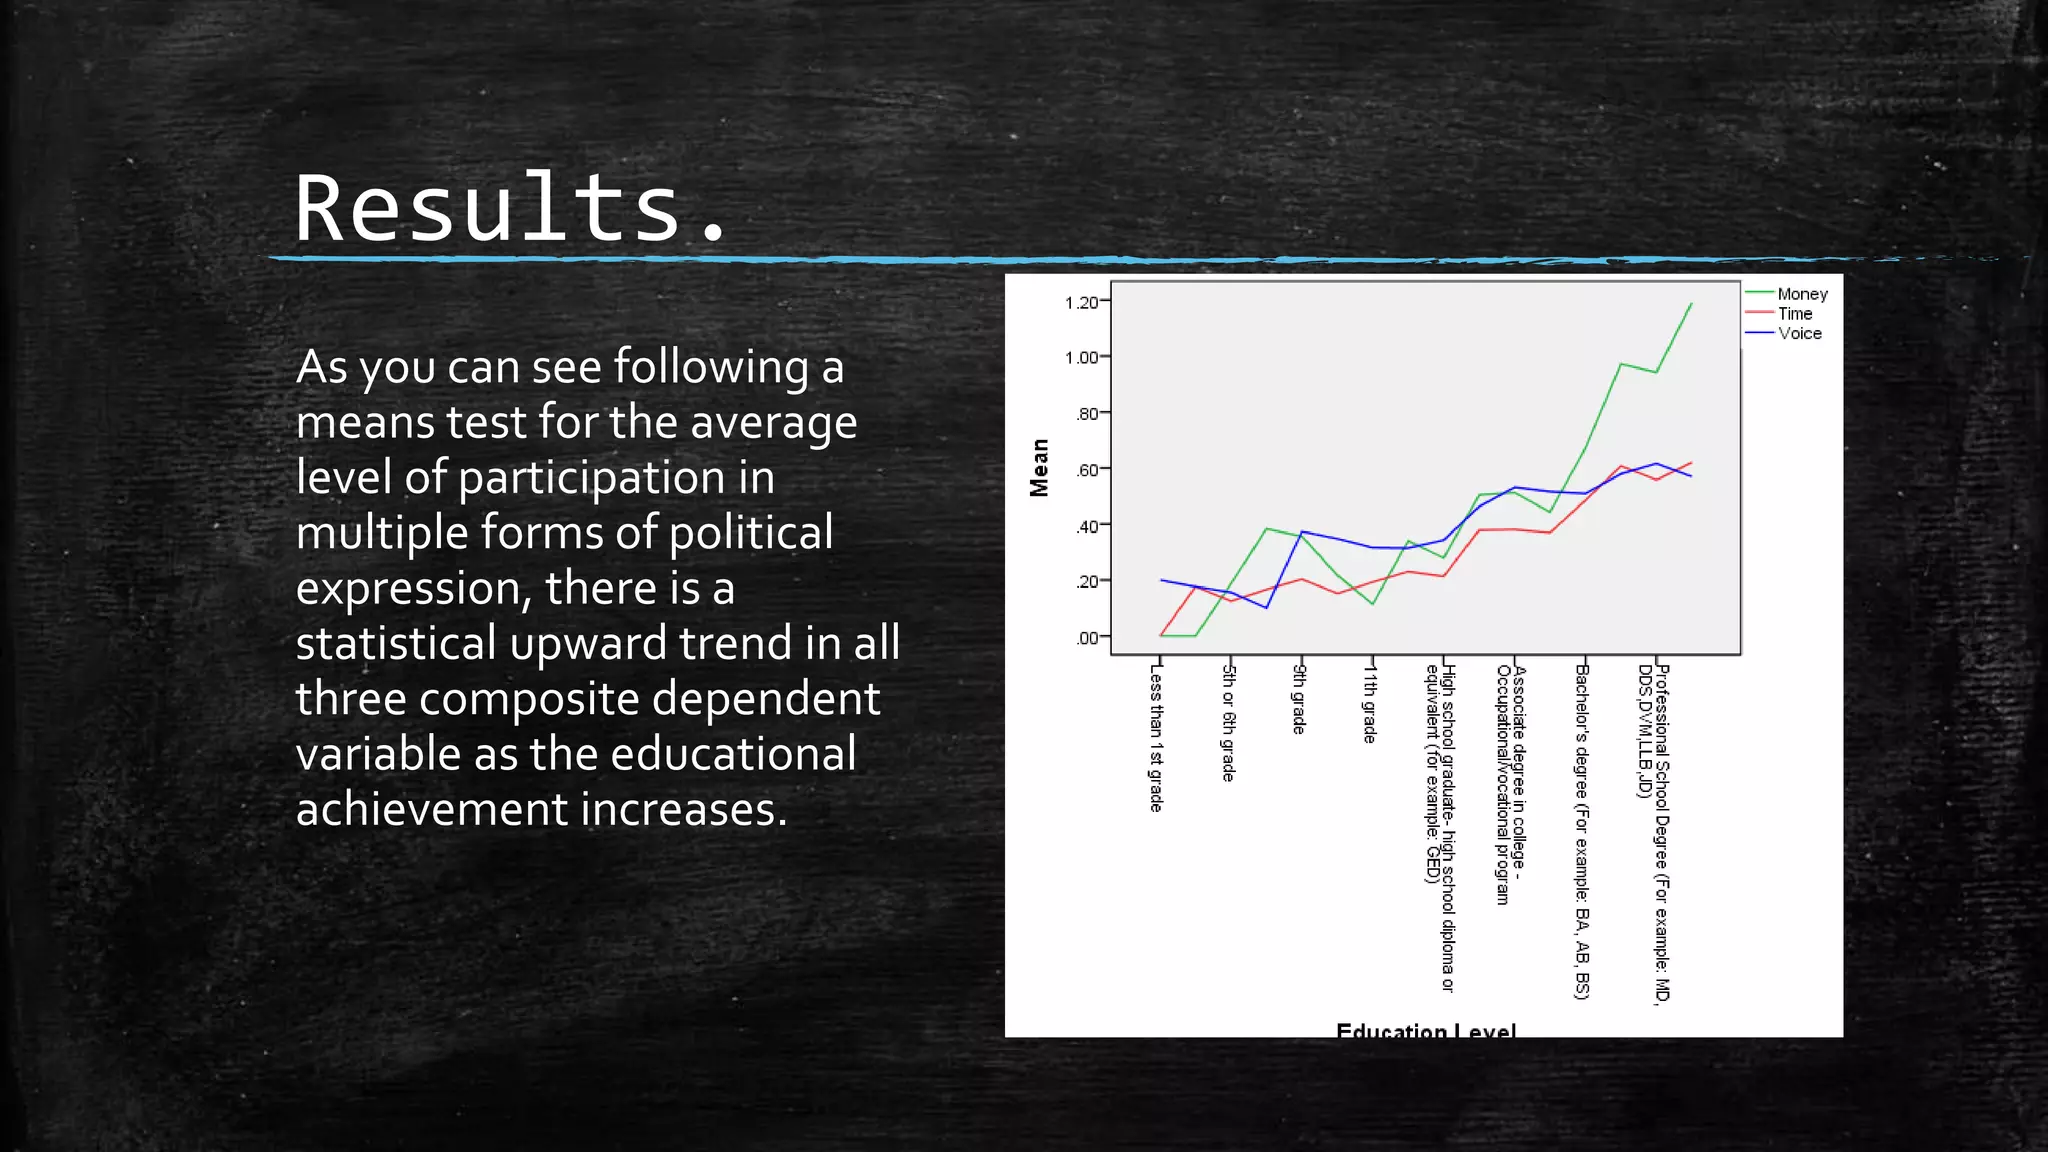
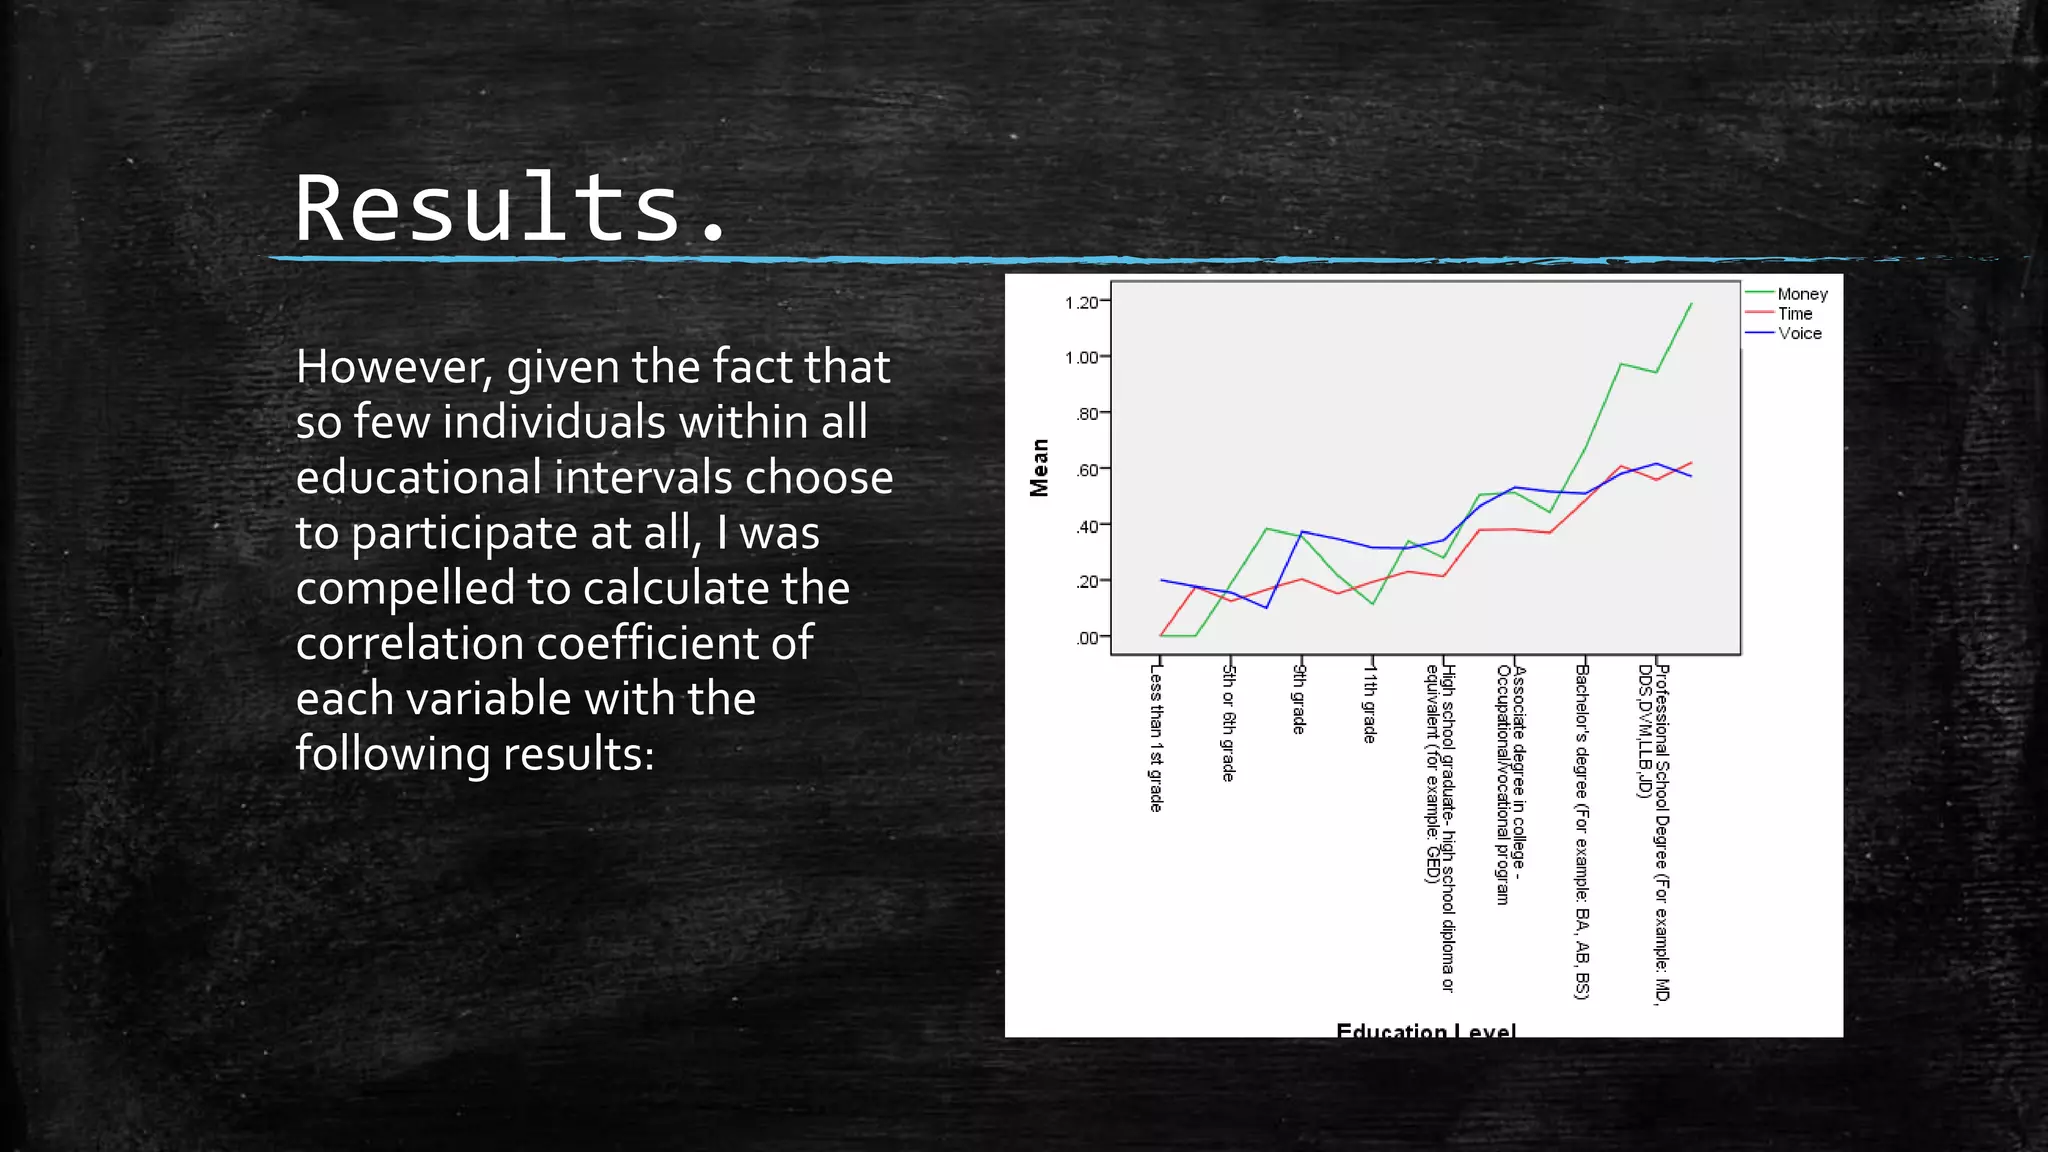
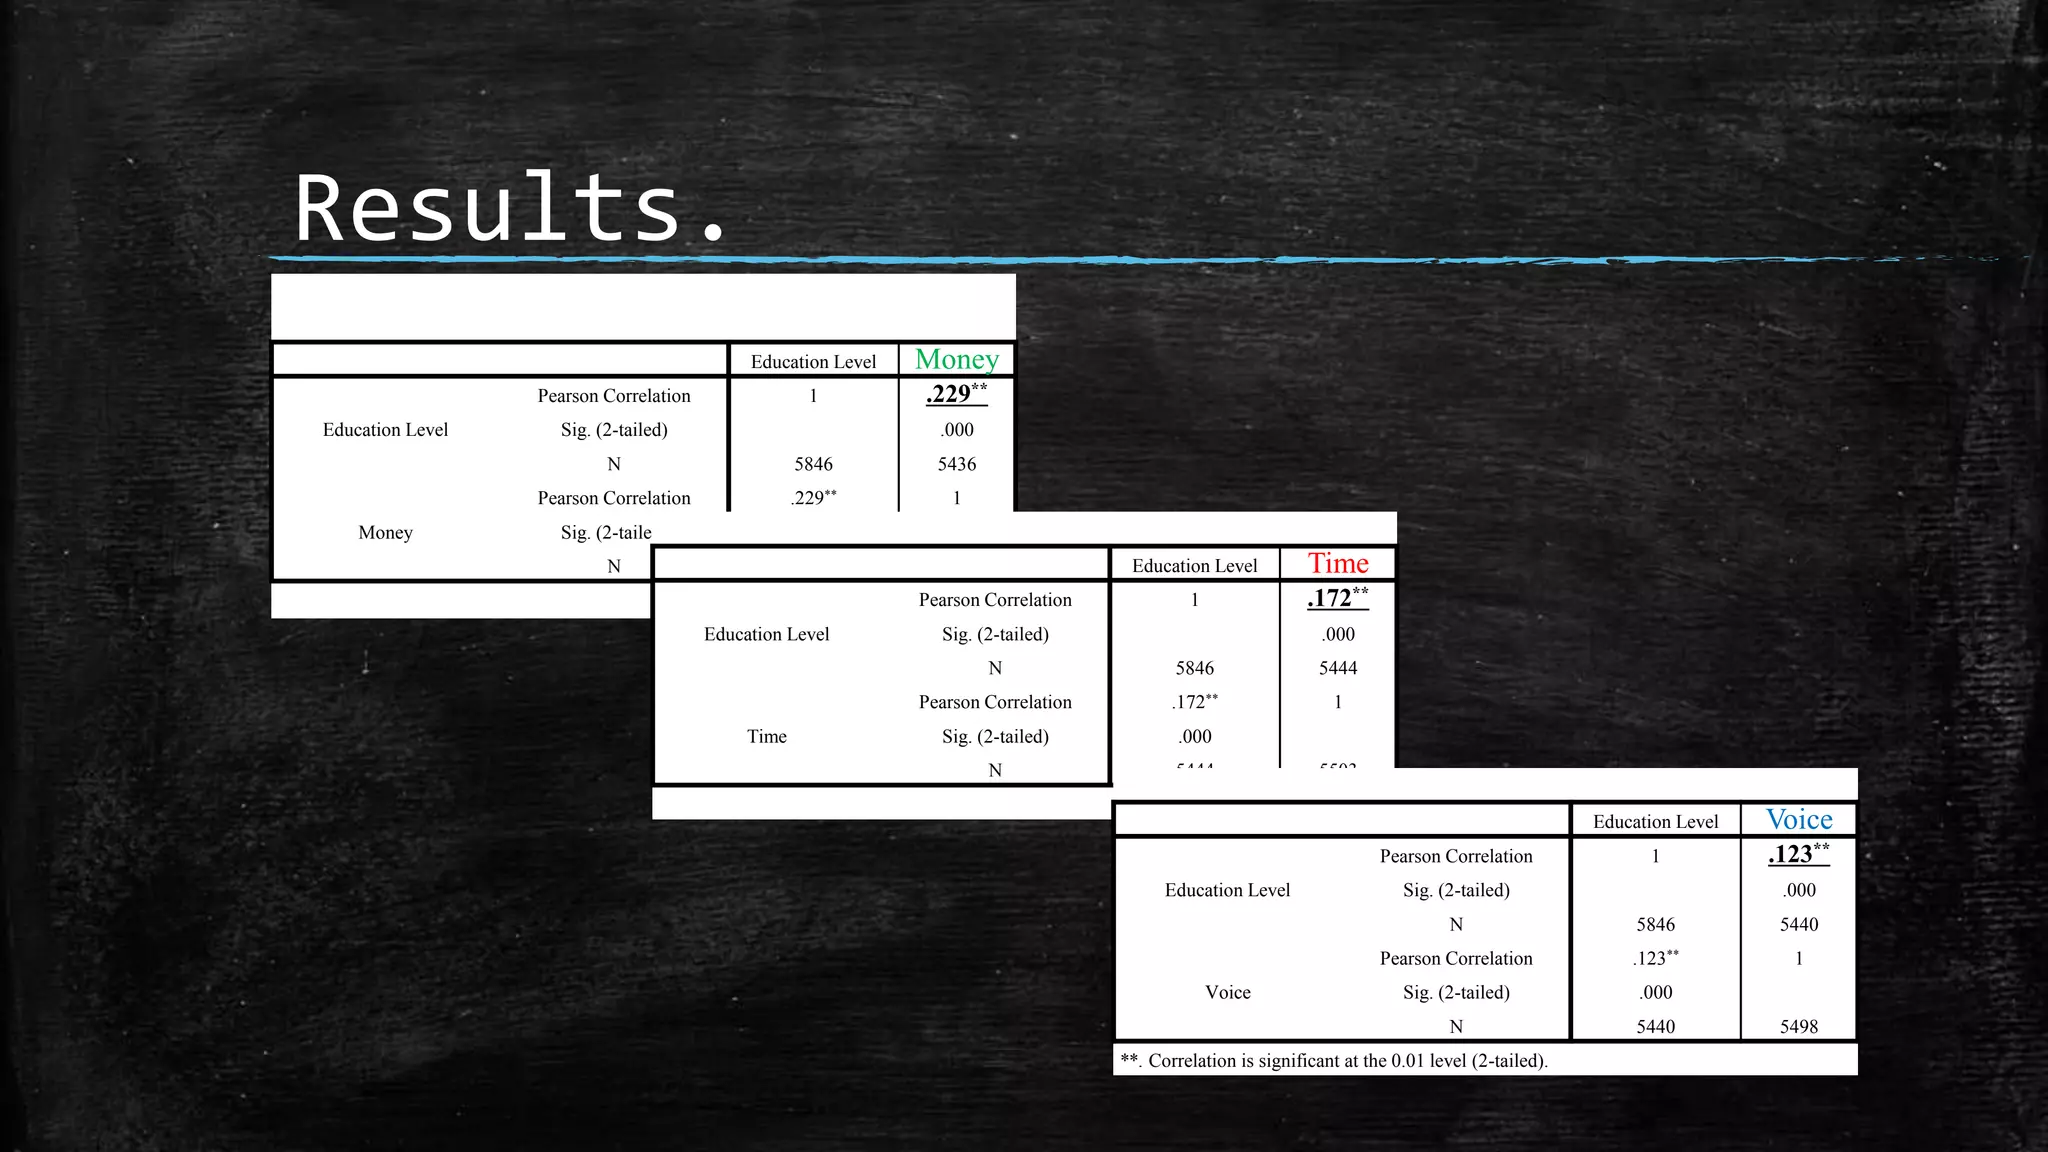
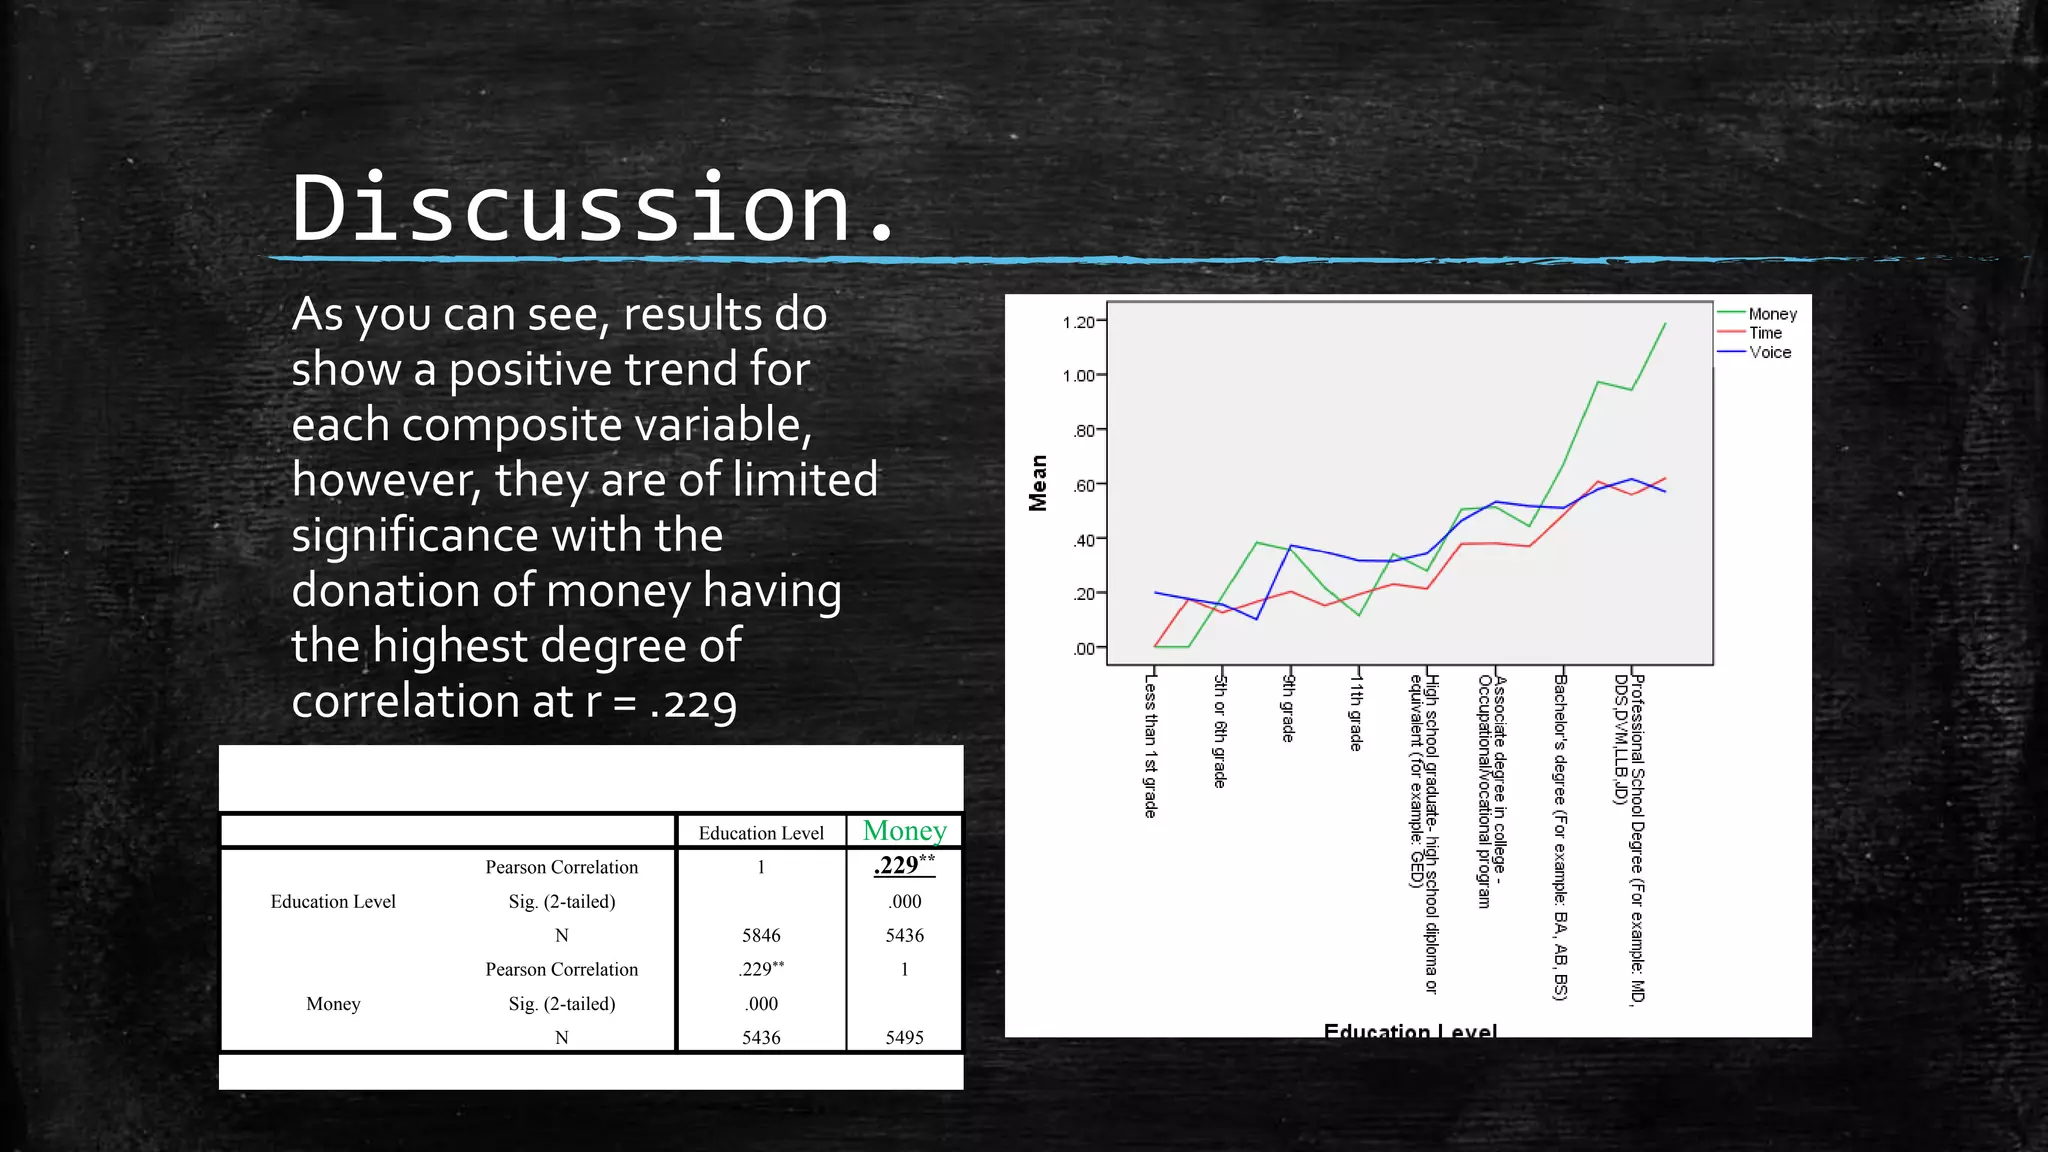
Research Methods
AndrewTaylor
What is the effect of educational
achievement on the level of political
conviction in the American voting public?
What is the effect of educational
achievement on the level of political
conviction in the American voting public?
▪ What is “political conviction?”
What is the effect of educational
achievement on the level of political
conviction in the American voting public?
▪ What is “political conviction?”
▪ How do you measure it?
What is the effect of educational
achievement on the level of political
conviction in the American voting public?
▪ What is “political conviction?”
▪ How do you measure it?
▪ What does education have to do with it?
What is “political conviction?”
▪ Political conviction is the circumstances in which
an individual will choose to act or refuse to act
based on their personal ideology.
What is “political conviction?”
▪ What causes someone to take time out of their day
to march in a rally?
▪ What prompts one to decrease their personal wealth
in any capacity to aid in a common political cause?
▪ What compels you to write a letter to the editor in
strong support or dissent of an issue?
Conviction!
Great!
...but how does one measure that?
Previous works.
▪ Converse (1964)
▪ Studied the cognitive abilities of the educated
mind and found that those with a higher degree of
education were much more effective at complex
inferential understanding.
Previous works.
▪ Bobo & Licari (1989)
▪ They demonstrated that as verbal aptitude
increased, subjects were more likely to comprehend
the social stratification and universal application
of civil rights.
Previous works.
▪ Emler & Frazer (1999)
▪ They found that students of math or physical
science were statistically just as likely to be
engaged with social action as students of social
sciences.
Previous works.
▪ Galston (2001)
▪ Concluded that basic classroom instruction on civil
institution is insufficient to compel individuals
to participate. Open debate, discussion and even
civil conflict coupled with service learning
initiatives produce a greater degree of
participation.
Previous works.
▪ Berinsky, Lenz (2010)
▪ They concluded that education can likely lead to
greater political participation but it is the
broader experience that motivates and that
experience can be achieved through many forms of
personal growth and self-discovery.
Dependent Variables / ANES
Time 2012
▪Time
▪Money
▪Voice
Time.
▪ Has R in past 4 years: attended city/school board?
(DHSINVOLV_EVERMTG)
▪ Has R in past 4 years: joined a protest march?
(DHSINVOLV_RALLY)
▪ Does R go to any political meetings, rallies,
speeches? (MOBILPO_MARCH)
▪ Does R do any (other) work for party or candidate?
(MOBILPO_OTHERWORK)
Money.
▪ Did R contribute money to specific candidate
campaign? (MOBILPO_CTBCAND)
▪ Did R contribute money to political party?
(MOBILPO_CTBPTY)
▪ Did R contribute to any other group for/against a
candidate? (MOBILPO_CTBOTH)
▪ Has R in past 4 years: given money to a soc/pol
organization? (DHSINVOLV_EVERGIVSOC)
Voice.
▪ Has R in past 4 yrs: called radio/TV about a
political issue? (DHSINVOLV_EVERTVCALL)
▪ Has R in past 4 yrs : written a letter to
newspaper/mag about political issue?
(DHSINVOLV_EVERLETT)
▪ Has R in past 4 yrs : sent a message on
Facebook/Twitter about political issue?
(DHSINVOLV_EVERTWIT)
▪ Has R worn a campaign button or post sign or bumper
sticker? (MOBILPO_RBUTTN)
Recoding
▪ All 12 sub-variables were recoded into nominal YES
or NO responses. All other data was removed as
SYSTEM MISSING. (Yes =1 / No = 0)
▪ They were then grouped and computed into my final
composite dependent variables.
▪ TotalTime
▪ TotalMoney
▪ TotalVoice
Recoding
▪ My final dependent variables are interval level
data coded as 0 to 4
▪ 0 = No participation
▪ 4 = Participation in all
▪ My dependent variable baselines are as
follows…
TotalTimeTime
Frequency Percent Valid Percent Cumulative
Percent
Valid
.00 4078 69.0 74.1 74.1
1.00 1016 17.2 18.5 92.6
2.00 279 4.7 5.1 97.6
3.00 84 1.4 1.5 99.2
4.00 46 .8 .8 100.0
Total 5503 93.1 100.0
Missing System 411 6.9
Total 5914 100.0
TotalMoneyMoney
Frequency Percent Valid Percent Cumulative
Percent
Valid
.00 3755 63.5 68.3 68.3
1.00 1066 18.0 19.4 87.7
2.00 366 6.2 6.7 94.4
3.00 217 3.7 3.9 98.3
4.00 91 1.5 1.7 100.0
Total 5495 92.9 100.0
Missing System 419 7.1
Total 5914 100.0
TotalVoiceVoice
Frequency Percent Valid Percent Cumulative
Percent
Valid
.00 3649 61.7 66.4 66.4
1.00 1367 23.1 24.9 91.2
2.00 385 6.5 7.0 98.2
3.00 75 1.3 1.4 99.6
4.00 22 .4 .4 100.0
Total 5498 93.0 100.0
Missing System 416 7.0
Total 5914 100.0
Independent Variable/ ANES
Time 2012
▪ Comparatively my independent variable is fairly straight forward.
▪ What is the highest level of school you have completed or the highest
degree you have received? (DEM_EDUCR)
▪ This was recoded to exclude all non-relevant codes outside of
responses 1 through 16.
▪ These are interval level responses covering the spectrum ofAmerican
educational achievement.
▪ (1 = Less than first grade and 16 = Doctorate degree.)
Independent Variable/ ANES
Time 2012
Data Difficulties.
▪ As you can see…
…there is a great deal of negative skew in the composite variables.The
majority of respondents participated in none of the 12 core activities.
Further issues.
• Bi-modal responses
in the independent
variable
• Finally, this data set
fails to provide for
frequency of
participation.There
is no way to know
how often those
that choose to act,
do so.
Results.
As you can see following a
means test for the average
level of participation in
multiple forms of political
expression, there is a
statistical upward trend in all
three composite dependent
variable as the educational
achievement increases.
Results.
However, given the fact that
so few individuals within all
educational intervals choose
to participate at all, I was
compelled to calculate the
correlation coefficient of
each variable with the
following results:
Results.
Education Level Money
Education Level
Pearson Correlation 1 .229**
Sig. (2-tailed) .000
N 5846 5436
Money
Pearson Correlation .229** 1
Sig. (2-tailed) .000
N 5436 5495 Education Level Time
Education Level
Pearson Correlation 1 .172**
Sig. (2-tailed) .000
N 5846 5444
Time
Pearson Correlation .172** 1
Sig. (2-tailed) .000
N 5444 5503
Education Level Voice
Education Level
Pearson Correlation 1 .123**
Sig. (2-tailed) .000
N 5846 5440
Voice
Pearson Correlation .123** 1
Sig. (2-tailed) .000
N 5440 5498
**. Correlation is significant at the 0.01 level (2-tailed).
Discussion.
As you can see, results do
show a positive trend for
each composite variable,
however, they are of limited
significance with the
donation of money having
the highest degree of
correlation at r = .229
Education Level Money
Education Level
Pearson Correlation 1 .229**
Sig. (2-tailed) .000
N 5846 5436
Money
Pearson Correlation .229** 1
Sig. (2-tailed) .000
N 5436 5495
Moving forward…
While a strong relation to political conviction
through participation and education was not
established by this study I believe that the
composite variables of:
TotalTime
TotalMoney
TotalVoice
…are a valid measures of political conviction and
that education is one thread that ties them together.
The next step is to find those other
common threads…
Gender?
Age?
Class?
Partisanship?
Questions?

Research Methods Presentation

  • 1.
  • 2.
    What is theeffect of educational achievement on the level of political conviction in the American voting public?
  • 3.
    What is theeffect of educational achievement on the level of political conviction in the American voting public? ▪ What is “political conviction?”
  • 4.
    What is theeffect of educational achievement on the level of political conviction in the American voting public? ▪ What is “political conviction?” ▪ How do you measure it?
  • 5.
    What is theeffect of educational achievement on the level of political conviction in the American voting public? ▪ What is “political conviction?” ▪ How do you measure it? ▪ What does education have to do with it?
  • 6.
    What is “politicalconviction?”
  • 7.
    What is “politicalconviction?” ▪ Political conviction is the circumstances in which an individual will choose to act or refuse to act based on their personal ideology.
  • 8.
    What is “politicalconviction?” ▪ What causes someone to take time out of their day to march in a rally? ▪ What prompts one to decrease their personal wealth in any capacity to aid in a common political cause? ▪ What compels you to write a letter to the editor in strong support or dissent of an issue?
  • 9.
  • 10.
    Great! ...but how doesone measure that?
  • 11.
    Previous works. ▪ Converse(1964) ▪ Studied the cognitive abilities of the educated mind and found that those with a higher degree of education were much more effective at complex inferential understanding.
  • 12.
    Previous works. ▪ Bobo& Licari (1989) ▪ They demonstrated that as verbal aptitude increased, subjects were more likely to comprehend the social stratification and universal application of civil rights.
  • 13.
    Previous works. ▪ Emler& Frazer (1999) ▪ They found that students of math or physical science were statistically just as likely to be engaged with social action as students of social sciences.
  • 14.
    Previous works. ▪ Galston(2001) ▪ Concluded that basic classroom instruction on civil institution is insufficient to compel individuals to participate. Open debate, discussion and even civil conflict coupled with service learning initiatives produce a greater degree of participation.
  • 15.
    Previous works. ▪ Berinsky,Lenz (2010) ▪ They concluded that education can likely lead to greater political participation but it is the broader experience that motivates and that experience can be achieved through many forms of personal growth and self-discovery.
  • 16.
    Dependent Variables /ANES Time 2012 ▪Time ▪Money ▪Voice
  • 17.
    Time. ▪ Has Rin past 4 years: attended city/school board? (DHSINVOLV_EVERMTG) ▪ Has R in past 4 years: joined a protest march? (DHSINVOLV_RALLY) ▪ Does R go to any political meetings, rallies, speeches? (MOBILPO_MARCH) ▪ Does R do any (other) work for party or candidate? (MOBILPO_OTHERWORK)
  • 18.
    Money. ▪ Did Rcontribute money to specific candidate campaign? (MOBILPO_CTBCAND) ▪ Did R contribute money to political party? (MOBILPO_CTBPTY) ▪ Did R contribute to any other group for/against a candidate? (MOBILPO_CTBOTH) ▪ Has R in past 4 years: given money to a soc/pol organization? (DHSINVOLV_EVERGIVSOC)
  • 19.
    Voice. ▪ Has Rin past 4 yrs: called radio/TV about a political issue? (DHSINVOLV_EVERTVCALL) ▪ Has R in past 4 yrs : written a letter to newspaper/mag about political issue? (DHSINVOLV_EVERLETT) ▪ Has R in past 4 yrs : sent a message on Facebook/Twitter about political issue? (DHSINVOLV_EVERTWIT) ▪ Has R worn a campaign button or post sign or bumper sticker? (MOBILPO_RBUTTN)
  • 20.
    Recoding ▪ All 12sub-variables were recoded into nominal YES or NO responses. All other data was removed as SYSTEM MISSING. (Yes =1 / No = 0) ▪ They were then grouped and computed into my final composite dependent variables. ▪ TotalTime ▪ TotalMoney ▪ TotalVoice
  • 21.
    Recoding ▪ My finaldependent variables are interval level data coded as 0 to 4 ▪ 0 = No participation ▪ 4 = Participation in all ▪ My dependent variable baselines are as follows…
  • 22.
    TotalTimeTime Frequency Percent ValidPercent Cumulative Percent Valid .00 4078 69.0 74.1 74.1 1.00 1016 17.2 18.5 92.6 2.00 279 4.7 5.1 97.6 3.00 84 1.4 1.5 99.2 4.00 46 .8 .8 100.0 Total 5503 93.1 100.0 Missing System 411 6.9 Total 5914 100.0
  • 23.
    TotalMoneyMoney Frequency Percent ValidPercent Cumulative Percent Valid .00 3755 63.5 68.3 68.3 1.00 1066 18.0 19.4 87.7 2.00 366 6.2 6.7 94.4 3.00 217 3.7 3.9 98.3 4.00 91 1.5 1.7 100.0 Total 5495 92.9 100.0 Missing System 419 7.1 Total 5914 100.0
  • 24.
    TotalVoiceVoice Frequency Percent ValidPercent Cumulative Percent Valid .00 3649 61.7 66.4 66.4 1.00 1367 23.1 24.9 91.2 2.00 385 6.5 7.0 98.2 3.00 75 1.3 1.4 99.6 4.00 22 .4 .4 100.0 Total 5498 93.0 100.0 Missing System 416 7.0 Total 5914 100.0
  • 25.
    Independent Variable/ ANES Time2012 ▪ Comparatively my independent variable is fairly straight forward. ▪ What is the highest level of school you have completed or the highest degree you have received? (DEM_EDUCR) ▪ This was recoded to exclude all non-relevant codes outside of responses 1 through 16. ▪ These are interval level responses covering the spectrum ofAmerican educational achievement. ▪ (1 = Less than first grade and 16 = Doctorate degree.)
  • 26.
  • 27.
    Data Difficulties. ▪ Asyou can see… …there is a great deal of negative skew in the composite variables.The majority of respondents participated in none of the 12 core activities.
  • 28.
    Further issues. • Bi-modalresponses in the independent variable • Finally, this data set fails to provide for frequency of participation.There is no way to know how often those that choose to act, do so.
  • 29.
    Results. As you cansee following a means test for the average level of participation in multiple forms of political expression, there is a statistical upward trend in all three composite dependent variable as the educational achievement increases.
  • 30.
    Results. However, given thefact that so few individuals within all educational intervals choose to participate at all, I was compelled to calculate the correlation coefficient of each variable with the following results:
  • 31.
    Results. Education Level Money EducationLevel Pearson Correlation 1 .229** Sig. (2-tailed) .000 N 5846 5436 Money Pearson Correlation .229** 1 Sig. (2-tailed) .000 N 5436 5495 Education Level Time Education Level Pearson Correlation 1 .172** Sig. (2-tailed) .000 N 5846 5444 Time Pearson Correlation .172** 1 Sig. (2-tailed) .000 N 5444 5503 Education Level Voice Education Level Pearson Correlation 1 .123** Sig. (2-tailed) .000 N 5846 5440 Voice Pearson Correlation .123** 1 Sig. (2-tailed) .000 N 5440 5498 **. Correlation is significant at the 0.01 level (2-tailed).
  • 32.
    Discussion. As you cansee, results do show a positive trend for each composite variable, however, they are of limited significance with the donation of money having the highest degree of correlation at r = .229 Education Level Money Education Level Pearson Correlation 1 .229** Sig. (2-tailed) .000 N 5846 5436 Money Pearson Correlation .229** 1 Sig. (2-tailed) .000 N 5436 5495
  • 33.
    Moving forward… While astrong relation to political conviction through participation and education was not established by this study I believe that the composite variables of: TotalTime TotalMoney TotalVoice …are a valid measures of political conviction and that education is one thread that ties them together.
  • 34.
    The next stepis to find those other common threads…
  • 35.
  • 36.
  • 37.
  • 38.
  • 39.