This document provides a primer on social media for real estate agents. It discusses key social media statistics, defines important concepts like personal branding and return on investment. It also reviews popular social media tools like blogs, Facebook, Twitter, LinkedIn and YouTube. The document encourages agents to carefully consider their audience and commitment level before engaging on social media and provides steps for getting started, including dedicating half an hour a day to different tools over time.
- The document provides housing market data for the City of Toronto East region for July 2011 and year-to-date 2011, including sales, dollar volumes, average and median prices, new and active listings, and average days on market.
- It includes this data broken down by home type (detached, semi-detached, condo townhouse, etc.) and for three specific areas within Toronto East: E01, E02, and E03.
- The data shows strong home sales in July 2011 for the Toronto East region overall as well as increases in most home types from year-to-date 2011.
The document contains charts summarizing housing market trends in Toronto from 2008-2011. It shows sales, new listings, average prices, and the ratio of sales to new listings have followed seasonal patterns over the past four years. When the sales to new listings ratio is higher, price growth tends to be higher. One chart compares this ratio to the average annual change in home prices, showing that higher ratios correlate with greater price increases. Another chart tracks the affordability index, measuring the percentage of average household income needed to carry the costs of an average home.
This document provides contact information for Canadian government offices in the United States, including Consulates General and Trade Offices. It also includes information on the Canadian Revenue Agency, provincial real estate regulators, provincial health care coverage for out-of-province services, and provincial requirements regarding residency. The document is intended as a resource for those preparing to engage with international buyers.
Over the past 20 plus years I have been a big supporter of Casey House Hospice. The need has never been greater and Toronto's Casey House has come forward as an example of Community, Business and Government working together. Within this 12 page supplement there are stories that will make you laugh and make you cry. I hope you enjoy the read and if you have stories that you can share, please do so.
The document summarizes the Toronto real estate market according to Mercer in October 2012. It finds that while GDP and job growth are slow, household incomes are rising above inflation. Real estate sales in Toronto have not returned to pre-recession peaks due to increased land transfer taxes and tighter mortgage rules. However, home prices continue to rise significantly at 6-12% annually across all types, fueled by low housing supply. With fewer listings than normal, months of housing inventory remain low, supporting further home price increases.
The document summarizes Toronto real estate market statistics for May 2012. It reports that home sales increased 11% compared to May 2011, with 10,850 transactions. Average home prices rose 6.5% to $516,787. Price growth was strongest for low-rise homes, while new listings grew over 20% year-over-year, which may help moderate future price increases if the pace continues. Overall, the Toronto real estate market showed solid sales and price growth in May 2012 compared to the previous year.
The document contains charts and graphs analyzing the Toronto housing market in February 2012 and previous years. It shows trends in MLS sales, new listings, average prices, and the ratio of sales to new listings. The sales to new listings ratio tends to correlate with average annual price changes. Charts also show trends over time and the affordability of homes based on average household income.
Here are the ,most recent Housing Market Charts from the Toronto Real Estate Board. June is down but still strong in relationship to the last few years.
The document contains charts summarizing housing market trends in Toronto from 2008-2011. It shows sales, new listings, average prices, and the ratio of sales to new listings have followed seasonal patterns over the past four years. When the sales to new listings ratio is higher, price growth tends to be higher. The affordability indicator chart shows the percentage of average household income needed to cover mortgage payments, property taxes and utilities on an average priced home, which has fluctuated between 30-50% in recent years.
Condominium apartment sales in the Greater Toronto Area increased substantially in the third quarter of 2011. There were 5,770 condo sales, up 24% from the same period in 2010. The average selling price also rose, increasing by almost 9% to $333,352. Strong sales growth has continued despite higher condo completions and listings, keeping seller's market conditions in place.
The document summarizes statistics about the Indo-Canadian population in Canada. It states that the number of immigrants from India grew 74% from 2001 to 2011. Approximately 40,000 people of Indian origin immigrate to Canada annually, making up 14% of all immigrants. Over half of Indo-Canadians live in the Greater Toronto Area, with a strong presence in Brampton where they comprise a third of the population. The document also provides comparisons between population statistics in India and Canada.
This document provides guidelines and information for non-resident and new to Canada mortgage applicants. For non-resident purchases, mortgages are restricted to 65% LTV with proof of income or 80% LTV for US owners occupying. A full appraisal and documents signed in Canada are required. New to Canada applicants must have been in Canada for 3-5 years and have permanent resident status to be eligible for insured mortgages up to 95% LTV or uninsured mortgages with a minimum 35% down payment and 12 months of PIT payments available. The document was presented by Hanley Mortgage Group and Oriana Financial.
Richard Silver is a senior vice president of sales at Sotheby's International Realty Canada who leads their Torontoism team. He discussed Toronto's status as one of Canada's largest cities, with a population over 5 million, and its diverse economic sectors focused on finance, commerce, industry, tourism, arts, and sports. Toronto has many top universities and private/public schools and excellent health care/research institutions.
Richard Silver, a senior vice president at Sotheby's International Realty Canada, has extensive experience in real estate as a past director at CREA and president of the Toronto Real Estate Board. He leads the Torontoism Team which is marketing a new construction property in a neighborhood of older Victorians, where the seller wants an off market price given its location in a rougher area, though it is walkable to a business center.
Here are the slides that will be presented at the West Vancouver Sotheby's International Realty Canada office on July 8th, at 11 PM and again presented in Sarasota for Premier Sotheby's in Sarasota Florida, on September 27th and for the Realtor Association of Sarasota and Manatee on September 28th, 2016.
On December 1st, I taught a seminar about why REALTORS® should consider going paperless. The focus of the seminar was on dealing with paperless transactions, involving document creation, electronic signatures, document storage and of course, how to organize the paperless documents. PICRA stands for the PROFESSIONAL IRANIAN CANADIAN REALTOR ASSOCIATION and is a great organization that serves REALTORS in the Toronto marketplace.
A quick update on options that exist in the marketplace for going paperless and using electronic signatures in the sale of property in Ontario, Canada.
Richard Silver presented on going paperless in real estate transactions. He discussed the benefits of electronic documents and signatures for agents, teams, brokers, and associations. This includes increased accessibility, speed, being more environmentally friendly, and improved risk management. Potential concerns include security and getting all parties to adopt electronic processes. Silver recommended tools like Docusign, Instanet, Dropbox, Evernote, Dotloop, Google Drive, and The Paperless Agent to help real estate professionals transition to paperless transactions.
This document discusses various apps that can help real estate agents in their work. It lists apps for staying organized with documents and travel plans, signing documents electronically, managing passwords, accessing files from any device, seeing what clients are searching for, understanding client design interests, keeping up with social media, measuring listing spaces, conducting open houses, translating languages, converting currencies, making international phone calls, expanding an international client network, and maintaining a healthy lifestyle. The document promotes these apps as ways for real estate agents to work more efficiently.
Here are the February 2013 Toronto Housing Market Charts presented by the Toronto Real Estate Board which is the largest Real Estate Association in North America with over 36,000 members. Lots of homes for sale, sold and great three year history of activity!
Yesterday early morning, there was a meeting of the Toronto Condo Network and we had a great discussion about the Toronto Condo market with Consultant N. Barry Lyons who is an expert in what is happening in the Toronto Condo marketplace.
The Hazelton Avenue Heritage Conservation District Plan area is located in the Yorkville Neighbourhood within the City of Toronto. Defined as Areas of Special Identity in the Official Plan, the significant historical and architectural character of the Yorkville Triangle and Scollard Hazelton areas, make it an important part of the City’s rich legacy of neighbourhoods.
The document summarizes housing market data for the Greater Toronto Area (GTA) in January 2013. It reports that home sales were down slightly from January 2012 with 4,375 transactions in 2013 compared to 4,432 in 2012. The average home price rose 4.3% year-over-year to $482,648. By home type, prices increased most for semi-detached homes at 6.8% while condo apartment prices declined slightly by 1.4%. Overall, the real estate market saw a positive start to the new year with modest price gains and continued competition between buyers.
Here is the most recent Rental Market report from the Toronto Real Estate Board from Richard Silver. This gives you house and condo rentals tipping mostly towards the rental market.
More from Richard Silver, Certified International REALTOR® (20)
Zodiac Signs and Food Preferences_ What Your Sign Says About Your Tastemy Pandit
Know what your zodiac sign says about your taste in food! Explore how the 12 zodiac signs influence your culinary preferences with insights from MyPandit. Dive into astrology and flavors!
Discover the Beauty and Functionality of The Expert Remodeling Serviceobriengroupinc04
Unlock your kitchen's true potential with expert remodeling services from O'Brien Group Inc. Transform your space into a functional, modern, and luxurious haven with their experienced professionals. From layout reconfiguration to high-end upgrades, they deliver stunning results tailored to your style and needs. Visit obriengroupinc.com to elevate your kitchen's beauty and functionality today.
Discover timeless style with the 2022 Vintage Roman Numerals Men's Ring. Crafted from premium stainless steel, this 6mm wide ring embodies elegance and durability. Perfect as a gift, it seamlessly blends classic Roman numeral detailing with modern sophistication, making it an ideal accessory for any occasion.
https://rb.gy/usj1a2
The Genesis of BriansClub.cm Famous Dark WEb PlatformSabaaSudozai
BriansClub.cm, a famous platform on the dark web, has become one of the most infamous carding marketplaces, specializing in the sale of stolen credit card data.
Starting a business is like embarking on an unpredictable adventure. It’s a journey filled with highs and lows, victories and defeats. But what if I told you that those setbacks and failures could be the very stepping stones that lead you to fortune? Let’s explore how resilience, adaptability, and strategic thinking can transform adversity into opportunity.
How are Lilac French Bulldogs Beauty Charming the World and Capturing Hearts....Lacey Max
“After being the most listed dog breed in the United States for 31
years in a row, the Labrador Retriever has dropped to second place
in the American Kennel Club's annual survey of the country's most
popular canines. The French Bulldog is the new top dog in the
United States as of 2022. The stylish puppy has ascended the
rankings in rapid time despite having health concerns and limited
color choices.”
SATTA MATKA DPBOSS KALYAN MATKA RESULTS KALYAN CHART KALYAN MATKA MATKA RESULT KALYAN MATKA TIPS SATTA MATKA MATKA COM MATKA PANA JODI TODAY BATTA SATKA MATKA PATTI JODI NUMBER MATKA RESULTS MATKA CHART MATKA JODI SATTA COM INDIA SATTA MATKA MATKA TIPS MATKA WAPKA ALL MATKA RESULT LIVE ONLINE MATKA RESULT KALYAN MATKA RESULT DPBOSS MATKA 143 MAIN MATKA KALYAN MATKA RESULTS KALYAN CHART
Industrial Tech SW: Category Renewal and CreationChristian Dahlen
Every industrial revolution has created a new set of categories and a new set of players.
Multiple new technologies have emerged, but Samsara and C3.ai are only two companies which have gone public so far.
Manufacturing startups constitute the largest pipeline share of unicorns and IPO candidates in the SF Bay Area, and software startups dominate in Germany.
Profiles of Iconic Fashion Personalities.pdfTTop Threads
The fashion industry is dynamic and ever-changing, continuously sculpted by trailblazing visionaries who challenge norms and redefine beauty. This document delves into the profiles of some of the most iconic fashion personalities whose impact has left a lasting impression on the industry. From timeless designers to modern-day influencers, each individual has uniquely woven their thread into the rich fabric of fashion history, contributing to its ongoing evolution.
Ellen Burstyn: From Detroit Dreamer to Hollywood Legend | CIO Women MagazineCIOWomenMagazine
In this article, we will dive into the extraordinary life of Ellen Burstyn, where the curtains rise on a story that's far more attractive than any script.
Satta matka fixx jodi panna all market dpboss matka guessing fixx panna jodi kalyan and all market game liss cover now 420 matka office mumbai maharashtra india fixx jodi panna
Call me 9040963354
WhatsApp 9040963354
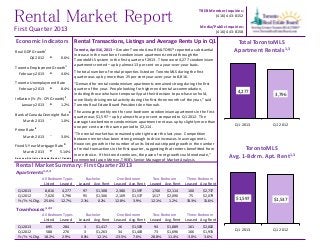
1. Rental Market Report
TREB Member Inquiries:
(416) 443-8152
Media/Public Inquiries:
(416) 443-8158
Rental Transactions, Listings and Average Rents Up in Q1
Toronto, April 16, 2013 – Greater Toronto Area REALTORS® reported a substantial
increase in the number of condominium apartments rented through the
TorontoMLS system in the first quarter of 2013. There were 4,277 condominium
apartments rented – up by almost 13 per cent on a year-over-year basis.
The total number of rental properties listed on TorontoMLS during the first
quarter was up by more than 25 per cent year-over-year to 8,816.
“Demand for rental condominium apartments remained strong during the first
quarter of the year. People looking for higher end rental accommodation,
including those who have temporarily put their decision to purchase on hold,
were likely driving rental activity during the first three months of the year,” said
Toronto Real Estate Board President Ann Hannah.
The average monthly rent for one-bedroom condominium apartments in the first
quarter was $1,597 – up by almost four per cent compared to Q1 2012. The
average two-bedroom condominium apartment rent was up by slightly more than
one per cent over the same period to $2,114.
“The rental market has remained quite tight over the last year. Competition
between renters has been strong enough to drive increases in average rents.
However, growth in the number of units listed outstripped growth in the number
of rental transactions in the first quarter, suggesting that renters benefitted from
more choice. If this trend continues, the pace of rent growth could moderate,”
commented Jason Mercer, TREB’s Senior Manager of Market Analysis.
First Quarter 2013
Rental Market Summary: First Quarter 2013
Apartments1,2,3
Listed Leased Leased Avg. Rent Leased Avg. Rent Leased Avg. Rent Leased Avg. Rent
Q1 2013 8,816 4,277 97 $1,308 2,380 $1,597 1,700 $2,114 100 $2,737
Q1 2012 7,020 3,796 95 $1,306 2,109 $1,537 1,517 $2,090 75 $2,079
Yr./Yr. % Chg. 25.6% 12.7% 2.1% 0.2% 12.8% 3.9% 12.1% 1.2% 33.3% 31.6%
Townhouses1,2,3
Listed Leased Leased Avg. Rent Leased Avg. Rent Leased Avg. Rent Leased Avg. Rent
Q1 2013 695 284 3 $1,417 26 $1,509 94 $1,889 161 $2,002
Q1 2012 588 276 3 $1,263 34 $1,403 73 $1,696 166 $1,933
Yr./Yr. % Chg. 18.2% 2.9% 0.0% 12.1% -23.5% 7.6% 28.8% 11.4% -3.0% 3.6%
Three-Bedroom
Bachelor One-Bedroom Two-Bedroom Three-Bedroom
All Bedroom Types Bachelor One-Bedroom
All Bedroom Types
Two-Bedroom
4,277
3,796
Q1 2013 Q1 2012
Total TorontoMLS
Apartment Rentals1,3
$1,597 $1,537
Q1 2013 Q1 2012
TorontoMLS
Avg. 1-Bdrm. Apt. Rent1,3
Real GDP Growth
i
Q4 2012 t 0.6%
Toronto Employment Growth
ii
February 2013 t 4.6%
Toronto Unemployment Rate
February 2013 t 8.4%
Inflation (Yr./Yr. CPI Growth)ii
January 2013 t 1.2%
Bank of Canada Overnight Rate
iii
March 2013 q 1.0%
Prime Rate
iv
March 2013 q 3.0%
Fixed 5-Year Mortgage Rateiii
March 2013 u 5.14%
S our c e s: S t a t ist ic s Ca na da ; Ba nk of Ca na da
Economic Indicators
5. Industrial Leasing
Page 3
5
Toronto Real Estate Board
Rental Market Report, First Quarter 2013
CITY OF TORONTO MUNICIPAL BREAKDOWN
Total Listed1
Total Leased2
Leased2
Avg. Lease Rate3
Leased2
Avg. Lease Rate3
Leased2
Avg. Lease Rate3
Leased2
Avg. Lease Rate3
TREB Total 695 284 3 $1,417 26 $1,509 94 $1,889 161 $2,002
City of Toronto Total 274 120 3 $1,417 16 $1,690 61 $2,100 40 $2,767
Toronto West 37 17 1 $850 2 $1,550 8 $1,687 6 $1,921
Toronto W01 8 5 1 $850 2 $1,550 1 $1,950 1 $2,700
Toronto W02 6 5 0 - 0 - 4 $1,631 1 $2,150
Toronto W03 0 0 0 - 0 - 0 - 0 -
Toronto W04 3 0 0 - 0 - 0 - 0 -
Toronto W05 3 2 0 - 0 - 1 $1,300 1 $1,200
Toronto W06 6 3 0 - 0 - 2 $1,863 1 $1,650
Toronto W07 0 0 0 - 0 - 0 - 0 -
Toronto W08 7 2 0 - 0 - 0 - 2 $1,913
Toronto W09 2 0 0 - 0 - 0 - 0 -
Toronto W10 2 0 0 - 0 - 0 - 0 -
Toronto Central 187 86 2 $1,700 14 $1,710 44 $2,295 26 $3,281
Toronto C01 65 33 0 - 6 $1,972 23 $2,278 4 $3,575
Toronto C02 9 5 0 - 0 - 3 $2,883 2 $5,250
Toronto C03 0 0 0 - 0 - 0 - 0 -
Toronto C04 1 1 0 - 0 - 0 - 1 $5,000
Toronto C06 1 0 0 - 0 - 0 - 0 -
Toronto C07 6 4 0 - 0 - 2 $1,998 2 $2,750
Toronto C08 20 9 2 $1,700 1 $1,600 6 $2,301 0 -
Toronto C09 3 1 0 - 0 - 0 - 1 $4,500
Toronto C10 1 1 0 - 1 $1,800 0 - 0 -
Toronto C11 3 1 0 - 0 - 0 - 1 $2,000
Toronto C12 10 4 0 - 0 - 1 $4,800 3 $3,633
Toronto C13 1 1 0 - 0 - 1 $1,550 0 -
Toronto C14 51 20 0 - 5 $1,431 6 $2,013 9 $2,972
Toronto C15 16 6 0 - 1 $1,550 2 $1,860 3 $1,950
Toronto East 50 17 0 - 0 - 9 $1,511 8 $1,734
Toronto E01 5 2 0 - 0 - 1 $2,400 1 $1,800
Toronto E02 1 1 0 - 0 - 0 - 1 $3,600
Toronto E03 0 0 0 - 0 - 0 - 0 -
Toronto E04 5 0 0 - 0 - 0 - 0 -
Toronto E05 11 4 0 - 0 - 3 $1,467 1 $1,520
Toronto E06 0 0 0 - 0 - 0 - 0 -
Toronto E07 3 0 0 - 0 - 0 - 0 -
Toronto E08 4 2 0 - 0 - 0 - 2 $1,625
Toronto E09 3 1 0 - 0 - 1 $1,400 0 -
Toronto E10 2 1 0 - 0 - 0 - 1 $1,100
Toronto E11 16 6 0 - 0 - 4 $1,350 2 $1,300
SUMMARY OF RENTAL TRANSACTIONS
TOWNHOUSES, FIRST QUARTER 2013
All Apartments Bachelor One-Bedroom Two-Bedroom Three-Bedroom
6. Industrial Leasing
Page 3
6
Toronto Real Estate Board
Rental Market Report, First Quarter 2013
13.7%
22.7%
23.6%
18.5%
8.7%
Halton Peel Toronto York Durham
Source: CMHC, 2012 Fall Rental Market Survey
Share of GTA Condo
Apartments InRental
0.5% 0.6%
1.4%
0.7%
0.0%
Halton Peel Toronto York Durham
Source: CMHC, 2012 Fall Rental Market Survey
GTA Condo Apartment
Vacancy Rate
NOTES
6
Bank of Canada, rates for most recently completed month.
1
Refers to the total number of rental units that were available during the reporting period.
2
Refers to firm lease transactions entered in the TorontoMLS system between the first and last day of the reporting period.
3
Refers to the average lease rate for firm lease transactions entered in the TorontoMLS system between the first and last day of the reporting period.
4
Statistics Canada, Quarter-over-quarter annualized growth rate.
5
Statistics Canada, Year-over-year growth rate.