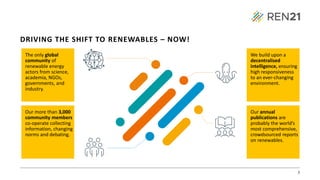
DRIVING THE SHIFTTO RENEWABLES – NOW!
Our annual
publications are
probably the world’s
most comprehensive,
crowdsourced reports
on renewables.
Our more than 3,000
community members
co-operate collecting
information, changing
norms and debating.
We build upon a
decentralised
intelligence, ensuring
high responsiveness
to an ever-changing
environment.
The only global
community of
renewable energy
actors from science,
academia, NGOs,
governments, and
industry.
3
4.
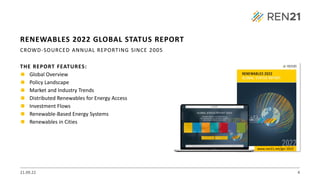
THE REPORT FEATURES:
◼Global Overview
◼ Policy Landscape
◼ Market and Industry Trends
◼ Distributed Renewables for Energy Access
◼ Investment Flows
◼ Renewable-Based Energy Systems
◼ Renewables in Cities
21.09.22 4
RENEWABLES 2022 GLOBAL STATUS REPORT
CROWD-SOURCED ANNUAL REPORTING SINCE 2005
www.ren21.net/gsr-2022
5.
5
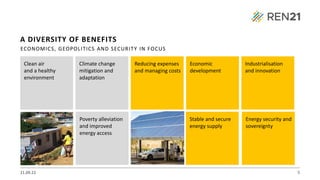
A DIVERSITY OFBENEFITS
Climate change
mitigation and
adaptation
Clean air
and a healthy
environment
Economic
development
Poverty alleviation
and improved
energy access
Reducing expenses
and managing costs
Stable and secure
energy supply
Energy security and
sovereignty
ECONOMICS, GEOPOLITICS AND SECURITY IN FOCUS
Industrialisation
and innovation
21.09.22
6.
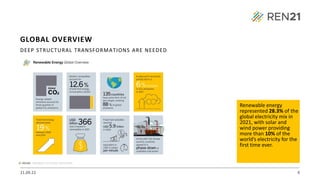
21.09.22 6
Renewable energy
represented28.3% of the
global electricity mix in
2021, with solar and
wind power providing
more than 10% of the
world’s electricity for the
first time ever.
GLOBAL OVERVIEW
DEEP STRUCTURAL TRANSFORMATIONS ARE NEEDED
7.
21.09.22 7
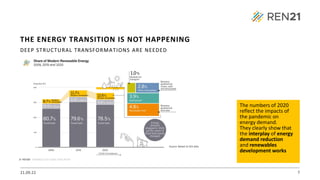
DEEP STRUCTURALTRANSFORMATIONS ARE NEEDED
THE ENERGY TRANSITION IS NOT HAPPENING
The numbers of 2020
reflect the impacts of
the pandemic on
energy demand.
They clearly show that
the interplay of energy
demand reduction
and renewables
development works
8.
21.09.22 8
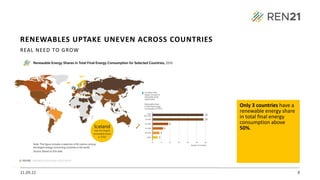
REAL NEEDTO GROW
Only 3 countries have a
renewable energy share
in total final energy
consumption above
50%.
RENEWABLES UPTAKE UNEVEN ACROSS COUNTRIES
9.
21.09.22 9
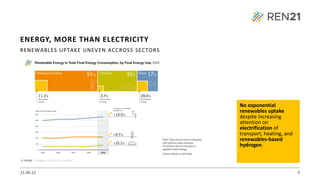
RENEWABLES UPTAKEUNEVEN ACCROSS SECTORS
No exponential
renewables uptake
despite increasing
attention on
electrification of
transport, heating, and
renewables-based
hydrogen.
ENERGY, MORE THAN ELECTRICITY
10.
21.09.22 10
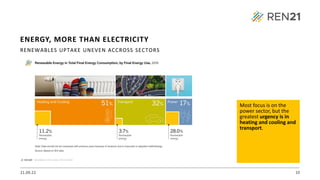
RENEWABLES UPTAKEUNEVEN ACCROSS SECTORS
Most focus is on the
power sector, but the
greatest urgency is in
heating and cooling and
transport.
ENERGY, MORE THAN ELECTRICITY
11.
21.09.22 11
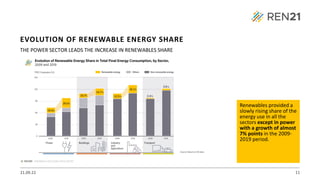
THE POWERSECTOR LEADS THE INCREASE IN RENEWABLES SHARE
Renewables provided a
slowly rising share of the
energy use in all the
sectors except in power
with a growth of almost
7% points in the 2009-
2019 period.
EVOLUTION OF RENEWABLE ENERGY SHARE
12.
21.09.22 12
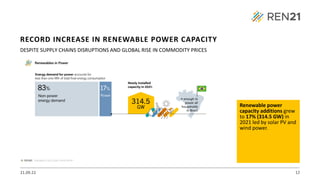
DESPITE SUPPLYCHAINS DISRUPTIONS AND GLOBAL RISE IN COMMODITY PRICES
Renewable power
capacity additions grew
to 17% (314.5 GW) in
2021 led by solar PV and
wind power.
RECORD INCREASE IN RENEWABLE POWER CAPACITY
13.
13
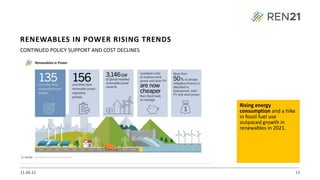
CONTINUED POLICY SUPPORTAND COST DECLINES
Rising energy
consumption and a hike
in fossil fuel use
outpaced growth in
renewables in 2021.
RENEWABLES IN POWER RISING TRENDS
21.09.22
14.
21.09.22 14
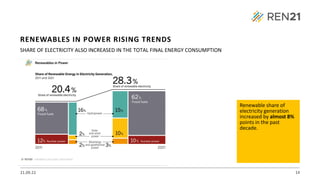
SHARE OFELECTRICITY ALSO INCREASED IN THE TOTAL FINAL ENERGY CONSUMPTION
Renewable share of
electricity generation
increased by almost 8%
points in the past
decade.
RENEWABLES IN POWER RISING TRENDS
15.
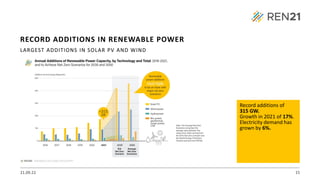
21.09.22 15
Record additionsof
315 GW.
Growth in 2021 of 17%.
Electricity demand has
grown by 6%.
RECORD ADDITIONS IN RENEWABLE POWER
LARGEST ADDITIONS IN SOLAR PV AND WIND
16.
21.09.22 16
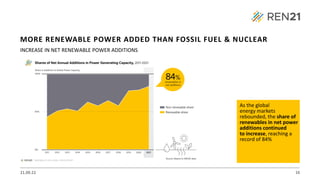
INCREASE INNET RENEWABLE POWER ADDITIONS
As the global
energy markets
rebounded, the share of
renewables in net power
additions continued
to increase, reaching a
record of 84%
MORE RENEWABLE POWER ADDED THAN FOSSIL FUEL & NUCLEAR
17.
21.09.22 17
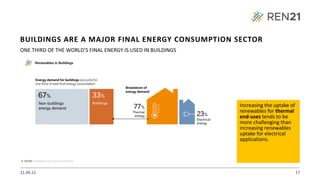
ONE THIRDOF THE WORLD’S FINAL ENERGY IS USED IN BUILDINGS
Increasing the uptake of
renewables for thermal
end-uses tends to be
more challenging than
increasing renewables
uptake for electrical
applications.
BUILDINGS ARE A MAJOR FINAL ENERGY CONSUMPTION SECTOR
18.
21.09.22 18
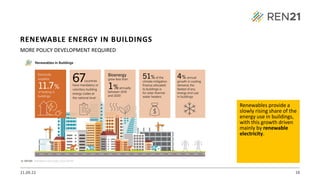
MORE POLICYDEVELOPMENT REQUIRED
Renewables provide a
slowly rising share of the
energy use in buildings,
with this growth driven
mainly by renewable
electricity.
RENEWABLE ENERGY IN BUILDINGS
19.
21.09.22 19
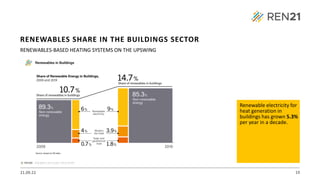
Renewable electricityfor
heat generation in
buildings has grown 5.3%
per year in a decade.
RENEWABLES SHARE IN THE BUILDINGS SECTOR
RENEWABLES-BASED HEATING SYSTEMS ON THE UPSWING
Source: based on IEA data
20.
21.09.22 20
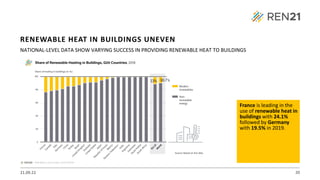
NATIONAL-LEVEL DATASHOW VARYING SUCCESS IN PROVIDING RENEWABLE HEAT TO BUILDINGS
France is leading in the
use of renewable heat in
buildings with 24.1%
followed by Germany
with 19.5% in 2019.
RENEWABLE HEAT IN BUILDINGS UNEVEN
21.
21.09.22 21
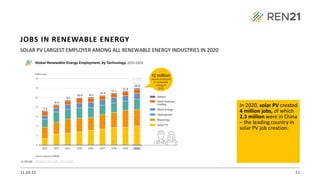
SOLAR PVLARGEST EMPLOYER AMONG ALL RENEWABLE ENERGY INDUSTRIES IN 2020
In 2020, solar PV created
4 million jobs, of which
2.3 million were in China
– the leading country in
solar PV job creation.
JOBS IN RENEWABLE ENERGY
22.
21.09.22 22
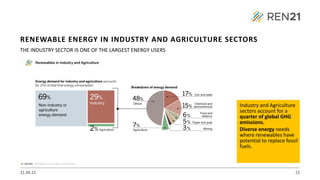
THE INDUSTRYSECTOR IS ONE OF THE LARGEST ENERGY USERS
Industry and Agriculture
sectors account for a
quarter of global GHG
emissions.
Diverse energy needs
where renewables have
potential to replace fossil
fuels.
RENEWABLE ENERGY IN INDUSTRY AND AGRICULTURE SECTORS
23.
21.09.22 23
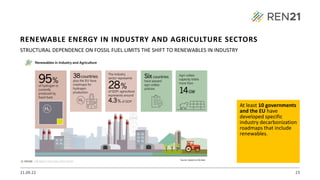
STRUCTURAL DEPENDENCEON FOSSIL FUEL LIMITS THE SHIFT TO RENEWABLES IN INDUSTRY
At least 10 governments
and the EU have
developed specific
industry decarbonization
roadmaps that include
renewables.
RENEWABLE ENERGY IN INDUSTRY AND AGRICULTURE SECTORS
Source: based on IEA data
24.
21.09.22 24
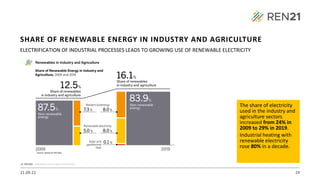
The shareof electricity
used in the industry and
agriculture sectors
increased from 24% in
2009 to 29% in 2019.
Industrial heating with
renewable electricity
rose 80% in a decade.
SHARE OF RENEWABLE ENERGY IN INDUSTRY AND AGRICULTURE
ELECTRIFICATION OF INDUSTRIAL PROCESSES LEADS TO GROWING USE OF RENEWABLE ELECTRICITY
Source: based on IEA data
25.
21.09.22 25
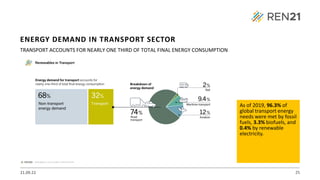
TRANSPORT ACCOUNTSFOR NEARLY ONE THIRD OF TOTAL FINAL ENERGY CONSUMPTION
As of 2019, 96.3% of
global transport energy
needs were met by fossil
fuels, 3.3% biofuels, and
0.4% by renewable
electricity.
ENERGY DEMAND IN TRANSPORT SECTOR
26.
21.09.22 26
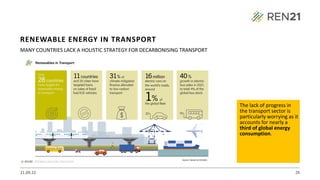
MANY COUNTRIESLACK A HOLISTIC STRATEGY FOR DECARBONISING TRANSPORT
The lack of progress in
the transport sector is
particularly worrying as it
accounts for nearly a
third of global energy
consumption.
RENEWABLE ENERGY IN TRANSPORT
Source: based on IEA data
27.
21.09.22 27
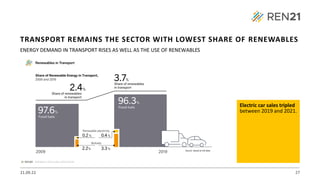
ENERGY DEMANDIN TRANSPORT RISES AS WELL AS THE USE OF RENEWABLES
Electric car sales tripled
between 2019 and 2021.
TRANSPORT REMAINS THE SECTOR WITH LOWEST SHARE OF RENEWABLES
Source: based on IEA data
28.
21.09.22 28
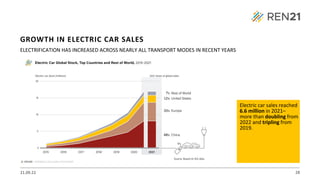
ELECTRIFICATION HASINCREASED ACROSS NEARLY ALL TRANSPORT MODES IN RECENT YEARS
Electric car sales reached
6.6 million in 2021–
more than doubling from
2022 and tripling from
2019.
GROWTH IN ELECTRIC CAR SALES
29.
21.09.22 29
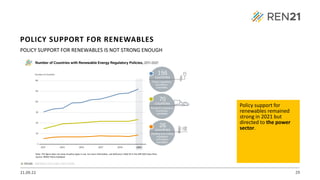
POLICY SUPPORTFOR RENEWABLES IS NOT STRONG ENOUGH
Policy support for
renewables remained
strong in 2021 but
directed to the power
sector.
POLICY SUPPORT FOR RENEWABLES
Note: The figure does not show all policy types in use. For more information, see Reference Table R3 in the GSR 2022 Data Pack.
Source: REN21 Policy Database
30.
21.09.22 30
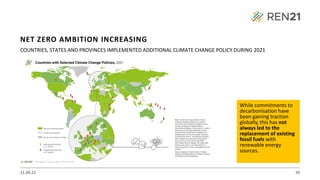
While commitmentsto
decarbonisation have
been gaining traction
globally, this has not
always led to the
replacement of existing
fossil fuels with
renewable energy
sources.
NET ZERO AMBITION INCREASING
COUNTRIES, STATES AND PROVINCES IMPLEMENTED ADDITIONAL CLIMATE CHANGE POLICY DURING 2021
31.
21.09.22 31
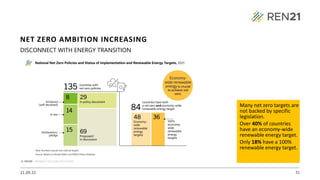
DISCONNECT WITHENERGY TRANSITION
Many net zero targets are
not backed by specific
legislation.
Over 40% of countries
have an economy-wide
renewable energy target.
Only 18% have a 100%
renewable energy target.
NET ZERO AMBITION INCREASING
32.
21.09.22 32
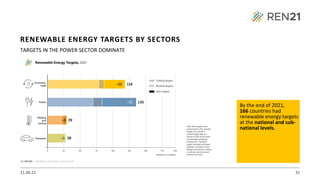
TARGETS INTHE POWER SECTOR DOMINATE
By the end of 2021,
166 countries had
renewable energy targets
at the national and sub-
national levels.
RENEWABLE ENERGY TARGETS BY SECTORS
33.
21.09.22 33
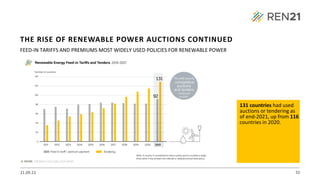
FEED-IN TARIFFSAND PREMIUMS MOST WIDELY USED POLICIES FOR RENEWABLE POWER
131 countries had used
auctions or tendering as
of end-2021, up from 116
countries in 2020.
THE RISE OF RENEWABLE POWER AUCTIONS CONTINUED
34.
21.09.22 34
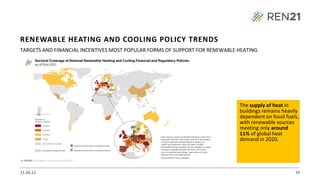
TARGETS ANDFINANCIAL INCENTIVES MOST POPULAR FORMS OF SUPPORT FOR RENEWABLE HEATING
The supply of heat in
buildings remains heavily
dependent on fossil fuels,
with renewable sources
meeting only around
11% of global heat
demand in 2020.
RENEWABLE HEATING AND COOLING POLICY TRENDS
35.
21.09.22 35
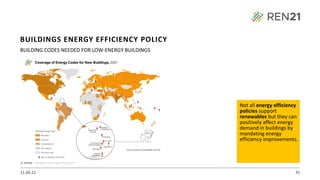
BUILDING CODESNEEDED FOR LOW-ENERGY BUILDINGS
Not all energy efficiency
policies support
renewables but they can
positively affect energy
demand in buildings by
mandating energy
efficiency improvements.
BUILDINGS ENERGY EFFICIENCY POLICY
36.
21.09.22 36
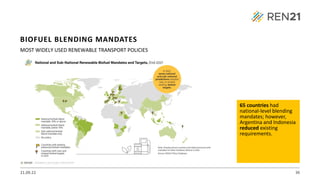
MOST WIDELYUSED RENEWABLE TRANSPORT POLICIES
65 countries had
national-level blending
mandates; however,
Argentina and Indonesia
reduced existing
requirements.
BIOFUEL BLENDING MANDATES
37.
21.09.22 37
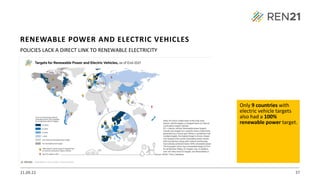
POLICIES LACKA DIRECT LINK TO RENEWABLE ELECTRICITY
Only 9 countries with
electric vehicle targets
also had a 100%
renewable power target.
RENEWABLE POWER AND ELECTRIC VEHICLES
Source: REN21 Policy Database
38.
21.09.22 38
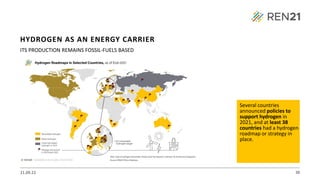
ITS PRODUCTIONREMAINS FOSSIL-FUELS BASED
Several countries
announced policies to
support hydrogen in
2021, and at least 38
countries had a hydrogen
roadmap or strategy in
place.
HYDROGEN AS AN ENERGY CARRIER
39.
21.09.22 39
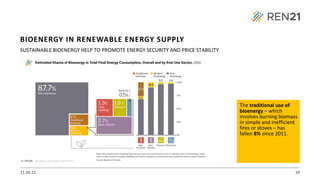
SUSTAINABLE BIOENERGYHELP TO PROMOTE ENERGY SECURITY AND PRICE STABILITY
The traditional use of
bioenergy – which
involves burning biomass
in simple and inefficient
fires or stoves – has
fallen 8% since 2011.
BIOENERGY IN RENEWABLE ENERGY SUPPLY
40.
21.09.22 40
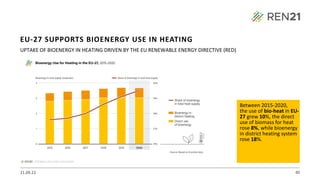
UPTAKE OFBIOENERGY IN HEATING DRIVEN BY THE EU RENEWABLE ENERGY DIRECTIVE (RED)
Between 2015-2020,
the use of bio-heat in EU-
27 grew 10%, the direct
use of biomass for heat
rose 8%, while bioenergy
in district heating system
rose 18%.
EU-27 SUPPORTS BIOENERGY USE IN HEATING
41.
21.09.22 41
GLOBAL PRODUCTIONOF BIODIESEL NEARLY DOUBLED BETWEEN 2011 AND 2021
Between 2011 and 2021,
the production of
transport biofuels grew
56% (in energy terms),
from 2.6 EJ to 4.1 EJ.
BIOFUEL PRODUCTION INCREASED
42.
21.09.22 42
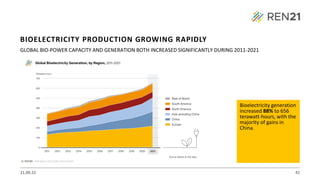
GLOBAL BIO-POWERCAPACITY AND GENERATION BOTH INCREASED SIGNIFICANTLY DURING 2011-2021
Bioelectricity generation
increased 88% to 656
terawatt-hours, with the
majority of gains in
China.
BIOELECTRICITY PRODUCTION GROWING RAPIDLY
43.
21.09.22 43
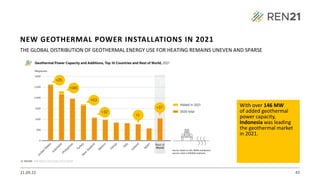
THE GLOBALDISTRIBUTION OF GEOTHERMAL ENERGY USE FOR HEATING REMAINS UNEVEN AND SPARSE
With over 146 MW
of added geothermal
power capacity,
Indonesia was leading
the geothermal market
in 2021.
NEW GEOTHERMAL POWER INSTALLATIONS IN 2021
Source: based on IEA, IRENA and diverse
sources cited in GSR2022 endnotes.
44.
21.09.22 44
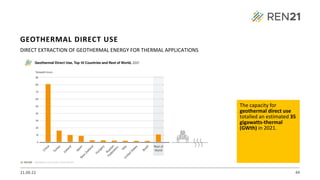
DIRECT EXTRACTIONOF GEOTHERMAL ENERGY FOR THERMAL APPLICATIONS
The capacity for
geothermal direct use
totalled an estimated 35
gigawatts-thermal
(GWth) in 2021.
GEOTHERMAL DIRECT USE
45.
21.09.22 45
EXTRACTING HEATFROM AN AMBIENT HEAT SOURCE
Heat pumps met only
around 7% of the global
heating demand in
residential buildings.
Fossil fuel-powered
heaters and water
heaters still accounted
for around half of the
heating equipment sold.
HEAT PUMPS OPERATIONAL PRINCIPLES
46.
21.09.22 46
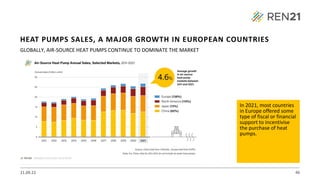
GLOBALLY, AIR-SOURCEHEAT PUMPS CONTINUE TO DOMINATE THE MARKET
In 2021, most countries
in Europe offered some
type of fiscal or financial
support to incentivise
the purchase of heat
pumps.
HEAT PUMPS SALES, A MAJOR GROWTH IN EUROPEAN COUNTRIES
47.
21.09.22 47
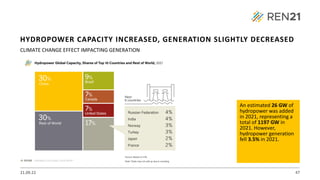
CLIMATE CHANGEEFFECT IMPACTING GENERATION
An estimated 26 GW of
hydropower was added
in 2021, representing a
total of 1197 GW in
2021. However,
hydropower generation
fell 3.5% in 2021.
HYDROPOWER CAPACITY INCREASED, GENERATION SLIGHTLY DECREASED
48.
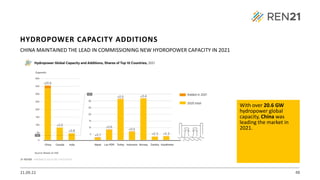
21.09.22 48
CHINA MAINTAINEDTHE LEAD IN COMMISSIONING NEW HYDROPOWER CAPACITY IN 2021
With over 20.6 GW
hydropower global
capacity, China was
leading the market in
2021.
HYDROPOWER CAPACITY ADDITIONS
49.
21.09.22 49
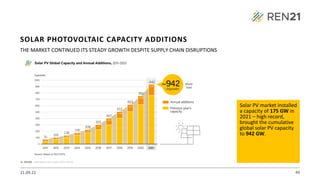
THE MARKETCONTINUED ITS STEADY GROWTH DESPITE SUPPLY CHAIN DISRUPTIONS
Solar PV market installed
a capacity of 175 GW in
2021 – high record,
brought the cumulative
global solar PV capacity
to 942 GW.
SOLAR PHOTOVOLTAIC CAPACITY ADDITIONS
50.
21.09.22 50
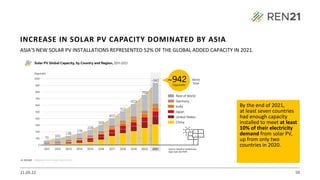
ASIA’S NEWSOLAR PV INSTALLATIONS REPRESENTED 52% OF THE GLOBAL ADDED CAPACITY IN 2021.
By the end of 2021,
at least seven countries
had enough capacity
installed to meet at least
10% of their electricity
demand from solar PV,
up from only two
countries in 2020.
INCREASE IN SOLAR PV CAPACITY DOMINATED BY ASIA
Source: based on preliminary
data from IEA PVPS
51.
21.09.22 51
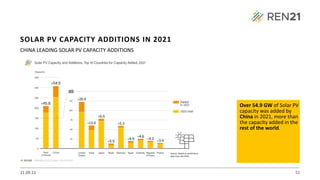
CHINA LEADINGSOLAR PV CAPACITY ADDITIONS
Over 54.9 GW of Solar PV
capacity was added by
China in 2021, more than
the capacity added in the
rest of the world.
SOLAR PV CAPACITY ADDITIONS IN 2021
Source: based on preliminary
data from IEA PVPS
52.
21.09.22 52
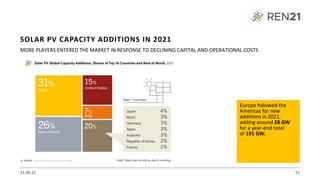
MORE PLAYERSENTERED THE MARKET IN RESPONSE TO DECLINING CAPITAL AND OPERATIONAL COSTS
Europe followed the
Americas for new
additions in 2021,
adding around 28 GW
for a year-end total
of 191 GW.
SOLAR PV CAPACITY ADDITIONS IN 2021
53.
21.09.22 53
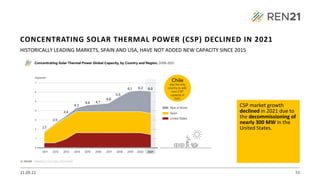
HISTORICALLY LEADINGMARKETS, SPAIN AND USA, HAVE NOT ADDED NEW CAPACITY SINCE 2015
CSP market growth
declined in 2021 due to
the decommissioning of
nearly 300 MW in the
United States.
CONCENTRATING SOLAR THERMAL POWER (CSP) DECLINED IN 2021
54.
21.09.22 54
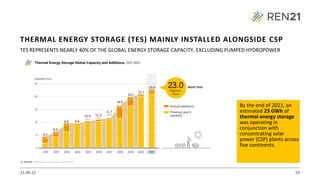
TES REPRESENTSNEARLY 40% OF THE GLOBAL ENERGY STORAGE CAPACITY, EXCLUDING PUMPED HYDROPOWER
By the end of 2021, an
estimated 23 GWh of
thermal energy storage
was operating in
conjunction with
concentrating solar
power (CSP) plants across
five continents.
THERMAL ENERGY STORAGE (TES) MAINLY INSTALLED ALONGSIDE CSP
55.
21.09.22 55
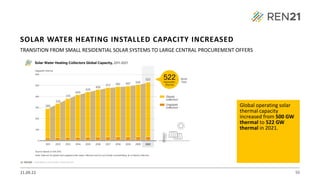
TRANSITION FROMSMALL RESIDENTIAL SOLAR SYSTEMS TO LARGE CENTRAL PROCUREMENT OFFERS
Global operating solar
thermal capacity
increased from 500 GW
thermal to 522 GW
thermal in 2021.
SOLAR WATER HEATING INSTALLED CAPACITY INCREASED
56.
21.09.22 56
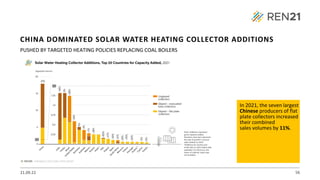
PUSHED BYTARGETED HEATING POLICIES REPLACING COAL BOILERS
In 2021, the seven largest
Chinese producers of flat
plate collectors increased
their combined
sales volumes by 11%.
CHINA DOMINATED SOLAR WATER HEATING COLLECTOR ADDITIONS
57.
21.09.22 57
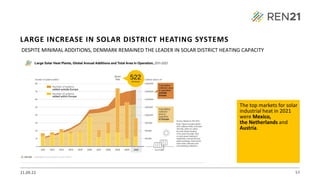
DESPITE MINIMALADDITIONS, DENMARK REMAINED THE LEADER IN SOLAR DISTRICT HEATING CAPACITY
The top markets for solar
industrial heat in 2021
were Mexico,
the Netherlands and
Austria.
LARGE INCREASE IN SOLAR DISTRICT HEATING SYSTEMS
58.
21.09.22 58
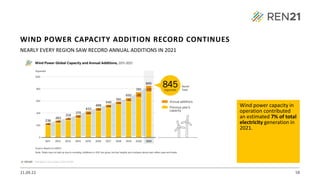
NEARLY EVERYREGION SAW RECORD ANNUAL ADDITIONS IN 2021
Wind power capacity in
operation contributed
an estimated 7% of total
electricity generation in
2021.
WIND POWER CAPACITY ADDITION RECORD CONTINUES
59.
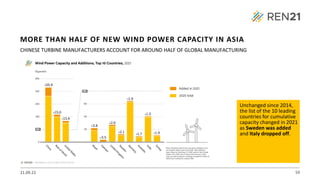
21.09.22 59
CHINESE TURBINEMANUFACTURERS ACCOUNT FOR AROUND HALF OF GLOBAL MANUFACTURING
Unchanged since 2014,
the list of the 10 leading
countries for cumulative
capacity changed in 2021
as Sweden was added
and Italy dropped off.
MORE THAN HALF OF NEW WIND POWER CAPACITY IN ASIA
60.
21.09.22 60
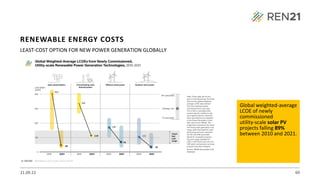
LEAST-COST OPTIONFOR NEW POWER GENERATION GLOBALLY
Global weighted-average
LCOE of newly
commissioned
utility-scale solar PV
projects falling 89%
between 2010 and 2021.
RENEWABLE ENERGY COSTS
61.
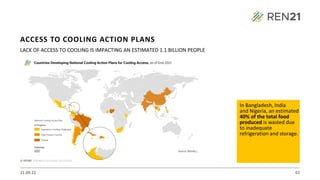
21.09.22 61
LACK OFACCESS TO COOLING IS IMPACTING AN ESTIMATED 1.1 BILLION PEOPLE
In Bangladesh, India
and Nigeria, an estimated
40% of the total food
produced is wasted due
to inadequate
refrigeration and storage.
ACCESS TO COOLING ACTION PLANS
62.
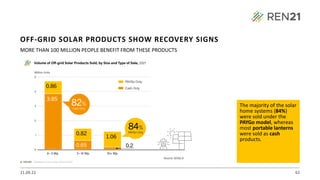
21.09.22 62
MORE THAN100 MILLION PEOPLE BENEFIT FROM THESE PRODUCTS
The majority of the solar
home systems (84%)
were sold under the
PAYGo model, whereas
most portable lanterns
were sold as cash
products.
OFF-GRID SOLAR PRODUCTS SHOW RECOVERY SIGNS
63.
21.09.22 63
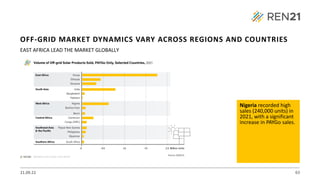
EAST AFRICALEAD THE MARKET GLOBALLY
Nigeria recorded high
sales (240,000 units) in
2021, with a significant
increase in PAYGo sales.
OFF-GRID MARKET DYNAMICS VARY ACROSS REGIONS AND COUNTRIES
64.
21.09.22 64
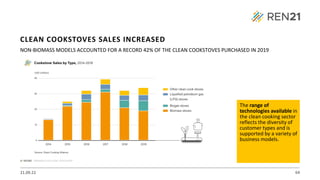
NON-BIOMASS MODELSACCOUNTED FOR A RECORD 42% OF THE CLEAN COOKSTOVES PURCHASED IN 2019
The range of
technologies available in
the clean cooking sector
reflects the diversity of
customer types and is
supported by a variety of
business models.
CLEAN COOKSTOVES SALES INCREASED
65.
21.09.22 65
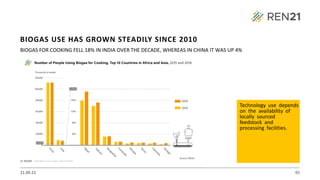
BIOGAS FORCOOKING FELL 18% IN INDIA OVER THE DECADE, WHEREAS IN CHINA IT WAS UP 4%
Technology use depends
on the availability of
locally sourced
feedstock and
processing facilities.
BIOGAS USE HAS GROWN STEADILY SINCE 2010
66.
21.09.22 66
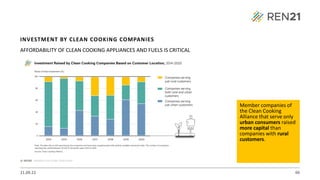
AFFORDABILITY OFCLEAN COOKING APPLIANCES AND FUELS IS CRITICAL
Member companies of
the Clean Cooking
Alliance that serve only
urban consumers raised
more capital than
companies with rural
customers.
INVESTMENT BY CLEAN COOKING COMPANIES
67.
21.09.22 67
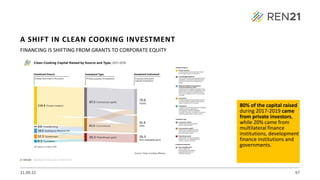
FINANCING ISSHIFTING FROM GRANTS TO CORPORATE EQUITY
80% of the capital raised
during 2017-2019 came
from private investors,
while 20% came from
multilateral finance
institutions, development
finance institutions and
governments.
A SHIFT IN CLEAN COOKING INVESTMENT
68.
21.09.22 68
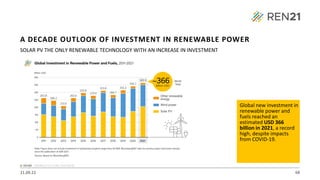
SOLAR PVTHE ONLY RENEWABLE TECHNOLOGY WITH AN INCREASE IN INVESTMENT
Global new investment in
renewable power and
fuels reached an
estimated USD 366
billion in 2021, a record
high, despite impacts
from COVID-19.
A DECADE OUTLOOK OF INVESTMENT IN RENEWABLE POWER
69.
21.09.22 69
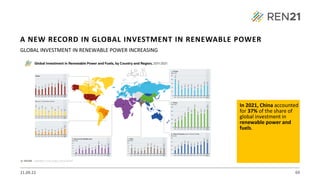
GLOBAL INVESTMENTIN RENEWABLE POWER INCREASING
In 2021, China accounted
for 37% of the share of
global investment in
renewable power and
fuels.
A NEW RECORD IN GLOBAL INVESTMENT IN RENEWABLE POWER
70.
21.09.22 70
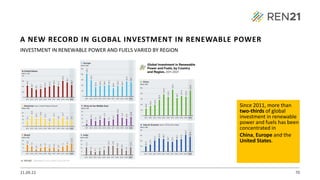
INVESTMENT INRENEWABLE POWER AND FUELS VARIED BY REGION
Since 2011, more than
two-thirds of global
investment in renewable
power and fuels has been
concentrated in
China, Europe and the
United States.
A NEW RECORD IN GLOBAL INVESTMENT IN RENEWABLE POWER
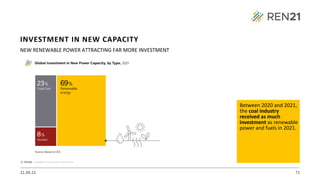
71.
21.09.22 71
NEW RENEWABLEPOWER ATTRACTING FAR MORE INVESTMENT
Between 2020 and 2021,
the coal industry
received as much
investment as renewable
power and fuels in 2021.
INVESTMENT IN NEW CAPACITY
72.
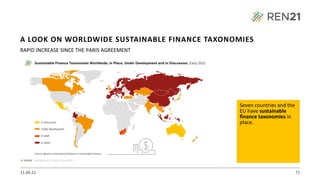
21.09.22 72
RAPID INCREASESINCE THE PARIS AGREEMENT
Seven countries and the
EU have sustainable
finance taxonomies in
place.
A LOOK ON WORLDWIDE SUSTAINABLE FINANCE TAXONOMIES
73.
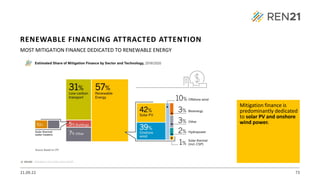
21.09.22 73
MOST MITIGATIONFINANCE DEDICATED TO RENEWABLE ENERGY
Mitigation finance is
predominantly dedicated
to solar PV and onshore
wind power.
RENEWABLE FINANCING ATTRACTED ATTENTION
74.
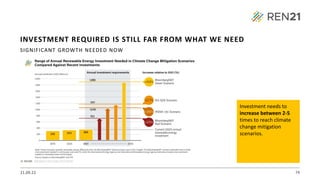
21.09.22 74
SIGNIFICANT GROWTHNEEDED NOW
Investment needs to
increase between 2-5
times to reach climate
change mitigation
scenarios.
INVESTMENT REQUIRED IS STILL FAR FROM WHAT WE NEED
75.
21.09.22 75
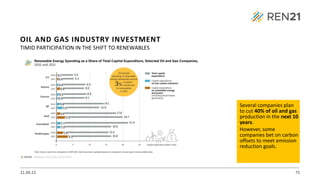
TIMID PARTICIPATIONIN THE SHIFT TO RENEWABLES
Several companies plan
to cut 40% of oil and gas
production in the next 10
years.
However, some
companies bet on carbon
offsets to meet emission
reduction goals.
OIL AND GAS INDUSTRY INVESTMENT
76.
21.09.22 76
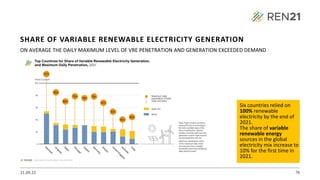
ON AVERAGETHE DAILY MAXIMUM LEVEL OF VRE PENETRATION AND GENERATION EXCEEDED DEMAND
Six countries relied on
100% renewable
electricity by the end of
2021.
The share of variable
renewable energy
sources in the global
electricity mix increase to
10% for the first time in
2021.
SHARE OF VARIABLE RENEWABLE ELECTRICITY GENERATION
77.
21.09.22 77
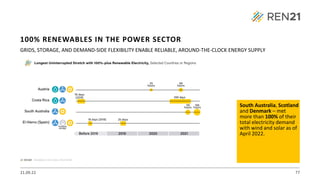
GRIDS, STORAGE,AND DEMAND-SIDE FLEXIBILITY ENABLE RELIABLE, AROUND-THE-CLOCK ENERGY SUPPLY
South Australia, Scotland
and Denmark – met
more than 100% of their
total electricity demand
with wind and solar as of
April 2022.
100% RENEWABLES IN THE POWER SECTOR
78.
21.09.22 78
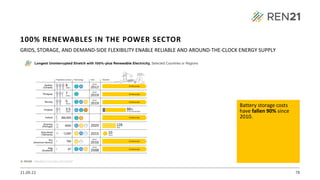
GRIDS, STORAGE,AND DEMAND-SIDE FLEXIBILITY ENABLE RELIABLE AND AROUND-THE-CLOCK ENERGY SUPPLY
Battery storage costs
have fallen 90% since
2010.
100% RENEWABLES IN THE POWER SECTOR
79.
21.09.22 79
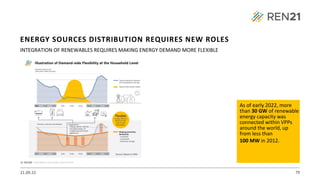
INTEGRATION OFRENEWABLES REQUIRES MAKING ENERGY DEMAND MORE FLEXIBLE
As of early 2022, more
than 30 GW of renewable
energy capacity was
connected within VPPs
around the world, up
from less than
100 MW in 2012.
ENERGY SOURCES DISTRIBUTION REQUIRES NEW ROLES
80.
21.09.22 80
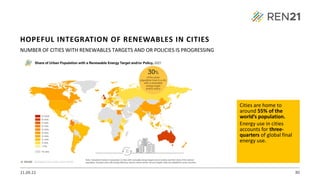
NUMBER OFCITIES WITH RENEWABLES TARGETS AND OR POLICIES IS PROGRESSING
Cities are home to
around 55% of the
world’s population.
Energy use in cities
accounts for three-
quarters of global final
energy use.
HOPEFUL INTEGRATION OF RENEWABLES IN CITIES
81.
21.09.22 81
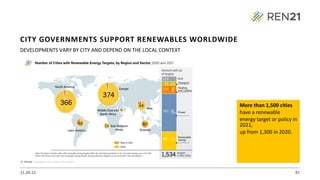
DEVELOPMENTS VARYBY CITY AND DEPEND ON THE LOCAL CONTEXT
More than 1,500 cities
have a renewable
energy target or policy in
2021,
up from 1,300 in 2020.
CITY GOVERNMENTS SUPPORT RENEWABLES WORLDWIDE
82.
21.09.22 82
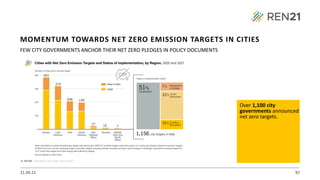
FEW CITYGOVERNMENTS ANCHOR THEIR NET ZERO PLEDGES IN POLICY DOCUMENTS
Over 1,100 city
governments announced
net zero targets.
MOMENTUM TOWARDS NET ZERO EMISSION TARGETS IN CITIES
83.
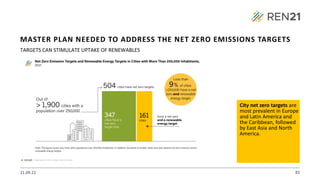
21.09.22 83
TARGETS CANSTIMULATE UPTAKE OF RENEWABLES
City net zero targets are
most prevalent in Europe
and Latin America and
the Caribbean, followed
by East Asia and North
America.
MASTER PLAN NEEDED TO ADDRESS THE NET ZERO EMISSIONS TARGETS
84.
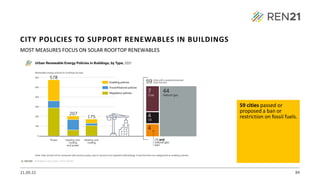
21.09.22 84
MOST MEASURESFOCUS ON SOLAR ROOFTOP RENEWABLES
59 cities passed or
proposed a ban or
restriction on fossil fuels.
CITY POLICIES TO SUPPORT RENEWABLES IN BUILDINGS
85.
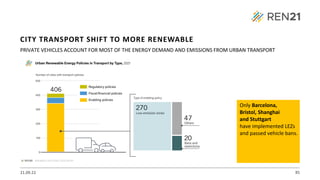
21.09.22 85
PRIVATE VEHICLESACCOUNT FOR MOST OF THE ENERGY DEMAND AND EMISSIONS FROM URBAN TRANSPORT
Only Barcelona,
Bristol, Shanghai
and Stuttgart
have implemented LEZs
and passed vehicle bans.
CITY TRANSPORT SHIFT TO MORE RENEWABLE
86.
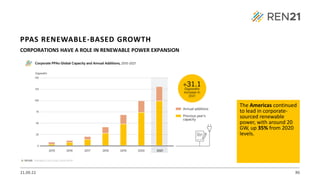
21.09.22 86
CORPORATIONS HAVEA ROLE IN RENEWABLE POWER EXPANSION
The Americas continued
to lead in corporate-
sourced renewable
power, with around 20
GW, up 35% from 2020
levels.
PPAS RENEWABLE-BASED GROWTH