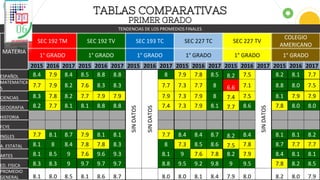
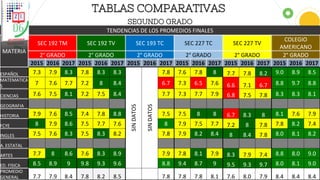
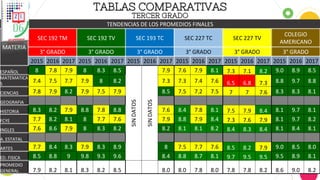
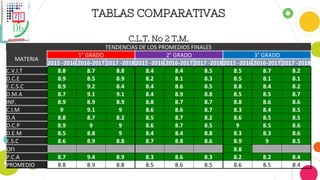
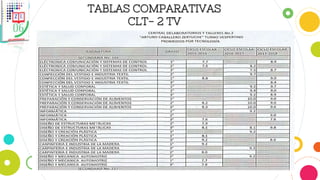
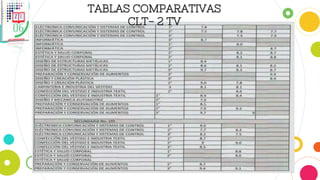
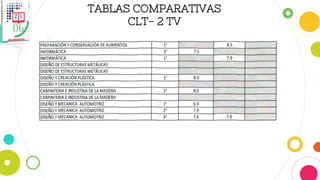
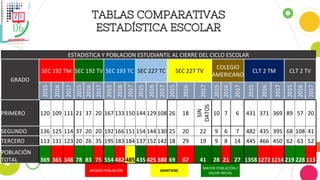
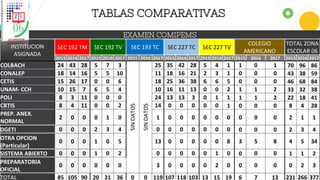
A gantt chart is a common tool for project planning and keeping track of the status of individual tasks within a project. This type of chart was invented in 1910 by a mechanical engineer named Henry Gantt, and there are now a great many software tools that use gantt charts in project planning. Excel is a popular tool for creating Gantt charts, but for more advanced project management activities, you may need a tool such as Microsoft Project or a project management add-in for Excel.
Here is template to create a gantt chart in excel.
This document contains graphs showing the percentages of approval for the first bimester of the morning shift at Escuela Secundaria Técnica 6. It includes approval rates for each subject (Spanish, English, Math, Science, etc.) for each grade level (1st, 2nd, 3rd) and section (A, B, C, etc.). Overall approval rates ranged from around 70-100% across grade levels and subjects.
This document contains graphs and tables summarizing student approval percentages for various subjects in the 1st trimester of the 2017-2018 school year at Escuela Secundaria Técnica 6 in Querétaro, Mexico. Approval percentages are shown for groups 1G through 1K in subjects like Spanish, English, Math, Science, Technology, History, Geography, Physical Education and Arts. Approval rates ranged from around 70-100% across subjects and groups.
This document appears to contain academic performance data for multiple students across various subjects for the first trimester. It includes percentages for each subject as well as overall averages for groups of students designated by letters and numbers. The data is organized by grade, group, and individual subjects with percentages of approval and grades provided.
Avances en individual, Primer bimestres. EST6 Querétaro.Usebeq
The document provides statistics on student performance in the first bimester of the 2015 school year for a technical secondary school in Mexico. It includes enrollment numbers, attendance rates, and average grades by subject for each of the school's six grades. Overall, attendance rates across grades and subjects averaged around 95% with average grades between 7 and 8 out of 10. The lowest attendance and grades were in the first grade.
The document contains data from a land survey of an area called Jinquinapata located in San Sebastian district, Cusco province, Cusco region of Peru. It lists the manzana (block) numbers, corresponding area in square meters for each block, and a summary table with the total area surveyed being 2996.80 square meters. It also includes a reference to a land subdivision plan with a scale of 1/200.
This document contains a table listing students' grades in various subjects like math, geography, biology, chemistry, physics, and their overall average. The grades are on a scale of 0 to 10. The table ranks the students from 1st to 57th place based on their overall average. It shows the student identification codes, individual subject grades, and final ranking.
PRESENTACION DE CASO CLINICO. EPILEPSIA (1).pptx559z9tc9rq
The document appears to be a medical case report in Spanish. It includes sections for patient identification, current complaints, vital signs, physical exam findings, diagnostic possibilities, lab results, suspected diagnosis, treatment timeline and follow up, and trends in lab values like Proteina C Reactiva (PCR), cardiac enzymes, blood counts, chemistries, electrolytes, and liver function tests over time. The labs show initially elevated PCR, CK and CK-MB that improved but other abnormalities in blood counts and chemistries that fluctuated over the hospitalization.
The use of waveform cross correlation for creation of an accurate catalogue o...Ivan Kitov
Page 3
In the current study of mining activity within the Russian platform, we use the advantages of location and historical bulletins/catalogues of mining explosions recorded by small-aperture seismic array Mikhnevo (MHVAR). The Institute of Geospheres Dynamics (IDG) of the Russian Academy of Sciences runs seismic array MHVAR (54.950N; 37.767E) since 2004.
Small-aperture seismic array “Mikhnevo” includes ten vertical stations (solid triangles), with one station in the geometrical centre of the array (C00) and other nine stations distributed over three circles with radii of 130 m, 320 m, and 600 m. The array aperture in approximately 1.1 km. Two 3C stations (solid triangles in circles) were added to the outer circle in order to improve the overall stations sensitivity (detection threshold) and resolution. All stations are equipped with short-period seismometers SM3-KV, which are characterized by flat response between 0.8 Hz and 30 Hz and gain of 180,000 [Vs/m]. Later, a 3C broad band station (BB) was installed in the centre of the array for surface wave measurements. The array response function (only for 12 vertical channels) is similar to that for many small-aperture arrays. Such arrays are designed to measure high-frequency signals from regional and near-regional sources with magnitudes above 1.5-2.0.
Page 4
MHVAR detects regional seismic phases (Pn, Sn, Lg, Rg) from various sources. Figure shows some selected waveforms with source-station distance decreasing up-down. Correspondingly the length of records decreases – for the closest mines it’s harder to distinguish between P and S phases.
Page 5
More than 50 areas at regional and near regional distances with different levels of mining activity have been identified by MHVAR. Since 2004, thousands of events have been reported in the IDG seismic catalogue as mining explosions. The IDG publishes this mining event catalogue as a part of the annual issues of “Earthquakes in Russia”, which is available for the broader geophysical community. The map shows several selected mines at near-regional distances where MHVAR successfully detects events with magnitudes 1.0 and lower. We also show a few selected mines at regional distances with the largest events of magnitude (ML) 2.0 and above. Such events should be also detected by IMS arrays. Joint interpretation of signals detected by MHVAR and IMS arrays allows significant improvements in signal detection, location, characterization and identification of events in the IDG catalogue when the historical data are revisited. The work on joint analysis of the IDG and IMS data is possible under the “Contract for limited access to IMS data and IDC products” between the CTBTO and IDG, which allows obtaining data through 2011.
To begin with, we have chosen blasts with larger magnitudes from well-known ironstone mine Mikhailovskiy (red circle), which is situated at regional distances somewhere between MHVAR (~330 km) and IMS array AKASG
This document summarizes student performance and approval rates across subjects and grades for the 4th quarter of the school year. Overall, average student grades were 7.8 and the approval rate was 91%. By grade, approval rates ranged from 83.1% for 1st grade morning students to 96.1% for 3rd grade morning students. Performance was also shown by subject, with averages of 93.9% in Science and 98.6% in Art.
St st pipe_pressure_rating_charts_rev_sep_2010setyopermadi
This document provides allowable working pressure tables for stainless steel grade 304 seamless pipes according to ASTM A 312. It lists the design strength and allowable working pressures in megapascals at different temperatures for various pipe sizes and schedules. Notes are provided regarding the calculation method, applicability to piping classes, and additional factors that must be considered for welded pipes. Conversion factors are also listed to convert pressures to other common units.
Modeling Monthly Rainfall Records in Arid Zones Using Markov Chains: Saudi Ar...Amro Elfeki
Modeling Monthly Rainfall Records in Arid Zones Using Markov Chains: Saudi Arabia Case Study, the 4th International Conference on Water Resources and Arid Environments, December, 2010, pp.141-146.
The document appears to contain the results of students in various subjects in the 2nd grade of school. It lists each student's coded identification number along with their grades in different subjects such as Biology, Math, Physics, Literature and more. The grades range from 0 to 10 with the average grade for each student calculated at the end. Based on their average, the students are classified and ranked, with the highest performing students ranked at the top.
The document appears to contain the results of students in various subjects in the 2nd grade of school. It lists each student's coded identification number along with their grades in different subjects such as Biology, Math, Physics, Literature and more. The grades range from 0 to 10 with the highest performing students at the top in terms of overall average and the lowest at the bottom.
The document appears to be a list of numbers from 1.1 to 60.9 organized in rows of 9 numbers each across 60 sections. There is no other contextual information provided.
The document shows the grades of a student in different subjects across 5 grading periods (1°BIM to 5°BIM). The student scored highest in subjects like Artistic Education and Physical Education, averaging between 8-9. Core subjects like Spanish, Math, and Sciences were steady around 6. Overall the student maintained an average grade of 6.7.
Cover story in December 2015's Winning Edge magazine from ISMM. How Pete Jenkins of Gamification+ used the gamification in CRM.me to help a start up smash their monthly sales targets.
1. The document contains an economics test with two sections - Macroeconomics and questions related to circular flow, multipliers, autonomous investments, effective demand, unemployment and differences between classical and Keynesian theories.
2. Section A contains three compulsory questions - the first asks to identify business cycles in economic indicators over 32 quarters and recommend measures for the economy. The second calculates total national income after 10 years using a government investment multiplier. The third evaluates costs and benefits of expanding production capacity.
3. Section B asks to attempt any five of seven questions worth 10 marks each, explaining economic concepts like circular flow, multipliers, demonstration and peak income effects, and differences between classical and Keynesian theories.
The document contains 3 tables with measurements in 15 columns and 20 rows. Each table contains numeric values that appear to be measurements of some kind. The high level information is that the document contains raw numeric data organized into 3 tables.
This document appears to be a record of grades for students in a Physics 1 class. It lists the students' scores on 5 practical exams and quizzes throughout the semester. It then calculates their total quiz score, total practical exam score, and final grade deficit. The grades range from 0 to 20 points for each assessment. The document shows the progress of 14 students in the class throughout the semester.
Modelling monthly rainfall time series using Markov ChainsAmro Elfeki
Modeling Monthly Rainfall Records in Arid Zones Using Markov Chains: Saudi Arabia Case Study, the 4th International Conference on Water Resources and Arid Environments, December, 2010, pp.141-146.
Encuesta a niños y adolescentes sobre la radio y televisión peruana 2014 | Po...Andrinik Huaytalla Ramos
Encuesta realizada por el Consejo Consultivo de Radio y Televisión (Concortv) a niños y adolescentes sobre la radio y televisión peruana 2014. Encuesta por ciudades.
Educación Mediática ► http://www.mundoacesp.org/
The document presents a time series analysis and forecasting of monthly yields on US Treasury securities. It describes taking the first difference and seasonal difference of the time series data to make it stationary, as tests showed the original data was non-stationary. ARIMA modeling was used to adaptively form an appropriate model based on the stationary data. The analysis was conducted in R using functions like boxcox, adf.test, kpss.test, decompose and plots to examine the data, identify patterns of trend and seasonality, and check for stationarity.
The document provides statistics from the Karate1 Series A competition held in Santiago, Chile from January 10-12, 2020. It lists entries from 56 countries totaling 412 competitors, including 172 male and 240 female entries. The statistics include a breakdown of entries by category and the number of participating teams.
The document discusses performance-based procurement for building projects. It provides examples of how owners can define project goals and energy targets to guide design teams. Key aspects include categorizing goals as mission critical, highly desirable, or possible; setting clear and adjustable energy use targets; and establishing modeling guidelines and schedules for design teams to validate performance goals are met. The intent is to accelerate high performance building outcomes through the procurement process.
This document contains technical specifications for structural elements including their dimensions, material properties, and connections. It lists 28 structural elements, providing the x, y, z coordinates of their connections, their lengths, cross-sectional areas, moments of inertia, and other properties. It also defines the modulus of elasticity, total loaded area, and other constants for the structural model.
Simulation of a cstr model for thevetia peruviana oil transesterification in theIAEME Publication
The document presents a mathematical model that was simulated for a Continuous Stirred Tank Reactor (CSTR) to model the transesterification of Thevetia peruviana oil into biodiesel. The model uses kinetic parameters from a previous study on the transesterification reaction. Differential equations were derived to describe the change in concentrations of triglycerides, diglycerides, and other components over time. The equations were solved using Laplace transforms and the results were analyzed using MATLAB to predict reactor dimensions and product volumes at different time intervals based on the kinetic parameters.
The document appears to contain the results of student grades in various subjects in the 3rd grade. It lists student codes, grades for 14 subjects from 0 to 10, and an overall grade average. The highest average was 8.7 and the lowest was 5.8. Grades covered a wide range, with some students scoring 10 in many subjects and others scoring 0 or 1.
Libro con efemerides y festivales escolares mas importantesDavid Mrs
El documento presenta un audiolibro sobre efemérides y festividades escolares que incluye 81 canciones y 22 reseñas y poemas. Incluye contenido sobre el Himno Nacional, Los Niños Héroes, la Independencia de México, el Encuentro de dos Mundos, las Naciones Unidas, el Día de Muertos, la Revolución, la Navidad, los Reyes Magos, la Constitución, la Amistad, los Honores a la Bandera, el Día del Ejército, la Bandera, la Expropiación
Este documento presenta el Marco para la Convivencia Escolar en las escuelas secundarias del Distrito Federal para el año escolar 2019-2020. El marco busca promover un ambiente seguro y ordenado en las escuelas mediante el respeto mutuo entre estudiantes, maestros, padres y personal de la escuela. Incluye una Carta de Derechos y Deberes de los Estudiantes, Acuerdos para la Convivencia y Corresponsabilidad de los Padres, y Estándares de Conducta por nivel educativo para guiar el comportamiento esperado y
MODELO INTEGRAL PARA LA CONVIVENCIA EN EDUCACION INICIAL BASICA Y ESPECIAL E...David Mrs
El documento habla sobre la importancia de la educación y el aprendizaje continuo a lo largo de la vida. Señala que en un mundo en constante cambio es crucial que las personas sigan capacitándose e innovando para mantenerse relevantes. También enfatiza que tanto los individuos como las organizaciones deben fomentar una cultura de aprendizaje para prosperar.
Este documento presenta el calendario de evaluaciones del Servicio Profesional Docente para 2019. Incluye fechas para las evaluaciones de ingreso, promoción y reconocimiento de docentes en educación básica y media superior. Presenta las fechas clave para cada tipo de evaluación como la publicación de lineamientos, convocatorias, aplicación de exámenes, y publicación de resultados. El calendario fue aprobado por la Junta de Gobierno y podrá ser modificado por el Instituto Nacional para la Evaluación de la Educación.
ETAPAS ASPECTOS METODOS E INSTRUMENTOS PROMOCION 2019David Mrs
Este documento describe los aspectos, métodos e instrumentos del proceso de evaluación para promociones a cargos directivos, de supervisión y asesoría técnico-pedagógica en educación básica en México. El proceso consta de tres fases: 1) publicación de convocatorias y registro de aspirantes, 2) aplicación de exámenes de conocimientos y habilidades, y 3) calificación y asignación de cargos. Se evaluarán aspectos pedagógicos, de gestión escolar y ético-profesionales a trav
ETAPAS ASPECTOS METODOS E INSTRUMENTOS INGRESO 2019David Mrs
El documento describe las etapas y aspectos del proceso de evaluación para el ingreso a la educación básica en México. Consta de tres fases: 1) registro de aspirantes, 2) aplicación de exámenes nacionales de conocimientos y habilidades docentes así como de habilidades intelectuales, y 3) calificación y asignación de plazas. Se evaluarán dimensiones como conocimientos pedagógicos, organización educativa, responsabilidades éticas y participación comunitaria.
Parametros perfiles e indicadores 2019 nuevo ingresoDavid Mrs
Este documento presenta los perfiles, parámetros e indicadores para docentes y técnicos docentes en educación básica. Incluye los perfiles generales por nivel educativo (preescolar, primaria y secundaria), así como perfiles específicos para modalidades como educación indígena, educación especial, educación física y técnicos docentes. El objetivo es definir las características deseables de docentes para garantizar aprendizajes de calidad en los estudiantes.
Guia de estudios Media Superior 2018 2019David Mrs
Este documento presenta una guía de estudios para la evaluación diagnóstica al ingreso a la educación media superior en México. La guía está dividida en tres secciones que cubren las competencias matemáticas, lectoras y en ciencias experimentales. Cada sección incluye habilidades específicas y contenidos clave que los estudiantes deben dominar. El propósito de la guía es ayudar a los estudiantes a fortalecer los aprendizajes adquiridos en la educación básica y prepararse para la evaluación diagnóstica de ing
Este documento lista las cuatro direcciones de atención escolar secundaria en la Ciudad de México, incluyendo las alcaldías a las que brindan servicio y la dirección y directora de cada una.
Este documento presenta los indicadores y niveles de desempeño de los alumnos de una zona escolar para el primer trimestre. Describe cuatro niveles de desempeño y asocia calificaciones de 5 a 10 a cada nivel. También incluye tablas con los promedios y reprobación de alumnos de diferentes grados y materias, así como dimensiones para evaluar el desempeño docente.
Este documento describe los procedimientos para calcular los promedios finales de los estudiantes en tres componentes curriculares: Formación Académica, Áreas de Desarrollo Personal y Social, y Ámbitos de Autonomía Curricular. Explica cómo se evalúan los aprendizajes de los estudiantes en diferentes niveles de desempeño y cómo estos se traducen a calificaciones numéricas. También incluye tablas de equivalencia para determinar los promedios finales cuando los resultados no coinciden exactamente con las escalas numéricas.
Este documento presenta un libro escrito por 11 autores prominentes para los maestros del Sindicato Nacional de Trabajadores de la Educación. El libro no es un manual de pedagogía sino más bien un libro lleno de vida, ideas y amor por la profesión docente. El libro representa un acto de amor y confianza en los maestros por parte de estos autores, reconociendo que la educación de la patria comienza en el aula y depende del esfuerzo de los maestros.
El documento describe la segunda sesión de la Ruta de Mejora Escolar para el año 2018-2019. Se discuten estrategias para mejorar las prácticas educativas, incluyendo la implementación de nuevas estrategias, el aprendizaje entre escuelas, y la evaluación formativa para mejorar el aprendizaje de los estudiantes. El documento también describe cómo Singapur ha logrado éxito educativo a través de reformas sistemáticas a largo plazo.
Este documento presenta la propuesta de Aprendizaje entre escuelas como una estrategia de desarrollo profesional docente para mejorar las prácticas educativas mediante el intercambio de experiencias entre maestros. El objetivo es que los docentes compartan problemas comunes y propongan soluciones colaborativas observando clases entre ellos. Se explican las pautas para desarrollar estas sesiones de manera efectiva y lograr los objetivos de mejora educativa establecidos en cada plantel.
Este documento presenta las fichas para las sesiones ordinarias del Consejo Técnico Escolar del ciclo escolar 2018-2019 en educación secundaria. La primera sesión se enfoca en la consolidación de la planeación de la Ruta de Mejora Escolar y la elaboración de la Estrategia Global de Mejora con base en los resultados de la evaluación diagnóstica. El colectivo docente analizará dichos resultados, identificará las principales problemáticas educativas y establecerá opciones para resolverlas. Finalmente, se revisará y ajustará
Este documento presenta un protocolo para la atención y prevención de la violencia sexual contra niñas, niños y adolescentes en escuelas de educación inicial, básica y especial en la Ciudad de México. El protocolo establece principios, responsabilidades, estrategias de detección, atención y seguimiento de casos, así como recomendaciones para la prevención. El objetivo es garantizar un entorno libre de violencia y proteger los derechos de la niñez en las escuelas.
Este documento presenta datos sobre el rendimiento académico de estudiantes en varias escuelas, incluyendo el número de estudiantes reprobados por materia, los promedios obtenidos y el porcentaje total de reprobación por plantel.
This presentation was provided by Steph Pollock of The American Psychological Association’s Journals Program, and Damita Snow, of The American Society of Civil Engineers (ASCE), for the initial session of NISO's 2024 Training Series "DEIA in the Scholarly Landscape." Session One: 'Setting Expectations: a DEIA Primer,' was held June 6, 2024.
How to Fix the Import Error in the Odoo 17Celine George
An import error occurs when a program fails to import a module or library, disrupting its execution. In languages like Python, this issue arises when the specified module cannot be found or accessed, hindering the program's functionality. Resolving import errors is crucial for maintaining smooth software operation and uninterrupted development processes.
বাংলাদেশের অর্থনৈতিক সমীক্ষা ২০২৪ [Bangladesh Economic Review 2024 Bangla.pdf] কম্পিউটার , ট্যাব ও স্মার্ট ফোন ভার্সন সহ সম্পূর্ণ বাংলা ই-বুক বা pdf বই " সুচিপত্র ...বুকমার্ক মেনু 🔖 ও হাইপার লিংক মেনু 📝👆 যুক্ত ..
আমাদের সবার জন্য খুব খুব গুরুত্বপূর্ণ একটি বই ..বিসিএস, ব্যাংক, ইউনিভার্সিটি ভর্তি ও যে কোন প্রতিযোগিতা মূলক পরীক্ষার জন্য এর খুব ইম্পরট্যান্ট একটি বিষয় ...তাছাড়া বাংলাদেশের সাম্প্রতিক যে কোন ডাটা বা তথ্য এই বইতে পাবেন ...
তাই একজন নাগরিক হিসাবে এই তথ্য গুলো আপনার জানা প্রয়োজন ...।
বিসিএস ও ব্যাংক এর লিখিত পরীক্ষা ...+এছাড়া মাধ্যমিক ও উচ্চমাধ্যমিকের স্টুডেন্টদের জন্য অনেক কাজে আসবে ...
Strategies for Effective Upskilling is a presentation by Chinwendu Peace in a Your Skill Boost Masterclass organisation by the Excellence Foundation for South Sudan on 08th and 09th June 2024 from 1 PM to 3 PM on each day.
How to Setup Warehouse & Location in Odoo 17 InventoryCeline George
In this slide, we'll explore how to set up warehouses and locations in Odoo 17 Inventory. This will help us manage our stock effectively, track inventory levels, and streamline warehouse operations.
LAND USE LAND COVER AND NDVI OF MIRZAPUR DISTRICT, UPRAHUL
This Dissertation explores the particular circumstances of Mirzapur, a region located in the
core of India. Mirzapur, with its varied terrains and abundant biodiversity, offers an optimal
environment for investigating the changes in vegetation cover dynamics. Our study utilizes
advanced technologies such as GIS (Geographic Information Systems) and Remote sensing to
analyze the transformations that have taken place over the course of a decade.
The complex relationship between human activities and the environment has been the focus
of extensive research and worry. As the global community grapples with swift urbanization,
population expansion, and economic progress, the effects on natural ecosystems are becoming
more evident. A crucial element of this impact is the alteration of vegetation cover, which plays a
significant role in maintaining the ecological equilibrium of our planet.Land serves as the foundation for all human activities and provides the necessary materials for
these activities. As the most crucial natural resource, its utilization by humans results in different
'Land uses,' which are determined by both human activities and the physical characteristics of the
land.
The utilization of land is impacted by human needs and environmental factors. In countries
like India, rapid population growth and the emphasis on extensive resource exploitation can lead
to significant land degradation, adversely affecting the region's land cover.
Therefore, human intervention has significantly influenced land use patterns over many
centuries, evolving its structure over time and space. In the present era, these changes have
accelerated due to factors such as agriculture and urbanization. Information regarding land use and
cover is essential for various planning and management tasks related to the Earth's surface,
providing crucial environmental data for scientific, resource management, policy purposes, and
diverse human activities.
Accurate understanding of land use and cover is imperative for the development planning
of any area. Consequently, a wide range of professionals, including earth system scientists, land
and water managers, and urban planners, are interested in obtaining data on land use and cover
changes, conversion trends, and other related patterns. The spatial dimensions of land use and
cover support policymakers and scientists in making well-informed decisions, as alterations in
these patterns indicate shifts in economic and social conditions. Monitoring such changes with the
help of Advanced technologies like Remote Sensing and Geographic Information Systems is
crucial for coordinated efforts across different administrative levels. Advanced technologies like
Remote Sensing and Geographic Information Systems
9
Changes in vegetation cover refer to variations in the distribution, composition, and overall
structure of plant communities across different temporal and spatial scales. These changes can
occur natural.
The simplified electron and muon model, Oscillating Spacetime: The Foundation...RitikBhardwaj56
Discover the Simplified Electron and Muon Model: A New Wave-Based Approach to Understanding Particles delves into a groundbreaking theory that presents electrons and muons as rotating soliton waves within oscillating spacetime. Geared towards students, researchers, and science buffs, this book breaks down complex ideas into simple explanations. It covers topics such as electron waves, temporal dynamics, and the implications of this model on particle physics. With clear illustrations and easy-to-follow explanations, readers will gain a new outlook on the universe's fundamental nature.
it describes the bony anatomy including the femoral head , acetabulum, labrum . also discusses the capsule , ligaments . muscle that act on the hip joint and the range of motion are outlined. factors affecting hip joint stability and weight transmission through the joint are summarized.
This slide is special for master students (MIBS & MIFB) in UUM. Also useful for readers who are interested in the topic of contemporary Islamic banking.