
Recommended
More Related Content
Recently uploaded
Recently uploaded (20)
Featured
Featured (20)
Regression trees
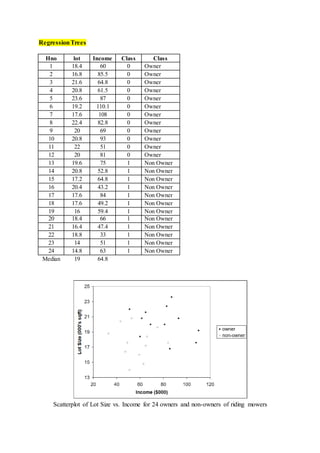
- 1. RegressionTrees Hno lot Income Class Class 1 18.4 60 0 Owner 2 16.8 85.5 0 Owner 3 21.6 64.8 0 Owner 4 20.8 61.5 0 Owner 5 23.6 87 0 Owner 6 19.2 110.1 0 Owner 7 17.6 108 0 Owner 8 22.4 82.8 0 Owner 9 20 69 0 Owner 10 20.8 93 0 Owner 11 22 51 0 Owner 12 20 81 0 Owner 13 19.6 75 1 Non Owner 14 20.8 52.8 1 Non Owner 15 17.2 64.8 1 Non Owner 16 20.4 43.2 1 Non Owner 17 17.6 84 1 Non Owner 18 17.6 49.2 1 Non Owner 19 16 59.4 1 Non Owner 20 18.4 66 1 Non Owner 21 16.4 47.4 1 Non Owner 22 18.8 33 1 Non Owner 23 14 51 1 Non Owner 24 14.8 63 1 Non Owner Median 19 64.8 Scatterplot of Lot Size vs. Income for 24 owners and non-owners of riding mowers
- 2. Gini Index (Class) = (1 − ∑ 𝑝𝑖 2 𝑛 𝑖=1 ) Non Owner=12 Owner=12 Gini (class) = (1-(12/24)2+(12/24)2) = 0 Median of lot = 19 Splitting the 24 observations by Lot Size value of 19 approximately Lot <=19 (Lower Rectangle) lot Income Class Class 14 51 1 Non Owner 14.8 63 1 Non Owner 16 59.4 1 Non Owner 16.4 47.4 1 Non Owner 16.8 85.5 0 Owner 17.2 64.8 1 Non Owner 17.6 108 0 Owner 17.6 84 1 Non Owner 17.6 49.2 1 Non Owner 18.4 60 0 Owner 18.4 66 1 Non Owner 18.8 33 1 Non Owner Gini(lot - LR) = (1 – (3/12)2 – (9/12)2) = 0.375
- 3. Lot>19 (Upper Rectangle) lot Income Class Class 19.2 110.1 0 Owner 19.6 75 1 Non Owner 20 69 0 Owner 20 81 0 Owner 20.4 43.2 1 Non Owner 20.8 61.5 0 Owner 20.8 93 0 Owner 20.8 52.8 1 Non Owner 21.6 64.8 0 Owner 22 51 0 Owner 22.4 82.8 0 Owner 23.6 87 0 Owner Gini(lot - UR) = (1 – (9/12)2 – (3/12)2) = 0.375 Avg of LR and UR = 12/24(0.375)+12/24(0.375) = 0.375 Median(Income) = 64.8 Income<=64.8 (Lower Rectangle) lot Income Class Class 18.8 33 1 Non Owner 20.4 43.2 1 Non Owner 16.4 47.4 1 Non Owner 17.6 49.2 1 Non Owner 22 51 0 Owner 14 51 1 Non Owner 20.8 52.8 1 Non Owner 16 59.4 1 Non Owner 18.4 60 0 Owner 20.8 61.5 0 Owner 14.8 63 1 Non Owner 21.6 64.8 0 Owner 17.2 64.8 1 Non Owner Gini(Income) = (1 – (4/13)2 – (9/13)2) = 0.4261
- 4. Income>64.8 (Upper Rectangle) lot Income Class Class 18.4 66 1 Non Owner 20 69 0 Owner 19.6 75 1 Non Owner 20 81 0 Owner 22.4 82.8 0 Owner 17.6 84 1 Non Owner 16.8 85.5 0 Owner 23.6 87 0 Owner 20.8 93 0 Owner 17.6 108 0 Owner 19.2 110.1 0 Owner Gini(Income) = (1 – (8/11)2 – (3/11)2) = 0.3967 Avg of LR and UR = 14/24(0.4261)+11/24(0.397) = 0.431 Lot Income 0.375 (Min) 0.431 Minimum Gini Avg is for Lot. So choose lot as root Tree: Step 1 – Identifying the root Sort Lower rectangle of Lot <=19 with respect to Income and try analysing the class and finalize the income points after which the classes has never changed. Its 84 and 85.5. Median(84, 85.5) = 84.75 Lot 19 12 12
- 5. LR of Lot<=19 lot Income Class Class 18.8 33 1 Non Owner 16.4 47.4 1 Non Owner 17.6 49.2 1 Non Owner 14 51 1 Non Owner 16 59.4 1 Non Owner 18.4 60 0 Owner 14.8 63 1 Non Owner 17.2 64.8 1 Non Owner 18.4 66 1 Non Owner 17.6 84 1 Non Owner 16.8 85.5 0 Owner 17.6 108 0 Owner If we continue splitting the mower data, the next split is on the Income variable at the value 84.75. Splitting the 24 observations by Lot Size value of 19K, and then Income value of 84.75K LR of Lot<=19 and Income <=84.75 lot Income Class Class 18.8 33 1 Non Owner 16.4 47.4 1 Non Owner 17.6 49.2 1 Non Owner 14 51 1 Non Owner 16 59.4 1 Non Owner 18.4 60 0 Owner 14.8 63 1 Non Owner 17.2 64.8 1 Non Owner 18.4 66 1 Non Owner 17.6 84 1 Non Owner
- 6. LR of Lot<=19 and Income >84.75 lot Income Class Class 16.8 85.5 0 Owner 17.6 108 0 Owner Sort Lower rectangle of Lot <=19, Income <=84.75 with respect to the class and finalize the lot points after which the classes has never changed. Its 17.6 and 18.4. Median(17.6,18.4) = 18 LR of Lot<=19, Income <=84.75, Lot <=18 lot Income Class Class 14 51 1 Non Owner 14.8 63 1 Non Owner 16 59.4 1 Non Owner 16.4 47.4 1 Non Owner 17.2 64.8 1 Non Owner 17.6 49.2 1 Non Owner 17.6 84 1 Non Owner 2 Lot 19 12 12 Income 84.75 Owner 10
- 7. LR of Lot<=19, Income <=84.75, Lot >18 lot Income Class Class 18.4 66 1 Non Owner 18.4 60 0 Owner 18.8 33 1 Non Owner Sort Lower rectangle of Lot <=19, Income <=84.75, Lot>18 with respect to the class and finalize the lot points after which the classes has never changed. Its 18.8 and 18.4. Median(18.8,18.4) = 18.6 LR of Lot<=19, Income <=84.75, Lot >18, Lot<=18.6 lot Income Class Class 18.4 66 1 Non Owner 18.4 60 0 Owner LR of Lot<=19, Income <=84.75, Lot >18, Lot>18.6 lot Income Class Class 18.8 33 1 Non Owner 2 Lot 19 12 12 Income 84.75 Owner 10 Lot 18 7 Non Owner 3
- 8. LR of Lot<=19, Income <=84.75, Lot >18, Lot<=18.6 lot Income Class Class 18.4 66 1 Non Owner 18.4 60 0 Owner Sort Lower rectangle of Lot <=19, Income <=84.75, Lot>18, Lot<=18.6 with respect to the class and finalize the income points after which the classes has never changed. Its 60 and 66 Median(66,60) = 63 LR of Lot<=19, Income <=84.75, Lot >18, Lot<=18.6, Income<=63 lot Income Class Class 18.4 60 0 Owner LR of Lot<=19, Income <=84.75, Lot >18, Lot<=18.6, Income>63 lot Income Class Class 18.4 66 1 Non Owner 2 Lot 19 12 12 Income 84.75 Owner 10 Lot 18 7 Non Owner 3 Lot 18.6 1 Non Owner 2
- 9. Final Left Regression Tree Predict Income = 55 Lot = 18.5 Income 63 2 Lot 19 12 12 Income 84.75 Owner 10 Lot 18 7 Non Owner 3 Lot 18.6 1 Non Owner 2 1 1 Owner Non Owner
- 10. Predict Income = 55 Lot = 18.5 Income 46.5 2 Lot 19 12 12 Income 84.75 Owner 10 Lot 18 7 Non Owner 3 Income 63 1 Non Owner 1 1 Non Owner Owner