VPPs are virtual aggregations of distributed energy resources, such as energy storage, solar panels, and wind turbines, that can be controlled and optimized in real-time to provide grid services.
Real Reliability |2
Volume I: Summary Report
I. Summary
II. An Introduction to VPPs
III. Modeling VPP Performance
IV. The Value of VPPs
V. Moving Forward with VPPs
Volume II: Technical Appendix
Describes all modeling assumptions and data sources
Contents
Real Reliability |4
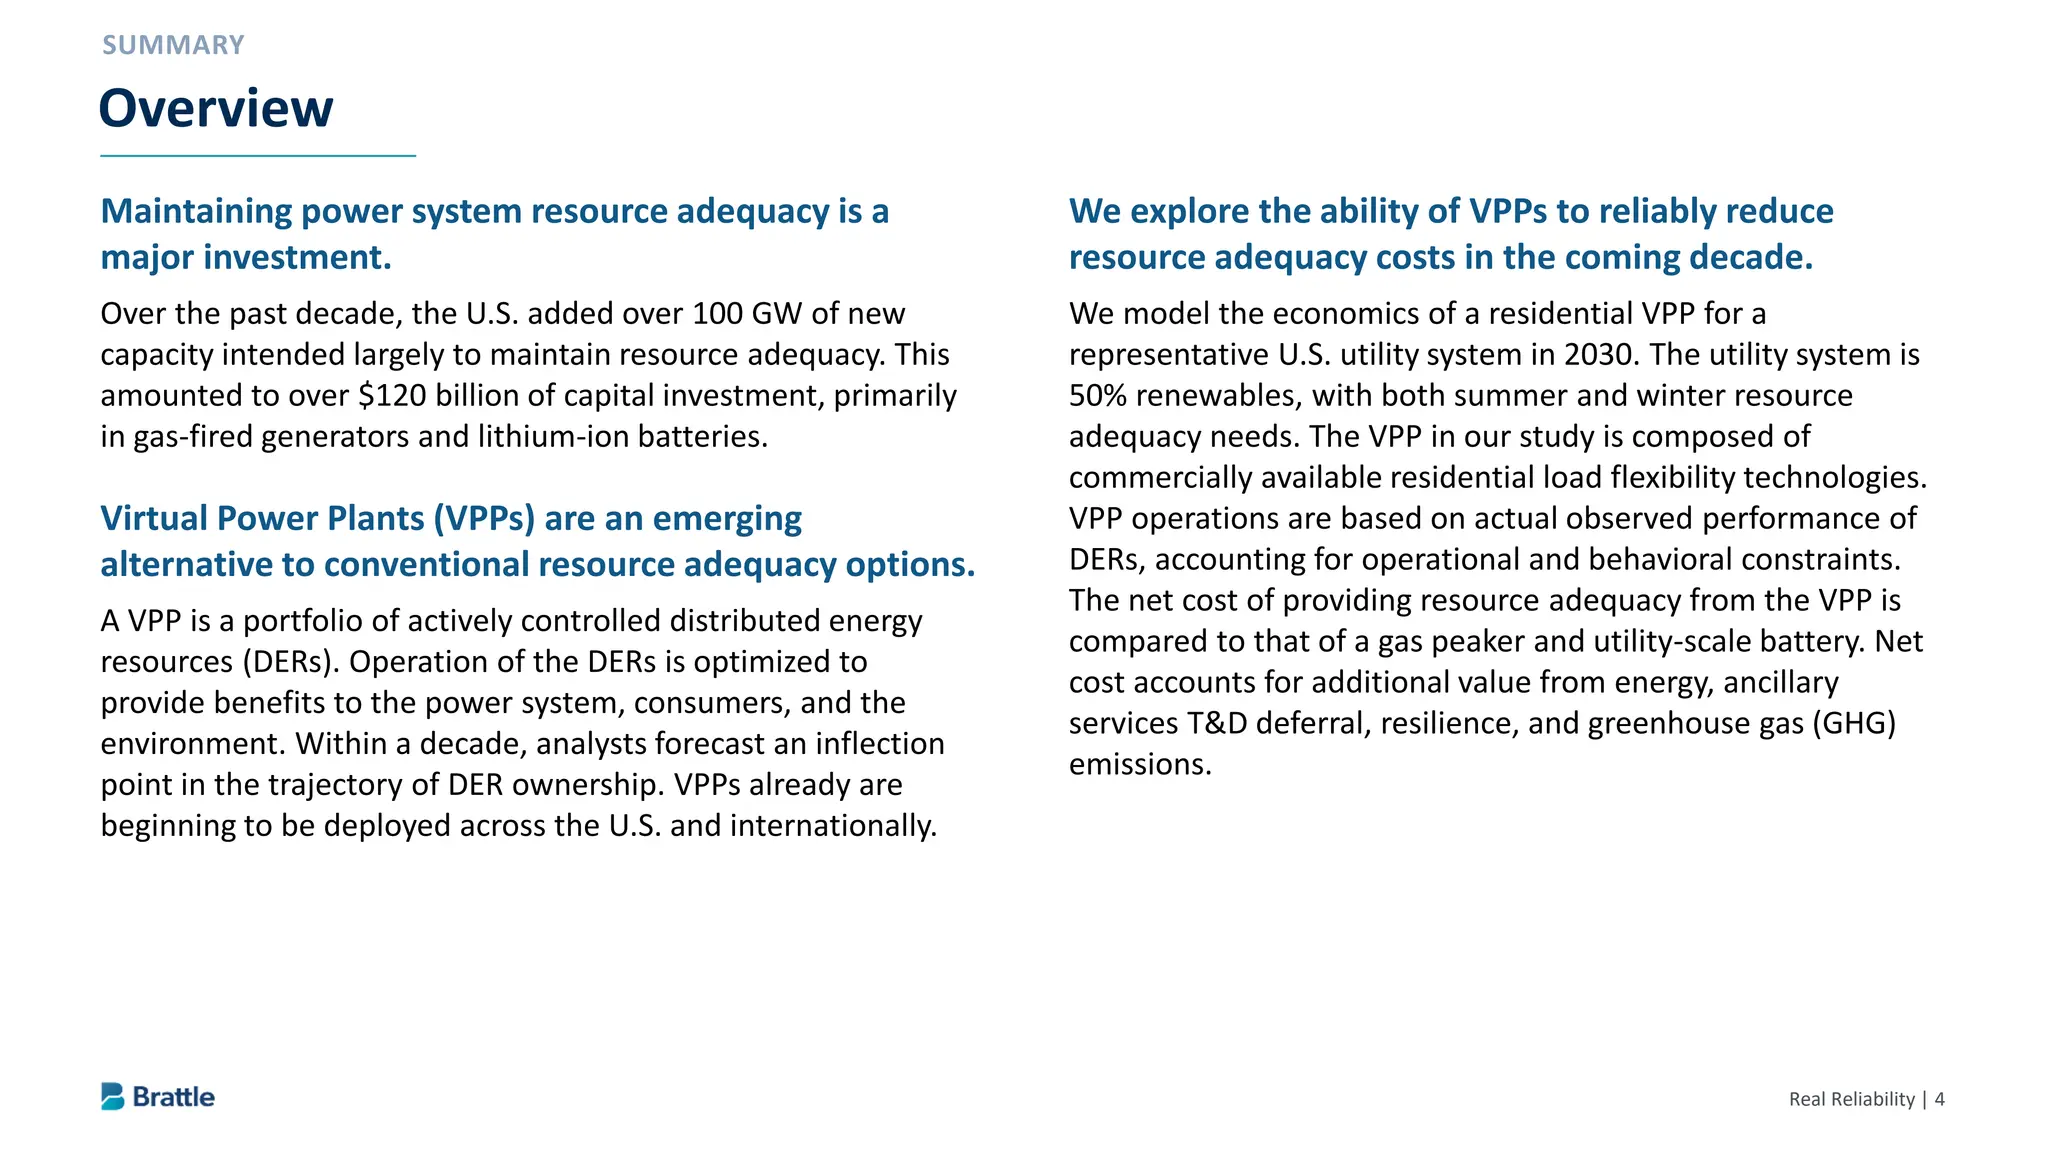
Maintaining power system resource adequacy is a
major investment.
Over the past decade, the U.S. added over 100 GW of new
capacity intended largely to maintain resource adequacy. This
amounted to over $120 billion of capital investment, primarily
in gas-fired generators and lithium-ion batteries.
Virtual Power Plants (VPPs) are an emerging
alternative to conventional resource adequacy options.
A VPP is a portfolio of actively controlled distributed energy
resources (DERs). Operation of the DERs is optimized to
provide benefits to the power system, consumers, and the
environment. Within a decade, analysts forecast an inflection
point in the trajectory of DER ownership. VPPs already are
beginning to be deployed across the U.S. and internationally.
We explore the ability of VPPs to reliably reduce
resource adequacy costs in the coming decade.
We model the economics of a residential VPP for a
representative U.S. utility system in 2030. The utility system is
50% renewables, with both summer and winter resource
adequacy needs. The VPP in our study is composed of
commercially available residential load flexibility technologies.
VPP operations are based on actual observed performance of
DERs, accounting for operational and behavioral constraints.
The net cost of providing resource adequacy from the VPP is
compared to that of a gas peaker and utility-scale battery. Net
cost accounts for additional value from energy, ancillary
services T&D deferral, resilience, and greenhouse gas (GHG)
emissions.
Overview
6.
Real Reliability |5
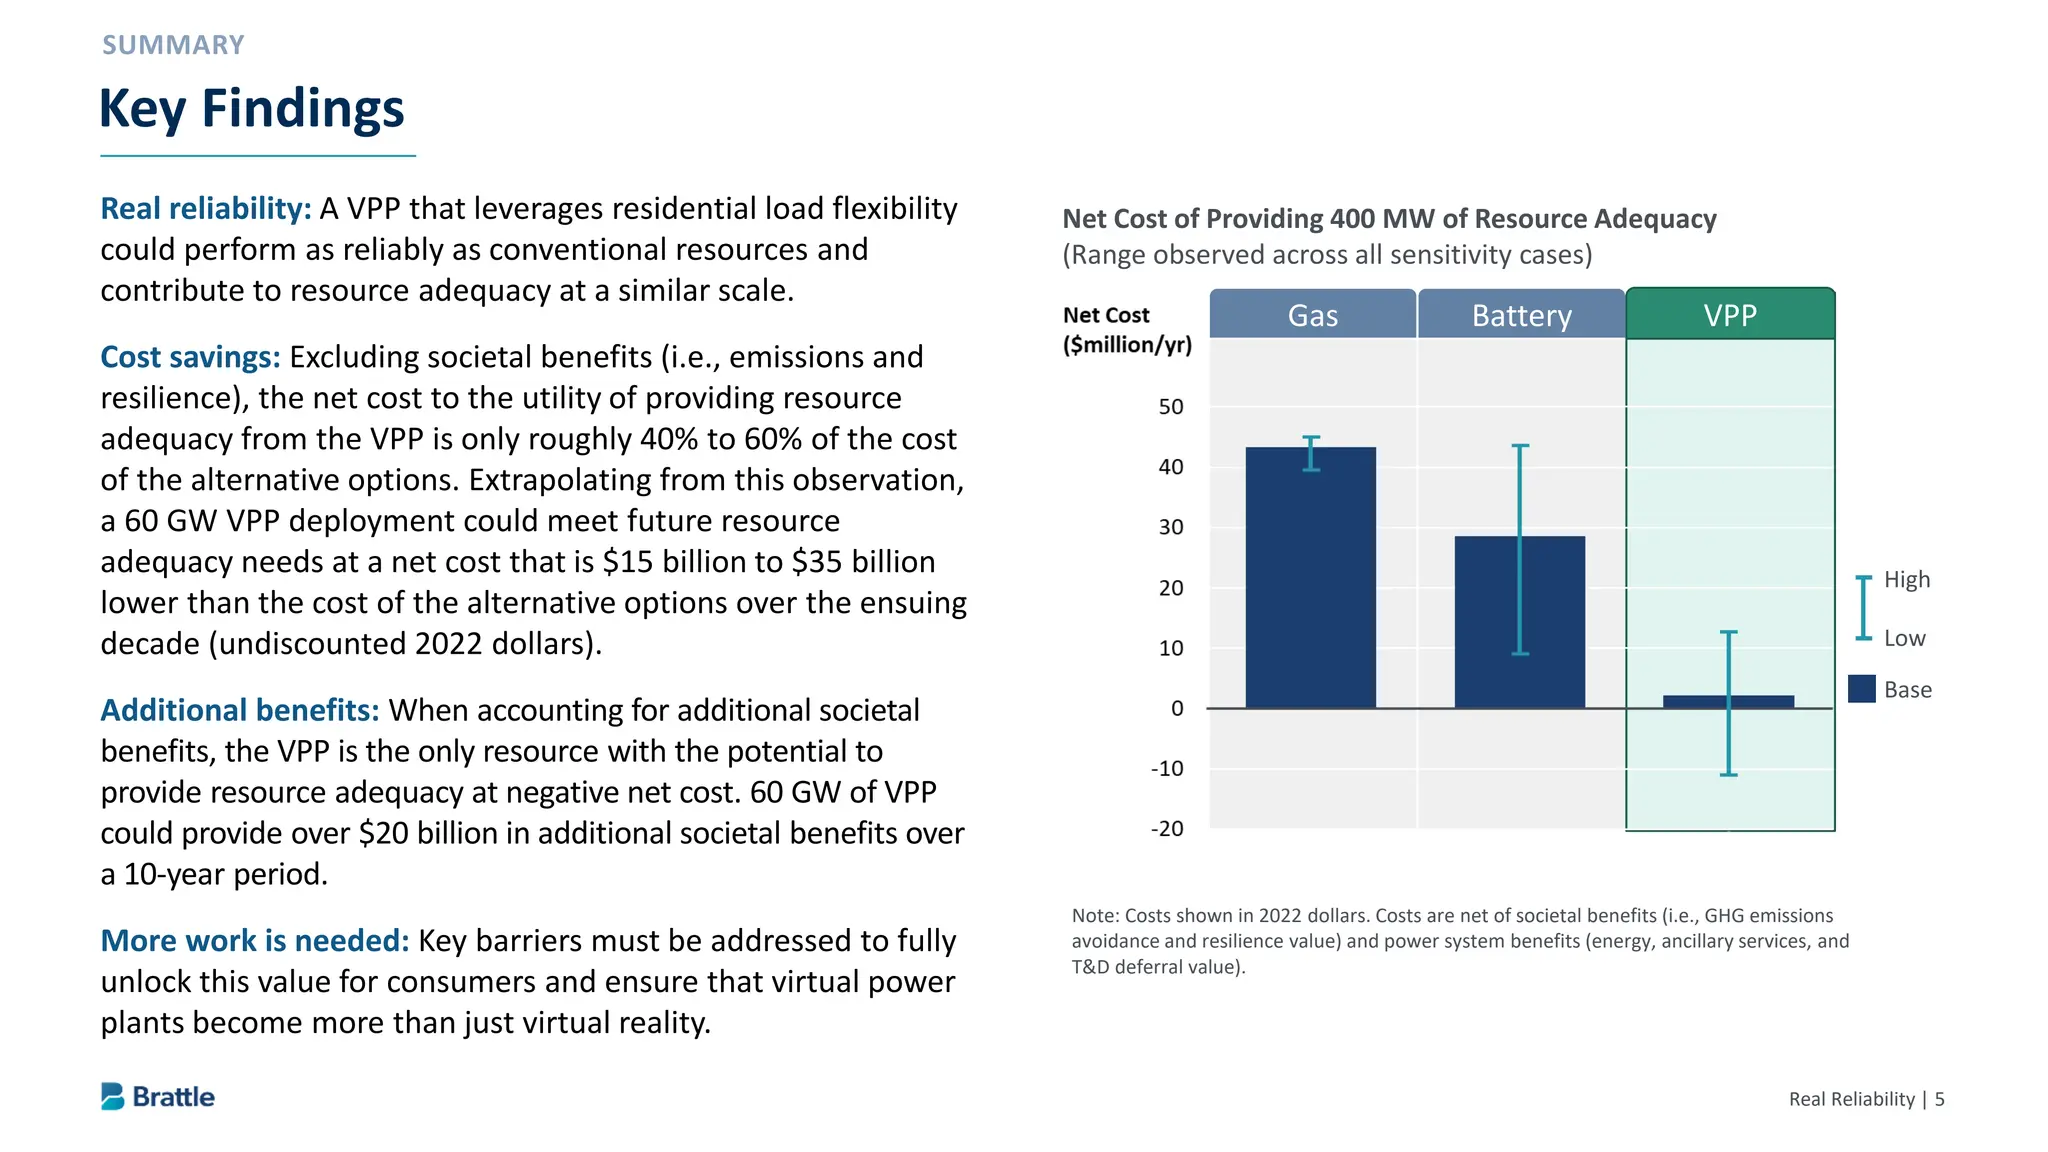
Real reliability: A VPP that leverages residential load flexibility
could perform as reliably as conventional resources and
contribute to resource adequacy at a similar scale.
Cost savings: Excluding societal benefits (i.e., emissions and
resilience), the net cost to the utility of providing resource
adequacy from the VPP is only roughly 40% to 60% of the cost
of the alternative options. Extrapolating from this observation,
a 60 GW VPP deployment could meet future resource
adequacy needs at a net cost that is $15 billion to $35 billion
lower than the cost of the alternative options over the ensuing
decade (undiscounted 2022 dollars).
Additional benefits: When accounting for additional societal
benefits, the VPP is the only resource with the potential to
provide resource adequacy at negative net cost. 60 GW of VPP
could provide over $20 billion in additional societal benefits over
a 10-year period.
More work is needed: Key barriers must be addressed to fully
unlock this value for consumers and ensure that virtual power
plants become more than just virtual reality.
Key Findings
Net Cost of Providing 400 MW of Resource Adequacy
(Range observed across all sensitivity cases)
High
Low
Base
Gas Battery VPP
Note: Costs shown in 2022 dollars. Costs are net of societal benefits (i.e., GHG emissions
avoidance and resilience value) and power system benefits (energy, ancillary services, and
T&D deferral value).
Real Reliability |7
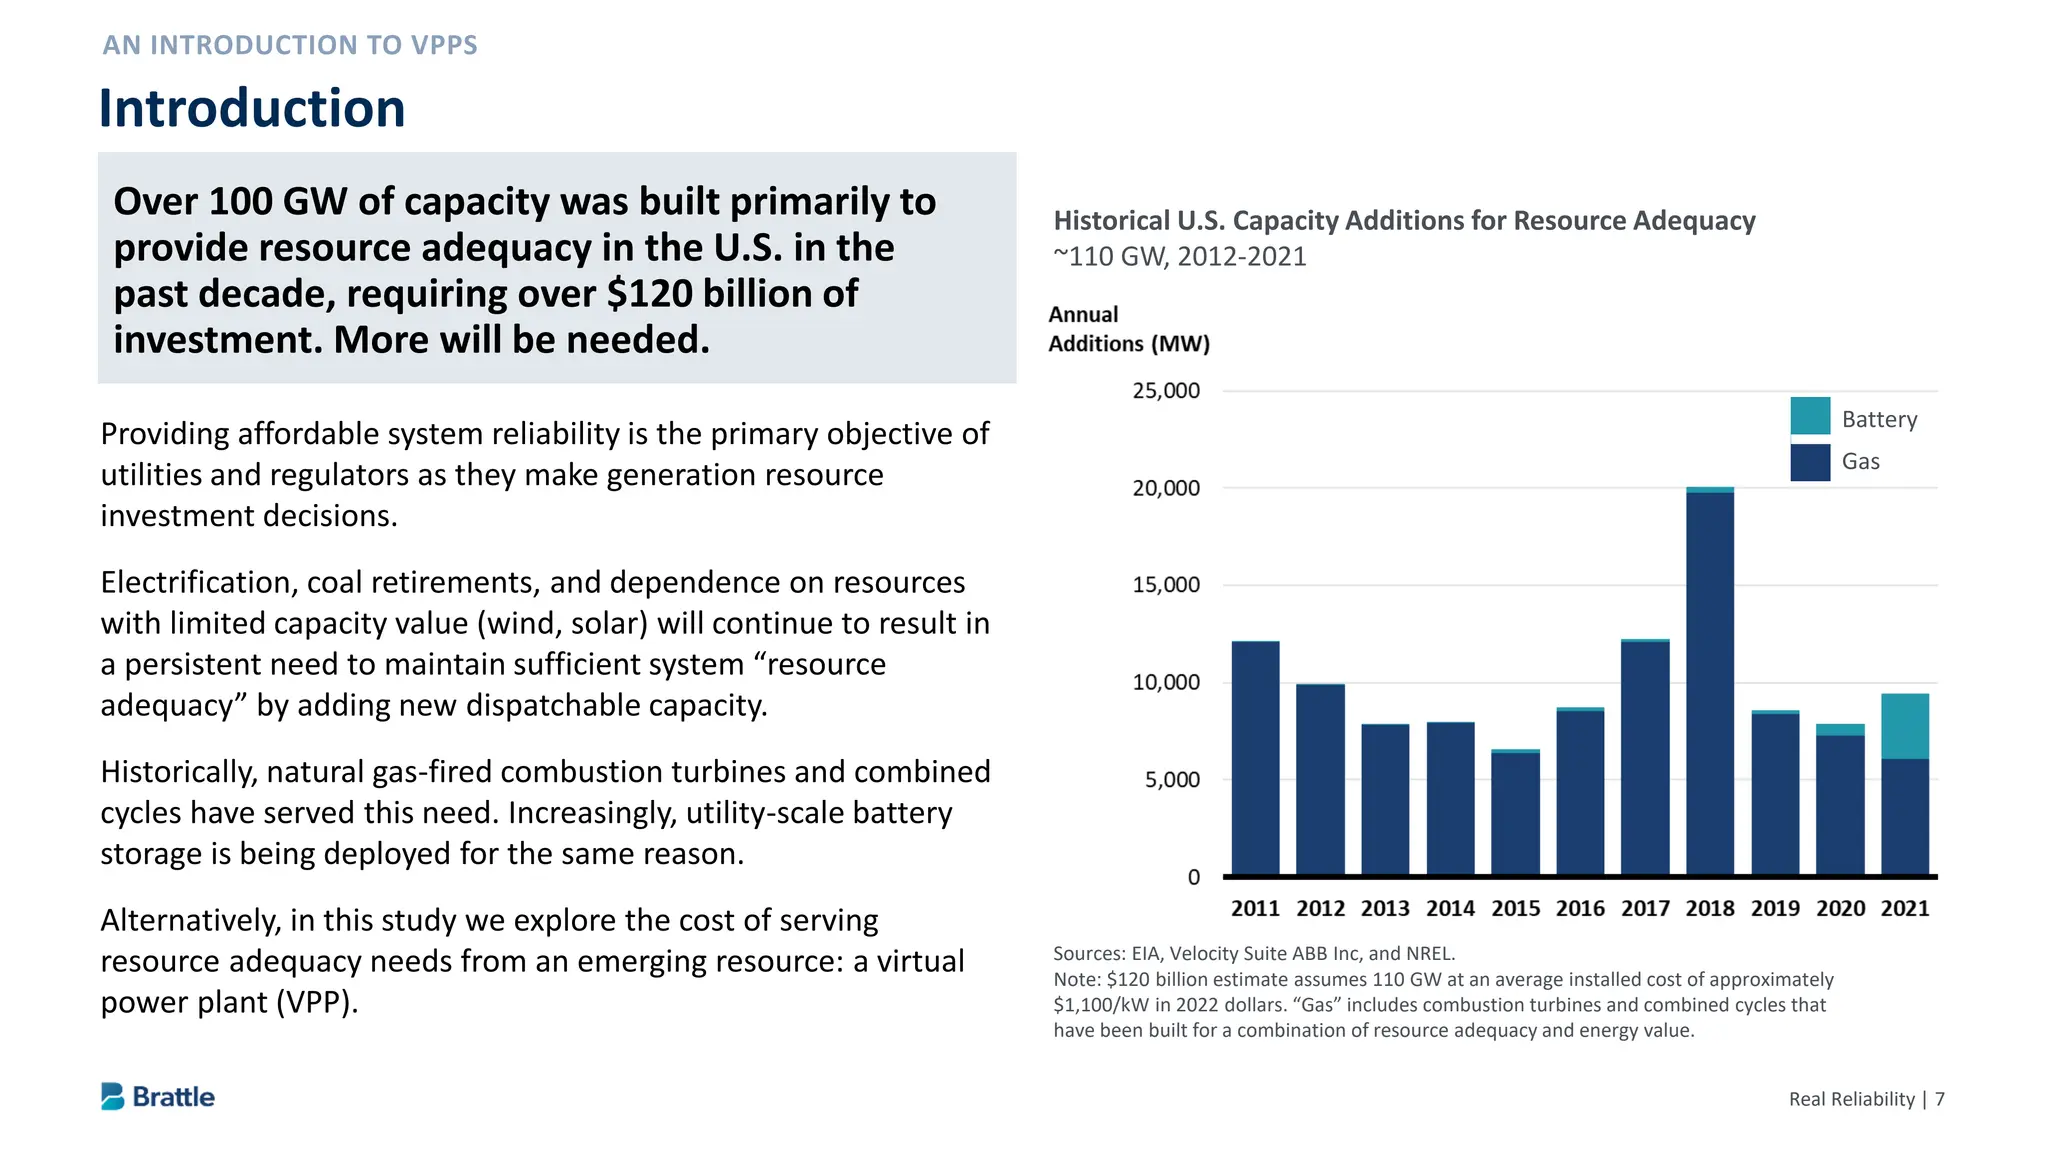
Over 100 GW of capacity was built primarily to provide
resource adequacy in the U.S. in the past decade, requiring
over $120 billion of investment. More will be needed.
Providing affordable system reliability is the primary objective of
utilities and regulators as they make generation resource
investment decisions.
Electrification, coal retirements, and dependence on resources
with limited capacity value (wind, solar) will continue to result in
a persistent need to maintain sufficient system “resource
adequacy” by adding new dispatchable capacity.
Historically, natural gas-fired combustion turbines and combined
cycles have served this need. Increasingly, utility-scale battery
storage is being deployed for the same reason.
Alternatively, in this study we explore the cost of serving
resource adequacy needs from an emerging resource: a virtual
power plant (VPP).
Introduction
Sources: EIA, Velocity Suite ABB Inc, and NREL.
Note: $120 billion estimate assumes 110 GW at an average installed cost of approximately
$1,100/kW in 2022 dollars. “Gas” includes combustion turbines and combined cycles that
have been built for a combination of resource adequacy and energy value.
Historical U.S. Capacity Additions for Resource Adequacy
~110 GW, 2012-2021
Battery
Gas
Over 100 GW of capacity was built primarily to
provide resource adequacy in the U.S. in the
past decade, requiring over $120 billion of
investment. More will be needed.
9.
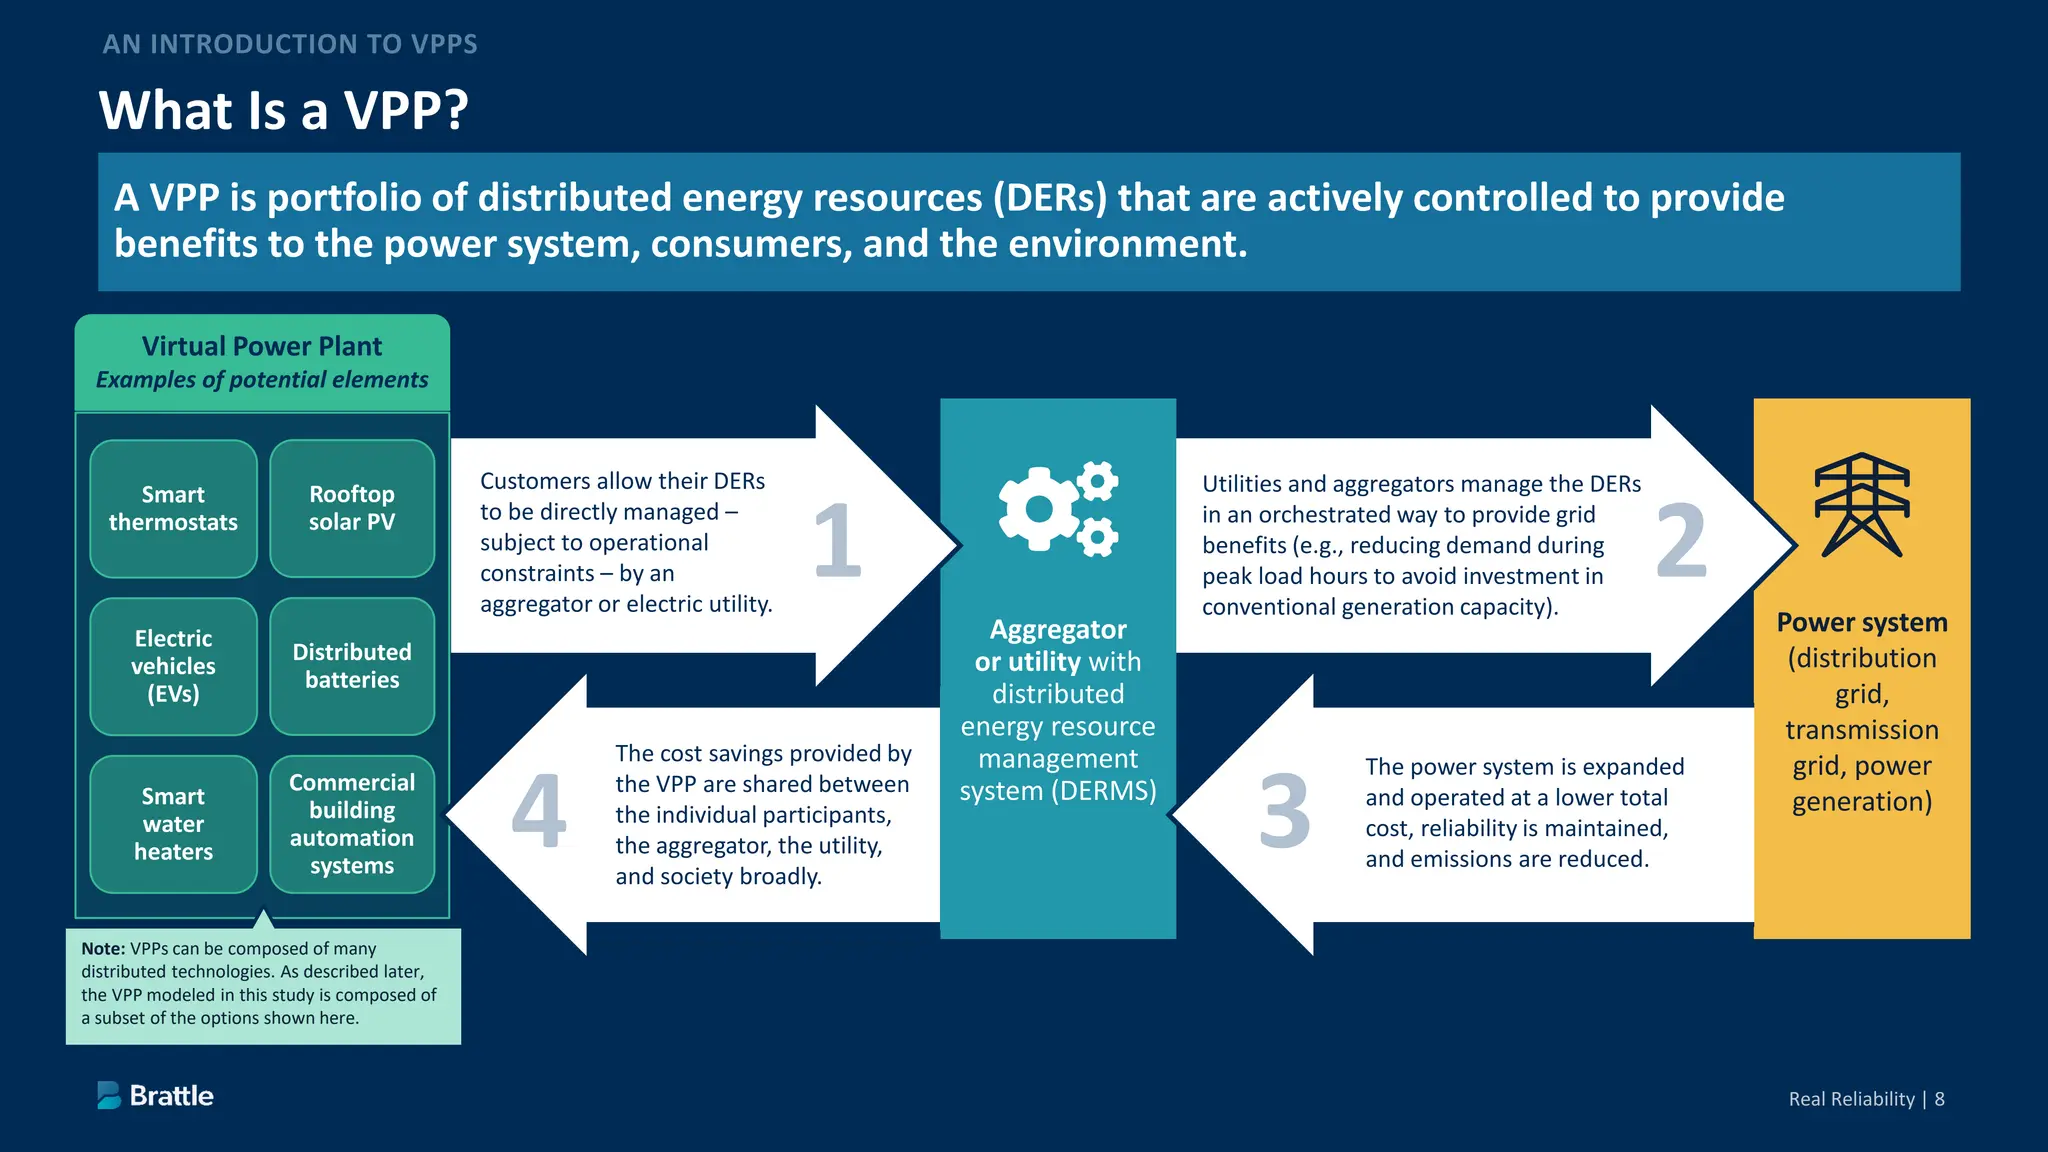
Power system
(distribution
grid,
transmission
grid, power
generation)
WhatIs a VPP?
Aggregator
or utility with
distributed
energy resource
management
system (DERMS)
Customers allow their DERs
to be directly managed –
subject to operational
constraints – by an
aggregator or electric utility.
Utilities and aggregators manage the DERs
in an orchestrated way to provide grid
benefits (e.g., reducing demand during
peak load hours to avoid investment in
conventional generation capacity).
Virtual Power Plant
Examples of potential elements
Smart
thermostats
Electric
vehicles
(EVs)
Rooftop
solar PV
Distributed
batteries
Smart
water
heaters
Commercial
building
automation
systems
The cost savings provided by
the VPP are shared between
the individual participants,
the aggregator, the utility,
and society broadly.
Note: VPPs can be composed of many
distributed technologies. As described later,
the VPP modeled in this study is composed of
a subset of the options shown here.
The power system is expanded
and operated at a lower total
cost, reliability is maintained,
and emissions are reduced.
A VPP is portfolio of distributed energy resources (DERs) that are actively controlled to provide
benefits to the power system, consumers, and the environment.
10.
Real Reliability |9
DER ownership is expected to grow by several
multiples within the next decade in the
United States.
Several forces currently are driving VPP deployment to
an inflection point:
– Declining DER costs, particularly EVs and batteries
– Technological advancement in algorithms for
managing and optimizing the value of DERs
– Inflation Reduction Act (IRA) incentives to promote
electrification and efficiency
– FERC Order 2222 and accompanying initiatives to
open wholesale markets to VPP participation
– Growing model availability of EVs, thermostats,
smart panels, and others
– The decarbonization imperative, a focus of
policymakers, utilities, and consumers
An Inflection Point for VPP Deployment
Homes with Smart Thermostats
Residential Rooftop Solar
Light-Duty Electric Vehicles
Homes with Electric Water Heating
Behind-the-Meter (BTM) Batteries
Notes: See technical appendix for details. Modest growth in electric water heating is due to significant existing market
saturation and near-term focus of the adoption forecast. The Inflation Reduction Act may further accelerate these
adoption forecasts.
PRESENT 2030
10% 34%
PRESENT 2030
27 GW 83 GW
PRESENT 2030
3 mil. 26 mil.
PRESENT 2030
49% 50%
PRESENT 2030
2 GW 27 GW
DER ownership is expected to grow by
several multiples within the next decade in
the United States.
11.
Real Reliability |10
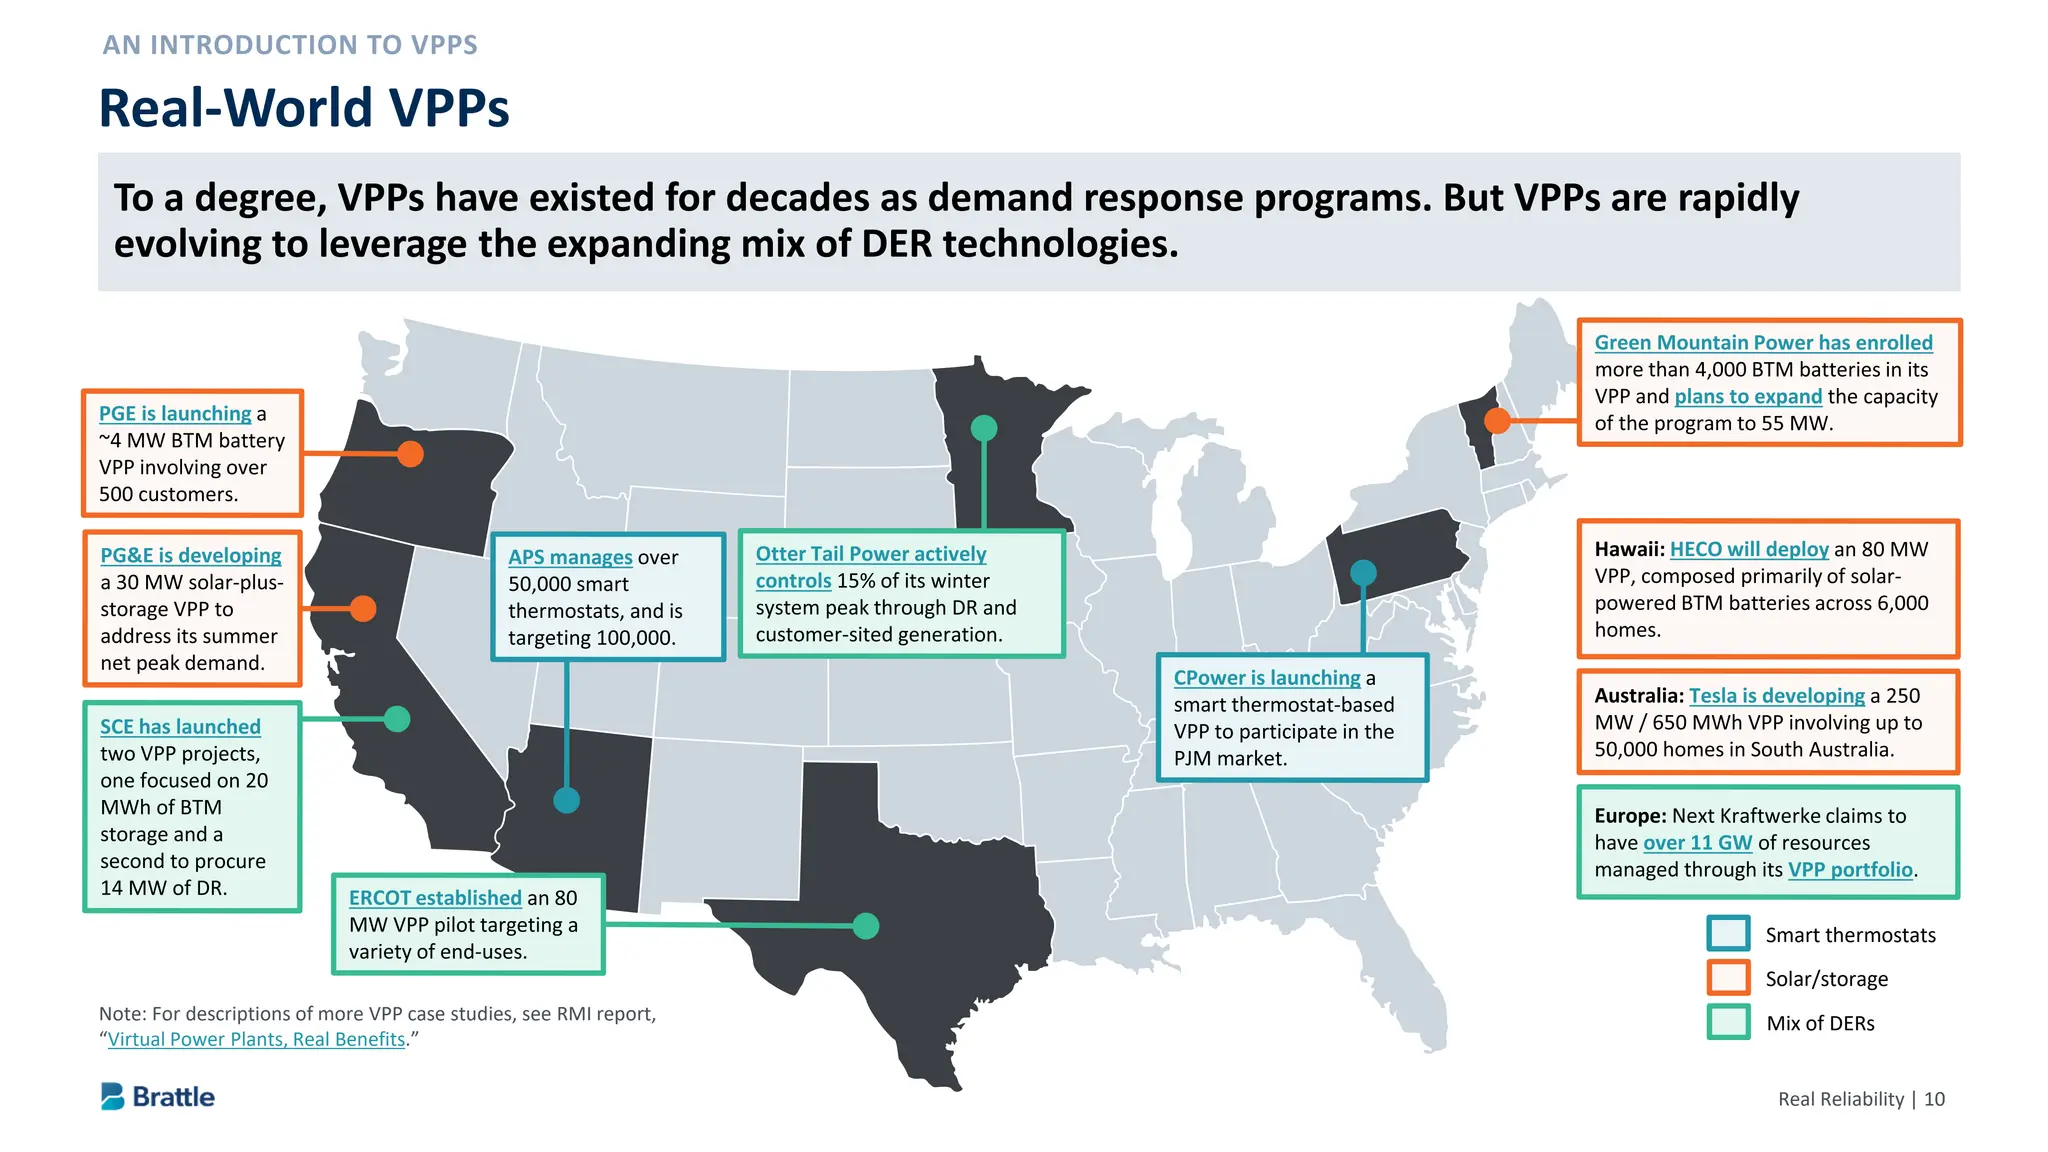
Real-World VPPs
Note: For descriptions of more VPP case studies, see RMI report,
“Virtual Power Plants, Real Benefits.”
Smart thermostats
Solar/storage
Mix of DERs
To a degree, VPPs have existed for decades as demand response programs. But VPPs are rapidly
evolving to leverage the expanding mix of DER technologies.
Real Reliability |12
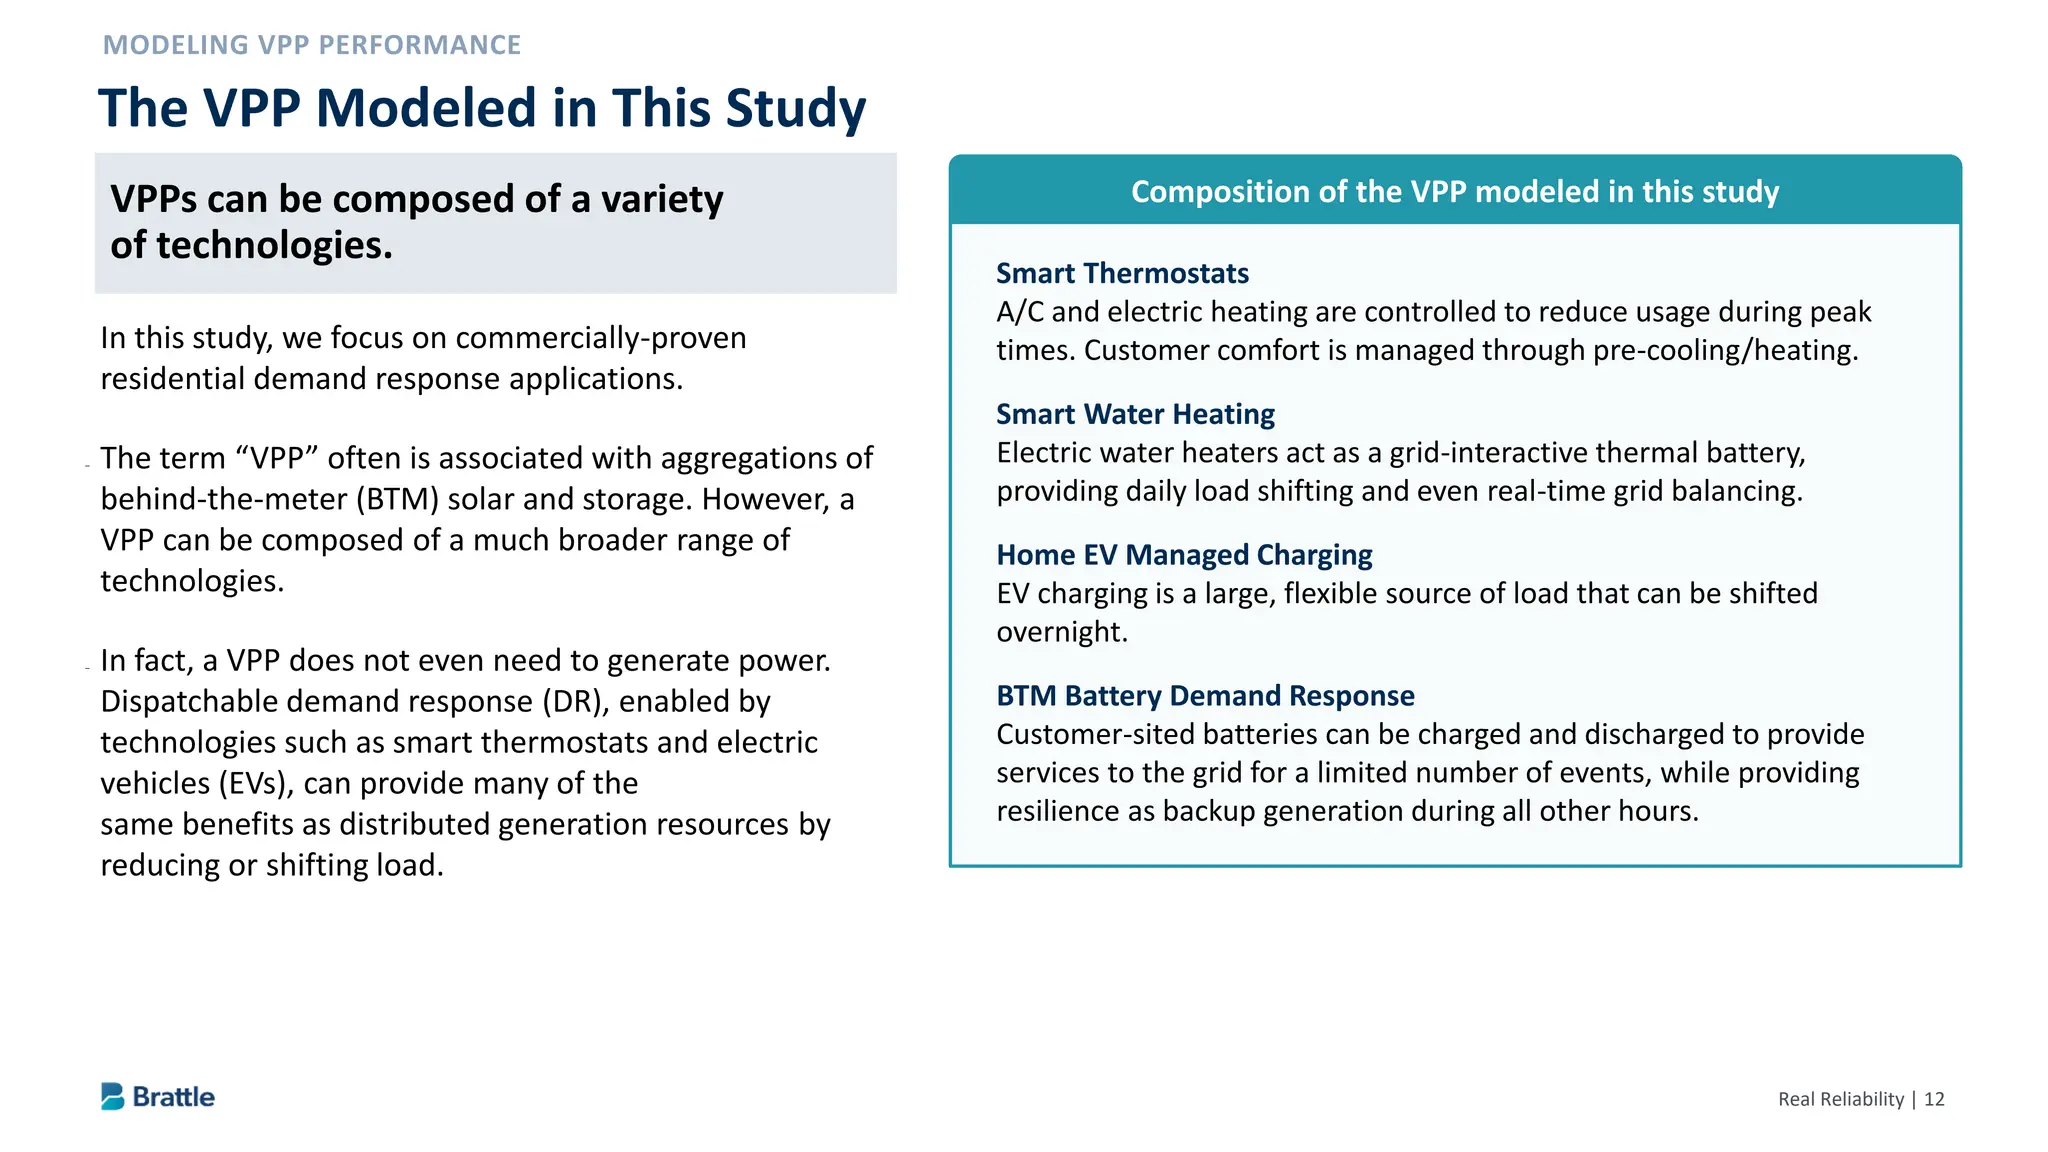
VPPs can be composed of a variety of technologies.
In this study, we focus on commercially-proven
residential demand response applications.
– The term “VPP” often is associated with aggregations of
behind-the-meter (BTM) solar and storage. However, a
VPP can be composed of a much broader range of
technologies.
– In fact, a VPP does not even need to generate power.
Dispatchable demand response (DR), enabled by
technologies such as smart thermostats and electric
vehicles (EVs), can provide many of the
same benefits as distributed generation resources by
reducing or shifting load.
The VPP Modeled in This Study
Smart Thermostats
A/C and electric heating are controlled to reduce usage during peak
times. Customer comfort is managed through pre-cooling/heating.
Smart Water Heating
Electric water heaters act as a grid-interactive thermal battery,
providing daily load shifting and even real-time grid balancing.
Home EV Managed Charging
EV charging is a large, flexible source of load that can be shifted
overnight.
BTM Battery Demand Response
Customer-sited batteries can be charged and discharged to provide
services to the grid for a limited number of events, while providing
resilience as backup generation during all other hours.
Composition of the VPP modeled in this study
VPPs can be composed of a variety
of technologies.
14.
Real Reliability |13
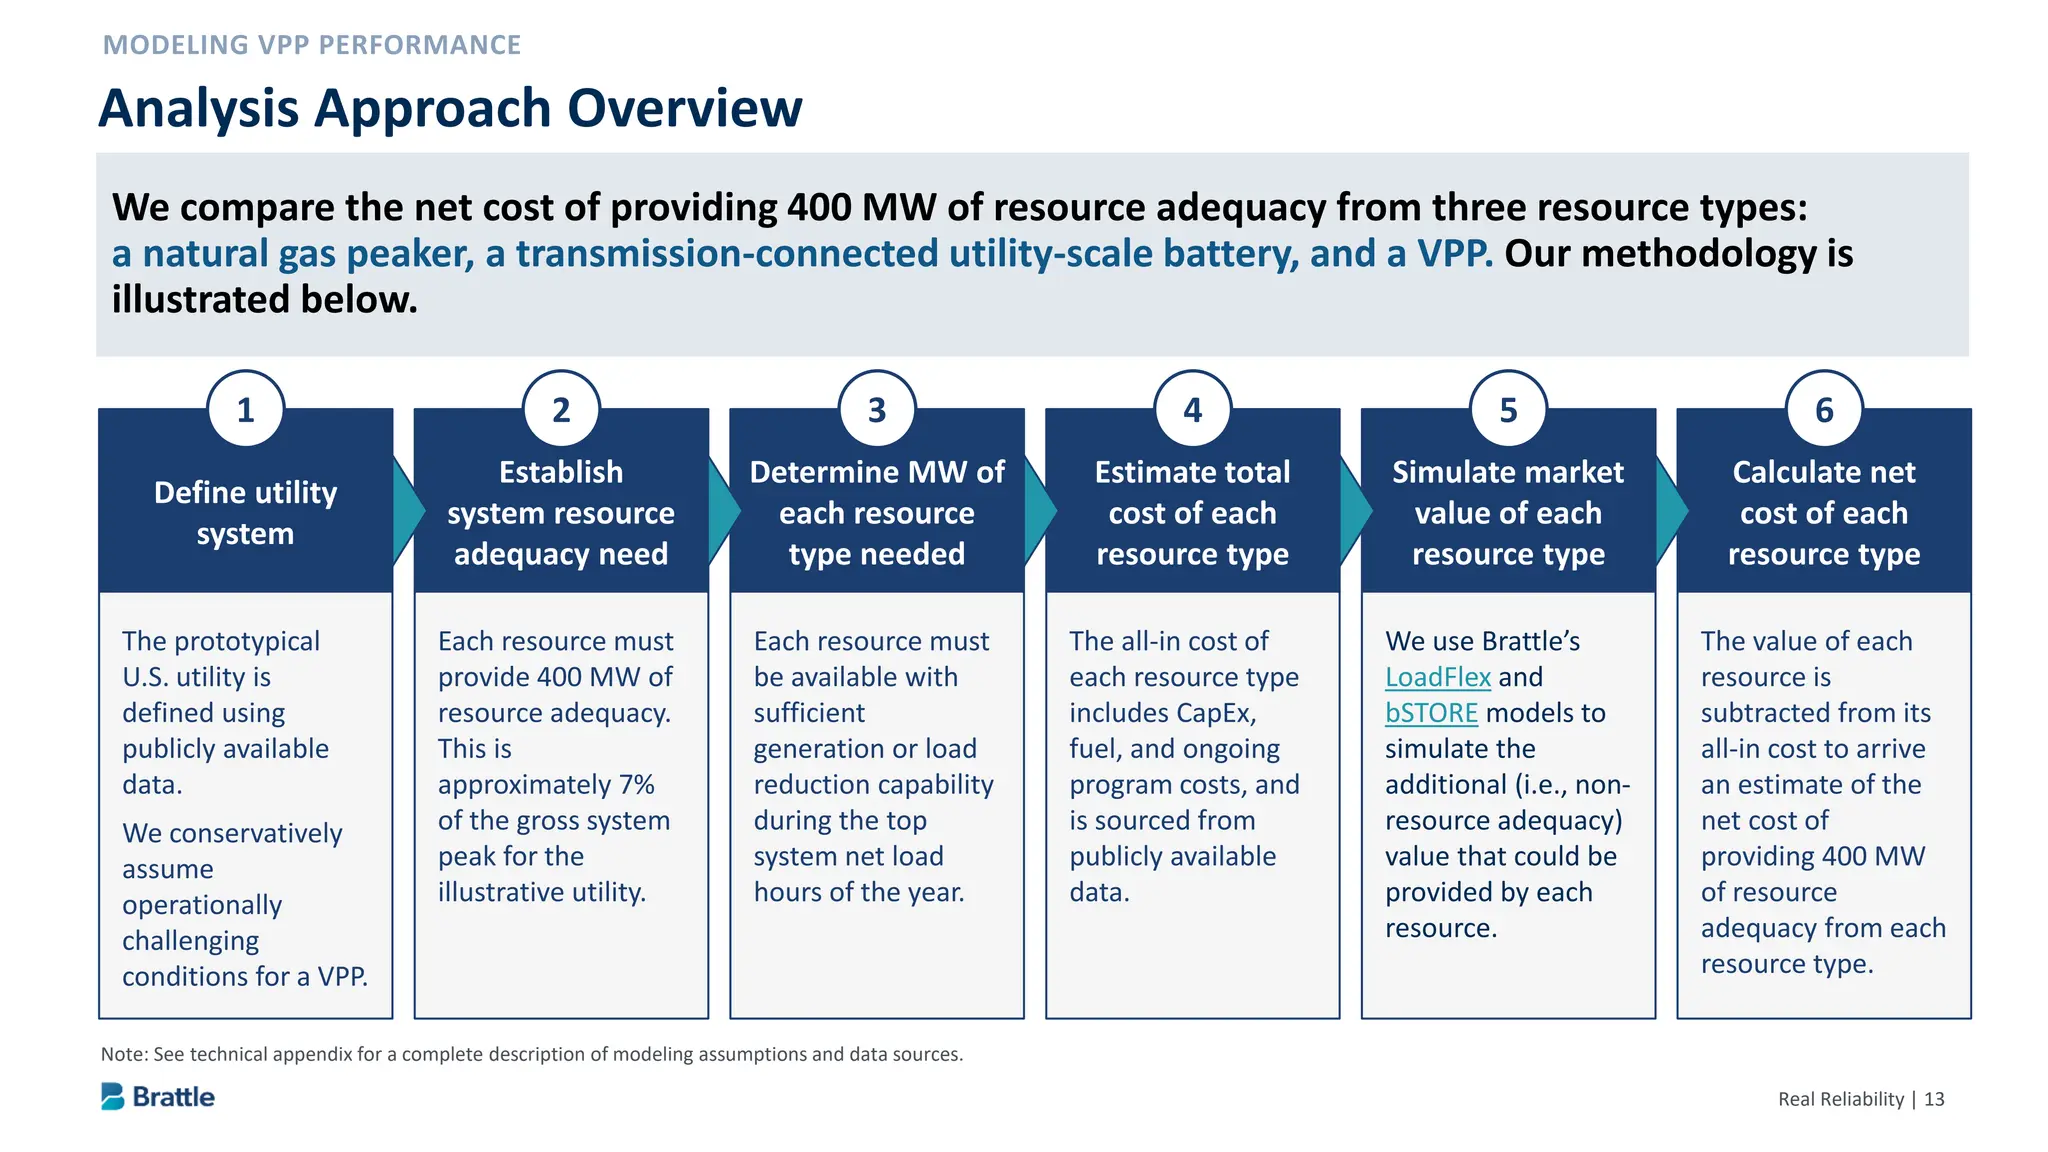
Analysis Approach Overview
Note: See technical appendix for a complete description of modeling assumptions and data sources.
Define utility
system
1
The prototypical
U.S. utility is
defined using
publicly available
data.
We conservatively
assume
operationally
challenging
conditions for a VPP.
Establish
system resource
adequacy need
2
Each resource must
provide 400 MW of
resource adequacy.
This is
approximately 7%
of the gross system
peak for the
illustrative utility.
Determine MW of
each resource
type needed
3
Each resource must
be available with
sufficient
generation or load
reduction capability
during the top
system net load
hours of the year.
Estimate total
cost of each
resource type
4
The all-in cost of
each resource type
includes CapEx,
fuel, and ongoing
program costs, and
is sourced from
publicly available
data.
Simulate market
value of each
resource type
5
We use Brattle’s
LoadFlex and
bSTORE models to
simulate the
additional (i.e., non-
resource adequacy)
value that could be
provided by each
resource.
Calculate net
cost of each
resource type
6
The value of each
resource is
subtracted from its
all-in cost to arrive
an estimate of the
net cost of
providing 400 MW
of resource
adequacy from each
resource type.
We compare the net cost of providing 400 MW of resource adequacy from three resource types:
a natural gas peaker, a transmission-connected utility-scale battery, and a VPP. Our methodology is
illustrated below.
15.
Real Reliability |14
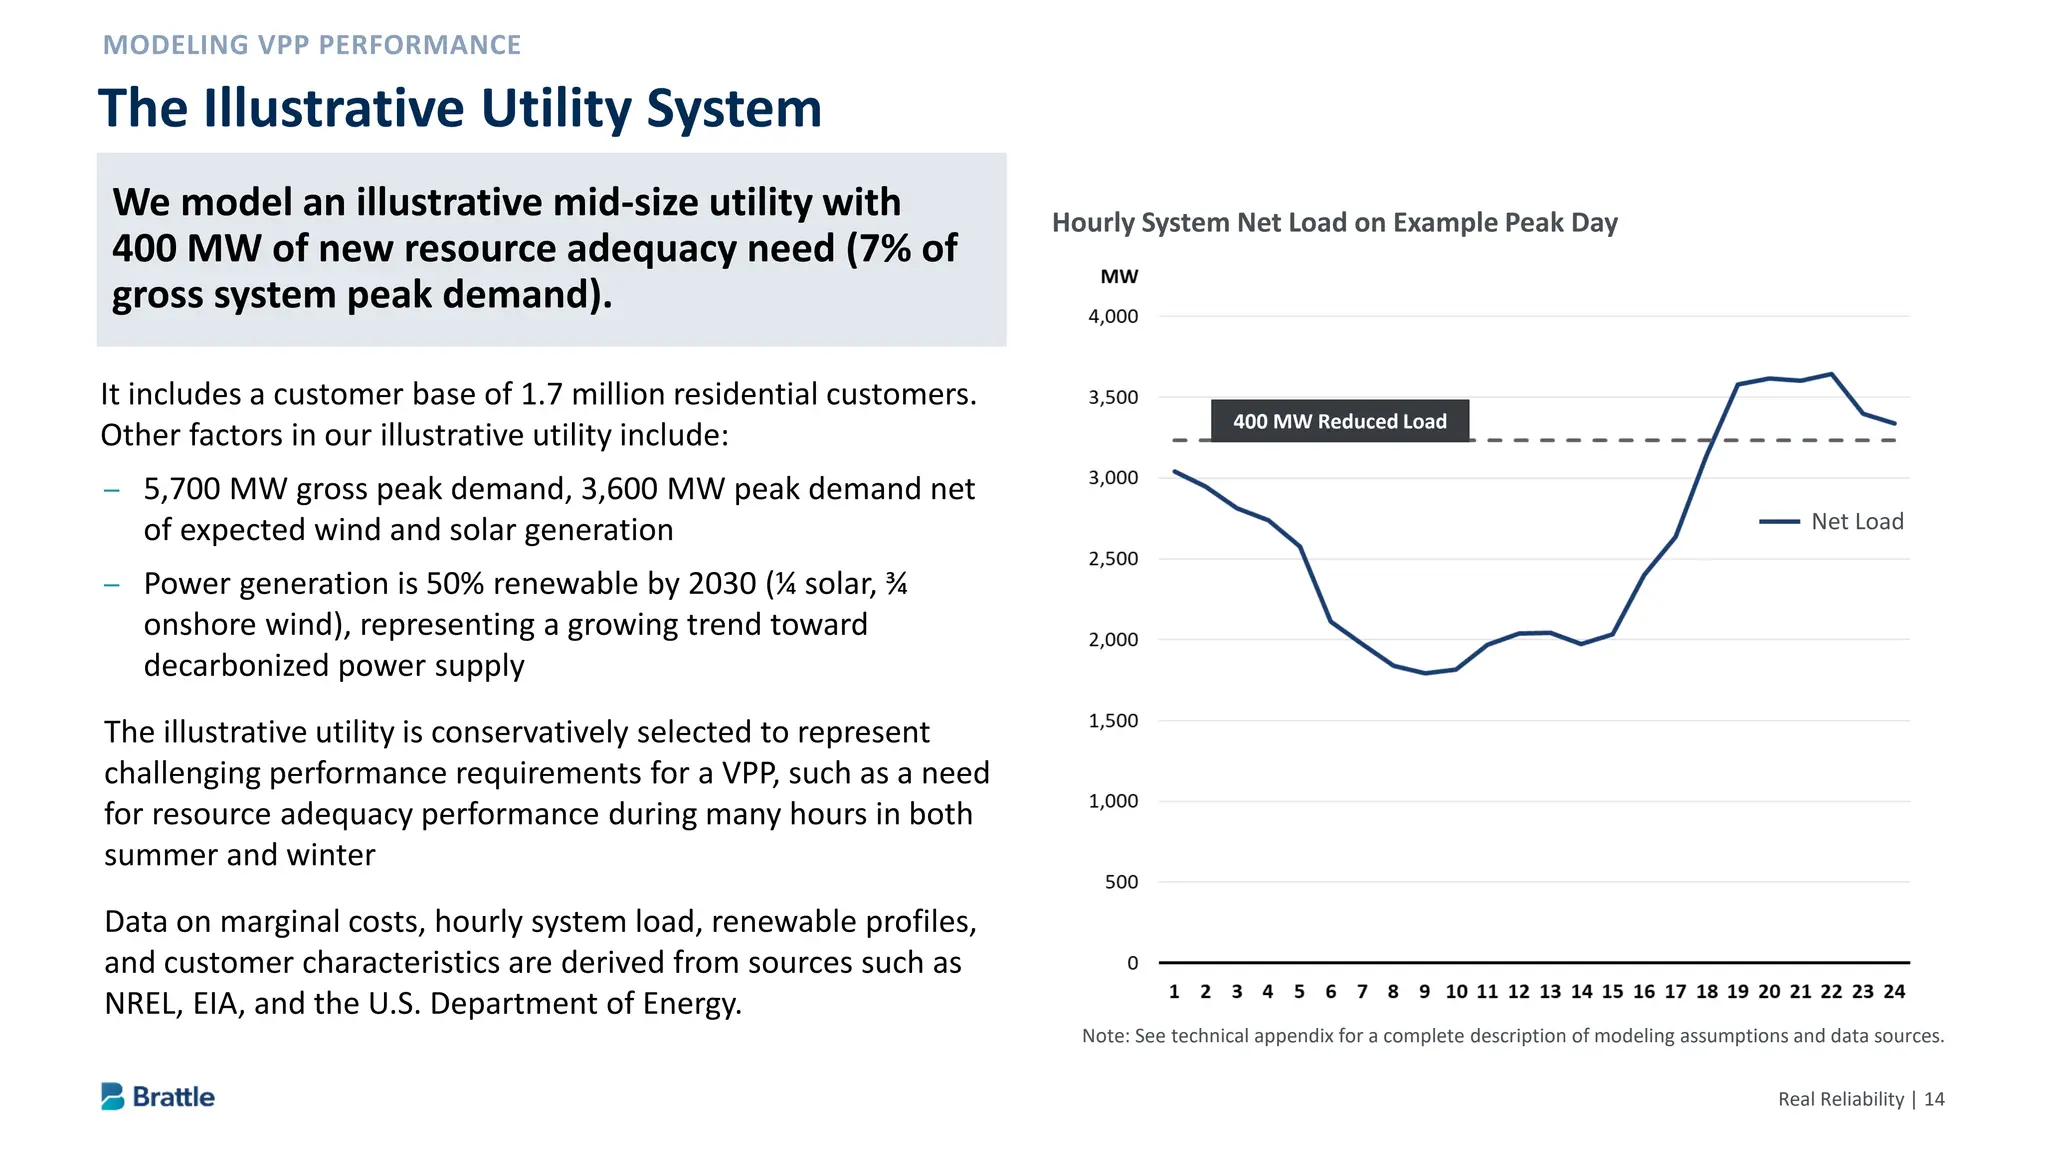
We model an illustrative mid-size utility with 400 MW
of new resource adequacy need (7% of gross system
peak demand).
It includes a customer base of 1.7 million residential customers.
Other factors in our illustrative utility include:
– 5,700 MW gross peak demand, 3,600 MW peak demand net
of expected wind and solar generation
– Power generation is 50% renewable by 2030 (¼ solar, ¾
onshore wind), representing a growing trend toward
decarbonized power supply
The illustrative utility is conservatively selected to represent
challenging performance requirements for a VPP, such as a need
for resource adequacy performance during many hours in both
summer and winter
Data on marginal costs, hourly system load, renewable profiles,
and customer characteristics are derived from sources such as
NREL, EIA, and the U.S. Department of Energy.
The Illustrative Utility System
Net Load
400 MW Reduced Load
Note: See technical appendix for a complete description of modeling assumptions and data sources.
Hourly System Net Load on Example Peak Day
We model an illustrative mid-size utility with
400 MW of new resource adequacy need (7% of
gross system peak demand).
16.
Real Reliability |15
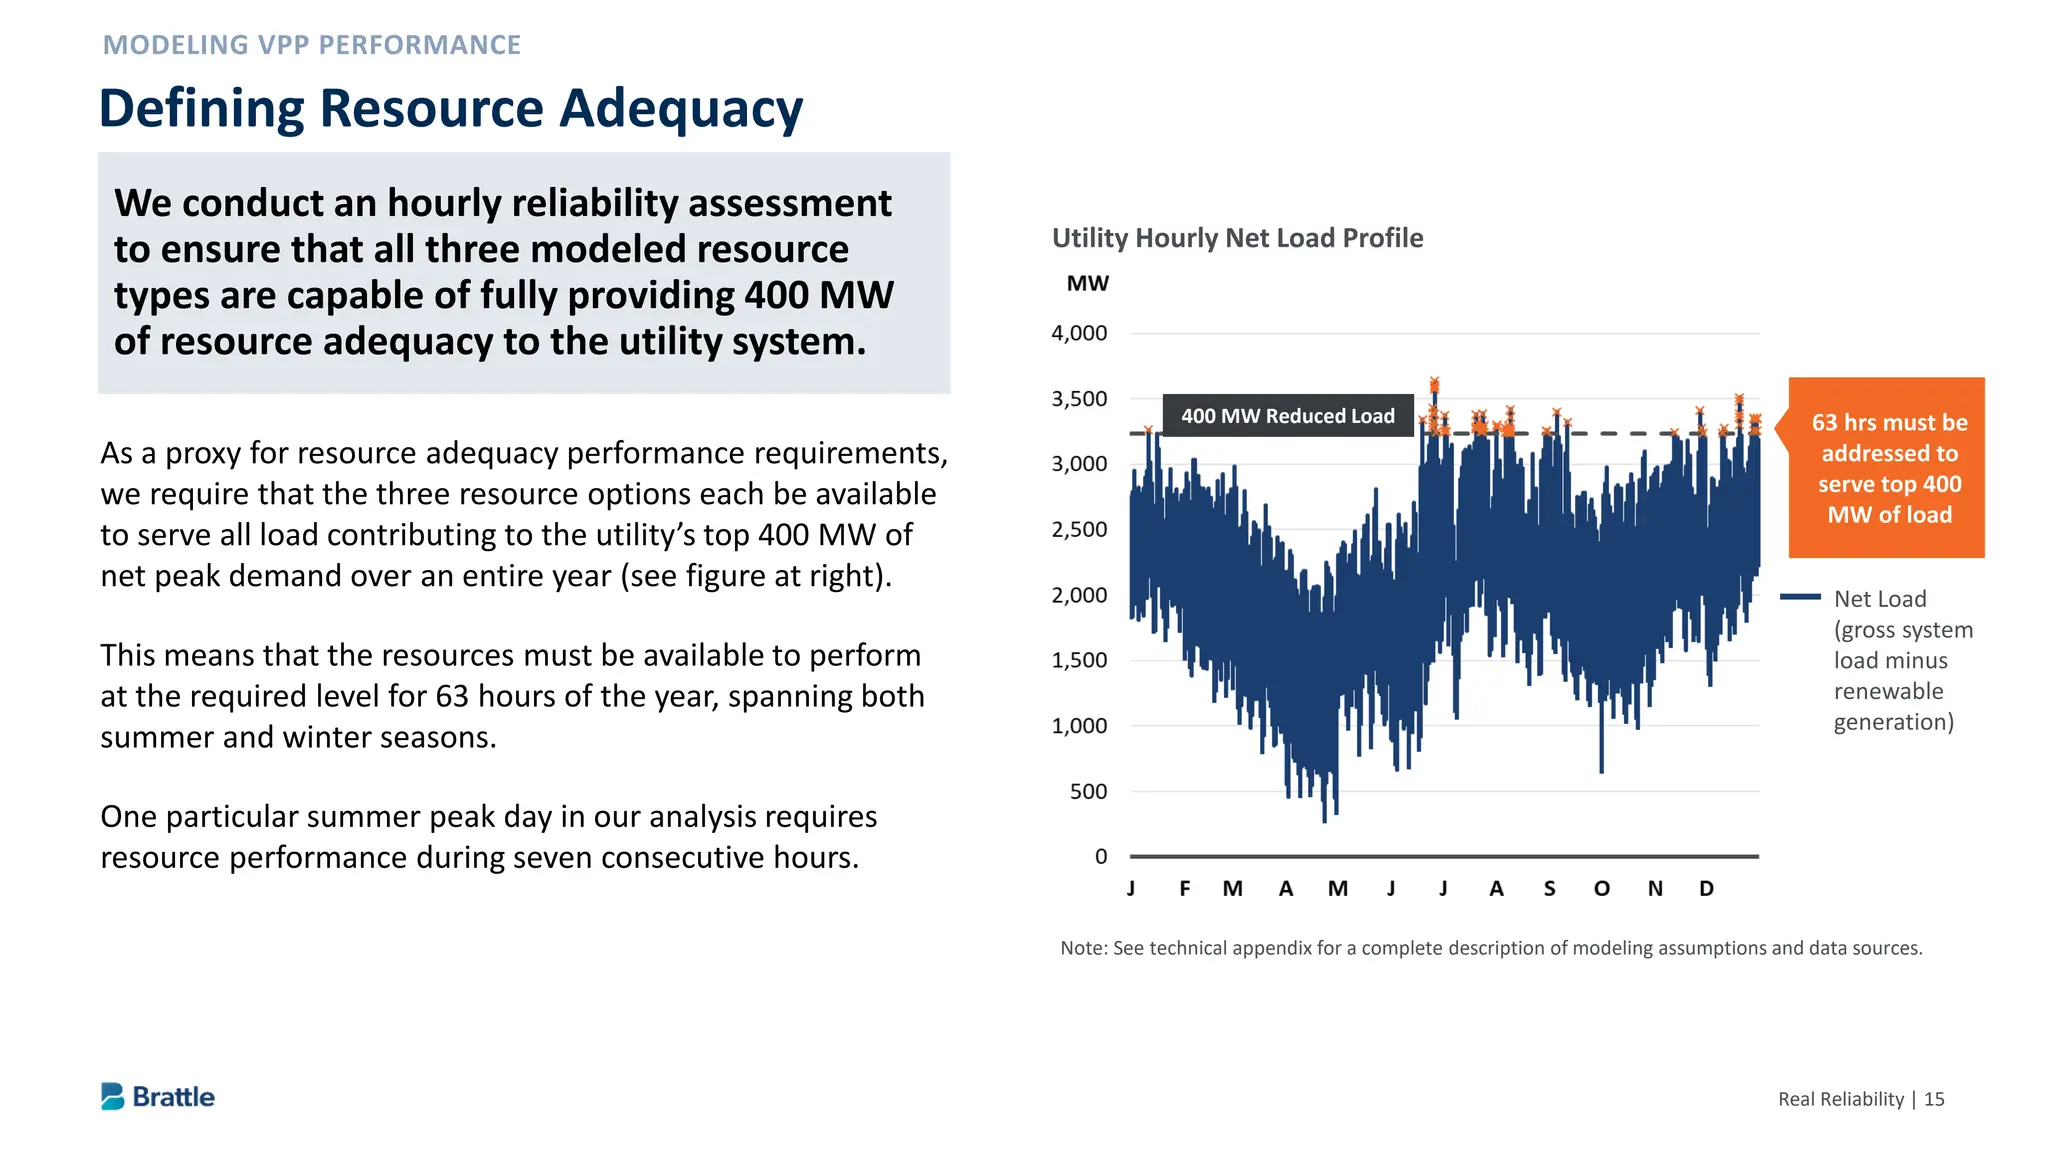
We conduct an hourly reliability assessment to ensure
that all three modeled resource types are capable of
fully providing 400 MW of resource adequacy to the
utility system.
As a proxy for resource adequacy performance requirements,
we require that the three resource options each be available
to serve all load contributing to the utility’s top 400 MW of
net peak demand over an entire year (see figure at right).
This means that the resources must be available to perform
at the required level for 63 hours of the year, spanning both
summer and winter seasons.
One particular summer peak day in our analysis requires
resource performance during seven consecutive hours.
Defining Resource Adequacy
Utility Hourly Net Load Profile
400 MW Reduced Load
Net Load
(gross system
load minus
renewable
generation)
63 hrs must be
addressed to
serve top 400
MW of load
Note: See technical appendix for a complete description of modeling assumptions and data sources.
We conduct an hourly reliability assessment
to ensure that all three modeled resource
types are capable of fully providing 400 MW
of resource adequacy to the utility system.
17.
Real Reliability |16
Calculating the Net Cost of Resource Adequacy
Notes:
[1] Negative “value” indicates that the resource increases cost (e.g., a gas peaker increasing GHG emissions).
[2] Excluding societal value from the calculation results in an estimate of the net resource cost from the perspective of the utility or system operator.
Net cost of
resource adequacy
Cost of installing
and operating
resource
CapEx
Fuel
Operations &
Maintenance (O&M)
Program costs
System value of
resource1
Energy value
T&D investment
deferral
Ancillary services value
Societal value of
resource1,2
GHG emissions
reduction
Resilience value
Our analysis estimates the cost of providing resource adequacy from each of the three resource
types, net of any additional value those resources provide to the system and to society. The result
is the “net cost” of providing resource adequacy.
18.
Real Reliability |17
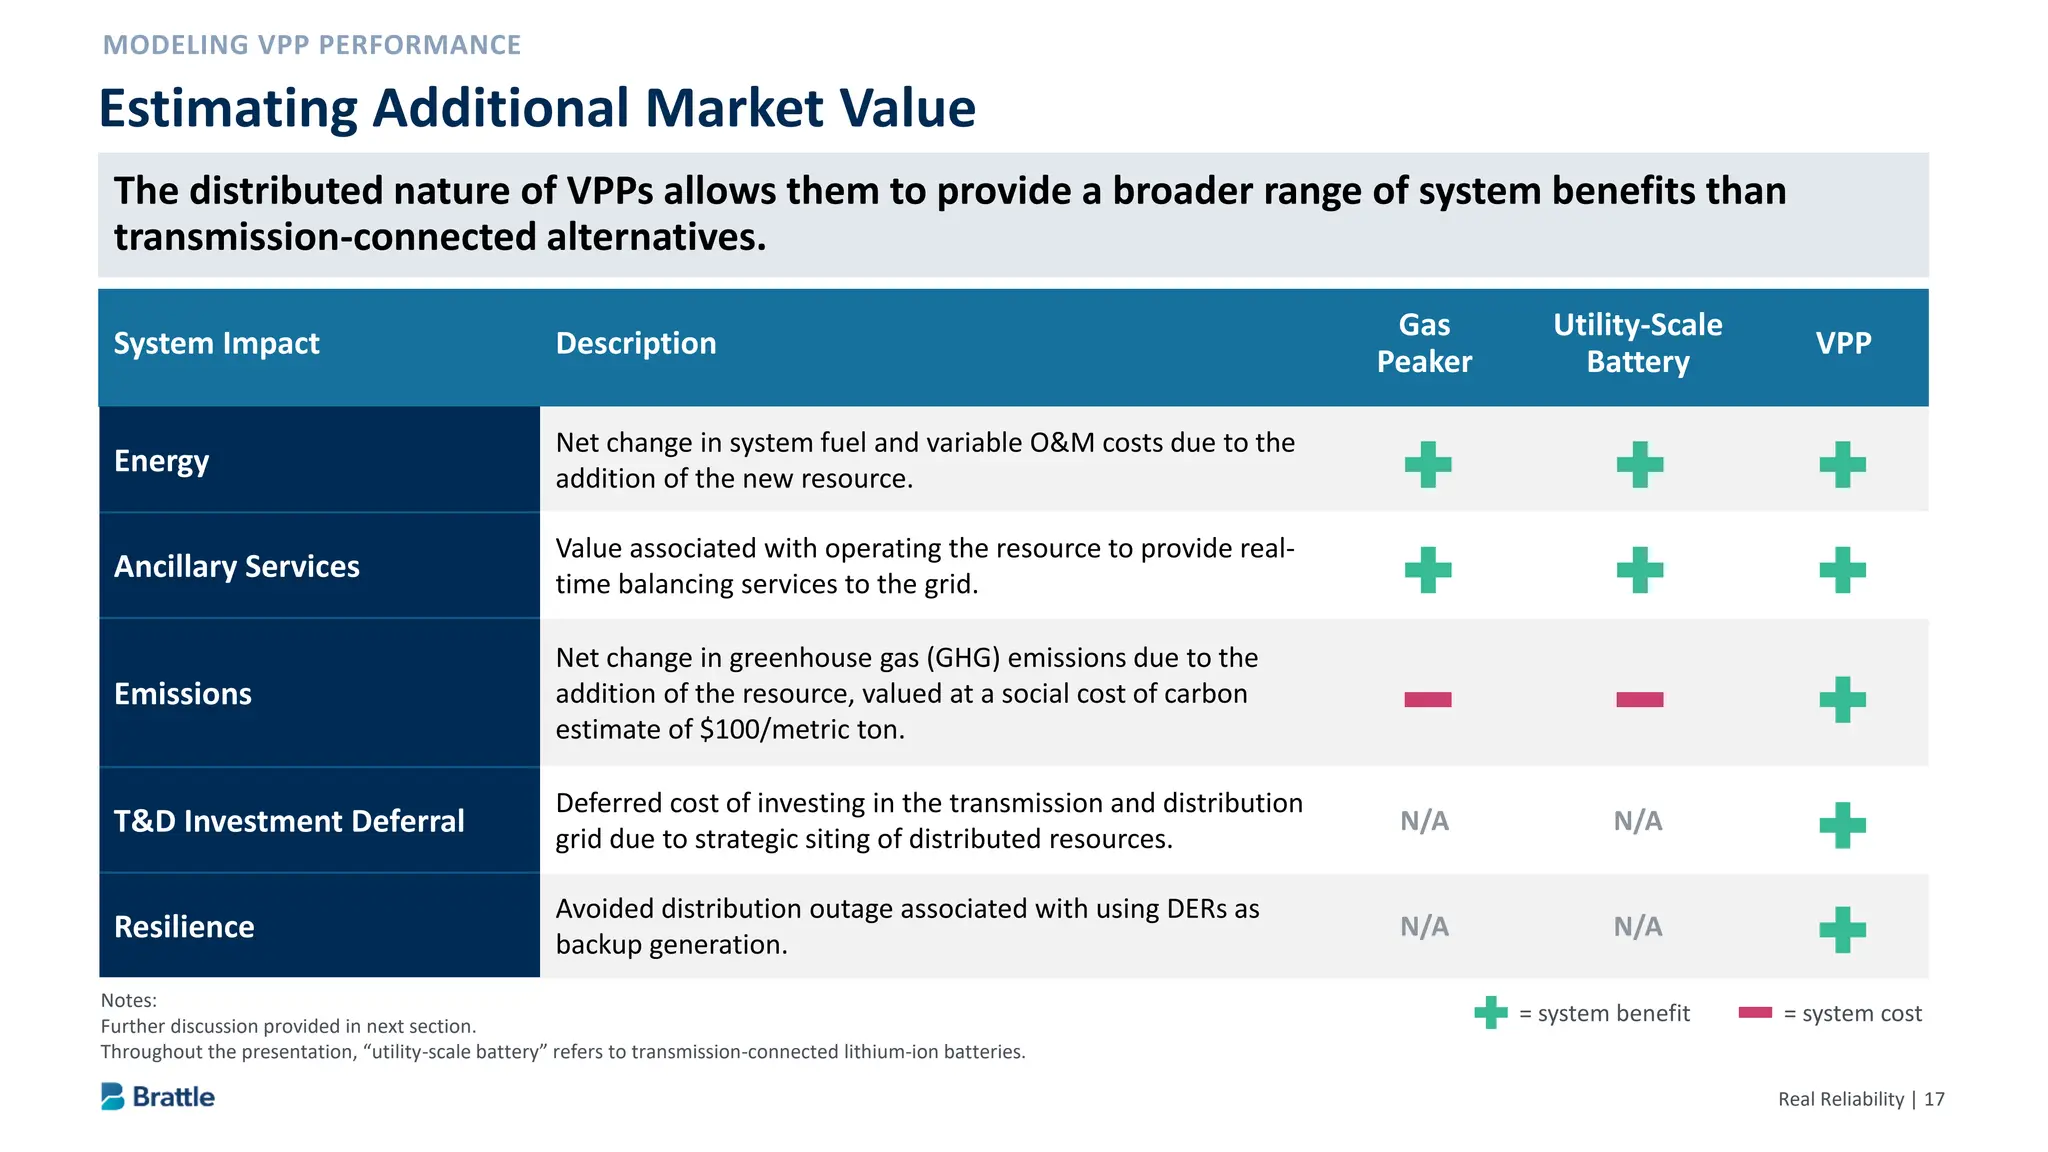
Estimating Additional Market Value
Notes:
Further discussion provided in next section.
Throughout the presentation, “utility-scale battery” refers to transmission-connected lithium-ion batteries.
System Impact Description
Gas
Peaker
Utility-Scale
Battery
VPP
Energy
Net change in system fuel and variable O&M costs due to the
addition of the new resource. + + +
Ancillary Services
Value associated with operating the resource to provide real-
time balancing services to the grid. + + +
Emissions
Net change in greenhouse gas (GHG) emissions due to the
addition of the resource, valued at a social cost of carbon
estimate of $100/metric ton.
- - +
T&D Investment Deferral
Deferred cost of investing in the transmission and distribution
grid due to strategic siting of distributed resources.
N/A N/A +
Resilience
Avoided distribution outage associated with using DERs as
backup generation.
N/A N/A +
= system benefit = system cost
The distributed nature of VPPs allows them to provide a broader range of system benefits than
transmission-connected alternatives.
19.
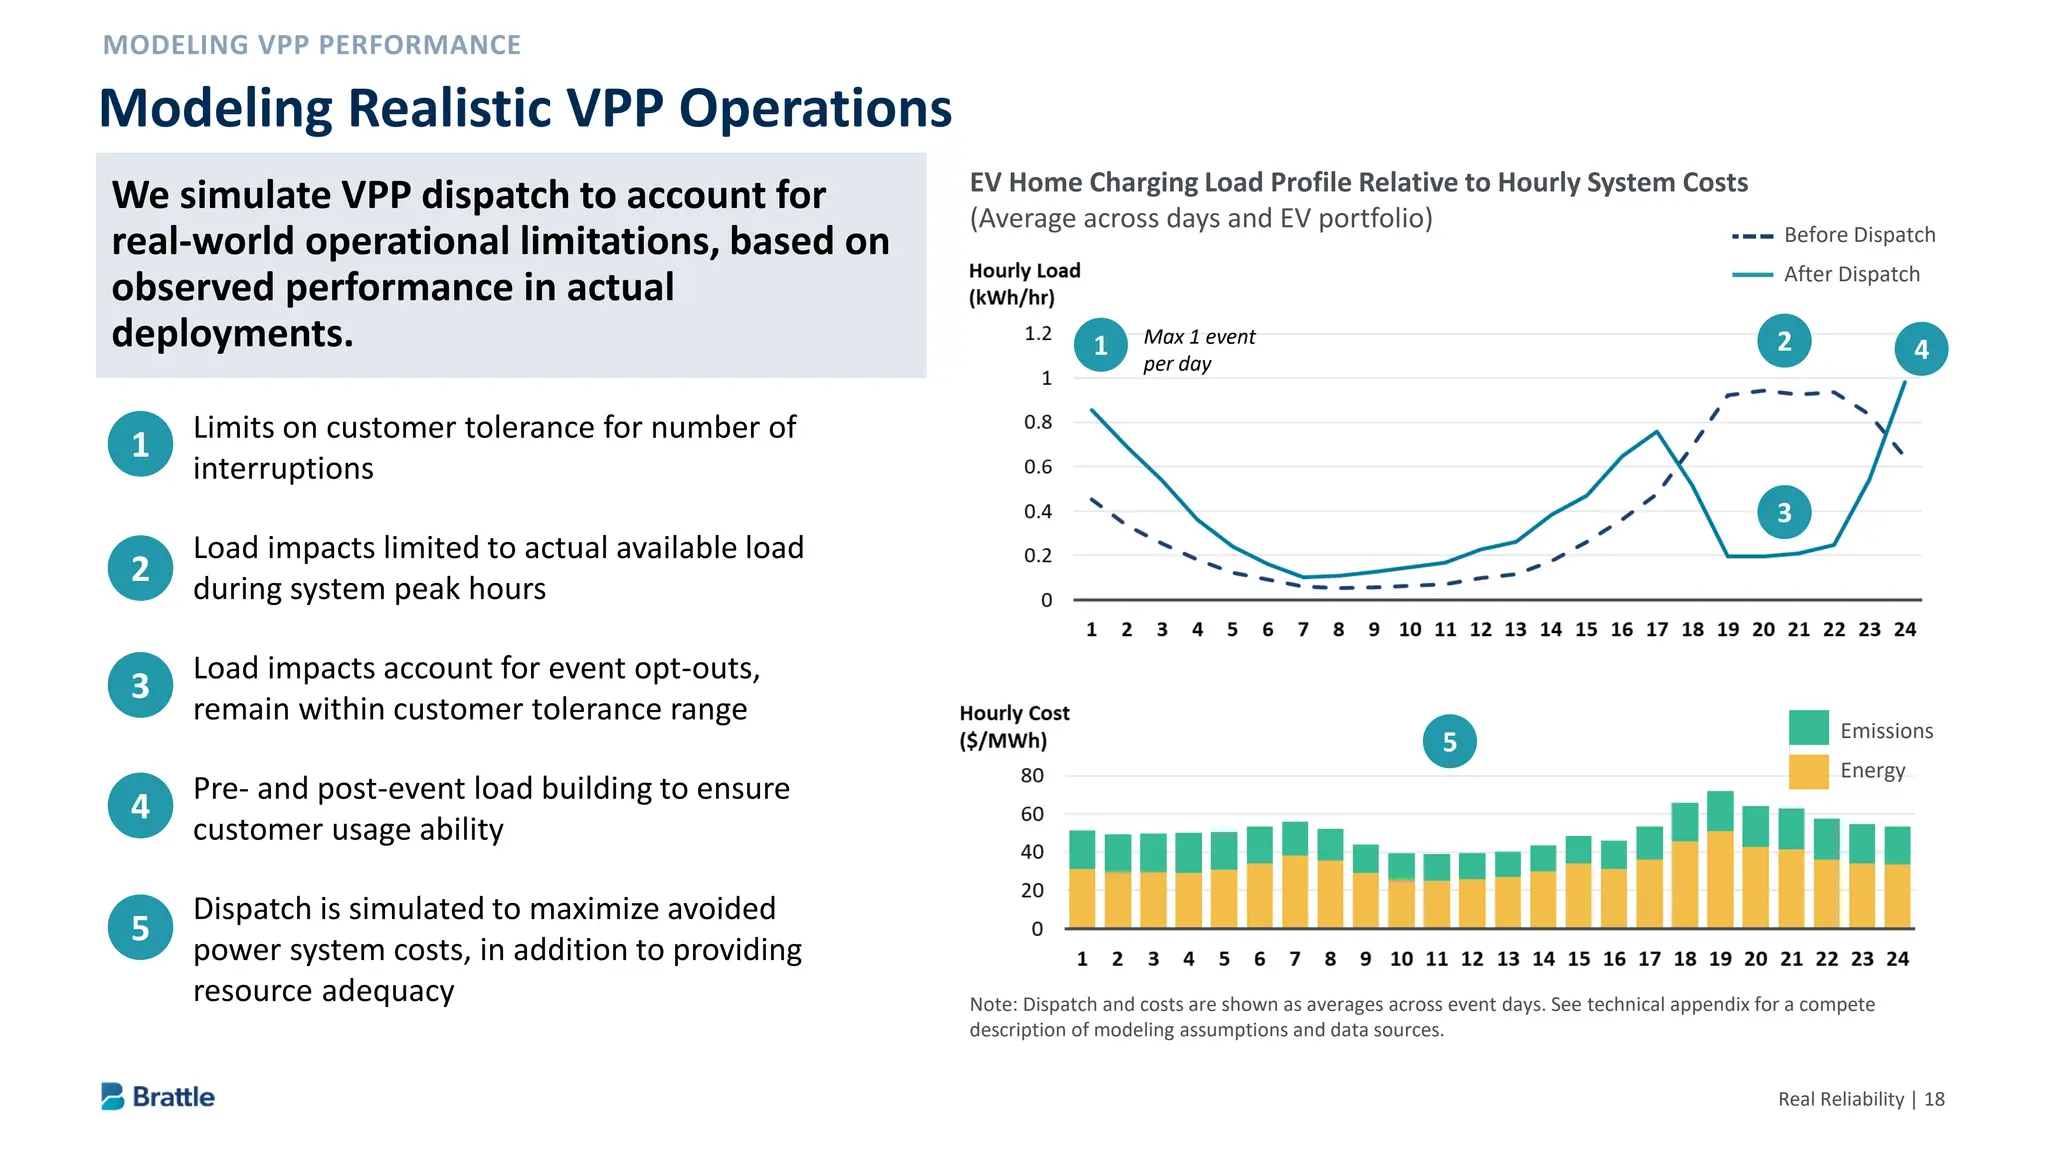
Real Reliability |18
We simulate VPP dispatch to account for real-
world operational limitations, based on
observed performance in actual deployments.
Limits on customer tolerance for number of
interruptions
Load impacts limited to actual available load
during system peak hours
Load impacts account for event opt-outs,
remain within customer tolerance range
Pre- and post-event load building to ensure
customer usage ability
Dispatch is simulated to maximize avoided
power system costs, in addition to providing
resource adequacy
Modeling Realistic VPP Operations
EV Home Charging Load Profile Relative to Hourly System Costs
(Average across days and EV portfolio)
1 2
3
4
5
Max 1 event
per day
Note: Dispatch and costs are shown as averages across event days. See technical appendix for a compete
description of modeling assumptions and data sources.
Before Dispatch
After Dispatch
Emissions
Energy
1
2
3
4
5
We simulate VPP dispatch to account for
real-world operational limitations, based on
observed performance in actual
deployments.
20.
Real Reliability |19
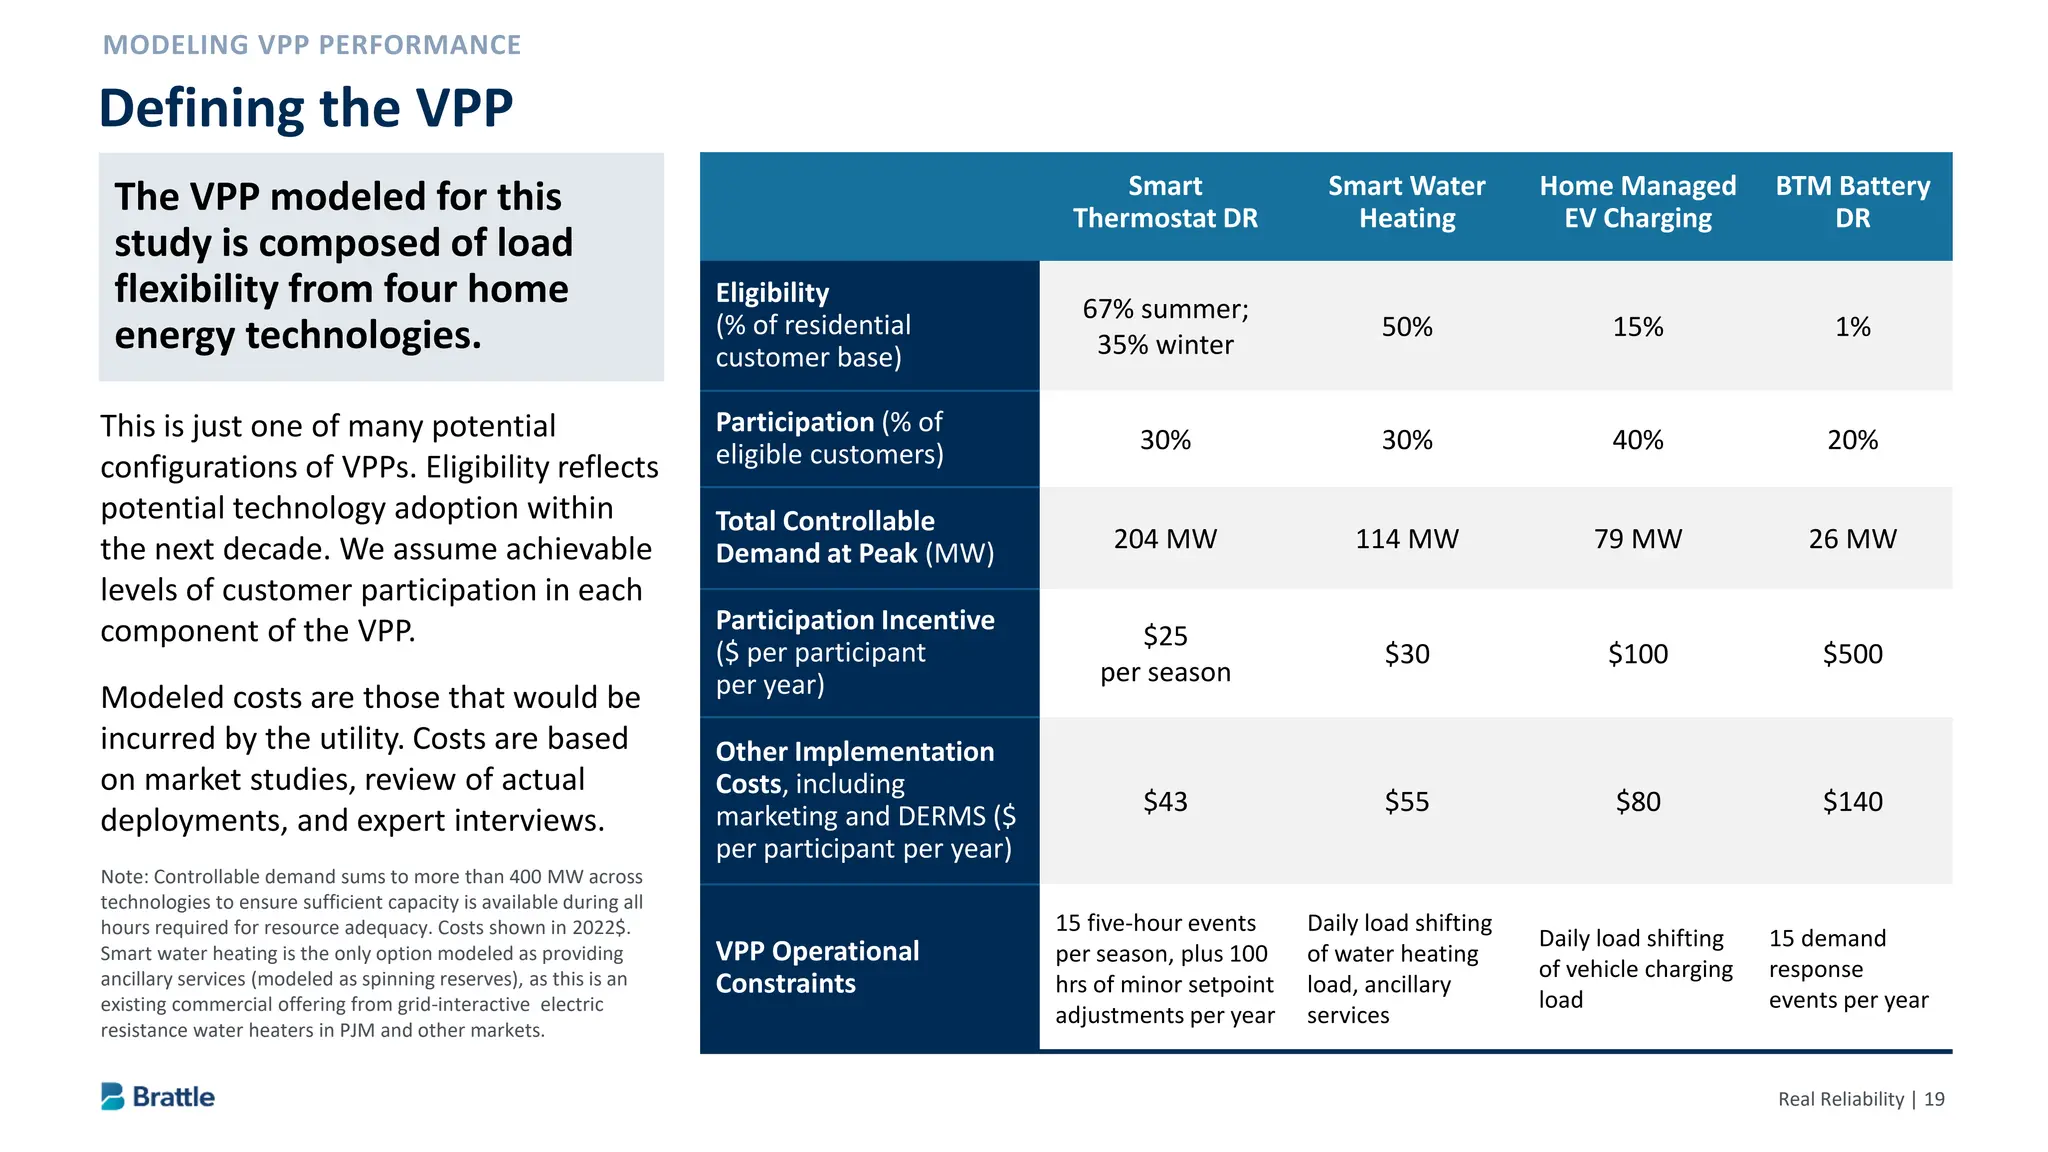
The VPP modeled for this study is
composed of load flexibility from
four home energy technologies.
This is just one of many potential
configurations of VPPs. Eligibility reflects
potential technology adoption within
the next decade. We assume achievable
levels of customer participation in each
component of the VPP.
Modeled costs are those that would be
incurred by the utility. Costs are based
on market studies, review of actual
deployments, and expert interviews.
Defining the VPP
Note: Controllable demand sums to more than 400 MW across
technologies to ensure sufficient capacity is available during all
hours required for resource adequacy. Costs shown in 2022$.
Smart water heating is the only option modeled as providing
ancillary services (modeled as spinning reserves), as this is an
existing commercial offering from grid-interactive electric
resistance water heaters in PJM and other markets.
Smart
Thermostat DR
Smart Water
Heating
Home Managed
EV Charging
BTM Battery
DR
Eligibility
(% of residential
customer base)
67% summer;
35% winter
50% 15% 1%
Participation (% of
eligible customers) 30% 30% 40% 20%
Total Controllable
Demand at Peak (MW) 204 MW 114 MW 79 MW 26 MW
Participation Incentive
($ per participant
per year)
$25
per season
$30 $100 $500
Other Implementation
Costs, including
marketing and DERMS ($
per participant per year)
$43 $55 $80 $140
VPP Operational
Constraints
15 five-hour events
per season, plus 100
hrs of minor setpoint
adjustments per year
Daily load shifting
of water heating
load, ancillary
services
Daily load shifting
of vehicle charging
load
15 demand
response
events per year
The VPP modeled for this
study is composed of load
flexibility from four home
energy technologies.
Real Reliability |21
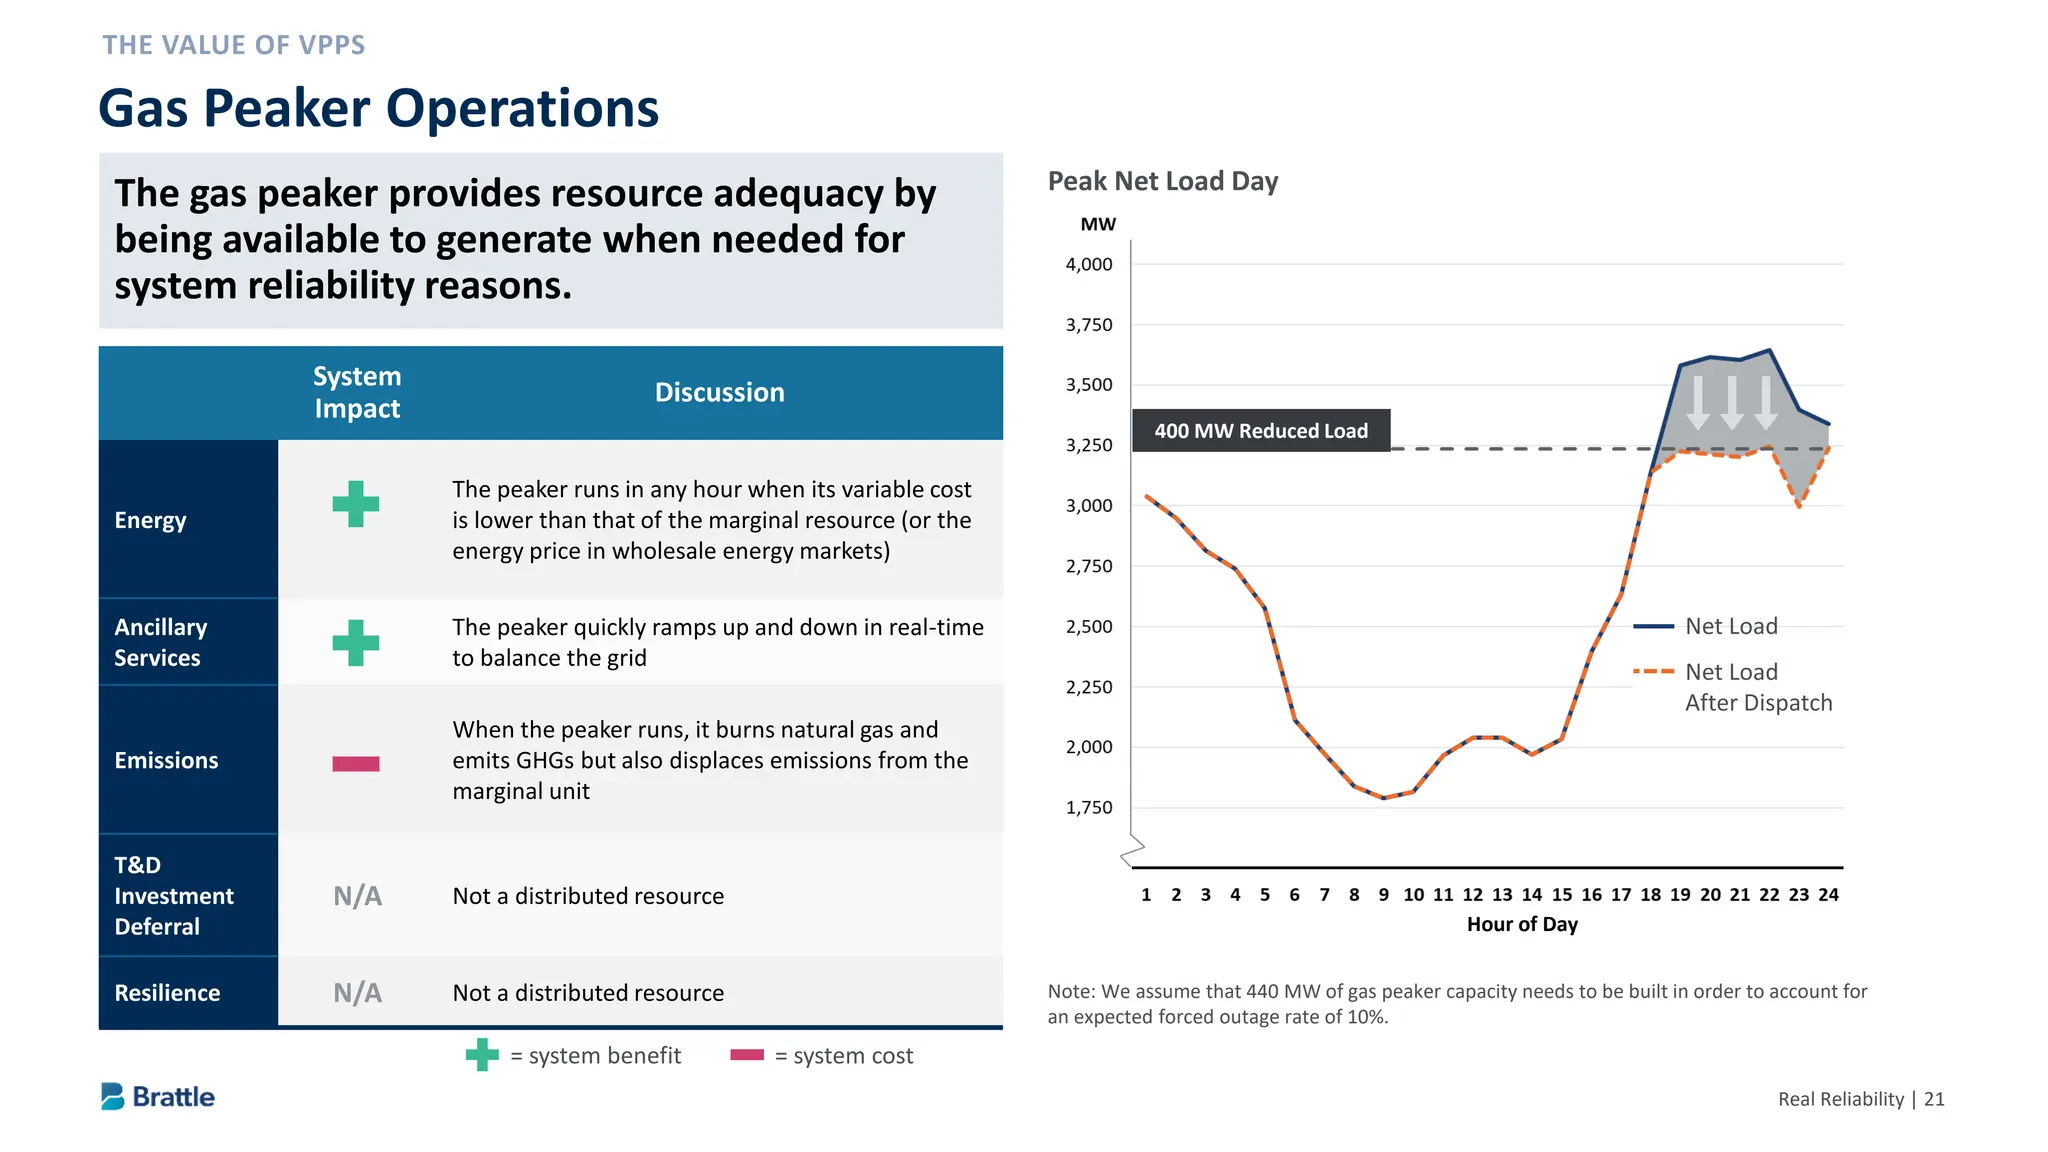
Gas Peaker Operations
System
Impact
Discussion
Energy
The peaker runs in any hour when its variable cost
is lower than that of the marginal resource (or the
energy price in wholesale energy markets)
Ancillary
Services
The peaker quickly ramps up and down in real-time
to balance the grid
Emissions
When the peaker runs, it burns natural gas and
emits GHGs but also displaces emissions from the
marginal unit
T&D
Investment
Deferral
N/A Not a distributed resource
Resilience N/A Not a distributed resource
Hour of Day
Peak Net Load Day
Note: We assume that 440 MW of gas peaker capacity needs to be built in order to account for
an expected forced outage rate of 10%.
Net Load
Net Load
After Dispatch
400 MW Reduced Load
= system benefit = system cost
The gas peaker provides resource adequacy by
being available to generate when needed for
system reliability reasons.
23.
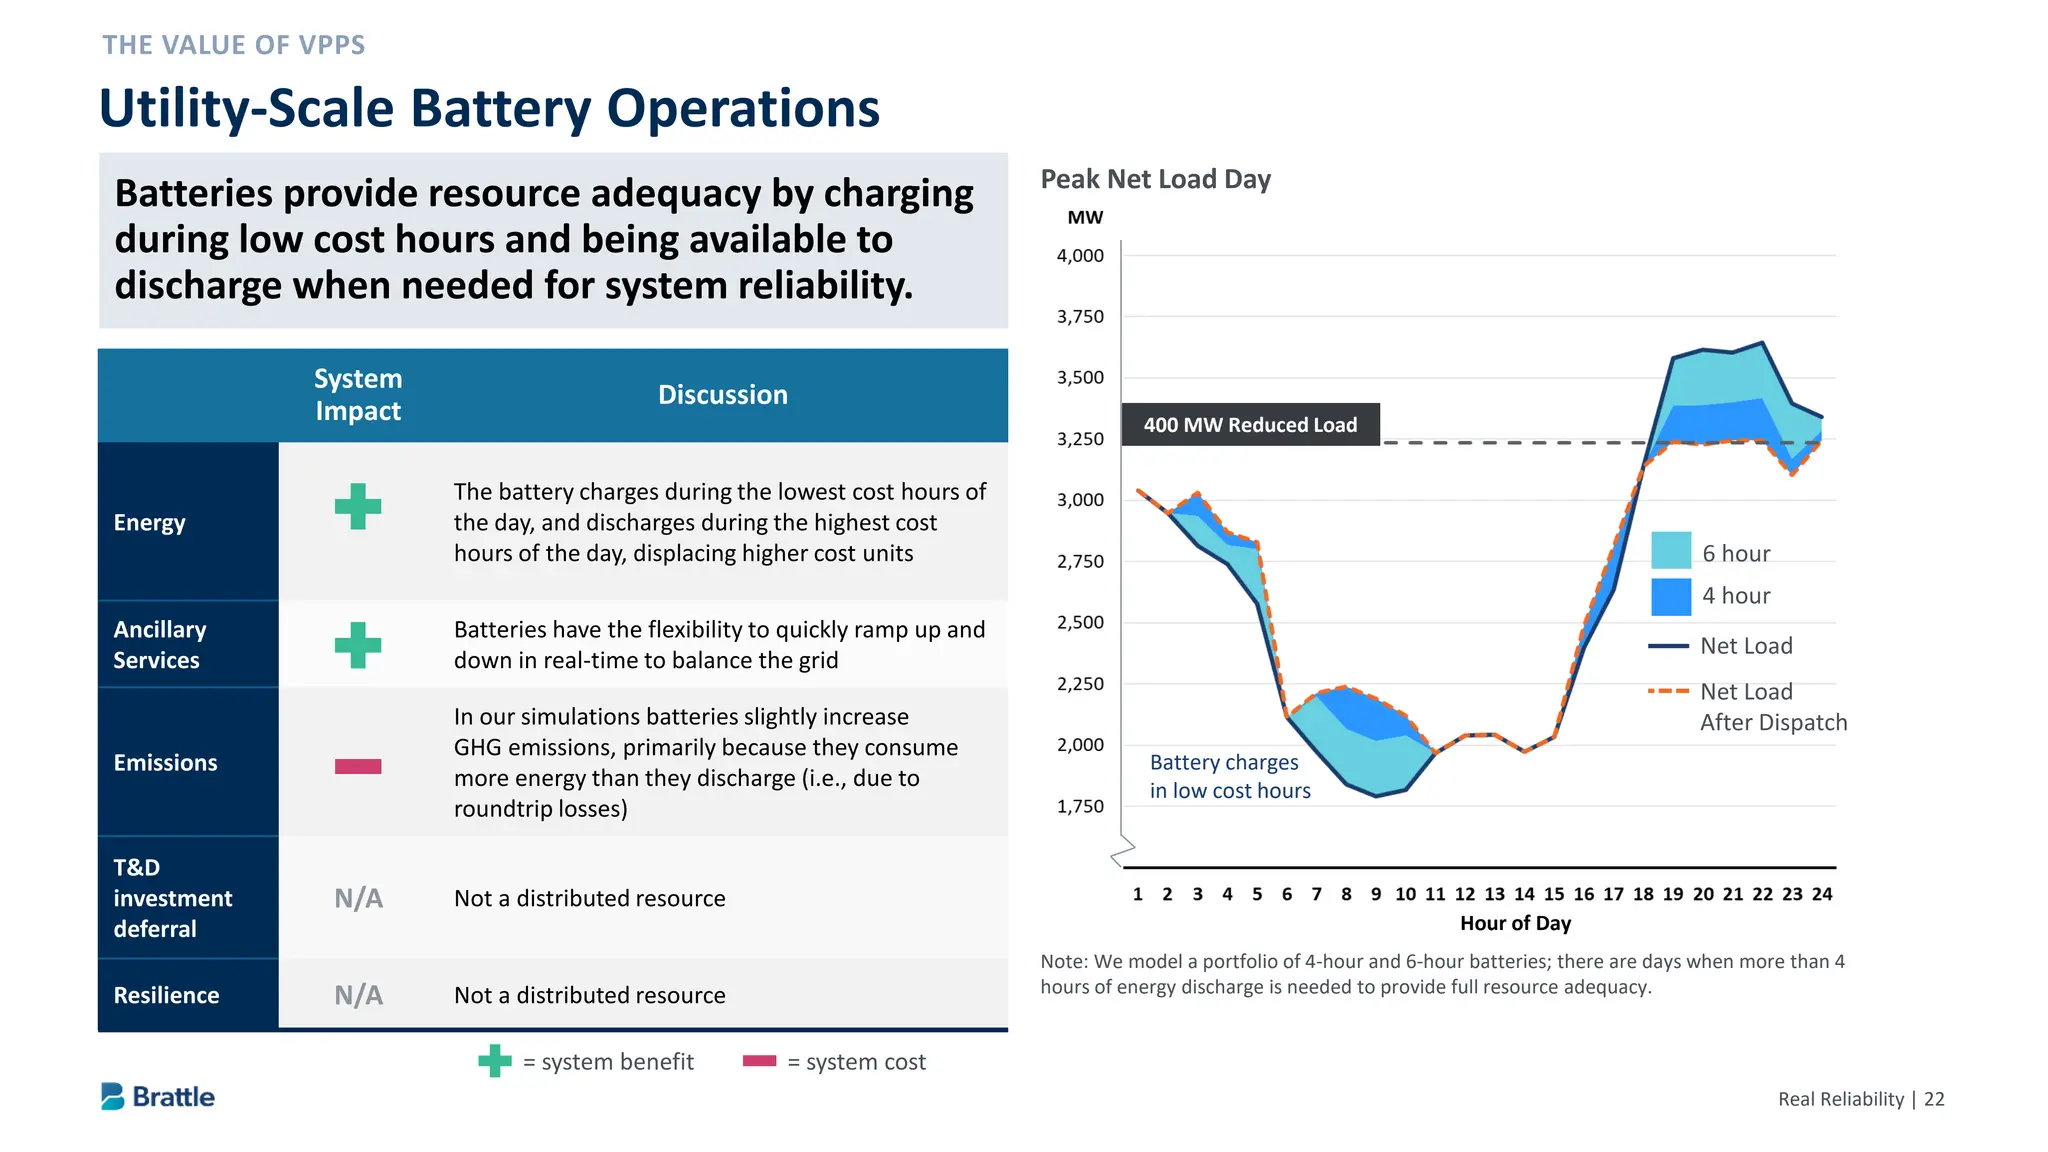
Real Reliability |22
Utility-Scale Battery Operations
System
Impact
Discussion
Energy
The battery charges during the lowest cost hours of
the day, and discharges during the highest cost
hours of the day, displacing higher cost units
Ancillary
Services
Batteries have the flexibility to quickly ramp up and
down in real-time to balance the grid
Emissions
In our simulations batteries slightly increase
GHG emissions, primarily because they consume
more energy than they discharge (i.e., due to
roundtrip losses)
T&D
investment
deferral
N/A Not a distributed resource
Resilience N/A Not a distributed resource
Note: We model a portfolio of 4-hour and 6-hour batteries; there are days when more than 4
hours of energy discharge is needed to provide full resource adequacy.
Hour of Day
400 MW Reduced Load
Peak Net Load Day
Net Load
Net Load
After Dispatch
6 hour
4 hour
Battery charges
in low cost hours
= system benefit = system cost
Batteries provide resource adequacy by charging
during low cost hours and being available to
discharge when needed for system reliability.
24.
Real Reliability |23
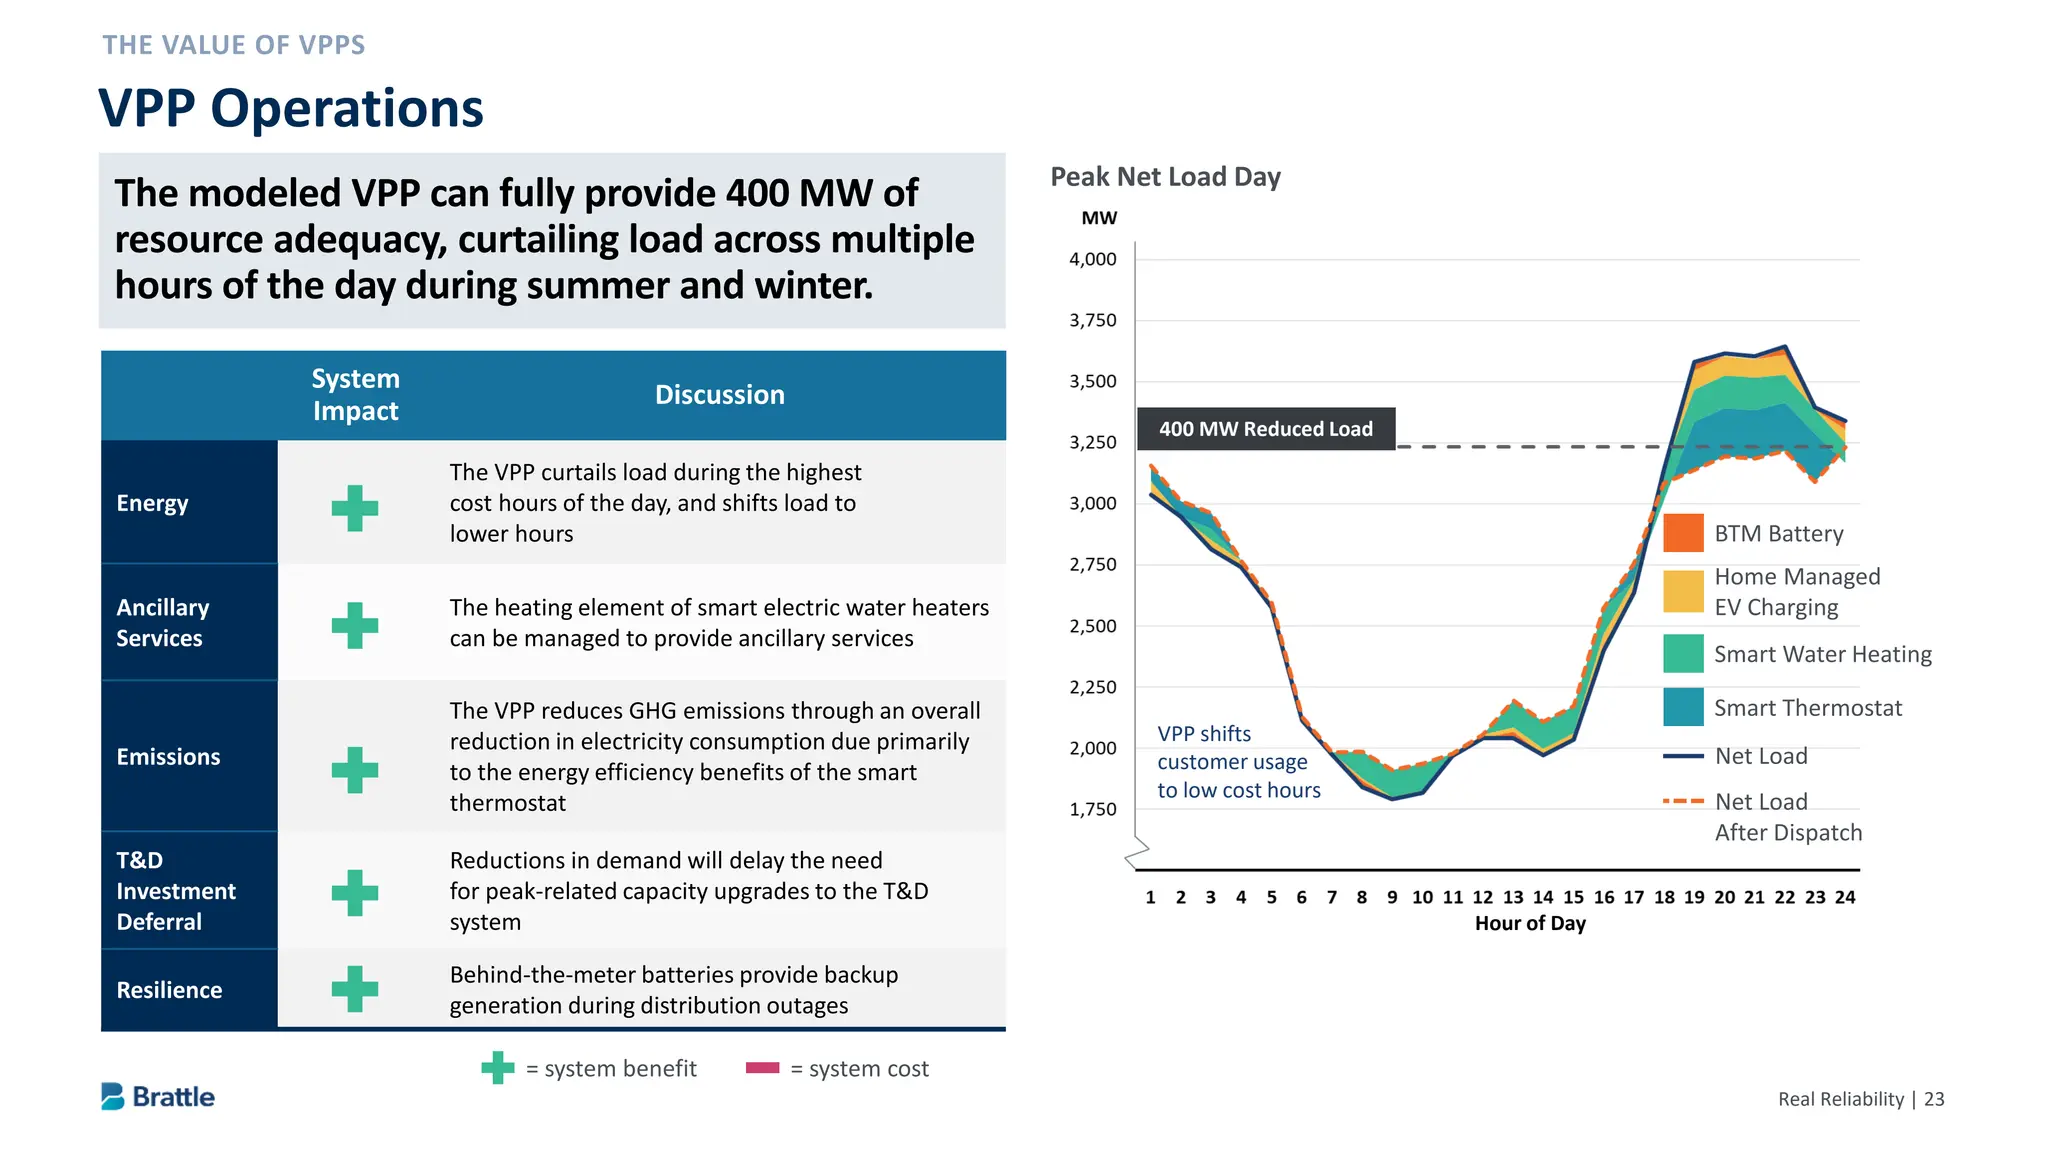
VPP Operations
System
Impact
Discussion
Energy
The VPP curtails load during the highest
cost hours of the day, and shifts load to
lower hours
Ancillary
Services
The heating element of smart electric water heaters
can be managed to provide ancillary services
Emissions
The VPP reduces GHG emissions through an overall
reduction in electricity consumption due primarily
to the energy efficiency benefits of the smart
thermostat
T&D
Investment
Deferral
Reductions in demand will delay the need
for peak-related capacity upgrades to the T&D
system
Resilience
Behind-the-meter batteries provide backup
generation during distribution outages
= system benefit = system cost
Net Load
Net Load
After Dispatch
Home Managed
EV Charging
Smart Water Heating
Smart Thermostat
BTM Battery
VPP shifts
customer usage
to low cost hours
Hour of Day
Peak Net Load Day
400 MW Reduced Load
The modeled VPP can fully provide 400 MW of
resource adequacy, curtailing load across multiple
hours of the day during summer and winter.
25.
Real Reliability |24
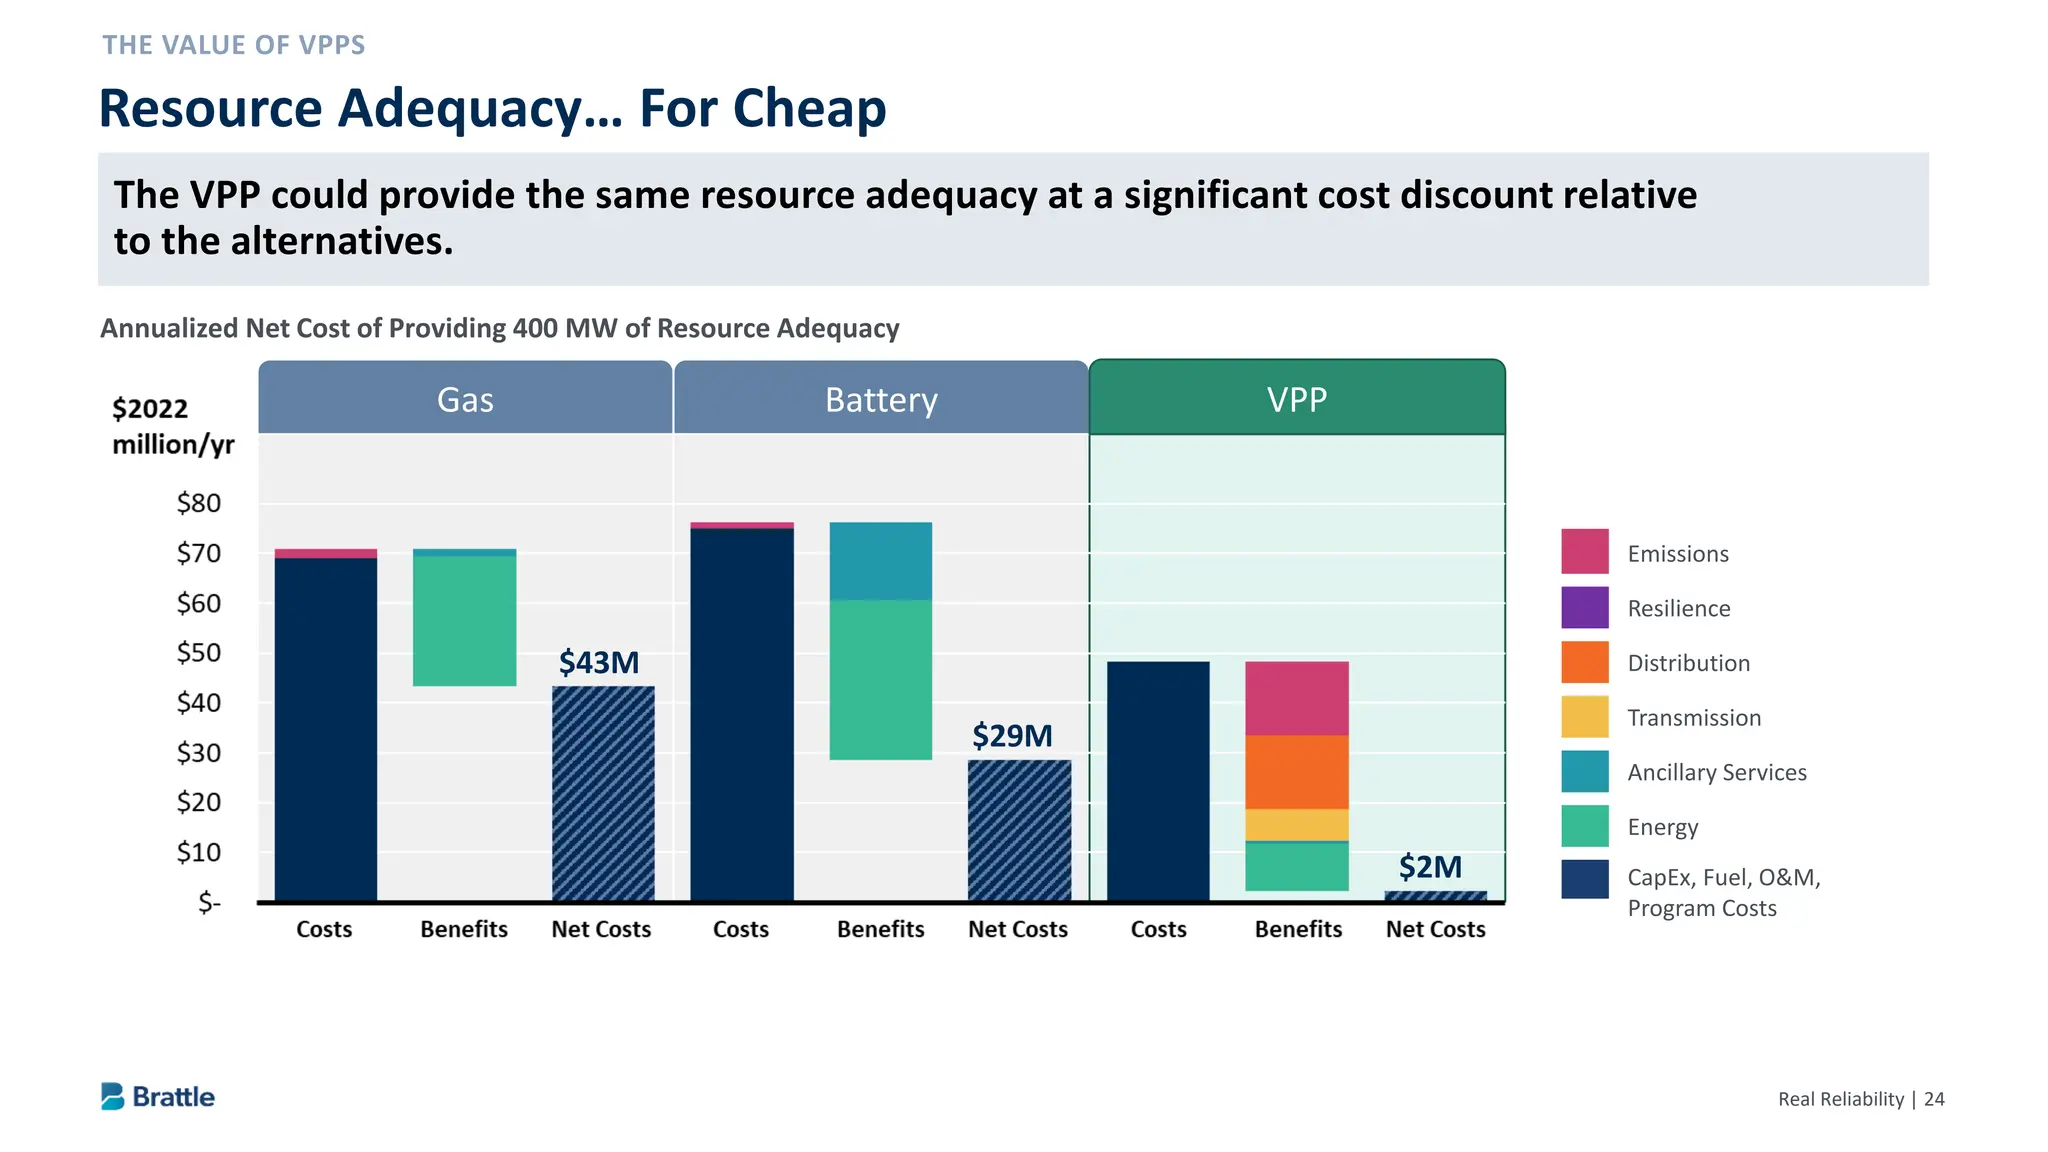
Resource Adequacy… For Cheap
Emissions
Resilience
Distribution
Transmission
Ancillary Services
Energy
CapEx, Fuel, O&M,
Program Costs
Gas Battery VPP
$43M
$29M
$2M
Annualized Net Cost of Providing 400 MW of Resource Adequacy
The VPP could provide the same resource adequacy at a significant cost discount relative
to the alternatives.
26.
Real Reliability |25
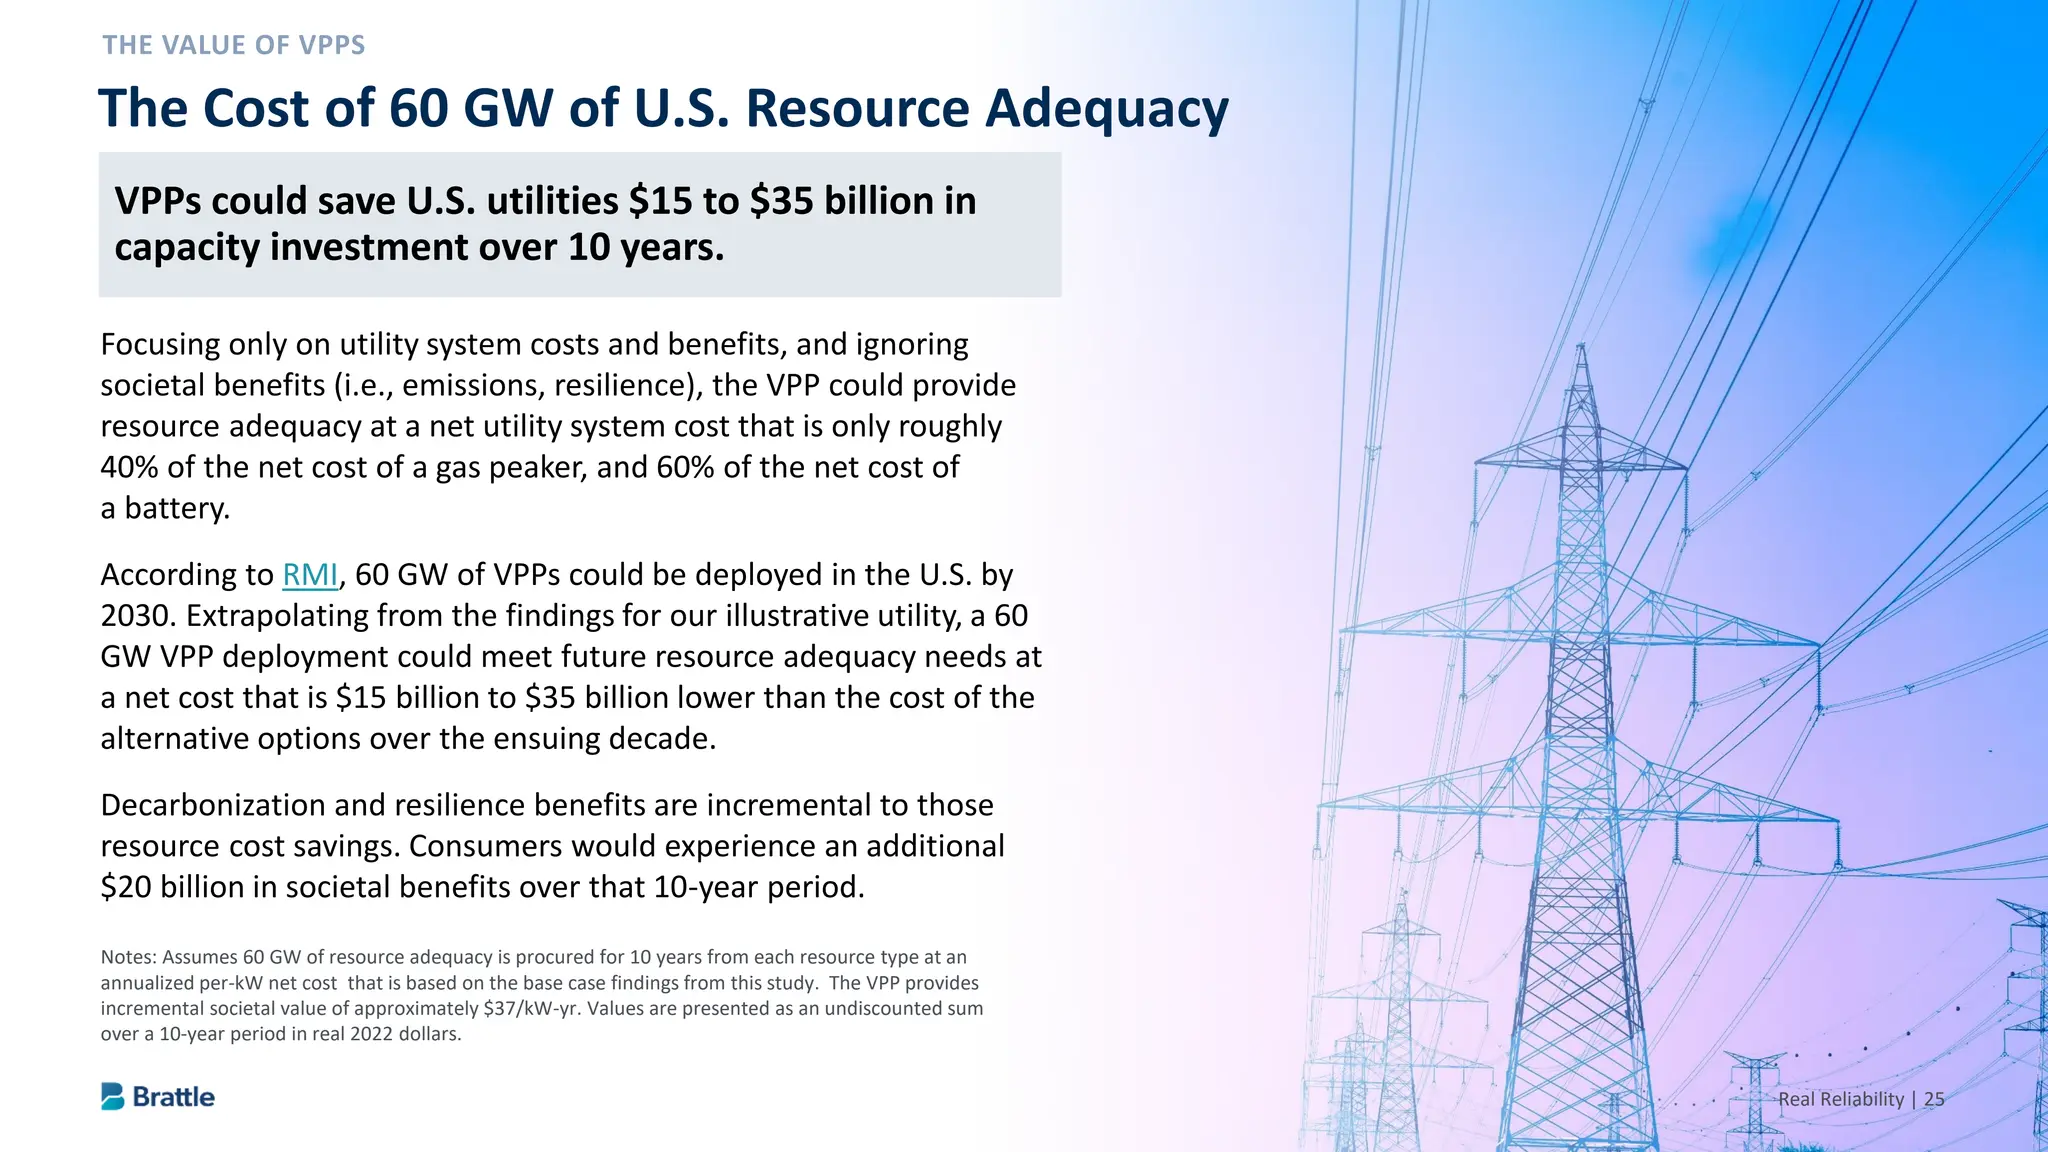
VPPs could save U.S. utilities $15 to $35 billion in capacity
investment over 10 years.
Focusing only on utility system costs and benefits, and ignoring
societal benefits (i.e., emissions, resilience), the VPP could provide
resource adequacy at a net utility system cost that is only roughly
40% of the net cost of a gas peaker, and 60% of the net cost of
a battery.
According to RMI, 60 GW of VPPs could be deployed in the U.S. by
2030. Extrapolating from the findings for our illustrative utility, a 60
GW VPP deployment could meet future resource adequacy needs at
a net cost that is $15 billion to $35 billion lower than the cost of the
alternative options over the ensuing decade.
Decarbonization and resilience benefits are incremental to those
resource cost savings. Consumers would experience an additional
$20 billion in societal benefits over that 10-year period.
The Cost of 60 GW of U.S. Resource Adequacy
Notes: Assumes 60 GW of resource adequacy is procured for 10 years from each resource type at an
annualized per-kW net cost that is based on the base case findings from this study. The VPP provides
incremental societal value of approximately $37/kW-yr. Values are presented as an undiscounted sum
over a 10-year period in real 2022 dollars.
VPPs could save U.S. utilities $15 to $35 billion in
capacity investment over 10 years.
27.
Real Reliability |26
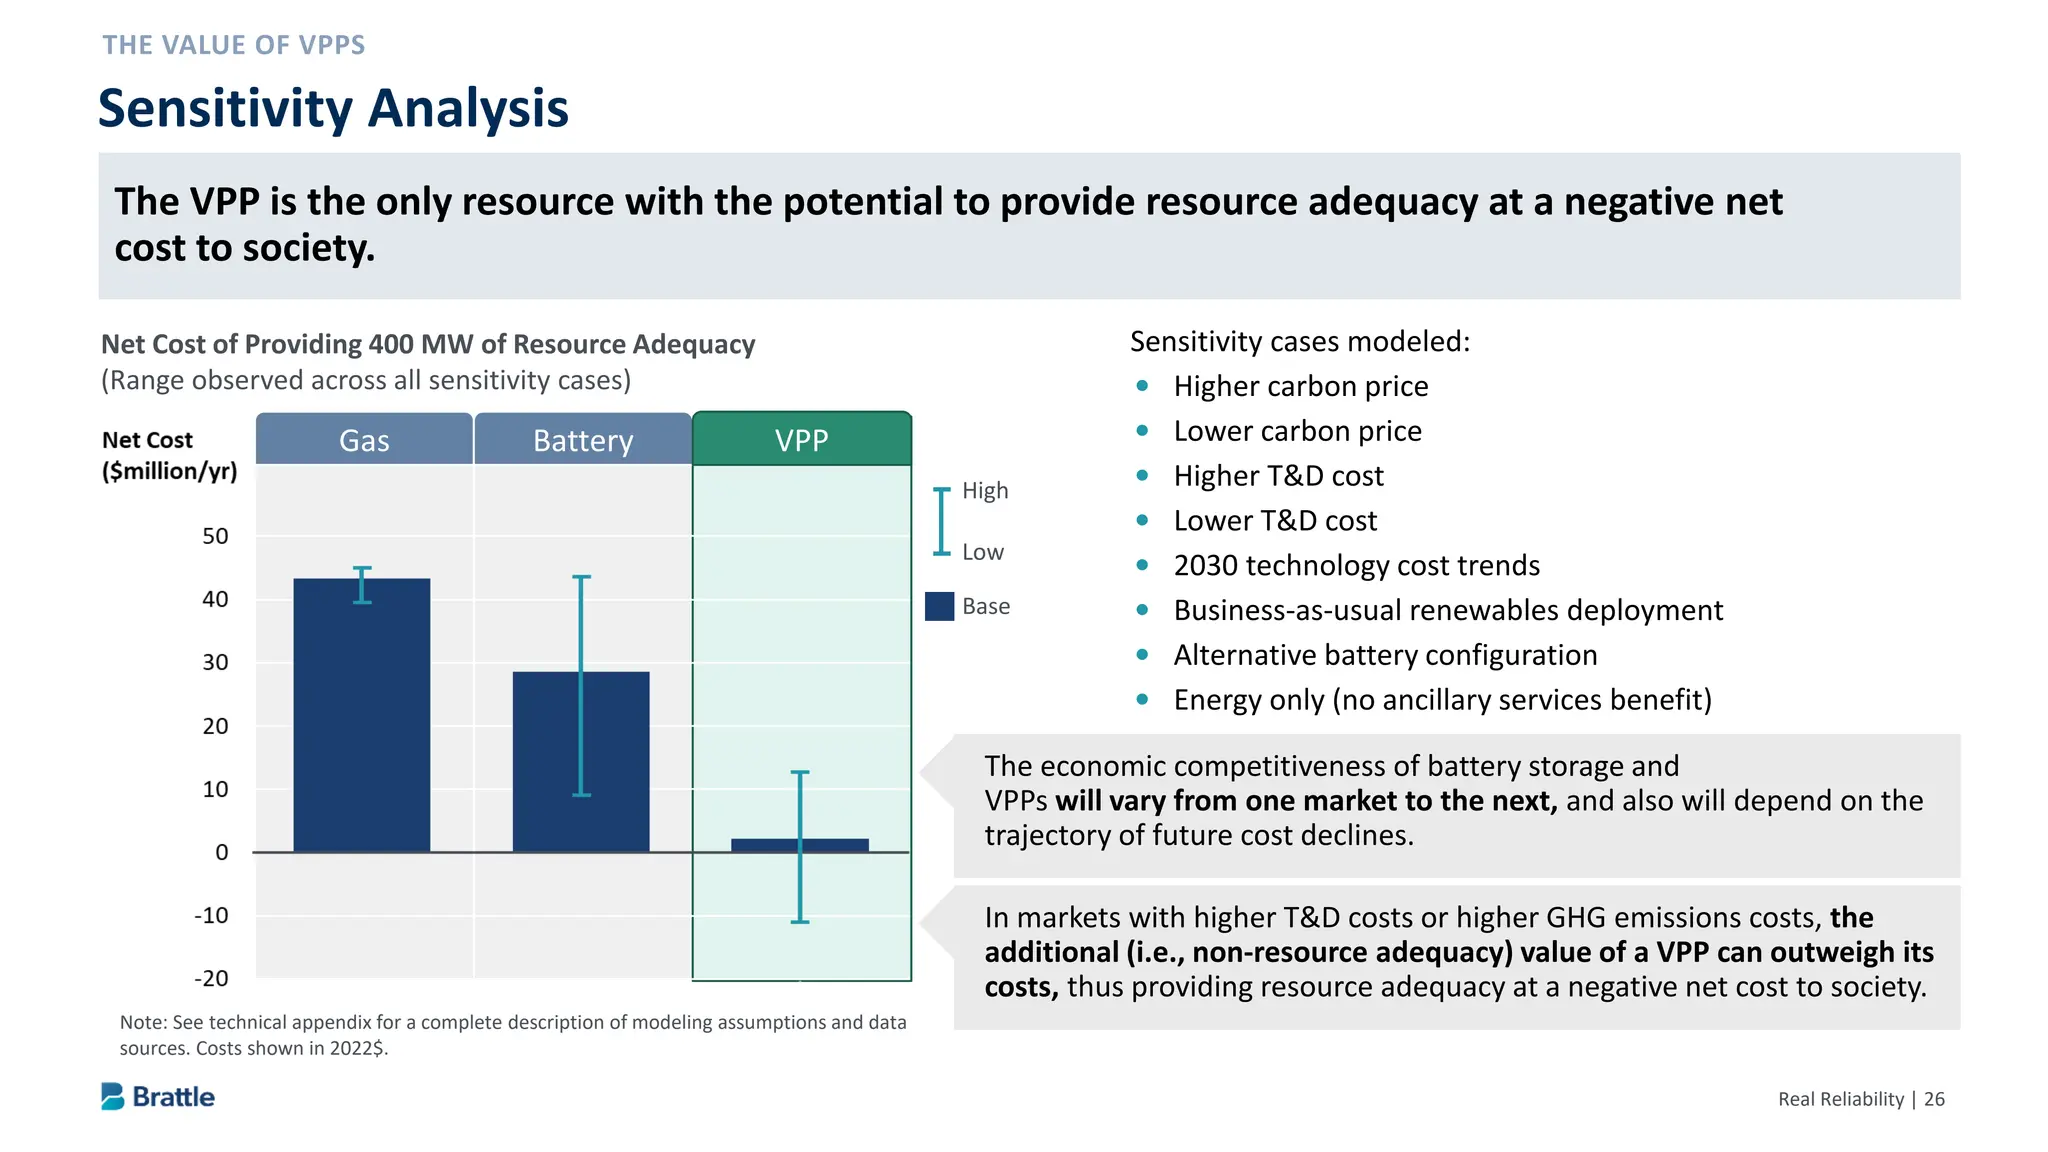
Sensitivity Analysis
Net Cost of Providing 400 MW of Resource Adequacy
(Range observed across all sensitivity cases)
High
Low
Base
Gas Battery VPP
Note: See technical appendix for a complete description of modeling assumptions and data
sources. Costs shown in 2022$.
Sensitivity cases modeled:
Higher carbon price
Lower carbon price
Higher T&D cost
Lower T&D cost
2030 technology cost trends
Business-as-usual renewables deployment
Alternative battery configuration
Energy only (no ancillary services benefit)
The economic competitiveness of battery storage and
VPPs will vary from one market to the next, and also will depend on the
trajectory of future cost declines.
In markets with higher T&D costs or higher GHG emissions costs, the
additional (i.e., non-resource adequacy) value of a VPP can outweigh its
costs, thus providing resource adequacy at a negative net cost to society.
The VPP is the only resource with the potential to provide resource adequacy at a negative net
cost to society.
28.
Real Reliability |27
INCREASED RENEWABLES DEPLOYMENT
By shifting load to hours when excess solar and wind
generation otherwise would be curtailed, VPPs can
increase the capacity factor of wind and solar
generation. In turn, the cost-effectiveness and
economic deployment of those resources could
increase.
BETTER POWER SYSTEM INTEGRATION
OF ELECTRIFICATION
VPPs can facilitate cost-effective deployment of
electrification measures by reducing load impacts and
associated infrastructure investment needs.
FASTER GRID CONNECTION
The highly distributed nature of VPPs means they are
not limited by the same interconnection delays
currently facing many large-scale resources.
FLEXIBLE SCALING
A gas peaker is a multi-decade commitment with risks
of becoming a stranded asset. Alternatively, the
capacity of VPPs can be increased or decreased
flexibly over time to align with the needs of a rapidly
changing power system.
ENHANCED CUSTOMER SATISFACTION
The opportunity to participate in a VPP unlocks a new
feature of customer-owned DERs, improving the
overall consumer value proposition of the
technologies.
IMPROVED BEHIND-THE-METER GRID INTELLIGENCE
Improved visibility into a portfolio of energy
technologies that are connected to the distribution
grid can enhance the operator’s ability to detect and
respond to local changes in system conditions.
Additional Unquantified Benefits of VPPs
VPPs can provide several additional major benefits not modeled in this study.
Real Reliability |29
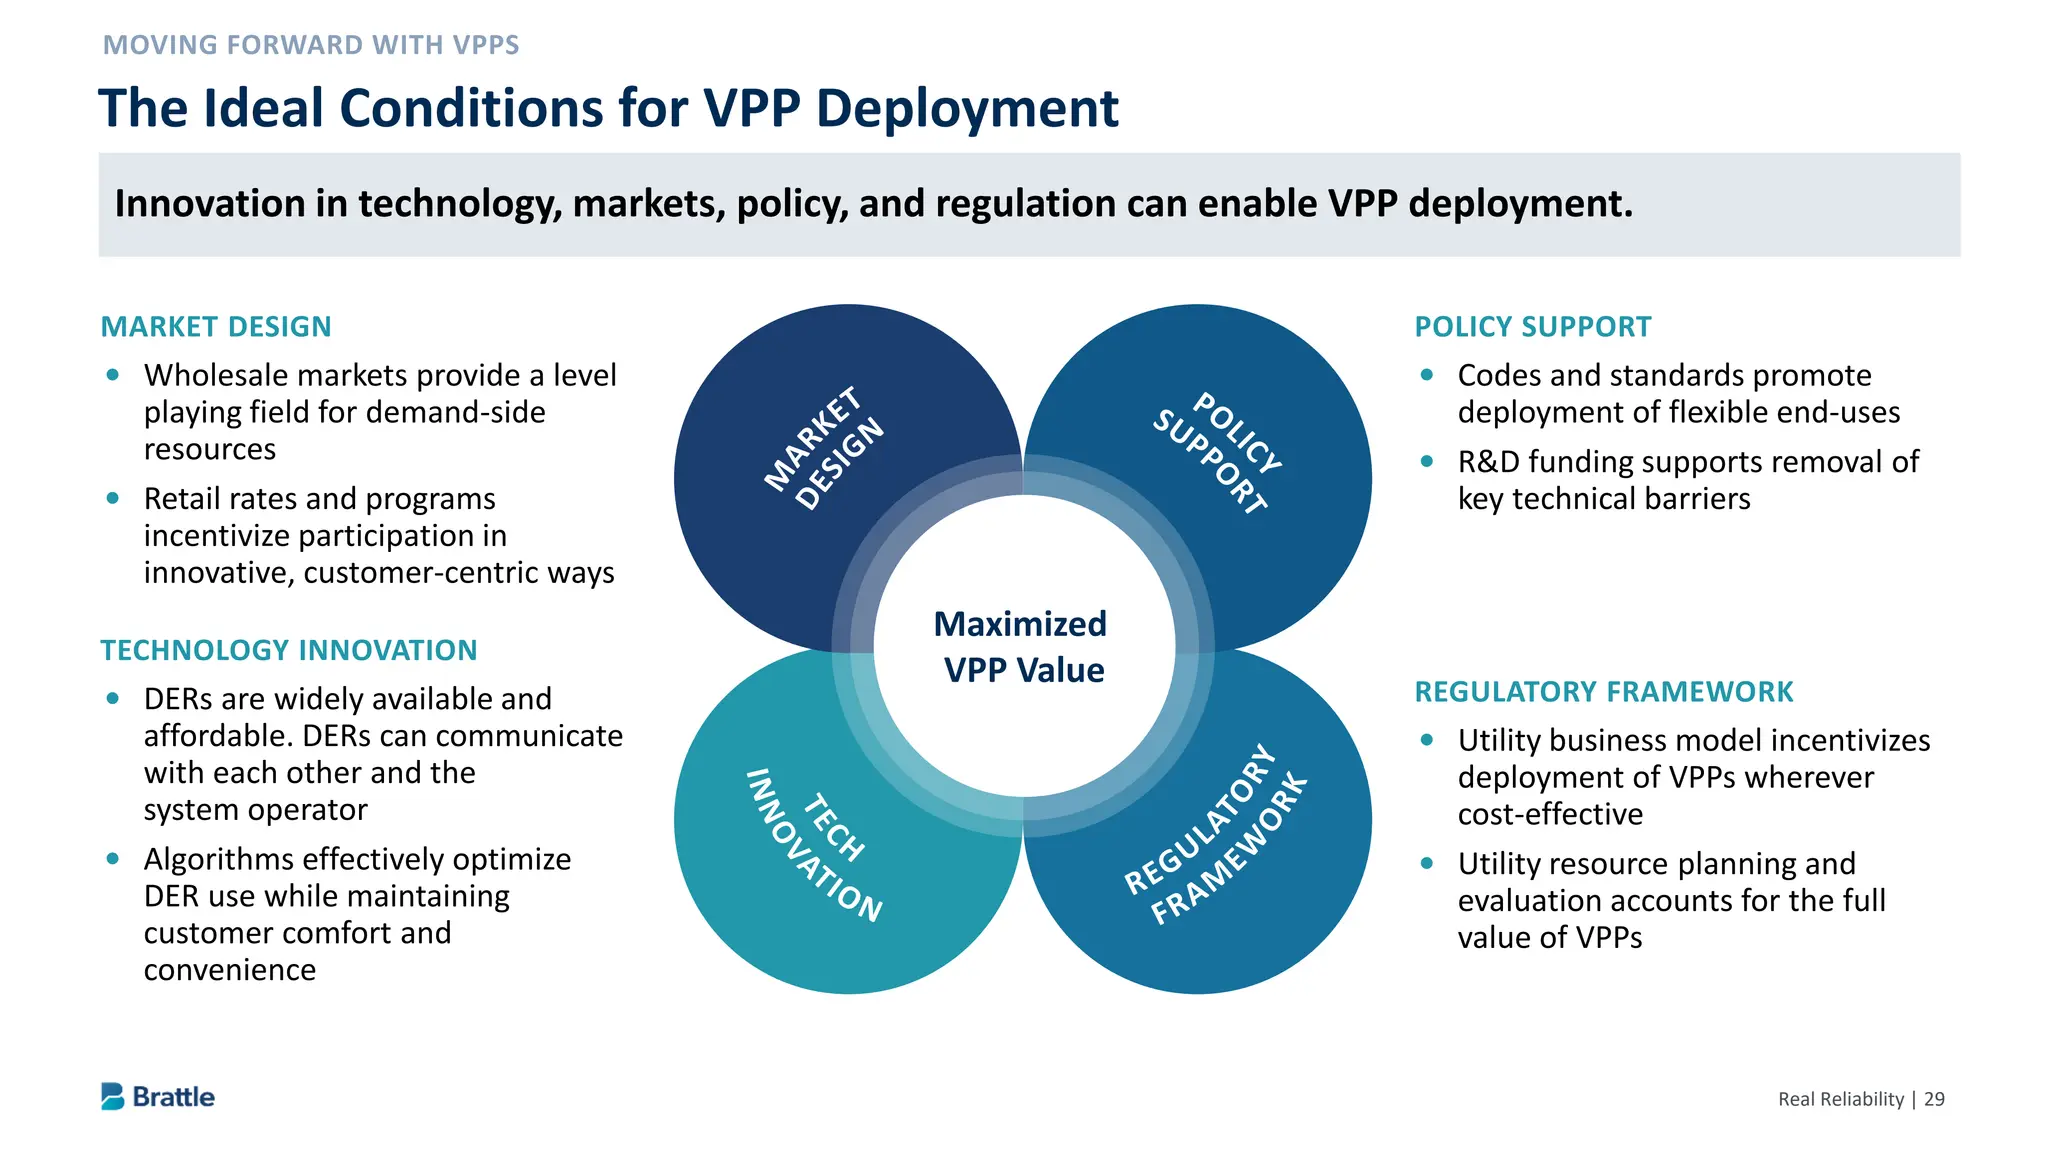
The Ideal Conditions for VPP Deployment
Innovation in technology, markets, policy, and regulation can enable VPP deployment.
MARKET DESIGN
Wholesale markets provide a level
playing field for demand-side
resources
Retail rates and programs
incentivize participation in
innovative, customer-centric ways
TECHNOLOGY INNOVATION
DERs are widely available and
affordable. DERs can communicate
with each other and the
system operator
Algorithms effectively optimize
DER use while maintaining
customer comfort and
convenience
POLICY SUPPORT
Codes and standards promote
deployment of flexible end-uses
R&D funding supports removal of
key technical barriers
REGULATORY FRAMEWORK
Utility business model incentivizes
deployment of VPPs wherever
cost-effective
Utility resource planning and
evaluation accounts for the full
value of VPPs
Maximized
VPP Value
31.
Real Reliability |30
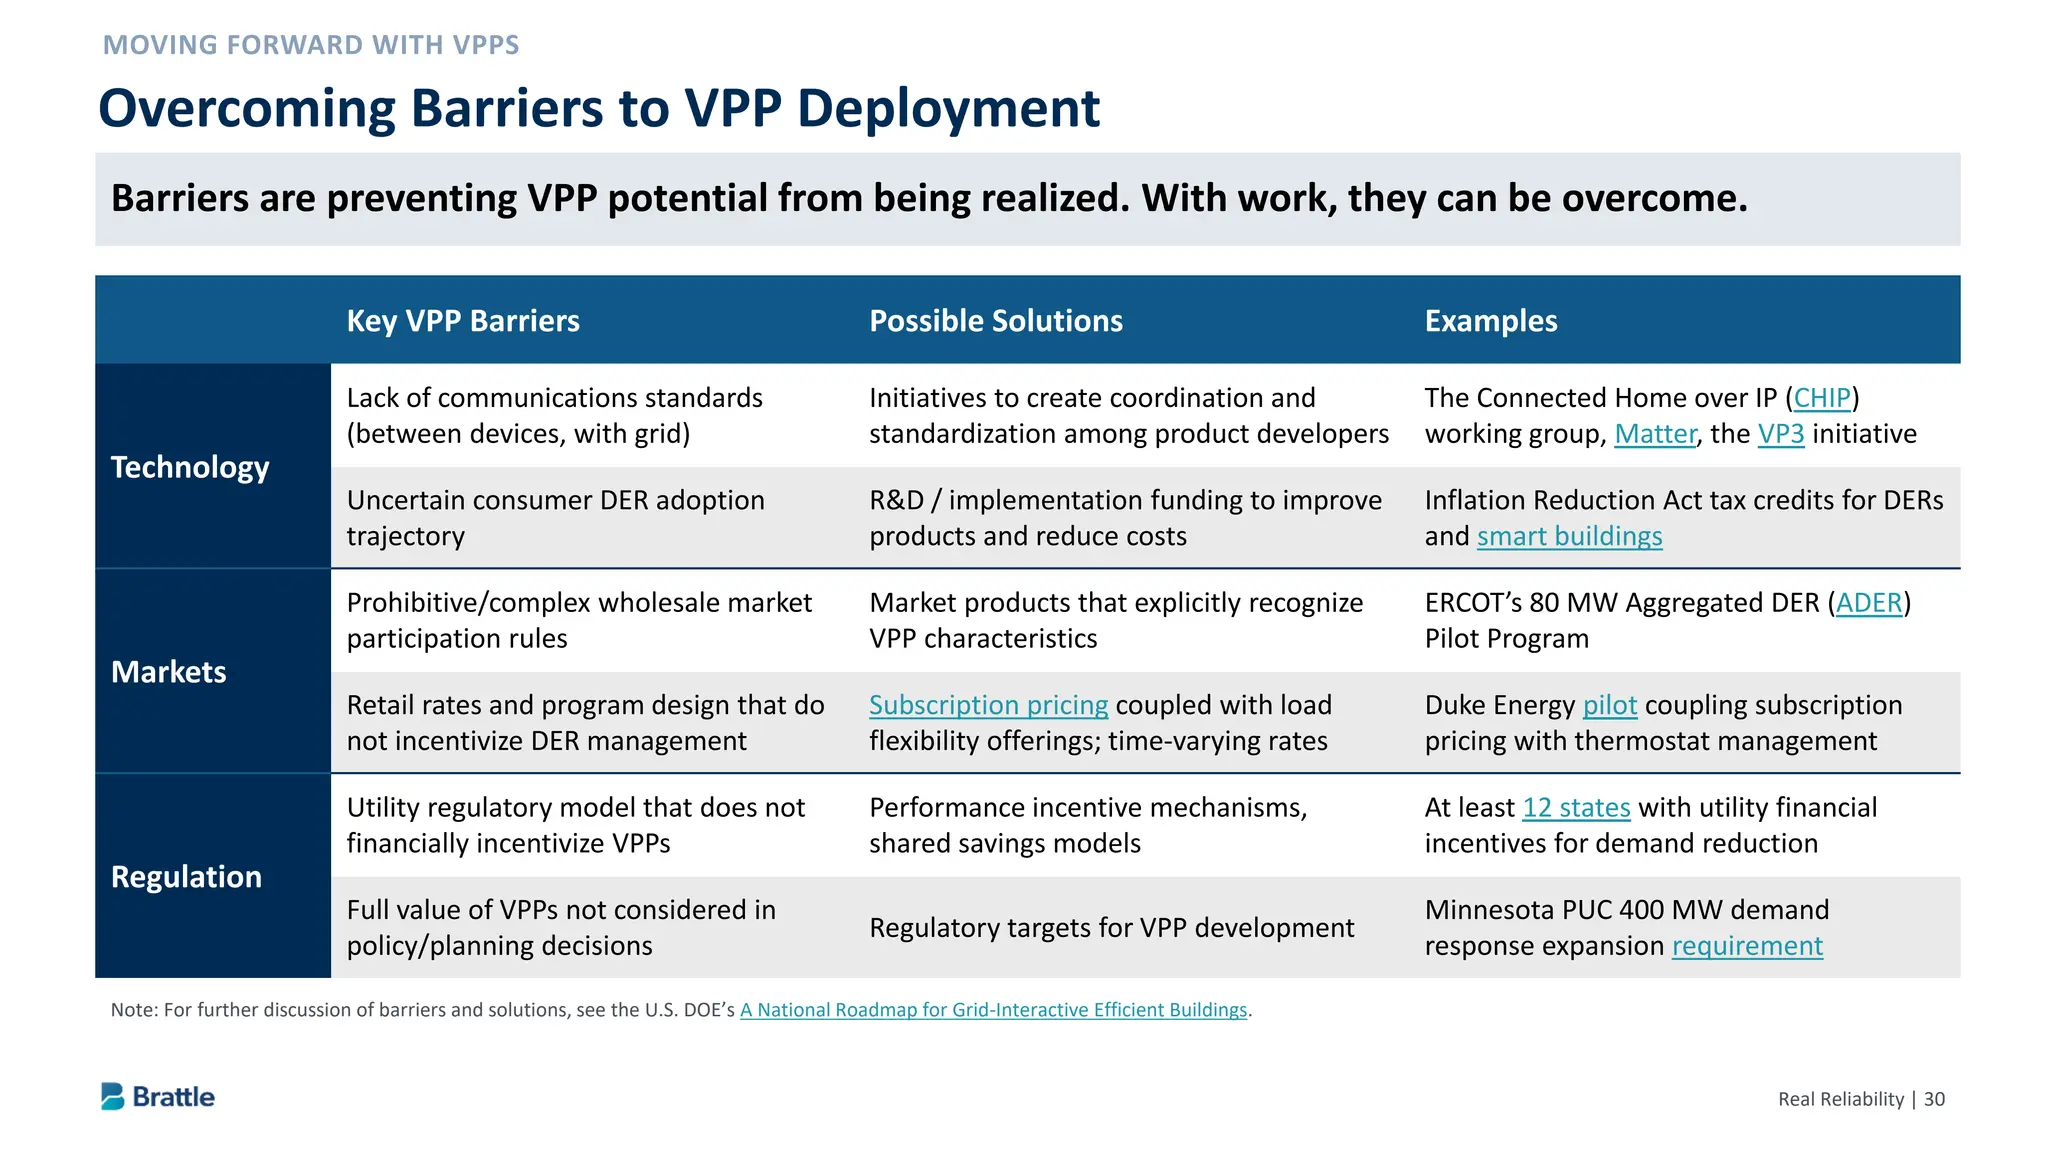
Overcoming Barriers to VPP Deployment
Note: For further discussion of barriers and solutions, see the U.S. DOE’s A National Roadmap for Grid-Interactive Efficient Buildings.
Key VPP Barriers Possible Solutions Examples
Technology
Lack of communications standards
(between devices, with grid)
Initiatives to create coordination and
standardization among product developers
The Connected Home over IP (CHIP)
working group, Matter, the VP3 initiative
Uncertain consumer DER adoption
trajectory
R&D / implementation funding to improve
products and reduce costs
Inflation Reduction Act tax credits for DERs
and smart buildings
Markets
Prohibitive/complex wholesale market
participation rules
Market products that explicitly recognize
VPP characteristics
ERCOT’s 80 MW Aggregated DER (ADER)
Pilot Program
Retail rates and program design that do
not incentivize DER management
Subscription pricing coupled with load
flexibility offerings; time-varying rates
Duke Energy pilot coupling subscription
pricing with thermostat management
Regulation
Utility regulatory model that does not
financially incentivize VPPs
Performance incentive mechanisms,
shared savings models
At least 12 states with utility financial
incentives for demand reduction
Full value of VPPs not considered in
policy/planning decisions
Regulatory targets for VPP development
Minnesota PUC 400 MW demand
response expansion requirement
Barriers are preventing VPP potential from being realized. With work, they can be overcome.
32.
Real Reliability |31
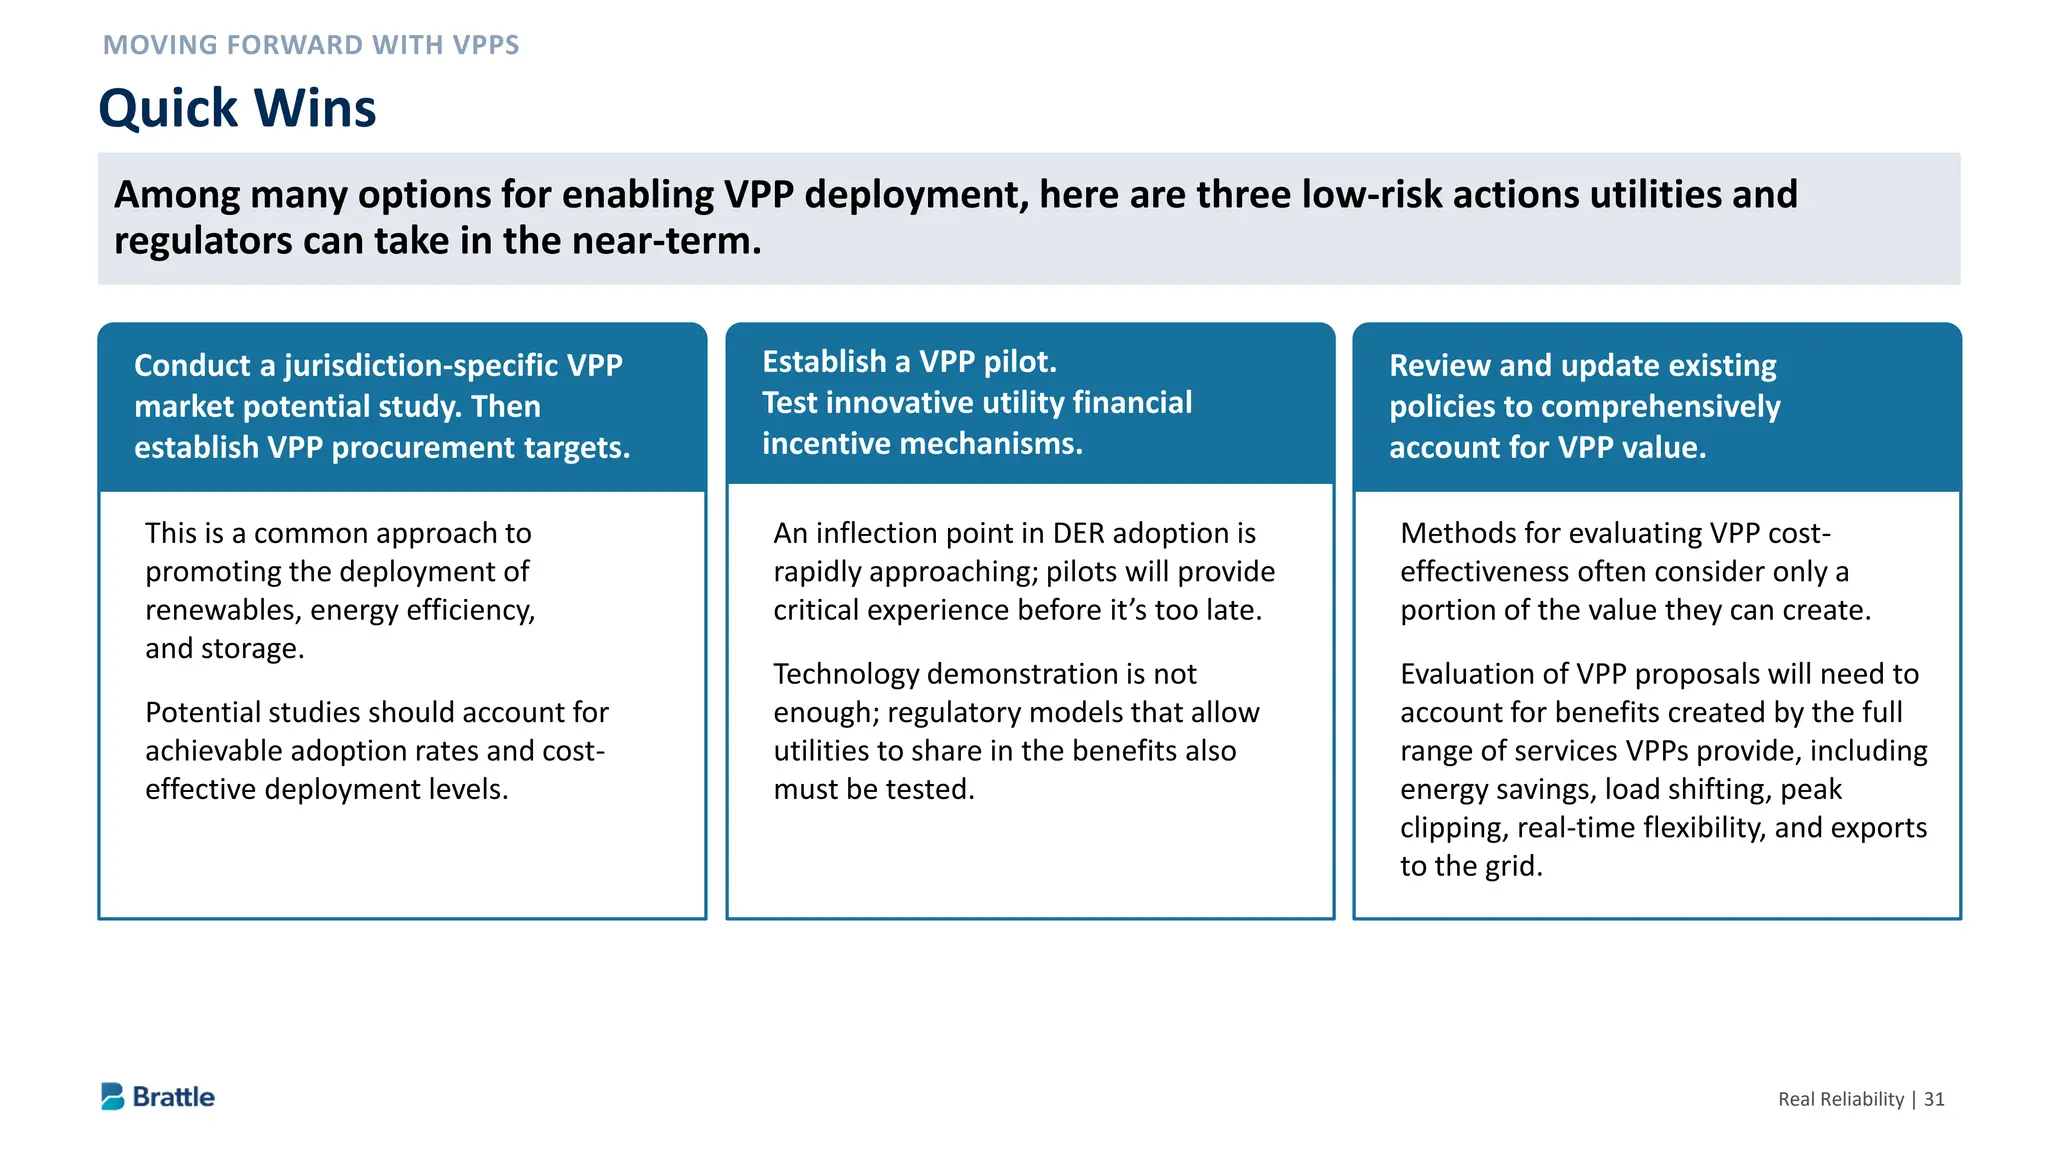
Quick Wins
Conduct a jurisdiction-specific VPP
market potential study. Then
establish VPP procurement targets.
This is a common approach to
promoting the deployment of
renewables, energy efficiency,
and storage.
Potential studies should account for
achievable adoption rates and cost-
effective deployment levels.
Establish a VPP pilot.
Test innovative utility financial
incentive mechanisms.
An inflection point in DER adoption is
rapidly approaching; pilots will provide
critical experience before it’s too late.
Technology demonstration is not
enough; regulatory models that allow
utilities to share in the benefits also
must be tested.
Review and update existing
policies to comprehensively
account for VPP value.
Methods for evaluating VPP cost-
effectiveness often consider only a
portion of the value they can create.
Evaluation of VPP proposals will need to
account for benefits created by the full
range of services VPPs provide, including
energy savings, load shifting, peak
clipping, real-time flexibility, and exports
to the grid.
Among many options for enabling VPP deployment, here are three low-risk actions utilities and
regulators can take in the near-term.
33.
Real Reliability |32
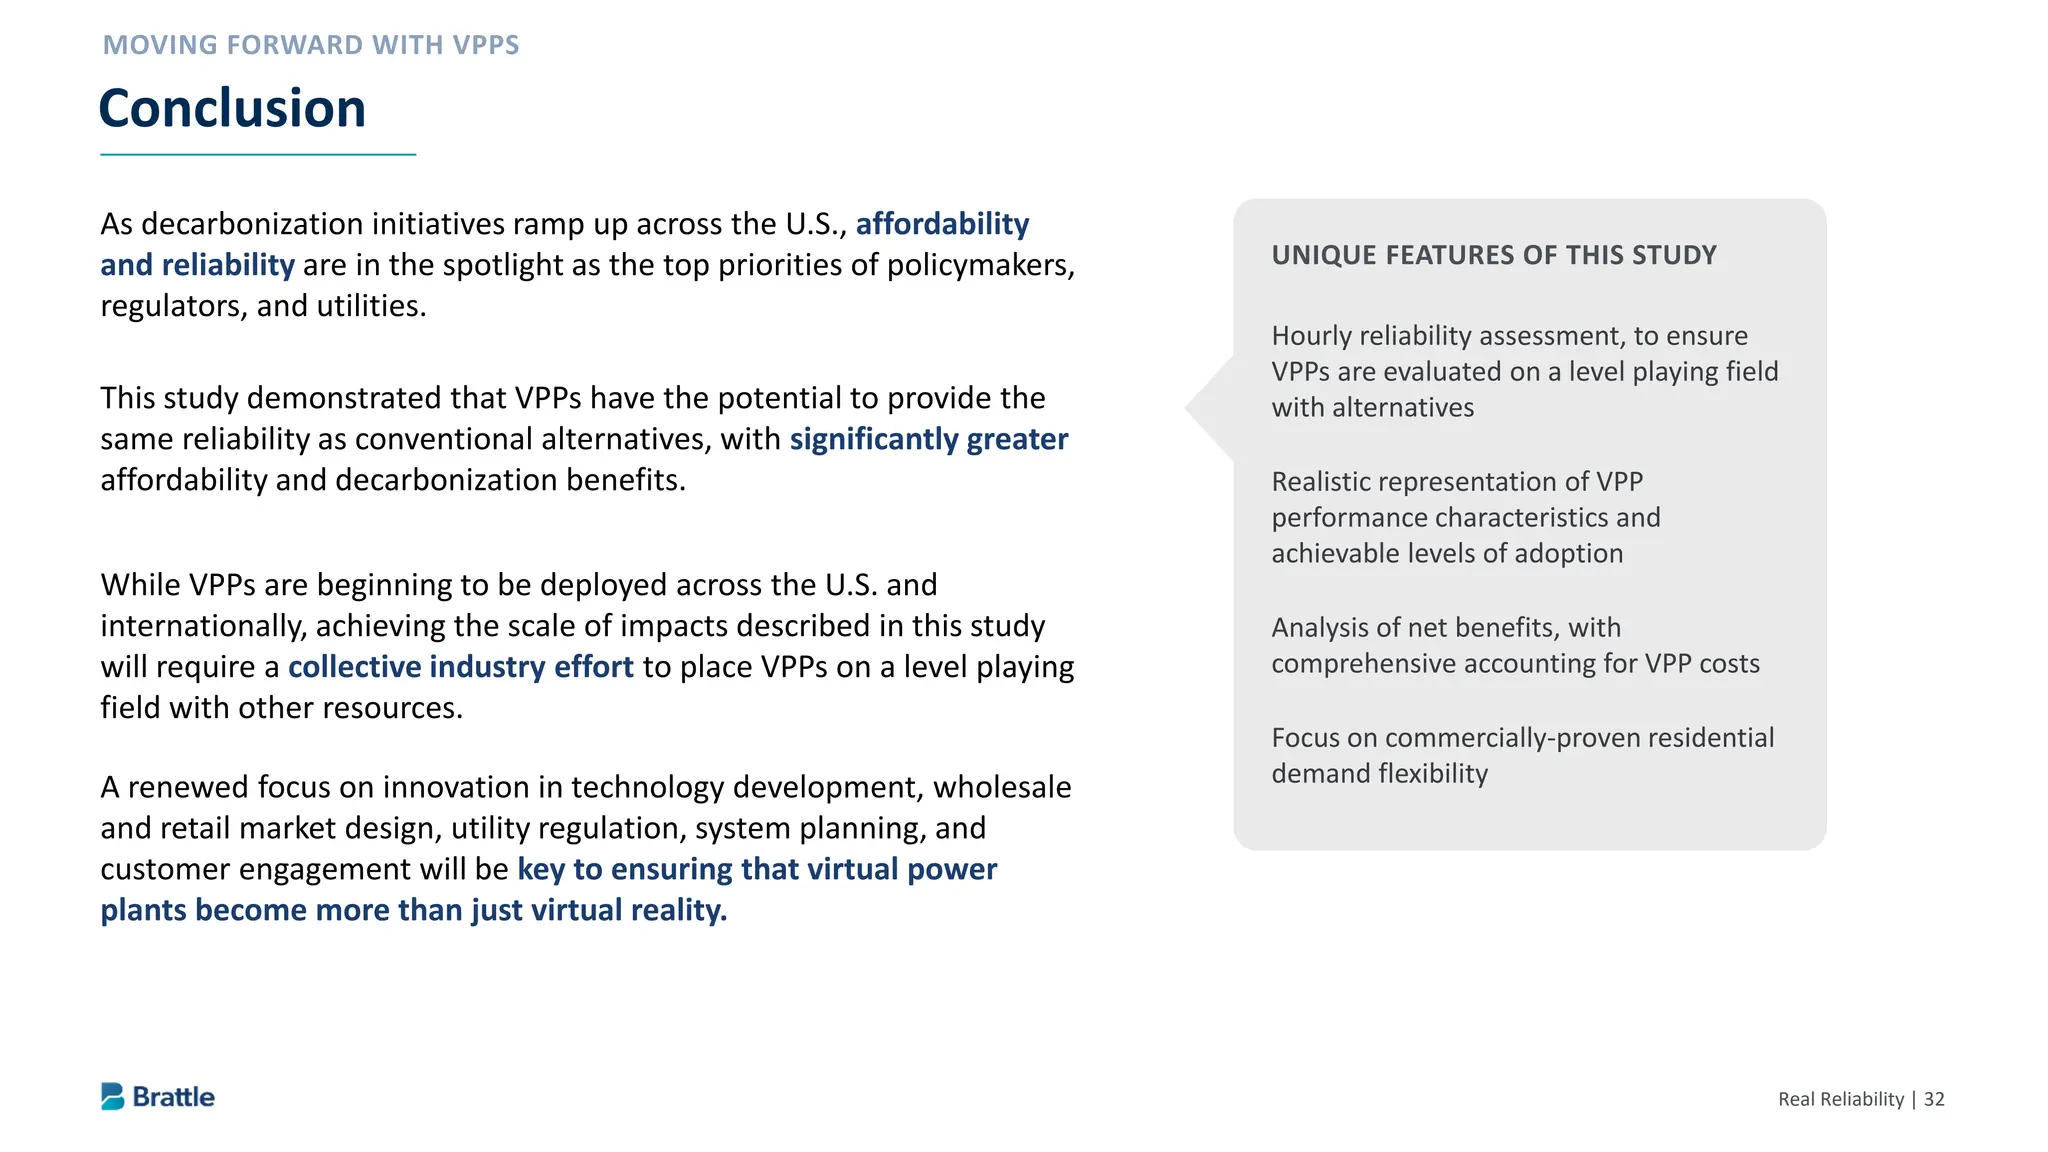
As decarbonization initiatives ramp up across the U.S., affordability
and reliability are in the spotlight as the top priorities of policymakers,
regulators, and utilities.
This study demonstrated that VPPs have the potential to provide the
same reliability as conventional alternatives, with significantly greater
affordability and decarbonization benefits.
While VPPs are beginning to be deployed across the U.S. and
internationally, achieving the scale of impacts described in this study
will require a collective industry effort to place VPPs on a level playing
field with other resources.
A renewed focus on innovation in technology development, wholesale
and retail market design, utility regulation, system planning, and
customer engagement will be key to ensuring that virtual power
plants become more than just virtual reality.
Conclusion
UNIQUE FEATURES OF THIS STUDY
Hourly reliability assessment, to ensure
VPPs are evaluated on a level playing field
with alternatives
Realistic representation of VPP
performance characteristics and
achievable levels of adoption
Analysis of net benefits, with
comprehensive accounting for VPP costs
Focus on commercially-proven residential
demand flexibility
34.
Real Reliability |33
Brehm, Kevin, Avery McEvoy, Connor Usry, and Mark Dyson, “Virtual Power Plants, Real Benefits,” RMI report, January 2023.
Hledik, Ryan, Ahmad Faruqui and Tony Lee, “The National Potential for Load Flexibility,” Brattle report, June 2019.
Hledik, Ryan, Sanem Sergici, Michael Hagerty, and Julia Olszewski, “An Assessment of Electrification Impacts on the Pepco DC
System,” Brattle report prepared for Pepco, August 2021.
Kuiper, Gabrielle, “What is the State of Virtual Power Plants in Australia?” Institute for Energy Economics and Financial Analysis
report, March 2022.
Langevin, Jared Aven Satre-Meloy, Andrew Satchwell, Ryan Hledik, Julia Olszewski, Kate Peters, and Handi Chandra Putra, “The Role
of Buildings in U.S. Energy System Decarbonization by Mid-Century,” pre-print, October 2022.
Satchwell, Andrew and Ryan Hledik, “Making Grid-interactive Efficient Buildings a “Win” for Both Customers and Utilities,” prepared
for 2022 ACEEE Summer Study on Energy Efficiency in Buildings, August 2022.
Sergici, Sanem, Ryan Hledik, Michael Hagerty, Ahmad Faruqui, and Kate Peters, “The Customer Action Pathway to National
Decarbonization,” Brattle report for Oracle, September 2021.
Shah, Jigar, “VPPieces: Bite-sized Blogs about Virtual Power Plants,” US DOE Loan Programs Office blog series.
U.S. Department of Energy, “A National Roadmap for Grid-Interactive Efficient Buildings,” May 17, 2021.
Zhou, Ella and Trieu Mai, Electrification Futures Study: Operational Analysis of U.S. Power Systems with Increased Electrification and
Demand-Side Flexibility,” NREL report, May 2021.
Additional Reading
35.
Real Reliability |34
The views expressed in this presentation are strictly those of the presenter(s) and do not necessarily state or reflect the views of The Brattle Group or its clients.
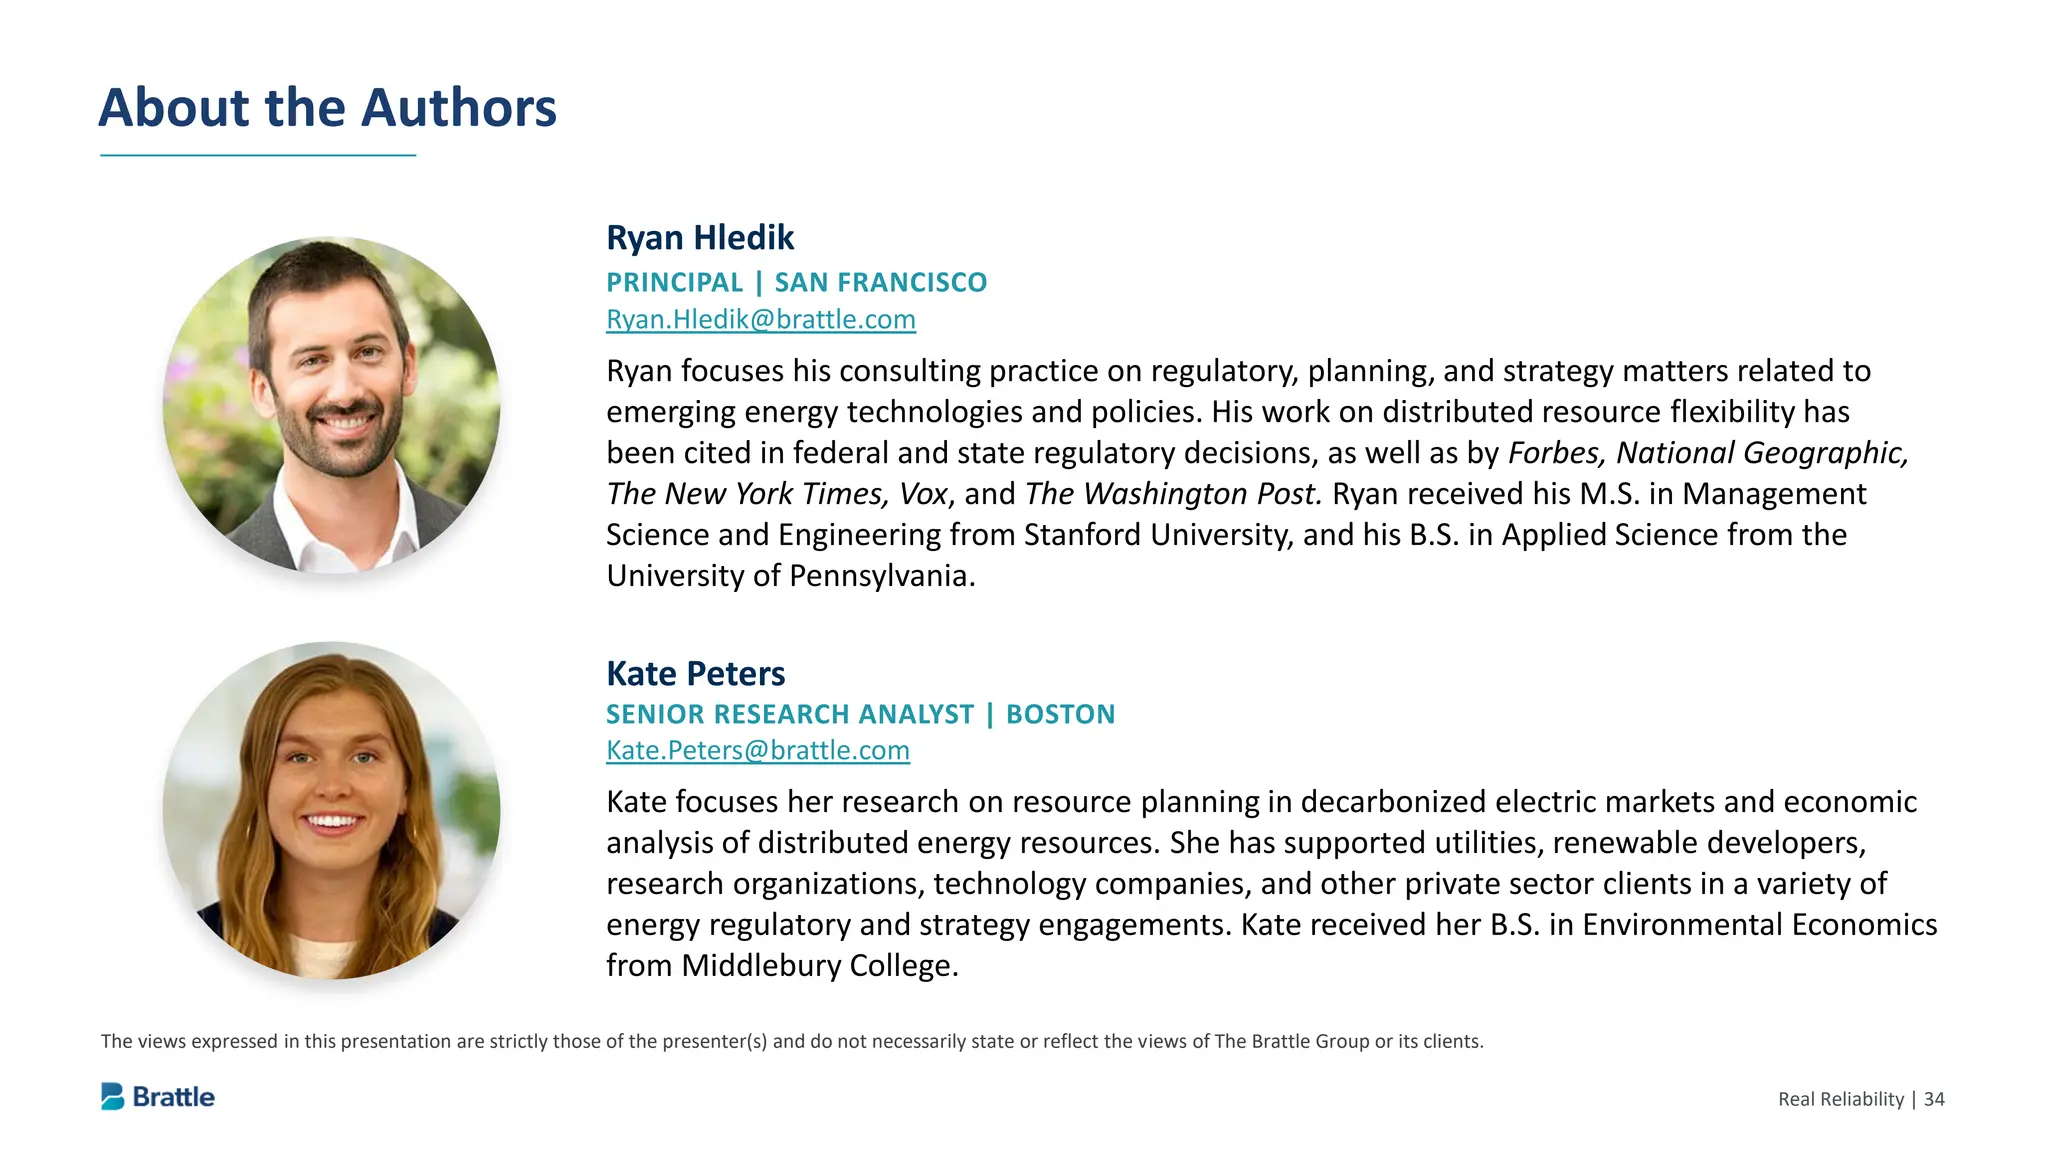
Ryan Hledik
PRINCIPAL | SAN FRANCISCO
Ryan.Hledik@brattle.com
Ryan focuses his consulting practice on regulatory, planning, and strategy matters related to
emerging energy technologies and policies. His work on distributed resource flexibility has
been cited in federal and state regulatory decisions, as well as by Forbes, National Geographic,
The New York Times, Vox, and The Washington Post. Ryan received his M.S. in Management
Science and Engineering from Stanford University, and his B.S. in Applied Science from the
University of Pennsylvania.
About the Authors
Kate Peters
SENIOR RESEARCH ANALYST | BOSTON
Kate.Peters@brattle.com
Kate focuses her research on resource planning in decarbonized electric markets and economic
analysis of distributed energy resources. She has supported utilities, renewable developers,
research organizations, technology companies, and other private sector clients in a variety of
energy regulatory and strategy engagements. Kate received her B.S. in Environmental Economics
from Middlebury College.
![Real Reliability | 16
Calculating the Net Cost of Resource Adequacy
Notes:
[1] Negative “value” indicates that the resource increases cost (e.g., a gas peaker increasing GHG emissions).
[2] Excluding societal value from the calculation results in an estimate of the net resource cost from the perspective of the utility or system operator.
Net cost of
resource adequacy
Cost of installing
and operating
resource
CapEx
Fuel
Operations &
Maintenance (O&M)
Program costs
System value of
resource1
Energy value
T&D investment
deferral
Ancillary services value
Societal value of
resource1,2
GHG emissions
reduction
Resilience value
Our analysis estimates the cost of providing resource adequacy from each of the three resource
types, net of any additional value those resources provide to the system and to society. The result
is the “net cost” of providing resource adequacy.](https://image.slidesharecdn.com/real-reliability-the-value-of-virtual-power5-250404094022-b58a69ab/75/Real-Reliability-The-Value-of-Virtual-Power_5-3-2023-pdf-17-2048.jpg)