1. 1. Executive Summary
Raveling Companies is a start-up focused on the sales of industrial buckets and
specials. Industrial buckets are large steel buckets designed for earth moving projects.
Specials are customized steel welding projects involving precision welding to the specs
of the customers.
Raveling Companies is a sales company. It sells bucket and special welding services,
but out sources the labor and material requirements. Raveling Companies collects $95 /
hour in labor from its customers and its cost of labor is $65 / hour. Materials are marked
up 100%.
Dean Raveling, the owner and manger of Raveling Companies, has been selling
buckets and specials for 30 years. He has an average annual sales book of 4.5M dollars.
The majority of his sales book is from the manufacturing of buckets, but he has sold a
significant number of specials. Dean has spent all 30 of his years in the industry working
for Empire Bucket. An industrial bucket manufacturing shop located in Hudson, WI. He
accounts for the majority of Empire Bucket’s sales. Upon leaving to start his own
company, he will be in direct competition with Empire Bucket.
The metal fabrication industry has an average net profit margin of 8.9% (the average
of all publicly traded companies). Raveling Companies estimates it can earn a net profit
margin of 11% using industry standard labor and material mark up costs.
Raveling Companies projects start-up costs to total less than $13,500. It’s year 1 net
profit is expected to total $105,840 with an estimated 1M in sales (or 22% of Dean’s
current sales book). These numbers give Raveling Companies a year 1 ROI of 7.98 and
IRR of 698%.
Raveling Companies never has to turn down business. Because the company is not
limited to the capabilities of 1 manufacturing shop, Raveling Companies can outsource
any job. Many of Raveling Companies competitors (including Empire Bucket) are limited
to the capabilities of 1 manufacturing shop.
Raveling Companies recognizes that its marketing and sales forces will determine the
success of the company. Because of this, Raveling Companies has aggressive marketing
and sales plans. The company will not limit its marketing efforts to the Midwest. Instead,
Raveling Companies will use the internet to market nationwide and advertisements in
industry trade papers and direct mail to market to the Northeast and Midwest. In year 1,
Dean will be the sales force. He plans to send out a mass email announcing the formation
of his company to prospective customers nationwide, warm call and meet with his current
customers in the Midwest, and cold call potential customers in the Northeast as part of his
aggressive year 1 sales plan.
Raveling Companies will fill the needs of industrial bucket and specials customers
nationwide.
1
2. 2. The Market
Raveling Companies market consists 60% of dealers and 40% of independent
contractors. It is made up of 75% of the manufacturing of buckets and 25% of the
manufacturing of specials The national bucket market is currently valued at an estimated
37.5M dollars annually. The national specials market is currently valued at an estimated
2B dollars annually.
The Midwest regional 5 state area (Minnesota, Wisconsin, Iowa, North Dakota, and
South Dakota) bucket market is currently valued at an estimated 5.75M dollars annually.
The regional specials market is valued at an estimated 400M dollars annually. The
regional bucket market consists of roughly 600 customers. However, 20 customers make
up 80% of the market. The top 3 customers account for 20% of the market.
3 Customers
17 Customers
600
Customers
Raveling Companies estimates it will acquire 1M in total market share in year 1. 75%
of Raveling Companies 1M in sales will come from the manufacturing of buckets
($750,000) and 25% will come from the manufacturing of specials ($250,000). Year 1
sales represent a national bucket market share of 2% and national specials market share
of 0.0125%. Year 1 sales represent a regional bucket market share of 13% and regional
specials market share of 0.0625%.
Raveling Companies estimates it will acquire a total of 2 million in total market
share in year 2. 75% of year 2 sales will com from the manufacturing of buckets (1.5M)
and 25% will come from the manufacturing of specials ($500,000). Year 2 sales represent
a national bucket market share of 4% and national specials market share of 0.025%. Year
2 sales represent a regional bucket market share of 26% and regional specials market
share of 0.125%.
Raveling Companies estimates it will acquire 4M in total market share of in year 3.
75% of sales will come from the manufacturing of buckets (3M) and 25% will come from
the manufacturing of specials (1M). Year 3 sales represent a national bucket market share
of 8% and a national specials market share of 0.05%. Year 3 sales represent a regional
bucket market share of 52% and a regional specials market share of 0.25%
2
3. 3. Profitability
Raveling Companies earns profits in 2 ways. First, Raveling Companies pays $65 /
hour in labor to have buckets and specials made. Raveling Companies collects $95 / hour
in labor from its customers (with a 20% discount to dealers). Second, Raveling
Companies marks up the materials used to manufacture the buckets and specials 100%
(also with a 20% discount to dealers). Raveling Companies will collect 50% of its sales
from labor and 50% from materials. As previously stated, dealers account for 60% of the
market and general contractors make up 40% of the market.
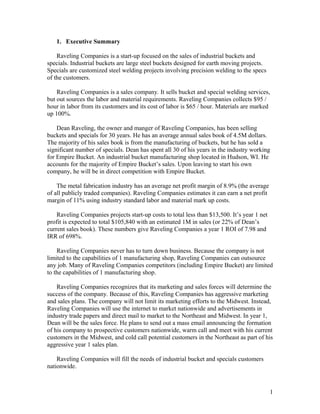
These numbers result in a cost of labor of 78.684% and a cost of materials of 62%.
They give Raveling Companies a gross margin of 24%, an operating margin of 17%, an
EBT of 16%, and a net profit margin of 11%.
0%
5%
10%
15%
20%
25%
Gross Margin
Operating
Margin
EBT
Net Profit
4. Management
Raveling Companies will be owned and managed by Dean Raveling. Dean has
worked at Empire Bucket in the industrial bucket and specials manufacturing industry for
30 years. Throughout his time in the industry he has accumulate a sales book totaling an
average of 4.5M dollars annually.
5. Competition
Raveling Companies will have 1 regional competitor for its bucket business; Empire
Bucket. Empire Bucket currently dominates the Midwest bucket business. It accounts for
the entire regional 5.25M bucket market. Empire Bucket is incorporated in Minnesota,
but located in Hudson, WI. It manufactures its own buckets (in its own shop) and has a
total of 2 bucket salespeople. These are Dean Raveling and Chris Ninnmen. Currently,
Dean accounts for 4.5M in bucket sales. Chris accounts for less than 1M.
6. Entity Structure
Raveling Companies will be a Minnesota Limited Liability Company.
3
4. 7. Critical Risks
1) Inability to Attract Sufficient Customers – The top 3 bucket customers make
up 20% of the regional market. The top 20 bucket customers make up 80% of
the regional market. The inability to attract a significant portion of these top
20 customers poses a critical risk.
2) Price War with Empire Bucket – Because Empire Bucket owns its own shop,
its cost of labor and materials are less than Raveling Companies. Empire may
reduce its prices in an effort to maintain its market share. Empire has the
ability to lower its prices below the level that Raveling Companies
necessitates to make a profit. However, the market is not 100% price based.
Customers generally prefer reliability and a quality sales force to price.
3) Quality and Delivery of Products from Service Providers – Raveling
Company’s service providers do not have experience manufacturing the
buckets that make up 75% of its market. Customers demand quality products
delivered on time. If the service providers cannot produce quality buckets and
specials in a timely manner, Raveling Companies will be unable to maintain a
market share.
4) Bad Economy – In previous good economic environments the bucket market
has totaled 6.75M. Currently, the economy is poor and the bucket market
totals 5.25M. If the economy deteriorates further, the bucket market will
continue to shrink. This poses a risk to the size of Raveling Company’s sales
and earnings.
8. Service Providers
To start, Raveling Companies will use 2 companies to manufacture its products. Both
service providers have superior manufacturing equipment when compared to Empire
Bucket.
1) Schaefer Welding – Located just outside of Amery, WI, this welding shop is
run by Barry Schaefer.
2) CWMF Custom Welding – Located west of the Twin Cities in Minnesota, this
welding shop is run by Travis Mick.
9. Marketing
Raveling Companies marketing strategy will initially consist of 3 aspects. The
company will advertise in industry trade papers, utilize direct mail, and advertise on the
internet.
4
5. 1) Advertisements in Industry Trade Papers – 2 industry trade papers exist in the
5 state area. These are Muca (published semi-annually) and Construction
Bulletin (published quarterly). Muca advertisements cost $800. Muca lists
manufacturing work coming out in the next 6 months. Construction Bulletin
advertisements cost $500. Construction Bulletin lists bids for the work in the
current quarter. Raveling Companies will purchase advertisements in both
trade papers.
2) Direct Mail –
• Brochures (for independent contractors) – Brochures will be mailed to
independent contractors. The brochures will initially be designed by
Rachel Raveling. They will contain many pages and illustrate the products
and services Raveling Companies offers to independent contractors.
• Price Books (for dealers) – Price books will be mailed to dealers. These
are similar to brochures, but list the discounted prices Raveling
Companies offers dealers. Dean Raveling will design the price books.
3) Internet – Raveling Companies will have a sales centered web page designed
by Jordon Marshall. The webpage will list the products and services Raveling
Company offers and contain Dean’s contact information. Raveling Companies
will utilize a trial and error internet advertising campaign controlled by Matt
Marshall. The campaign will start with Craigslist spam, Google Adwords, and
mass email. Strategies that produce sales will be continued and those that do
not will be disregarded. New internet marketing strategies will constantly be
attempted due to the low cost of online advertising.
10. Target Markets
1) Current Empire Bucket Customers – Currently, Empire Bucket services the
majority of the Midwest regional bucket customers. Empire Bucket also
services a small percentage of the Midwest regional specials market. The
Midwest bucket and specials customers represent Raveling Companies
primary market. Dean’s sales book consists primarily of current Empire
Bucket customers. Raveling Companies will attempt to acquire as many of
Empire Bucket’s customers as possible.
2) Coal Mines (in Western States) – Although Raveling Companies will accept
business from customers anywhere in the United States, the coal mines in the
Northwestern United States are growing in size and necessitate large numbers
of buckets. This booming market will act as Raveling Companies secondary
market. Raveling Companies will infiltrate this market through referrals (from
Midwest regional customers), cold calls, internet advertising, and
advertisements in The Western Bulletin (the industry trade paper for the
Northwestern United States).
5
6. 11. Sales
Because Dean already has a sales book of sales totaling 4.5M annually, Raveling
Companies will sell products according to a specific strategy.
1) Meetings – Dean will simply meet with the customers in his Empire Bucket
sales book and ask them to switch their business from Empire Bucket to
Raveling Companies.
2) Warm Calls – Dean will call the customers making up his current sales book
and ask for a meeting or for them to switch from Empire Bucket to Raveling
Companies. Dean may also call Empire Bucket customers in other
salespeople’s books of customers and ask them to switch.
3) Cold Calls – Although Dean knows the majority of customers in the Midwest
regional bucket market, he will cold call bucket customers across the United
States (especially bucket customers in the Northwestern states). Dean will also
cold call new specials customers in the Midwest, Northwestern states, and
across the United States.
12. Accounting
Raveling Companies will manage its accounting needs using a Bremer Bank Account,
Quicken Home and Business Software, and an online file folder. Matt Marshall will set
up Raveling Companies accounting system.
Raveling Companies will use an accountant for tax purposes. Raveling Companies
accountant is Joe Vinopal.
13. Technology / Webpage
Raveling Companies will have its own domain name, email, online file folder, and
webpage. Initially, Jordon Marshall will construct a basic webpage for sales purposes.
This webpage will contain the products and services Raveling Companies offers with
Dean Raveling’s contact information.
When and if Raveling Companies reaches 1.5 Million in sales, it will outsource an
advanced information technology system. This system will allow customers to sign on
and view the progress on their orders, view their account balance and due dates, and
register as new customers. Raveling Companies advanced information system is expected
to be outsourced at a cost of $10,000 with a continual $50 / month hosting fee.
14. Start-Up Expenses
Raveling Companies will necessitate a diversified array of start up expenses.
6
7. 1) Advertisements in Industry Trade Papers – $1300.
2) Minnesota LLC – $228.
3) Laptop Computer - $400.
4) Blackberry - $130 (first month)
5) Auto Insurance - $250 (first month)
6) Quicken Home and Business - $100
7) Domain Name, Email, & Online File Folder - $50
8) Navigation System - $300
9) Brochure Design (for direct mail) - $1500
10) Price Book Design (for direct mail) - $1500
11) Lawyer Fees - $5000
12) Miscellaneous - $2500
Raveling Companies estimates start-up expenses to total $13,258.
15. Exit Strategy
Raveling Companies is a likely candidate for acquisition. Hundreds of industrial
welding shops exist across the country. Many of these welding shops would likely be
willing to pay for Raveling Companies sales book.
Raveling Companies will sell itself at a favorable rate. However, Raveling
Companies will not sign a non-compete. Dean has worked in the bucket and specials
manufacturing industry for 30 years. When and if he sells Raveling Companies, he will
start another sales business in the same industry.
The best case scenario includes Dean starting and selling a number of bucket and
specials sales companies over remainder of his career. This scenario allows Dean to make
money from the profits of his companies and the sale of equity in his companies.
16. Financial Assumptions
Raveling Companies projected financial statements assume it will sell labor at $95 /
hour and its cost of labor to be $65 / hour. They assume materials will be marked up
100%.
7
8. The projected financial statements assume Raveling Companies sales will be made of
60% dealers and 40% independent contractors. Dealers are given a 20% discount on both
labor and materials.
Overall, Raveling Companies projects its cost of labor to be 78.684% of sales and its
cost of materials to be 62% of sales giving Raveling Companies a gross profit of 24%.
Raveling Companies conservatively projects its selling expense to total 6% of sales.
The 6% selling expense includes a payroll commission expense of 3 ½% of sales. The
remaining 2 ½% (of sales) includes all other expenses related to sales. This includes
client entertainment expenses, travel, marketing materials (brochures & price books),
advertisements in industry trade papers, transportation, communications, direct mail,
internet advertisements, and all other expenses relating to marketing and sales.
Raveling Companies projects FICA (payroll tax expense) to total 15% of its payroll
expense. Raveling Companies payroll expense is based on a commission of 3 ½% of
sales.
Raveling Companies projects monthly legal expenses of $500 and monthly
accounting expenses of $200.
Accounts receivable is conservatively estimated at 30 days. Therefore, accounts
receivable is estimated to total 30 days of sales. Accounts payable is estimated at 30 days.
Therefore, accounts payable is estimated to total 30 days of the sum of labor and
materials.
17. Important Ratios
Break Even Point (B/E) – 1.5 Months
Average 3 Year Net Profit Margin (NPM) – 11%
1 Year Return on Investment (ROI) – 7.98
1 Year Net Present Value (NPV) - $105,052
1 Year Internal Rate of Return (IRR) – 698%
8