Download to read offline
![PHONE FAX WEB
[Street Address], [City], [State] [Postal Code] [Your Phone] [Your Fax] [Web Address]
STHDA – Statistical Tools for Data Analysis
R software and ReporteRs package
Create a nice Word document
2014/12/26](https://image.slidesharecdn.com/r-reporters-word-document-from-template-141225180626-conversion-gate01/85/Word-document-created-from-a-template-using-R-software-and-ReporteRs-package-1-320.jpg)
![PHONE FAX WEB
[Street Address], [City], [State] [Postal Code] [Your Phone] [Your Fax] [Web Address]
STHDA – Statistical Tools for Data Analysis
R software and ReporteRs package
Create a nice Word document
2014/12/26](https://image.slidesharecdn.com/r-reporters-word-document-from-template-141225180626-conversion-gate01/75/Word-document-created-from-a-template-using-R-software-and-ReporteRs-package-1-2048.jpg)
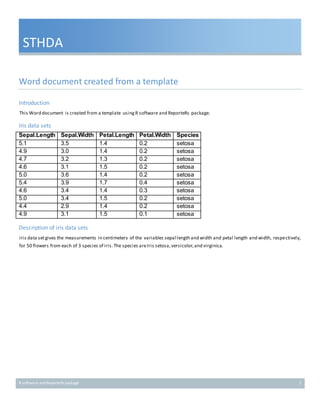
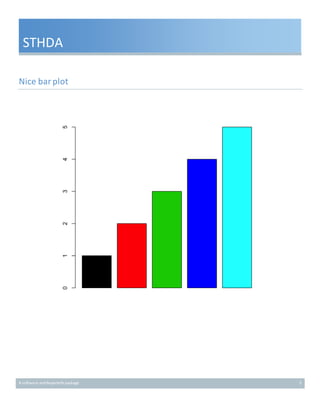
The document describes a Word template created using R software and the reporters package, specifically for statistical tools for data analysis. It includes details of the Iris dataset, which contains measurements of sepal and petal dimensions for three species of iris flowers: setosa, versicolor, and virginica. The document also mentions the generation of visualizations, such as a bar plot.


![제 23회 보아즈(BOAZ) 빅데이터 컨퍼런스 - [MBOAX] : ABSA를 활용한 소비자 반응 분석 기반 운영 효율화 대시보드 설계](https://cdn.slidesharecdn.com/ss_thumbnails/3-1boaz23rdconferencemboax-260203102709-9d519923-thumbnail.jpg?width=640&height=640&fit=bounds)


