Qwest Communications reported a net loss of $307 million for Q4 2003 and net income of $1.6 billion for the full year. While revenue declined year-over-year due to competitive pressures, investments in new services like Qwest Choice packages drove customer growth. Total debt was reduced by $5 billion in 2003 and free cash flow improved by $463 million over 2002. Customer satisfaction scores increased as Qwest's service initiatives took effect, and key metrics like long-distance and DSL subscribers grew substantially in Q4.
Qwest Communications reported financial results for the first quarter of 2002, with a net loss of $698 million compared to a $46 million loss in Q1 2001. Revenue declined 13.5% to $4.37 billion primarily due to absence of optical capacity asset sales and internet equipment sales. Recurring revenue declined 3.7% to $4.37 billion. Qwest expects total revenue of $18-18.4 billion, adjusted EBITDA of $6.4-6.6 billion, and capital expenditures of $3.1-3.3 billion for 2002.
Qwest announced its third quarter 2007 results, reporting earnings of $2.1 billion including a $2.1 billion tax benefit and $353 million in litigation charges. Revenue trends were positive with growth in data, internet, and video services. Adjusted free cash flow for the year is on track to improve by up to $400 million. Customer satisfaction increased with bundles penetration reaching 61% and broadband subscribers growing by 111,000.
Qwest Communications reported its fourth quarter and full-year 2002 financial results. For Q4 2002, Qwest reported net income of $2.7 billion compared to a net loss of $645 million in Q4 2001. However, for the full year 2002 Qwest reported a net loss of $35.9 billion due to accounting adjustments of $40.9 billion. Qwest improved its balance sheet by reducing debt by $1.9 billion through a debt exchange and improved working capital by $5.1 billion for the year. Qwest also saw some positive trends with reduced consumer access line losses for the second consecutive quarter and continued growth in IP revenue, though revenue overall declined due to competitive pressures.
Qwest Communications reported first quarter earnings of $0.09 per diluted share. Total debt was reduced by $333 million in the first quarter and $500 million year-to-date through debt payments and exchanges. Operational highlights included signing up 530,000 access lines for long-distance service and a third consecutive quarter of improved consumer access line losses. Qwest provided updates on its financial restatement process and debt reduction activities.
Sprint Nextel reported second quarter 2008 results including consolidated net operating revenues of $9.1 billion and a diluted loss per share of 12 cents. Adjusted OIBDA was $2.1 billion, an improvement of $87 million from the previous quarter. Post-paid churn improved over 45 basis points from the first quarter to below 2.0%. The company expects higher post-paid subscriber losses and modest pressure on post-paid ARPU in the third quarter. Capital expenditures are expected to remain at levels similar to the first half of the year.
energy future holindings TXU_Q3_2003_Earnings_Packfinance29
TXU reported improved financial results for the third quarter and first nine months of 2003 compared to the same periods in 2002. Third quarter earnings from continuing operations increased 15% to $368 million, or $1.01 per share, due to higher contribution margins and lower costs across all business segments. For the first nine months, earnings from continuing operations were $650 million, or $1.82 per share. TXU expects full-year 2003 earnings from continuing operations to be around $2.00 per share.
Qwest Communications reported its second quarter 2002 results. It achieved positive free cash flow of $320 million but reported a net loss of $1.14 billion. It revised its full year 2002 guidance, expecting total revenue between $17.1-17.4 billion and a normalized loss per share between ($0.46)-($0.49). Recurring revenue declined 6% to $4.32 billion compared to the second quarter of 2001. Adjusted EBITDA was $1.26 billion, down from $2 billion the previous year.
Sprint Nextel reported its second quarter 2007 results. Key highlights include:
- Total subscribers increased nearly 400,000 to 54 million, with post-paid net additions of 16,000.
- Higher post-paid ARPU and cost reductions drove a strong sequential improvement in profitability. Adjusted OIBDA increased 12% sequentially.
- Continued strength in wireless data and IP services revenues, which grew 40% and 37% year-over-year respectively.
- Net operating revenues increased 7% year-over-year to $10.4 billion in Q4 2006 and increased 7% to $41 billion for full-year 2006 compared to pro forma 2005.
- Adjusted OIBDA increased 13% to $3.2 billion in Q4 2006 and increased 12% to $12.7 billion for full-year 2006 compared to pro forma 2005.
- Diluted EPS from continuing operations was $0.09 in Q4 2006 compared to break-even in Q4 2005, and was $0.34 for full-year 2006 compared to $0.40 for full-year 2005.
[1] ALLTEL achieved solid financial results in 2002 despite economic challenges, with revenues and earnings per share up 6% and 14% respectively. [2] The company completed two acquisitions, adding over 1.35 million customers, and raised $3 billion in financing for the deals. [3] Looking ahead, ALLTEL will focus on improving the customer experience at all points of interaction and navigating ongoing industry and regulatory issues.
Sprint Nextel reported third quarter 2008 financial results including consolidated net operating revenues of $8.8 billion and a diluted loss per share of 11 cents. The company generated $1.1 billion in free cash flow for the quarter and had $4.1 billion in cash at the end of the quarter. Sprint saw declines in its wireless business from fewer subscribers and lower revenue but made progress improving customer experience through initiatives like Ready Now and launching 4G WiMAX services.
- Sprint Nextel reported financial results for Q4 and full-year 2007, with consolidated revenues of $9.8 billion for Q4 and $40.1 billion for the year.
- A non-cash goodwill impairment charge of $29.7 billion was recorded in Q4, resulting in a net loss of $29.5 billion for the quarter.
- Wireless profitability declined in Q4 due to lower service revenues and higher expenses, though data revenues grew. Wireline profitability increased.
- The company is taking actions to increase financial flexibility, including borrowing funds and discontinuing dividend payments for the foreseeable future.
TDS Telecom reported third quarter 2017 results with the following highlights:
- Total operating revenues were $285 million, down 1% year-over-year.
- Wireline revenues grew 2% driven by growth in IPTV and residential revenue per connection.
- Cable revenues increased 12% from broadband growth of 10%.
- Hosted and Managed Services revenues declined 18% from lower hardware installation spending.
- Adjusted EBITDA was $80 million, up 14% year-over-year, driven by growth in Wireline and Cable offset by declines in Hosted and Managed Services.
1) U.S. Bancorp reported record net income of $1.071 billion for the first quarter of 2005, up 1.4% from the previous quarter and up 6.3% from the first quarter of 2004.
2) Fee revenue grew over 9% year-over-year, driven by a 15% increase in payment services, while deposit service charges rose over 13%.
3) Commercial loan balances increased 7.3% year-over-year and net charge-offs declined significantly from the previous year, reflecting improving credit quality.
Viacom reported record fourth quarter and full year 2002 results. For Q4, revenues increased 12% to $6.8 billion and operating income increased to $1.3 billion. For the full year, revenues increased 6% to $24.6 billion and operating income increased to $4.6 billion. The strong results were driven by growth across all business segments, especially cable networks, television, and entertainment. Viacom expects mid-single digit revenue growth and double-digit EBITDA growth for full year 2003.
news corp 2nd Qtr - FY09 - December 31, 2008 - US Dollarsfinance9
News Corporation reported financial results for the second quarter of fiscal year 2009. While revenue was $7.9 billion, adjusted operating income declined 42% to $818 million due to weakness across many business segments. A $8.4 billion non-cash impairment charge related to goodwill and assets resulted in a net loss of $6.4 billion for the quarter. The company is implementing cost cuts in response to the economic downturn.
U.S. Bancorp reported a 14% increase in earnings per share for the third quarter of 2004 compared to the same period in 2003, driven by strong fee revenue and improved credit quality. Net income was $1.065 billion for Q3 2004, up 12.1% from Q3 2003. Returns on average assets and equity were also up from the prior year. Fee income growth of 11.7% helped offset weakness in commercial lending. Credit costs declined 46.7% from a year ago due to lower net charge-offs and nonperforming assets.
YRC Worldwide reported a loss for 2008 due to the economic recession. While losses were larger than expected, cash flow was positive. The company aims to improve performance through integrating Yellow Transportation and Roadway networks, and reducing wages. An amendment to credit facilities is expected to finalize in February to improve the company's financial position.
- Level 3 Communications reported third quarter 2014 results on November 5, 2014
- Key highlights included Core Network Services revenue growth of 5.8% year-over-year and Adjusted EBITDA of $471 million
- The company also reported generating $157 million in free cash flow year-to-date
The document provides Level 3 Communications' financial results for the first quarter of 2014. Some key highlights include:
- Core Network Services revenue grew 6.6% year-over-year to $1.457 billion, driven by 11% growth in Enterprise CNS.
- Gross margin improved to 61.8% due to higher margin CNS revenue growth.
- Adjusted EBITDA grew 23% year-over-year to $458 million.
- Free cash flow improved by $140 million year-over-year.
- Based on strong performance, Level 3 raised its full year 2014 guidance for Adjusted EBITDA growth to 14-18% and free cash flow to
Level 3 Communications reported first quarter 2014 results with the following highlights:
- Core Network Services revenue grew 6.6% year-over-year to $1.457 billion driven by 11% growth in Enterprise CNS.
- Gross margin improved to 61.8% and Adjusted EBITDA grew 23% to $458 million.
- Based on strong performance, Level 3 raised its full year 2014 outlook for Adjusted EBITDA growth to 14-18% and Free Cash Flow to $250-300 million.
The Walt Disney Company reported financial results for the quarter and nine months ended June 30, 2002. Revenues decreased 3% to $5.8 billion for the quarter, and segment operating income decreased 26% to $828 million. For the nine months, revenues decreased 4% to $18.7 billion and operating income decreased 32% to $2.3 billion. Earnings per share were $0.18 for the quarter and $0.52 for the nine months. Results were negatively impacted by softness in the travel industry and weak advertising markets. The Company expects earnings to be lower in the current fourth quarter compared to the prior year.
Yellow Roadway Corporation delivered a successful first year after merging Roadway Express and Yellow Transportation. In 2004, the company achieved its highest ever revenue and operating income. All business units set new records for revenue, operating income, and margins. For the fourth quarter of 2004, the company reported operating revenue of $1.77 billion, adjusted operating income of $107 million, and adjusted earnings per share of $1.24. For the full year, operating revenue was $6.77 billion and adjusted operating income was $357 million. The company expects continued strong performance in 2005 with earnings per share projected between $5.10-$5.30.
Clear Channel Communications reported financial results for the fourth quarter and full year of 2004. Revenue increased 1% to $2.31 billion in Q4 2004 and 5% to $9.4 billion for the full year. Income was $214 million in Q4 2004 and $845.8 million for the full year. The company's radio broadcasting revenues grew 2% for the year due to strength in small and mid-sized markets. Outdoor advertising revenues increased 13% from higher rates and occupancy. The company will continue focusing on improving operations and driving profitability across its businesses.
Tele Celular Sul Participações S.A. announced its results for the fourth quarter and full year 2003. Key highlights include:
- Revenues increased 23.5% to R$1.4 billion for the year driven by a 19% rise in customers to over 2 million.
- EBITDA grew 10.1% to R$383 million and net income increased 83.7% to R$120 million, a record level.
- Investments totaled R$213 million, mainly to expand GSM coverage, while still generating a positive cash flow of R$200 million for the year.
This document summarizes Xcel Energy's investor meetings on the west coast in September 2005. It outlines Xcel's strategy to invest in utility assets and earn allowed returns on equity. It provides details on drivers of value creation, capital expenditure plans from 2005-2009, sources of funding, potential regulatory income increases, and earnings growth targets. The appendix provides additional details on Xcel's service territories, organizational structure, rate base and returns by state.
Fiscal 2001 was a mixed year for Sun Microsystems. While revenue grew 16% to $18.25 billion, net income declined 50% to $927 million due to economic pressures. Sun believes its focus on networking positions it well for long-term growth, and it will continue investing heavily in R&D. The company aims to provide increasing customer satisfaction and shareholder value going forward through its diverse product portfolio and commitment to open standards.
Qwest reported solid first quarter results with positive earnings per share, revenue growth, and continued margin expansion. EPS was $0.05 compared to $0.03 in the first quarter of 2005. Revenue increased 0.8% year-over-year to $3.5 billion. Adjusted EBITDA margin improved to 30.7% from 28.7% in the first quarter of 2005. Key growth areas like high-speed internet and bundled products contributed to improved results.
World Fuel Services Corporation is a global leader in the downstream marketing and financing of aviation and marine fuel products and related services. For the nine-month period ended December 31, 2002, the company reported revenue of $1.55 billion, up 52.6% from the same period the previous year. Net income was $9.9 million, down 22.6% from the previous year. The company has a strong balance sheet with $312 million in total assets and $127.7 million in stockholders' equity.
Qwest Communications International Inc. reported financial results for the first quarter of 2008. Total operating revenue declined 1.4% year-over-year to $3.4 billion. Net income decreased 34.6% to $157 million compared to $240 million in the first quarter of 2007. Basic earnings per share fell 30.8% to $0.09 from $0.13 in the previous year.
This document provides a summary of AES Corporation's financial results for the second quarter of 2008. Some key highlights include:
- Increased full year adjusted EPS guidance to $1.16 per share.
- Reported Q2 2008 adjusted EPS of $0.17, including foreign currency losses.
- Began construction on four new power projects totaling 954 MW in three countries.
- Expanded wind platform in China and registered the company's first greenfield methane recovery project in Malaysia.
The document is the proxy statement for L-3 Communications Holdings, Inc.'s 2007 Annual Meeting of Stockholders. It provides information on the meeting such as the date, time, and location. It invites stockholders to attend and notifies them that proposals up for vote include the election of directors and ratification of the independent accounting firm. The proxy statement also provides details on director nominations, executive compensation, audit committee matters, and other standard annual meeting business. Stockholders are encouraged to vote by proxy.
The document provides reconciliations of non-GAAP financial measures reported by The Pepsi Bottling Group for 2008. It identifies items affecting comparability between years, including restructuring charges, asset disposal charges, and stock-based compensation. The document summarizes the quantitative impact of these items on key financial metrics like operating income growth, earnings per share, and cash flow. It also provides guidance for 2008 operating free cash flow.
pepsi bottling Non Gaap Investor Day121307finance19
The document provides reconciliations of non-GAAP financial measures reported by The Pepsi Bottling Group to GAAP measures for 2005-2007 and 2008 guidance. It summarizes adjustments made for items affecting comparability between years, including restructuring charges, tax law changes, and accounting rule changes. Operating profit growth, EPS, and cash flow are reconciled for these periods. Non-GAAP measures are used to evaluate underlying business performance by excluding certain non-recurring or variable items.
Viacom reported record third quarter 2003 results, with revenues increasing 5% to $6.60 billion and operating income rising 7% to $1.38 billion. Advertising revenues grew 8% to $2.88 billion. Earnings per share increased to $0.40 from $0.36 in the prior year. The company expects continued growth in 2004, forecasting revenue growth of 5-7% and earnings per share growth of 13-15%. Segment operating income rose significantly across Cable Networks, Television, and Video. The company reiterated 2003 guidance and sees strong growth continuing into 2004.
L-3 Communications had a very successful year in 2005, exceeding financial goals with sales of $9.44 billion, a 37% increase over 2004. Key acquisitions expanded L-3's capabilities in command, control, communications and intelligence. L-3 provides important support to US forces in Iraq and Afghanistan and its products are increasingly used internationally for security, crisis response and relief efforts. Looking ahead, L-3 is well positioned with its expanded portfolio to benefit from US defense strategies focusing on mobility, precision weapons and intelligence gathering.
Viacom reported financial results for the second quarter of 2005, with revenues increasing 10% to $5.9 billion led by growth across business segments. Operating income rose 4% to $1.4 billion, paced by increases at Cable Networks and Outdoor. Net earnings from continuing operations increased 6% to $762 million. The company is on track to deliver mid-single digit growth in revenues and operating income, and high-single digit growth in earnings per share for 2005.
- Qwest Communications reported operating revenue of $3.4 billion for Q3 2007, down 1.5% from Q3 2006. Net income was $2.1 billion compared to $194 million in Q3 2006.
- Total operating expenses increased 5.4% to $3.3 billion in Q3 2007, driven by a 30.5% rise in selling, general and administrative costs.
- EBITDA (earnings before interest, taxes, depreciation, and amortization) was $798 million in Q3 2007 with an EBITDA margin of 23.2%, down from $1.1 billion and a 31.3% margin in Q3 2006.
Texas Instruments reported financial results for the 4th quarter and full year of 2008. Revenue declined 30% from the previous year's 4th quarter to $2.49 billion due to weakness in all segments. Net income was $107 million compared to $753 million in the prior year. For the full year, revenue declined 10% to $12.5 billion and net income fell 27% to $1.92 billion. TI is reducing expenses through layoffs and plant closures in response to the weakened global economy and reduced demand.
CBS Corporation reported financial results for the first quarter of 2007 with revenues up 2% to $3.7 billion and net earnings from continuing operations up 8% to $254 million. Television revenues increased 2% due to growth in advertising, home entertainment, and affiliate fees. Publishing revenues increased 27% due to strong sales of bestselling titles. Free cash flow was up 17% to $753 million. The company expects low single-digit revenue growth, mid single-digit growth in operating income, and high single-digit growth in earnings per share for the long term.
The AES Corporation reported record annual revenues and net cash from operating activities in 2006. Revenues totaled $12.3 billion, up 12% from 2005, while net cash from operating activities increased to $2.5 billion. Income from continuing operations decreased to $286 million due to a $512 million restructuring charge in Brazil. AES completed the $739 million sale of its Venezuelan subsidiary and provided 2007 guidance of $1.04 in diluted EPS from continuing operations and $1.07 in adjusted EPS.
Qwest reported third quarter 2004 results with improved revenue trends driven by wireline and wireless segments. Revenue increased slightly compared to last quarter but decreased year-over-year. Cost reduction initiatives expanded margins while cash from operations exceeded capital expenditures. Key growth areas like DSL subscribers and long-distance lines increased significantly.
Qwest Communications reported a net loss of $310 million or $0.17 per share for Q1 2004, compared to net income of $152 million in Q1 2003. Revenue declined 3.9% to $3.48 billion due to decreases in local and wireless revenue, though revenue trends improved sequentially. Record growth in long-distance and DSL customers drove a 32% consumer bundle penetration rate. Qwest added 1.2 million long-distance lines and 107,000 DSL subscribers in the quarter. The company continues to work to reduce debt and improve its balance sheet.
Qwest Communications reported a net loss of $776 million for Q2 2004, compared to a $64 million loss in Q2 2003. While revenue declined 4.3% due to competitive pressures, key growth areas like DSL and wireless saw improvements. Operating costs increased due to workforce reductions and litigation reserves. The company continued reducing debt and expanding high-growth services to improve its financial position.
Qwest improved its financial performance in the fourth quarter of 2004. Key growth areas like DSL subscribers, consumer bundles, and long-distance lines saw increases. Cost reduction initiatives expanded margins. Cash from operations exceeded capital expenditures for the quarter and year. Operational highlights included surpassing one million DSL subscribers, nearly doubling consumer bundle penetration, and adding over 2 million long-distance lines in 2004.
Qwest Communications reported third quarter 2003 earnings of $1.8 billion compared to a loss of $123 million in the third quarter of 2002. Revenue declined 5.4% to $3.6 billion due to competitive pressures, while expenses increased due to one-time charges. Qwest also launched a $2.25 billion tender offer to reduce debt and strengthened its balance sheet with $6.1 billion in cash following the sale of QwestDex.
Qwest reported improved second quarter results, with revenue increasing slightly both sequentially and year-over-year. Operating income and margins expanded due to ongoing cost reduction efforts. Key growth areas like high-speed internet, bundled services, and wireless saw subscriber increases. Cash flow from operations exceeded capital expenditures, and debt was reduced by over $850 million from the previous year.
Qwest Communications reported a Q2 2003 net loss of $91 million compared to a net income of $128 million in Q1 2003. Total access lines declined by 1.4% from the previous quarter to 16.5 million lines. Qwest stated that their financial statements for 2000-2002 are essentially complete pending final SEC and auditor reviews.
Qwest reported higher sequential net income of $117 million for Q2 2006, compared to $88 million in Q1 2006. EBITDA margins expanded by 330 basis points year-over-year to 31.9%. Revenue was relatively flat at $3.5 billion compared to Q2 2005. The company also generated $595 million in free cash flow for the quarter and expects $1.35-$1.5 billion for 2006. Customer connections grew by 318,000 from the year-ago quarter, driven by growth in high-speed internet and bundled products.
Qwest reported solid fourth quarter results, with year-over-year revenue growth of 1.3% and break-even earnings per share before special items. Key growth areas like high-speed internet and bundled services saw increases. Total customer connections grew for the second consecutive quarter while access line losses improved.
Qwest reported strong third quarter results, with net income of $194 million compared to a loss of $144 million in the previous year. Key metrics improved, including a 9% increase in operating margins, 7% growth in consumer revenue per user, and 175,000 new high-speed internet subscribers. The company also generated $358 million in free cash flow for the quarter and reduced its debt load.
Qwest Communications reported financial results for the third quarter of 2002, with a net loss of $214 million compared to a $142 million loss in the same period last year. While revenue declined 13.2% year-over-year, Qwest achieved positive free cash flow for the second consecutive quarter through cost reductions. Qwest also took steps to strengthen its balance sheet by amending credit facilities and selling its QwestDex directory business.
Qwest reported third quarter 2005 results with revenue of $3.5 billion, a 1% increase over last quarter and 1.6% increase year-over-year. While the company continued to report losses, margins expanded due to cost reductions. Key growth areas like high-speed internet, bundles, and long-distance saw increases, and capital expenditures were $445 million.
Sprint Nextel reported third quarter 2007 results with consolidated revenues of $10 billion, down 4% year-over-year. Net income was $64 million, down from $279 million in the third quarter of 2006. Wireless revenues declined 1% sequentially and 4% year-over-year to $8.7 billion, with a net loss of 60,000 subscribers. Wireline revenues declined 1% to $1.6 billion but profitability improved with adjusted operating income up 84% to $158 million. Sprint Nextel expects full-year capital investments to be in the mid $6 billion range, down from prior guidance of $7.2 billion.
Qwest reported steady financial results for the second quarter of 2007, with improved revenue trends, earnings per share growth, and margin expansion compared to the same period last year. Net income increased 110% year-over-year to $246 million. Qwest continued growing its data, internet, and video services, with these revenue streams now making up 36% of operating revenue. The company also enhanced its balance sheet by paying down $356 million in debt during the quarter.
Spectra Energy reported third quarter 2007 results with ongoing net income of $240 million, up 32% from the prior year. Key highlights included strong performance from US Transmission and Distribution businesses, as well as progress on their $3 billion 2007-2009 capital investment program with $625-650 million expected to be completed by the end of 2007. Management remains confident in meeting 2007 financial goals and delivering steady growth and attractive dividends.
Qwest reported solid first quarter 2007 results, with net income increasing 173% year-over-year to $240 million. High-speed internet subscribers grew 37% to over 1.2 million, while data and internet revenue increased 11%. Earnings per share of $0.12 also grew substantially over the prior year. The company continued expanding margins and growing profits through initiatives such as bundling services and reducing operating expenses.
Qwest Communications reported its fourth quarter and full year 2007 results, highlighting growth in key areas. Net income grew substantially both year-over-year and quarter-over-quarter. Adjusted free cash flow also grew 29% for the full year. Qwest expanded adjusted EBITDA margins by 190 basis points for the full year through continued improvements in productivity and cost reductions. Consumer bundle penetration reached 62% in the fourth quarter, driving higher consumer revenue per user.
Qwest saw significant growth in key areas and margin expansion in the first quarter of 2005. Operating income increased 37% to $200 million compared to $146 million in the previous quarter. Revenue was stable at $3.45 billion despite competitive pressures, while expenses declined. Growth areas like DSL subscribers, consumer bundles, and long-distance lines all increased substantially compared to a year ago.
Sprint Nextel reported financial results for the first quarter of 2008, with consolidated revenues declining 8% year-over-year to $9.3 billion due to lower contributions from Wireless. Wireless revenues fell 9% to $8 billion as average revenue per user and subscriber numbers declined. Wireline revenues grew 2% to $1.6 billion on strong demand for IP services. The company reported a net loss of $505 million for the quarter and saw post-paid subscriber losses of over 1 million. Sprint focused on improving the customer experience and reducing costs, while making progress on wireless integration goals.
- Qwest reported steady financial results for Q1 2008, with operating revenue of $3.4 billion, income before taxes of $256 million, and net income of $157 million.
- While maintaining financial performance, Qwest made strategic progress, including a partnership with Verizon Wireless and launching new broadband internet offers.
- Revenue was impacted by industry consolidation and pricing pressure, but data, internet, and video revenue grew 9%. Expenses declined through cost reductions.
- The document reports on the third quarter 2017 results and provides guidance for full year 2017 results for TDS Telecom and U.S. Cellular.
- It summarizes key metrics such as total operating revenues, adjusted OIBDA, capital expenditures, and customer connections.
- It notes that U.S. Cellular and HMS management revised long-range forecasts, triggering goodwill impairment losses totaling $262 million for TDS and $370 million for U.S. Cellular.
Similar to qwest communications 4q 03 earnings (20)
The document discusses Pepsi Bottling Group's use of non-GAAP financial measures to provide additional context for investors beyond standard GAAP reporting. It defines one such measure, Operating Free Cash Flow (OFCF), as cash from operations less capital expenditures plus excess tax benefits from stock options. Management uses OFCF to evaluate business performance and liquidity. The document provides Pepsi's forecast for 2007 OFCF between $530-550 million and outlines adjustments made to certain first quarter 2007 financial results to exclude foreign currency translation impacts.
The document discusses Pepsi Bottling Group's (PBG) use of non-GAAP financial measures to provide additional context for investors beyond standard GAAP reporting. It provides non-GAAP adjusted figures for PBG's second quarter 2007 results which exclude the impact of foreign currency translation. It also gives adjusted guidance figures for full year 2007 diluted EPS and effective tax rate which exclude the impact of reversing tax contingencies. Finally, it defines and discusses the non-GAAP measure of operating free cash flow, and provides PBG's estimated range for full year 2007 operating free cash flow.
The document provides reconciliations of Pepsi Bottling Group's (PBG) reported and comparable non-GAAP financial measures for the third quarter and year-to-date 2007, including net revenue, gross profit, operating income, earnings per share (EPS), and operating free cash flow (OFCF). It also provides PBG's 2007 guidance ranges on a reported and adjusted basis, adjusting for items affecting comparability including tax matters, restructuring charges, and asset rationalization charges.
The document summarizes Pepsi Bottling Group's (PBG) fourth quarter 2007 earnings conference call. It provides non-GAAP financial measures to allow for meaningful year-over-year comparisons. Items affecting comparability in 2007 include a tax contingency reversal, tax law changes, and restructuring charges. The document also reconciles 2007 and Q4 2007 reported results to comparable results. Guidance for 2008 reported and comparable operating income growth and EPS is also provided.
The document provides a reconciliation of non-GAAP financial measures for Pepsi Bottling Group's first quarter 2008 earnings conference call. It summarizes restructuring charges and an asset disposal charge that affected comparability between periods. It provides comparable and reported operating income growth, EPS, and guidance figures. It also defines and provides guidance for operating free cash flow.
The document summarizes Pepsi Bottling Group's second quarter 2008 earnings conference call. It discusses non-GAAP financial measures used by the company to provide meaningful year-over-year comparisons and evaluate underlying business performance. Items affecting comparability between years are also reviewed, including restructuring charges, asset disposal charges, and tax items. Specific metrics for certain international markets and 2008 guidance figures both on a comparable and reported basis are also presented. Operating free cash flow is defined and full-year 2008 expectations provided.
The document provides reconciliations of non-GAAP financial measures and items affecting comparability for The Pepsi Bottling Group's third quarter 2008 earnings conference call. It summarizes restructuring charges, asset disposal charges, a tax audit settlement, tax law changes, and stock-based compensation adjustments. It also provides comparable and reported figures for net revenue, operating income, earnings per share, and other metrics. Guidance is given for full-year 2008 measures on a comparable and reported basis.
The document provides financial information and reconciliation of non-GAAP measures for The Pepsi Bottling Group's fourth quarter 2008 earnings conference call. It summarizes items affecting comparability for 2008 and 2009, including impairment charges, restructuring charges, and the impact of foreign exchange rates. It also provides the company's operating free cash flow for 2008 and guidance for comparable net revenues, costs, operating income, earnings per share, and operating free cash flow for 2009.
The document provides reconciliation of non-GAAP financial measures for The Pepsi Bottling Group for 2008. It summarizes items affecting comparability between years such as impairment charges, restructuring charges, and accounting standard changes. Tables show the impact of these items on operating income, net revenues, operating profit, and earnings per share for 2008 compared to 2005, 2007, and 2003. The document also provides 2009 guidance forecasts for revenue growth, operating income growth, earnings per share, and operating free cash flow.
The document discusses PBG's financial highlights and growth in 2000. Key points:
1) PBG had strong financial results in 2000, with net revenues of $7.982 billion and EPS of $1.53, up from 1999. Operating income and EBITDA also grew substantially.
2) Two-thirds of PBG's business comes from take-home sales. In 2000 PBG focused on growing its bottled water and flavor carbonated soft drink segments in the take-home market.
3) PBG launched Sierra Mist, a new lemon-lime flavor, to capitalize on the fast growing lemon-lime segment of the carbonated soft drink category. The launch was swift in
World Fuel Services Corporation is a global leader in the downstream marketing and financing of aviation and marine fuel products and related services. For the nine-month period ended December 31, 2002, the company reported revenue of $1.55 billion, up 52.6% from the same period the previous year. Net income was $9.9 million, down 22.6% from the previous year. The company has a strong balance sheet with $312 million in total assets and $127.7 million in stockholders' equity.
World Fuel Services Corporation reported strong financial results for 2003 with revenue increasing 40% to $2.7 billion compared to 2002. Net income increased 52.5% to $21.9 million resulting in diluted earnings per share rising 48.5% to $1.96. Both the aviation and marine fuel divisions experienced increased revenue and income from operations. Looking forward, the company expects continued growth with the recent acquisition of Tramp Oil, one of the largest marine fuel services groups.
World Fuel Services Corporation reported strong financial results for 2003 with revenue increasing 40% to $2.7 billion compared to 2002. Net income increased 52.5% to $21.9 million resulting in diluted earnings per share rising 48.5% to $1.96. Both the aviation and marine divisions experienced growth in revenue and income from operations. The company also strengthened its balance sheet and acquired Tramp Oil, one of the largest marine fuel services groups. World Fuel Services expects continued growth and success in the future driven by its global presence and service offerings.
where can I find a legit pi merchant onlineDOT TECH
Yes. This is very easy what you need is a recommendation from someone who has successfully traded pi coins before with a merchant.
Who is a pi merchant?
A pi merchant is someone who buys pi network coins and resell them to Investors looking forward to hold thousands of pi coins before the open mainnet.
I will leave the what'sapp contact of my personal pi merchant to trade with
+12349014282
Seminar: Gender Board Diversity through Ownership NetworksGRAPE
Seminar on gender diversity spillovers through ownership networks at FAME|GRAPE. Presenting novel research. Studies in economics and management using econometrics methods.
The Rise of Generative AI in Finance: Reshaping the Industry with Synthetic DataChampak Jhagmag
In this presentation, we will explore the rise of generative AI in finance and its potential to reshape the industry. We will discuss how generative AI can be used to develop new products, combat fraud, and revolutionize risk management. Finally, we will address some of the ethical considerations and challenges associated with this powerful technology.
Turin Startup Ecosystem 2024 - Ricerca sulle Startup e il Sistema dell'Innov...Quotidiano Piemontese
Turin Startup Ecosystem 2024
Una ricerca de il Club degli Investitori, in collaborazione con ToTeM Torino Tech Map e con il supporto della ESCP Business School e di Growth Capital
^%$Zone1:+971)581248768’][* Legit & Safe #Abortion #Pills #For #Sale In #Duba...mayaclinic18
Whatsapp (+971581248768) Buy Abortion Pills In Dubai/ Qatar/Kuwait/Doha/Abu Dhabi/Alain/RAK City/Satwa/Al Ain/Abortion Pills For Sale In Qatar, Doha. Abu az Zuluf. Abu Thaylah. Ad Dawhah al Jadidah. Al Arish, Al Bida ash Sharqiyah, Al Ghanim, Al Ghuwariyah, Qatari, Abu Dhabi, Dubai.. WHATSAPP +971)581248768 Abortion Pills / Cytotec Tablets Available in Dubai, Sharjah, Abudhabi, Ajman, Alain, Fujeira, Ras Al Khaima, Umm Al Quwain., UAE, buy cytotec in Dubai– Where I can buy abortion pills in Dubai,+971582071918where I can buy abortion pills in Abudhabi +971)581248768 , where I can buy abortion pills in Sharjah,+97158207191 8where I can buy abortion pills in Ajman, +971)581248768 where I can buy abortion pills in Umm al Quwain +971)581248768 , where I can buy abortion pills in Fujairah +971)581248768 , where I can buy abortion pills in Ras al Khaimah +971)581248768 , where I can buy abortion pills in Alain+971)581248768 , where I can buy abortion pills in UAE +971)581248768 we are providing cytotec 200mg abortion pill in dubai, uae.Medication abortion offers an alternative to Surgical Abortion for women in the early weeks of pregnancy. Zone1:+971)581248768’][* Legit & Safe #Abortion #Pills #For #Sale In #Dubai Abu Dhabi Sharjah Deira Ajman Fujairah Ras Al Khaimah%^^%$Zone1:+971)581248768’][* Legit & Safe #Abortion #Pills #For #Sale In #Dubai Abu Dhabi Sharjah Deira Ajman Fujairah Ras Al Khaimah%^^%$Zone1:+971)581248768’][* Legit & Safe #Abortion #Pills #For #Sale In #Dubai Abu Dhabi Sharjah Deira Ajman Fujairah Ras Al Khaimah%^^%$Zone1:+971)581248768’][* Legit & Safe #Abortion #Pills #For #Sale In #Dubai Abu Dhabi Sharjah Deira Ajman Fujairah Ras Al Khaimah%^^%$Zone1:+971)581248768’][* Legit & Safe #Abortion #Pills #For #Sale In #Dubai Abu Dhabi Sharjah Deira Ajman Fujairah Ras Al Khaimah%^^%$Zone1:+971)581248768’][* Legit & Safe #Abortion #Pills #For #Sale In #Dubai Abu Dhabi Sharjah Deira Ajman Fujairah Ras Al Khaimah%^^%$Zone1:+971)581248768’][* Legit & Safe #Abortion #Pills #For #Sale In #Dubai Abu Dhabi Sharjah Deira Ajman Fujairah Ras Al Khaimah%^^%$Zone1:+971)581248768’][* Legit & Safe #Abortion #Pills #For #Sale In #Dubai Abu Dhabi Sharjah Deira Ajman Fujairah Ras Al Khaimah%^^%$Zone1:+971)581248768’][* Legit & Safe #Abortion #Pills #For #Sale In #Dubai Abu Dhabi Sharjah Deira Ajman Fujairah Ras Al Khaimah%^^%$Zone1:+971)581248768’][* Legit & Safe #Abortion #Pills #For #Sale In #Dubai Abu Dhabi Sharjah Deira Ajman Fujairah Ras Al Khaimah%^^%$Zone1:+971)581248768’][* Legit & Safe #Abortion #Pills #For #Sale In #Dubai Abu Dhabi Sharjah Deira Ajman Fujairah Ras Al Khaimah%^^%$Zone1:+971)581248768’][* Legit & Safe #Abortion #Pills #For #Sale In #Dubai Abu Dhabi Sharjah Deira Ajman Fujairah Ras Al Khaimah%^^%$Zone1:+971)581248768’][* Legit & Safe #Abortion #Pills #For #Sale In #Dubai Abu Dhabi Sharjah Deira Ajman Fujairah Ras Al Khaimah%^^%$Zone1:+971)581248768’][* Legit & Safe #Abortion #Pills #For #Sale In #Dubai Abu Dhabi Sharjah Deira Ajman
Yes of course, you can easily start mining pi network coin today and sell to legit pi vendors in the United States.
Here the what'sapp contact of my personal vendor.
+12349014282
#pi network #pi coins #legit #passive income
#US
This assessment plan proposal is to outline a structured approach to evaluati...
qwest communications 4q 03 earnings
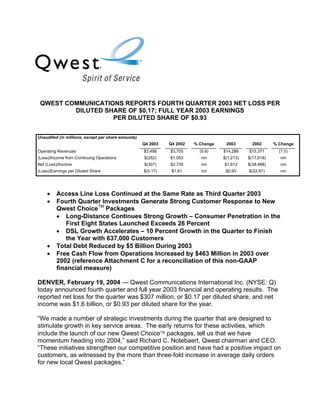
1. QWEST COMMUNICATIONS REPORTS FOURTH QUARTER 2003 NET LOSS PER
DILUTED SHARE OF $0.17; FULL YEAR 2003 EARNINGS
PER DILUTED SHARE OF $0.93
Unaudited (in millions, except per share amounts)
Q4 2003 Q4 2002 % Change 2003 2002 % Change
Operating Revenues $3,498 $3,705 (5.6) $14,288 $15,371 (7.0)
(Loss)/Income from Continuing Operations $(282) $1,053 nm $(1,213) $(17,618) nm
Net (Loss)/Income $(307) $2,735 nm $1,612 $(38,468) nm
(Loss)/Earnings per Diluted Share $(0.17) $1.61 nm $0.93 $(22.87) nm
• Access Line Loss Continued at the Same Rate as Third Quarter 2003
• Fourth Quarter Investments Generate Strong Customer Response to New
Qwest ChoiceTM Packages
• Long-Distance Continues Strong Growth – Consumer Penetration in the
First Eight States Launched Exceeds 26 Percent
• DSL Growth Accelerates – 10 Percent Growth in the Quarter to Finish
the Year with 637,000 Customers
• Total Debt Reduced by $5 Billion During 2003
• Free Cash Flow from Operations Increased by $463 Million in 2003 over
2002 (reference Attachment C for a reconciliation of this non-GAAP
financial measure)
DENVER, February 19, 2004 — Qwest Communications International Inc. (NYSE: Q)
today announced fourth quarter and full year 2003 financial and operating results. The
reported net loss for the quarter was $307 million, or $0.17 per diluted share, and net
income was $1.6 billion, or $0.93 per diluted share for the year.
“We made a number of strategic investments during the quarter that are designed to
stimulate growth in key service areas. The early returns for these activities, which
include the launch of our new Qwest Choice packages, tell us that we have
momentum heading into 2004,” said Richard C. Notebaert, Qwest chairman and CEO.
“These initiatives strengthen our competitive position and have had a positive impact on
customers, as witnessed by the more than three-fold increase in average daily orders
for new local Qwest packages.”
2. Financial Results
Revenue for the quarter was $3.5 billion, a 5.6 percent decrease from the fourth quarter
of 2002. For the full year, revenue was $14.3 billion compared to $15.4 billion for 2002,
or a decline of seven percent. Growth of long-distance and business and consumer
data revenue in the quarter partially offset the continued competitive pressures in local
voice and wireless services, as well as the de-emphasis of certain non-core services.
Total cost of sales plus selling, general and administrative (SG&A) expenses for the
quarter were $2.6 billion, compared to $2.5 billion for the fourth quarter of 2002.
Investments made in the quarter to support product launches, as well as increased
pension and retiree healthcare costs, were the primary drivers of the increase.
Total cost of sales and SG&A expenses for the full year were $10.9 billion compared to
$11.3 billion in 2002. Excluding the $393 million pre-tax charge to terminate certain
unconditional purchase obligations in the third quarter, total cost of sales were flat.
SG&A expenses decreased by $673 million in 2003. The decrease in SG&A was the
result of focused cost savings initiatives and a reduction in bad debt expense, which
more than offset increased costs to support investments in key growth areas and higher
pension and retiree healthcare expenses.
The net loss for the fourth quarter was $307 million, or $0.17 per diluted share. For the
quarter, the loss from continuing operations was $282 million, compared to a gain from
continuing operations of $1.1 billion for the fourth quarter of 2002. In the fourth quarter
of 2002, reported net income was $2.7 billion, or $1.61 per diluted share. For the full
year, the loss from continuing operations was $1.2 billion, compared to a loss of $17.6
billion in 2002. The full year net income for 2003 was $1.6 billion, or $0.93 per diluted
share, compared to a net loss of $38.5 billion, or $22.87 per diluted share for 2002.
Capital expenditures for the quarter were $615 million, compared to $561 million for the
fourth quarter of 2002. The increase is primarily associated with the deployment of
additional DSL facilities. For the full year, capital expenditures totaled $2.1 billion,
compared to $2.8 billion in 2002.
“In 2003, we significantly strengthened the company’s financial position and put in place
a series of initiatives designed to grow market share and better leverage our voice, data
and video assets,” said Oren G. Shaffer, Qwest vice chairman and CFO. “We continue
to see an opportunity for revenue growth in 2004. With our strong focus on cost
management, a $2 billion capital program, and lower interest expense, we expect
improvements in 2004 free cash flow.”
Liquidity and Balance Sheet Strengthened
Since December 31, 2002, Qwest’s total debt position has been reduced by $5 billion
through a combination of strategic transactions including debt-for-debt and debt-for-
equity exchanges, as well as cash repurchases. During the quarter, the company
successfully completed the purchase of approximately $3 billion of outstanding debt
through a cash tender offer and reduced the credit facility by $500 million.
2
3. In addition, the recently completed offer for $1.775 billion in notes will allow the
company to further extend maturities. The existing credit facility was fully paid off and a
new $750 million revolver has been put in place but has not been drawn. A previously
announced cash tender offer for $963 million in debt is scheduled to expire on February
26, 2004. As of February 12, $921 million in notes were tendered and paid. The
company expects annual interest expense savings to be $250 million in 2004.
Including the cash paid to terminate certain unconditional purchase obligations in the
third quarter, free cash flow from operations for the year was $87 million – representing
a $463 million improvement over 2002 (reference Attachment C for a reconciliation of
this non-GAAP financial measure).
Qwest Choice and Product Launch Update
The company posted strong growth in local service area long-distance and DSL,
increased package penetration, and experienced stabilization in access line trends.
Following the introduction of the Qwest Choice package in mid-December, Qwest has
seen further improvement in key operating metrics in early 2004.
Qwest increased its long-distance subscriber base by 36 percent in the fourth quarter.
As of year end, the company had approximately 2.3 million long-distance customers. In
the first eight states that Qwest offered long-distance, more than 26 percent of the
consumer lines include long-distance services – exceeding the company’s 25 percent
year-end penetration target. Since the introduction of Qwest Choice in mid-December,
the net subscriber additions per day have more than doubled. Qwest has also signed
more than 700 contracts with medium and large business local service customers in the
first three months following the launch of long-distance voice, data and Internet Protocol
services.
In the quarter, the number of DSL lines increased by 60,000, or 10 percent, to a total of
637,000 lines at the end of the year. Approximately 80 percent of the growth in DSL
lines occurred in the second half of 2003, as the service area was expanded to over
1,000 additional neighborhoods and communities. The success of the Qwest Choice
package has driven an increase of over 30 percent in weekly DSL line additions in early
2004 compared to the fourth quarter of 2003. Qwest plans to expand the DSL coverage
area from 45 percent to more than 60 percent of total access lines by the end of 2004 –
increasing the availability of DSL to more than 6 million homes.
Access line loss continued at the same rate as the third quarter 2003. Total access
lines, excluding the impact of 145,000 MCI lines disconnected in the second quarter,
decreased by 3.9 percent year-over-year compared to 4.4 percent in the fourth quarter
of 2002. Sequentially, access lines declined 0.9 percent for both the third and fourth
quarters of 2003. Since the launch of Qwest Choice, average consumer primary line
losses have improved more than 30 percent.
The company continues working with Sprint to finalize the introduction of national
wireless calling plans. The company expects to roll out services on March 1 to
customers in its 14-state local service area.
3
4. Two national customer satisfaction surveys of local service providers conducted in 2003
– the American Customer Satisfaction Index and J.D. Power and Associates – showed
Qwest is generating positive momentum with customers as a result of its Spirit of
Service initiatives. Both surveys showed that Qwest improved in all categories,
attributes and components of customer satisfaction. Customer service, as measured by
the Customer Transaction Survey, has increased from 58 percent of customers that
rated Qwest services as excellent to very good at the end 2002 to 65 percent at the end
of 2003.
Qwest plans to expand its VoIP coverage to the entire Minneapolis/St. Paul consumer
market and introduce its business VoIP offering in the first half of 2004. Plans are in
place to offer VoIP services in all major metropolitan markets within Qwest’s local region
by the end of 2004.
Qwest recently announced plans to offer stand-alone DSL – a revolutionary approach to
delivering broadband service for customers who no longer require traditional phone
service. Stand-alone DSL provides simplicity, flexibility and competitive prices and
allows customers to purchase only the services they want or need, including VoIP.
In addition, Qwest finalized its wide area networking services offering – Qwest iQ
Networking(sm) – which is now being offered to businesses across the U.S. The Qwest
iQ Networking solution provides feature-rich communications platforms that help
customers simplify their networks while still leveraging their existing technology
investments.
Conference Call Today
As previously announced, Qwest will host a conference call for investors and the media
today at 8:30 a.m. EST with Richard C. Notebaert, Qwest chairman and CEO and Oren
G. Shaffer, Qwest vice chairman and CFO. The call can be heard on the Web at
www.qwest.com/about/investor/meetings.
About Qwest
Qwest Communications International Inc. (NYSE: Q) is a leading provider of voice,
video and data services to more than 25 million customers. The company’s 47,000
employees are committed to the “Spirit of Service” and providing world-class services
that exceed customers’ expectations for quality, value and reliability. For more
information, please visit the Qwest Web site at www.qwest.com.
###
Forward Looking Statement Note
This release may contain projections and other forward-looking statements that involve risks and uncertainties. These statements
may differ materially from actual future events or results. Readers are referred to the documents filed by us with the Securities and
Exchange Commission, specifically the most recent reports which identify important risk factors that could cause actual results to
differ from those contained in the forward-looking statements, including but not limited to: access line losses due to increased
competition, including from technology substitution of our access lines with wireless and cable alternatives; the duration and extent
of the current economic downturn in our 14-state local service area, including its effect on our customers and suppliers; our
substantial indebtedness, and our inability to complete any efforts to de-lever our balance sheet through asset sales or other
transactions; any adverse outcome of the SEC's current investigation into our accounting policies, practices and procedures and
certain transactions; any adverse outcome of the current investigation by the U.S. Attorney's office in Denver into certain matters
relating to us; adverse results of increased review and scrutiny by Congress, regulatory authorities, media and others (including any
internal analyses) of financial reporting issues and practices or otherwise; further delays in making required public filings with the
4
5. SEC; rapid and significant changes in technology and markets; any adverse developments in commercial disputes or legal
proceedings, including any adverse outcome of current or future legal proceedings related to matters that are the subject of
governmental investigations, and, to the extent not covered by insurance, if any, our inability to satisfy any resulting obligations from
funds available to us, if any; potential fluctuations in quarterly results; volatility of our stock price; intense competition in the markets
in which we compete including the likelihood of certain of our competitors emerging from bankruptcy court protection or otherwise
reorganizing their capital structure and competing effectively against us; changes in demand for our products and services;
acceleration of the deployment of advanced new services, such as broadband data, wireless and video services, which could
require substantial expenditure of financial and other resources in excess of contemplated levels; higher than anticipated employee
levels, capital expenditures and operating expenses; adverse changes in the regulatory or legislative environment affecting our
business; and changes in the outcome of future events from the assumed outcome included in our significant accounting policies.
The information contained in this release is a statement of Qwest's present intention, belief or expectation and is based upon,
among other things, the existing regulatory environment, industry conditions, market conditions and prices, the economy in general
and Qwest's assumptions. Qwest may change its intention, belief or expectation, at any time and without notice, based upon any
changes in such factors, in Qwest's assumptions or otherwise. The cautionary statements contained or referred to in this release
should be considered in connection with any subsequent written or oral forward-looking statements that Qwest or persons acting on
its behalf may issue. This release may include analysts' estimates and other information prepared by third parties for which Qwest
assumes no responsibility.
The company expects to file in March 2004 its form 10-K for the year-ended December 31, 2003. Please refer to the form 10-K for a
full description of 2003 results.
Qwest undertakes no obligation to review or confirm analysts' expectations or estimates or to release publicly any revisions to any
forward-looking statements to reflect events or circumstances after the date hereof or to reflect the occurrence of unanticipated
events.
By including any information in this release, Qwest does not necessarily acknowledge that disclosure of such information is required
by applicable law or that the information is material.
The Qwest logo is a registered trademark of Qwest Communications International Inc. in the U.S. and certain other countries.
Media Contact: Investor Contact:
Contacts:
Tyler Gronbach Stephanie Comfort
303-992-2155 800-567-7296
tyler.gronbach@qwest.com IR@qwest.com
5