Dhule Call Girls #9907093804 Contact Number Escorts Service Dhule
Question By Question Percentages
1. % of
% of Those
Question Respondents
Survey Question Response Number Who Rated or
# (of Surveys for
Said How Often
Missing)
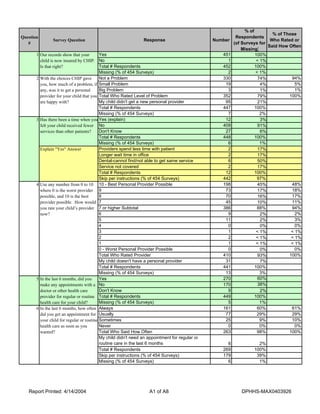
1 Our records show that your Yes 451 100%
child is now insured by CHIP. No 1 < 1%
Is that right? Total # Respondents 452 100%
Missing (% of 454 Surveys) 2 < 1%
2 With the choices CHIP gave Not a Problem 330 74% 94%
you, how much of a problem, if Small Problem 19 4% 5%
any, was it to get a personal Big Problem 3 1% 1%
provider for your child that you Total Who Rated Level of Problem 352 79% 100%
are happy with? My child didn't get a new personal provider 95 21%
Total # Respondents 447 100%
Missing (% of 454 Surveys) 7 2%
3 Has there been a time when you Yes (explain) 12 3%
felt your child received fewer No 409 91%
services than other patients? Don't Know 27 6%
Total # Respondents 448 100%
Missing (% of 454 Surveys) 6 1%
Explain quot;Yesquot; Answer Providers spend less time with patient 2 17%
Longer wait time in office 2 17%
Dental-cannot find/not able to get same service 6 50%
Service not covered 2 17%
Total # Respondents 12 100%
Skip per instructions (% of 454 Surveys) 442 97%
4 Use any number from 0 to 10 10 - Best Personal Provider Possible 198 45% 48%
where 0 is the worst provider 9 73 17% 18%
possible, and 10 is the best 8 70 16% 17%
provider possible. How would 7 45 10% 11%
you rate your child’s provider 7 or higher Subtotal 386 88% 94%
now? 6 9 2% 2%
5 11 2% 3%
4 0 0% 0%
3 1 < 1% < 1%
2 2 < 1% < 1%
1 1 < 1% < 1%
0 - Worst Personal Provider Possible 0 0% 0%
Total Who Rated Provider 410 93% 100%
My child doesn't have a personal provider 31 7%
Total # Respondents 441 100%
Missing (% of 454 Surveys) 13 3%
5 In the last 6 months, did you Yes 270 60%
make any appointments with a No 170 38%
doctor or other health care Don't Know 9 2%
provider for regular or routine Total # Respondents 449 100%
health care for your child? Missing (% of 454 Surveys) 5 1%
6 In the last 6 months, how often Always 161 60% 61%
did you get an appointment for Usually 77 29% 29%
your child for regular or routine Sometimes 25 9% 10%
health care as soon as you Never 0 0% 0%
wanted? Total Who Said How Often 263 98% 100%
My child didn't need an appointment for regular or
routine care in the last 6 months 6 2%
Total # Respondents 269 100%
Skip per instructions (% of 454 Surveys) 179 39%
Missing (% of 454 Surveys) 6 1%
Report Printed: 4/14/2004 A1 of A8 DPHHS-MAX0403926
2. 7 In the last 6 months, how many Same day 71 27% 28%
days did you usually have to 1 day 55 21% 21%
wait between making an 2-3 days 58 22% 23%
appointment for your child for 4-7 days 42 16% 16%
regular or routine care and 8-14 days 18 7% 7%
actually seeing a provider? 15-30 days 8 3% 3%
31 days or longer 5 2% 2%
Total Who Said How Long 257 97% 100%
My child didn't need an appointment for regular or
routine care in the last 6 months 7 3%
Total # Respondents 264 100%
Skip per instructions (% of 454 Surveys) 179 39%
Missing (% of 454 Surveys) 11 2%
8 In the last 6 months, did your Yes 186 42%
child have an illness or injury No 257 57%
that needed care right away Don't Know 6 1%
from a provider’s office, clinic, Total # Respondents 449 100%
or emergency room? Missing (% of 454 Surveys) 5 1%
9 In the last 6 months, when your Always 143 78% 78%
child needed care right away Usually 35 19% 19%
for an illness or injury, how Sometimes 4 2% 2%
often did he or she get care as Never 1 1% 1%
soon as you wanted? Total Who Said How Often 183 100% 100%
My child didn't need care right away for an illness or
injury in the last 6 months 0 0%
Total # Respondents 183 100%
Skip per instructions (% of 454 Surveys) 263 58%
Missing (% of 454 Surveys) 8 2%
10 In the last 6 months, how long Same day 137 75% 75%
did you usually have to wait 1 day 36 20% 20%
between trying to get care for 2 days 5 3% 3%
your child and actually seeing a 3 days 4 2% 2%
provider for an illness or injury? 4-7 days 1 1% 1%
8-14 days 0 0% 0%
15 days or longer 0 0% 0%
Total Who Said How Long 183 100% 100%
My child didn't need care right away for an illness or
injury in the last 6 months 0 0%
Total # Respondents 183 100%
Skip per instructions (% of 454 Surveys) 263 58%
Missing (% of 454 Surveys) 8 2%
11 In the last 6 months, how many 1 53 12%
times did you go to an 2 13 3%
emergency room to get care for 3 2 < 1%
your child? (NOTE: the choice 4 0 0%
was None or fill in the blank) 5 1 < 1%
Total Who Went to ER 69 15%
None 377 85%
Total # Respondents 446 100%
Missing (% of 454 Surveys) 8 2%
12 In the last 6 months, did you Yes 221 49%
call a provider’s office or clinic No 225 50%
during regular office hours to Don't Know 5 1%
get help or advice for your Total # Respondents 451 100%
child? Missing (% of 454 Surveys) 3 1%
Report Printed: 4/14/2004 A2 of A8 DPHHS-MAX0403926
3. 13 In the last 6 months, when you Always 168 78% 78%
called during regular office Usually 40 19% 19%
hours, how often did you get Sometimes 7 3% 3%
the help or advice your child Never 1 < 1% 0%
needed? Total Who Said How Often 216 100% 100%
I didn't call for help or advice during regular office hours
in the last 6 months 0 0%
Total # Respondents 216 100%
Skip per instructions (% of 454 Surveys) 230 51%
Missing (% of 454 Surveys) 8 2%
14 In the last 6 months (not 1 121 27%
counting times your child went 2 104 23%
to an emergency room), how 3 69 15%
many times did your child go to 4 24 5%
a provider’s office or clinic to 5-9 20 4%
get care? 10 or more 3 1%
Total Who Got Care 341 76%
None - did not get care 108 24%
Total # Respondents 449 100%
Missing (% of 454 Surveys) 5 1%
15 In the last 6 months, once your 15 minutes or less 185 55%
child arrived at his or her 16-30 minutes 113 34%
provider’s office or clinic, how 31-60 minutes 35 10%
long did your child have to wait More than an hour 2 1%
before seeing the person your Total # Respondents 335 100%
child went to see? Skip per instructions (% of 454 Surveys) 108 24%
Missing (% of 454 Surveys) 6 1%
16 In the last 6 months, how often Always 240 72% 72%
were office staff at your child’s Usually 86 26% 26%
provider’s office or clinic as Sometimes 13 4% 4%
helpful as you thought they Never 2 1% 1%
should be? Total Who Said How Often 334 100% 100%
My child had no visits in the last 6 months 0 0%
Total # Respondents 334 100%
Skip per instructions (% of 454 Surveys) 108 24%
Missing (% of 454 Surveys) 12 3%
17 Is your child old enough to talk Yes 341 76%
with providers about his or her No 104 23%
health care? Don't Know 5 1%
Total # Respondents 450 100%
Missing (% of 454 Surveys) 4 1%
18 In the last 6 months, how often Always 177 54% 63%
did doctors or other health care Usually 89 27% 32%
providers explain things in a Sometimes 10 3% 4%
way your child could Never 5 2% 2%
understand? Total Who Said How Often 281 86% 100%
My child had no visits in the last 6 months 47 14%
Total # Respondents 328 100%
Skip per instructions (% of 454 Surveys) 109 24%
Missing (% of 454 Surveys) 17 4%
19 If your child’s personal Yes 177 44%
provider couldn’t see him or No 103 26%
her, did the provider’s office Don't Know 120 30%
help you find another place to Total # Respondents 400 100%
take your child? Missing (% of 454 Surveys) 54 12%
Report Printed: 4/14/2004 A3 of A8 DPHHS-MAX0403926
4. 20 If yes, where did they refer Another doctor or nurse 145 90%
your child? (NOTE: Public Health Clinic/Community Health Center 12 7%
respondents were asked to Emergency room at the hospital 9 6%
mark one or more so Walk-in or urgent care clinic 5 3%
percentages may add up to Other source of care 1 1%
more than 100%) Total # Respondents (reporting 172 referral types) 162 100%
Skip per instructions (% of 454 Surveys) 223 49%
Missing (% of 454 Surveys) 69 15%
21 Is your child 2 years old or Yes 72 16%
younger? No 369 84%
Don't Know 0 0%
Total # Respondents 441 100%
Missing (% of 454 Surveys) 13 3%
22 After your child was born, did Yes 33 50%
you get any reminders to bring No 28 42%
him or her in for a check up to Don't Know 5 8%
see how he or she was doing or Total # Respondents 66 100%
for shots? Skip per instructions (% of 454 Surveys) 369 81%
Missing (% of 454 Surveys) 19 4%
23 Since your child was born, has Yes 58 87%
he or she gone to a provider for No 9 13%
a check up to see how he or she Don't Know 0 0%
was doing or for shots? Total # Respondents 67 100%
Skip per instructions (% of 454 Surveys) 369 81%
Missing (% of 454 Surveys) 18 4%
24 Did you get an appointment for Yes 56 97%
your child’s first visit to a No 2 3%
provider for a check up or shots Don't Know 0 0%
as soon as you wanted? Total # Respondents 58 100%
Skip per instructions (% of 454 Surveys) 378 83%
Missing (% of 454 Surveys) 18 4%
25 How many days did you have to Within 24 Hours 10 19% 19%
wait between making an 2-10 days 36 69% 69%
appointment for your child for a 11-21 days 4 8% 8%
check up or for shots and 22-45 days 1 2% 2%
actually seeing the provider? More than 45 days 1 2% 2%
Total Who Said How Long 52 100% 100%
My child did not see a provider for a check up or shots 0 0%
Total # Respondents 52 100%
Skip per instructions (% of 454 Surveys) 380 84%
Missing (% of 454 Surveys) 22 5%
26 In the last 6 months, did your No 274 61%
child have any visits for Yes 172 38%
preventive care (such as shots Don't Know 2 < 1%
or Well Child Check Ups)? Total # Respondents 448 100%
Missing (% of 454 Surveys) 6 1%
27 If No, why not? (NOTE: My child did not need any preventive care 250 95%
respondents were asked to I was unable to schedule preventive care with child’s
mark one or more). provider 0 0%
I did not have any way to take my child to an
appointment 0 0%
I did not have time to take my child to an appointment 4 2%
Other 11 4%
Total # Respondents (reporting 265 reasons) 264 100%
Skip per instructions (% of 454 Surveys) 174 38%
Missing (% of 454 Surveys) 18 4%
Report Printed: 4/14/2004 A4 of A8 DPHHS-MAX0403926
5. 28 In the last 6 months, did your Yes 256 57%
child get care from a dentist’s No 186 42%
office or dental clinic? Don't Know 6 1%
Total # Respondents 448 100%
Missing (% of 454 Surveys) 6 1%
29 In the last 6 months, how many 1 155 61% 61%
times did your child go to a 2 67 26% 26%
dentist’s office or dental clinic? 3 24 9% 9%
4 5 2% 2%
5-9 2 1% 1%
10 or more 0 0% 0%
Total Reporting Visits 253 100% 100%
None 1 < 1%
Total # Respondents 254 100%
Skip per instructions (% of 454 Surveys) 192 42%
Missing (% of 454 Surveys) 8 2%
30 Use any number from 0 to 10 10 - Best dental care possible 125 49% 49%
where 0 is the worst dental care 9 43 17% 17%
possible, and 10 is the best 8 34 13% 13%
dental care possible. How 7 22 9% 9%
would you rate your child’s 6 6 2% 2%
dental care? 5 12 5% 5%
4 6 2% 2%
3 0 0% 0%
2 1 < 1% < 1%
1 2 1% 1%
0 - Worst dental care possible 2 1% 1%
Total Who Rated Care 253 100% 100%
My child didn't have any dental care 0 0%
Total # Respondents 253 100%
Skip per instructions (% of 454 Surveys) 192 42%
Missing (% of 454 Surveys) 9 2%
31 How many months or years in a Less than 6 months 9 2%
row has your child been 6 up to 12 months 88 20%
enrolled in CHIP? 12 up to 24 months 130 29%
Longer than 24 months 222 49%
Total # Respondents 449 100%
Missing (% of 454 Surveys) 5 1%
32 How well do you feel you 10 - Understand completely 124 28%
understand CHIP? Use any 9 107 24%
number from 0 to 10 where 0 is 8 102 23%
not at all, and 10 is completely. 7 65 15%
6 26 6%
5 17 4%
4 2 < 1%
3 2 < 1%
2 2 < 1%
1 0 0%
0 - Do not understand at all 1 < 1%
Total # Respondents 448 100%
Missing (% of 454 Surveys) 6 1%
33 Have you or your child used Yes 205 46%
BCBS/BlueCHIP Customer No 212 47%
Service? Don't Know 30 7%
Total # Respondents 447 100%
Missing (% of 454 Surveys) 7 2%
Report Printed: 4/14/2004 A5 of A8 DPHHS-MAX0403926
6. 33b How useful did you find it? Very Useful 166 81% 81%
Somewhat Useful 34 17% 17%
Not Useful 4 2% 2%
Total Who Rated Usefulness 204 100% 100%
We didn't use the Customer Service 0 0%
Total # Respondents 204 100%
Skip per instructions (% of 454 Surveys) 242 53%
Missing (% of 454 Surveys) 8 2%
34 Have you or your child used the Yes 348 78%
BlueCHIP Enrollee Handbook? No 91 20%
Don't Know 7 2%
Total # Respondents 446 100%
Missing (% of 454 Surveys) 8 2%
34b How useful did you find it? Very Useful 230 67% 67%
Somewhat Useful 111 32% 32%
Not Useful 2 1% 1%
Total Who Rated Usefulness 343 100% 100%
We didn't use the Enrollee Handbook 0 0%
Total # Respondents 343 100%
Skip per instructions (% of 454 Surveys) 98 22%
Missing (% of 454 Surveys) 13 3%
35 Have your or your child used Yes 274 62%
the “Dental Care and No 162 36%
Eyeglasses for Children in Don't Know 9 2%
CHIP” booklet? Total # Respondents 445 100%
Missing (% of 454 Surveys) 9 2%
35b How useful did you find it? Very Useful 194 71% 71%
Somewhat Useful 79 29% 29%
Not Useful 1 < 1% < 1%
Total Who Rated Usefulness 274 100% 100%
We didn't use the booklet 0 0%
Total # Respondents 274 100%
Skip per instructions (% of 454 Surveys) 171 38%
Missing (% of 454 Surveys) 9 2%
36 Have you received an Yes 333 76%
Explanation of Benefits (EOB) No 65 15%
that explained what CHIP paid Don't Know 38 9%
for your child's eyeglasses and Total # Respondents 436 100%
dental services? Missing (% of 454 Surveys) 18 4%
36b How useful did you find it? Very Useful 244 75% 75%
Somewhat Useful 79 24% 24%
Not Useful 1 < 1% < 1%
Total Who Rated Usefulness 324 100% 100%
We didn't receive an EOB 1 < 1%
Total # Respondents 325 100%
Skip per instructions (% of 454 Surveys) 103 23%
Missing (% of 454 Surveys) 26 6%
37 How far do you travel ONE 0 to 30 miles 358 80%
DIRECTION to see your 31 to 60 miles 62 14%
child’s primary provider? 61 to 90 miles 17 4%
91 to 150 miles 9 2%
150 miles or more 1 < 1%
Total # Respondents 447 100%
Missing (% of 454 Surveys) 7 2%
Report Printed: 4/14/2004 A6 of A8 DPHHS-MAX0403926
7. 38 Use any number from 0 to 10 10 - Completely Satisfied 326 73% 73%
where 0 is the least satisfied 9 66 15% 15%
possible, and 10 is the most 8 33 7% 7%
satisfied possible. How 7 15 3% 3%
satisfied are you with the CHIP 6 2 < 1% < 1%
Program? 5 1 < 1% < 1%
4 0 0% 0%
3 3 1% 1%
2 1 < 1% < 1%
1 0 0% 0%
0 - Completely Unsatisfied 2 < 1% < 1%
Total # Respondents 449 100% 100%
Missing (% of 454 Surveys) 5 1%
39 In general, how would you rate Excellent 184 41%
your child’s overall health now? Very Good 198 44%
Good 56 12%
Fair 13 3%
Poor 0 0%
Total # Respondents 451 100%
Missing (% of 454 Surveys) 3 1%
40 What is your child’s ethnicity? Hispanic or Latino 19 4%
Not Hispanic or Latino 416 96%
Total # Respondents 435 100%
Missing (% of 454 Surveys) 19 4%
What is your child’s race White 427 96%
(NOTE: the respondents were Black or African-American 6 1%
asked to mark one or more so Asian 2 < 1%
percentages may add up to Native Hawaiian or other Pacific Islander 1 < 1%
more than 100%) American Indian or Alaskan Native 24 5%
Other unspecified race 4 1%
Total # Respondents (indicating 464 racial groups) 446 100%
Missing (% of 454 Surveys) 8 2%
Breakdown by both Hispanic or Latino who indicated they are white 17 89%
Hispanic or Latino who did not indicate any other
racial/ethnic group 2 11%
Total Hispanic or Latino 19 100%
Did not indicate Hispanic or Latino or any other
racial/ethnic group 6 1%
41 What is your child’s age now? Up to 2 years 56 13%
3 to 6 years 80 18%
7 to 11 years 138 31%
12 to 18 years 172 39%
Total # Respondents 446 100%
Missing (% of 454 Surveys) 8 2%
42 Is your child male or female? Male 225 51%
Female 219 49%
Total # Respondents 444 100%
Missing (% of 454 Surveys) 10 2%
43 Are you male or female? Male 45 10%
Female 405 90%
Total # Respondents 450 100%
Missing or Invalid (% of 454 Surveys) 4 1%
Report Printed: 4/14/2004 A7 of A8 DPHHS-MAX0403926
8. 44 What is your age now? Younger than 18 1 < 1%
18 to 24 13 3%
25 to 34 118 26%
35 to 44 221 49%
45 to 54 83 18%
55 to 64 11 2%
65 to 74 4 1%
75 or older 0 0%
Total # Respondents 451 100%
Missing (% of 454 Surveys) 3 1%
45 What is the highest grade or 8th grade or less 8 2%
level of school that you have Some high school but not graduate 37 8%
completed? High School graduate or GED 155 35%
Some college or 2-year degree 184 41%
4-year college graduate 50 11%
More than 4-year college degree 14 3%
Total # Respondents 448 100%
Missing (% of 454 Surveys) 6 1%
46 How are you related to the Mother or father 441 98%
child? Grandparent 5 1%
Aunt or uncle 0 0%
Older brother or sister 0 0%
Other relative 0 0%
Legal guardian 3 1%
Total # Respondents 449 100%
Missing or Invalid (% of 454 Surveys) 5 1%
Report Printed: 4/14/2004 A8 of A8 DPHHS-MAX0403926