2024 State of Marketing Report – by HubspotMarius Sescu
https://www.hubspot.com/state-of-marketing
· Scaling relationships and proving ROI
· Social media is the place for search, sales, and service
· Authentic influencer partnerships fuel brand growth
· The strongest connections happen via call, click, chat, and camera.
· Time saved with AI leads to more creative work
· Seeking: A single source of truth
· TLDR; Get on social, try AI, and align your systems.
· More human marketing, powered by robots
ChatGPT is a revolutionary addition to the world since its introduction in 2022. A big shift in the sector of information gathering and processing happened because of this chatbot. What is the story of ChatGPT? How is the bot responding to prompts and generating contents? Swipe through these slides prepared by Expeed Software, a web development company regarding the development and technical intricacies of ChatGPT!
Product Design Trends in 2024 | Teenage EngineeringsPixeldarts
The realm of product design is a constantly changing environment where technology and style intersect. Every year introduces fresh challenges and exciting trends that mold the future of this captivating art form. In this piece, we delve into the significant trends set to influence the look and functionality of product design in the year 2024.
How Race, Age and Gender Shape Attitudes Towards Mental HealthThinkNow
Mental health has been in the news quite a bit lately. Dozens of U.S. states are currently suing Meta for contributing to the youth mental health crisis by inserting addictive features into their products, while the U.S. Surgeon General is touring the nation to bring awareness to the growing epidemic of loneliness and isolation. The country has endured periods of low national morale, such as in the 1970s when high inflation and the energy crisis worsened public sentiment following the Vietnam War. The current mood, however, feels different. Gallup recently reported that national mental health is at an all-time low, with few bright spots to lift spirits.
To better understand how Americans are feeling and their attitudes towards mental health in general, ThinkNow conducted a nationally representative quantitative survey of 1,500 respondents and found some interesting differences among ethnic, age and gender groups.
Technology
For example, 52% agree that technology and social media have a negative impact on mental health, but when broken out by race, 61% of Whites felt technology had a negative effect, and only 48% of Hispanics thought it did.
While technology has helped us keep in touch with friends and family in faraway places, it appears to have degraded our ability to connect in person. Staying connected online is a double-edged sword since the same news feed that brings us pictures of the grandkids and fluffy kittens also feeds us news about the wars in Israel and Ukraine, the dysfunction in Washington, the latest mass shooting and the climate crisis.
Hispanics may have a built-in defense against the isolation technology breeds, owing to their large, multigenerational households, strong social support systems, and tendency to use social media to stay connected with relatives abroad.
Age and Gender
When asked how individuals rate their mental health, men rate it higher than women by 11 percentage points, and Baby Boomers rank it highest at 83%, saying it’s good or excellent vs. 57% of Gen Z saying the same.
Gen Z spends the most amount of time on social media, so the notion that social media negatively affects mental health appears to be correlated. Unfortunately, Gen Z is also the generation that’s least comfortable discussing mental health concerns with healthcare professionals. Only 40% of them state they’re comfortable discussing their issues with a professional compared to 60% of Millennials and 65% of Boomers.
Race Affects Attitudes
As seen in previous research conducted by ThinkNow, Asian Americans lag other groups when it comes to awareness of mental health issues. Twenty-four percent of Asian Americans believe that having a mental health issue is a sign of weakness compared to the 16% average for all groups. Asians are also considerably less likely to be aware of mental health services in their communities (42% vs. 55%) and most likely to seek out information on social media (51% vs. 35%).
AI Trends in Creative Operations 2024 by Artwork Flow.pdfmarketingartwork
This article is all about what AI trends will emerge in the field of creative operations in 2024. All the marketers and brand builders should be aware of these trends for their further use and save themselves some time!
A report by thenetworkone and Kurio.
The contributing experts and agencies are (in an alphabetical order): Sylwia Rytel, Social Media Supervisor, 180heartbeats + JUNG v MATT (PL), Sharlene Jenner, Vice President - Director of Engagement Strategy, Abelson Taylor (USA), Alex Casanovas, Digital Director, Atrevia (ES), Dora Beilin, Senior Social Strategist, Barrett Hoffher (USA), Min Seo, Campaign Director, Brand New Agency (KR), Deshé M. Gully, Associate Strategist, Day One Agency (USA), Francesca Trevisan, Strategist, Different (IT), Trevor Crossman, CX and Digital Transformation Director; Olivia Hussey, Strategic Planner; Simi Srinarula, Social Media Manager, The Hallway (AUS), James Hebbert, Managing Director, Hylink (CN / UK), Mundy Álvarez, Planning Director; Pedro Rojas, Social Media Manager; Pancho González, CCO, Inbrax (CH), Oana Oprea, Head of Digital Planning, Jam Session Agency (RO), Amy Bottrill, Social Account Director, Launch (UK), Gaby Arriaga, Founder, Leonardo1452 (MX), Shantesh S Row, Creative Director, Liwa (UAE), Rajesh Mehta, Chief Strategy Officer; Dhruv Gaur, Digital Planning Lead; Leonie Mergulhao, Account Supervisor - Social Media & PR, Medulla (IN), Aurelija Plioplytė, Head of Digital & Social, Not Perfect (LI), Daiana Khaidargaliyeva, Account Manager, Osaka Labs (UK / USA), Stefanie Söhnchen, Vice President Digital, PIABO Communications (DE), Elisabeth Winiartati, Managing Consultant, Head of Global Integrated Communications; Lydia Aprina, Account Manager, Integrated Marketing and Communications; Nita Prabowo, Account Manager, Integrated Marketing and Communications; Okhi, Web Developer, PNTR Group (ID), Kei Obusan, Insights Director; Daffi Ranandi, Insights Manager, Radarr (SG), Gautam Reghunath, Co-founder & CEO, Talented (IN), Donagh Humphreys, Head of Social and Digital Innovation, THINKHOUSE (IRE), Sarah Yim, Strategy Director, Zulu Alpha Kilo (CA).
Trends In Paid Search: Navigating The Digital Landscape In 2024Search Engine Journal
The search marketing landscape is evolving rapidly with new technologies, and professionals, like you, rely on innovative paid search strategies to meet changing demands.
It’s important that you’re ready to implement new strategies in 2024.
Check this out and learn the top trends in paid search advertising that are expected to gain traction, so you can drive higher ROI more efficiently in 2024.
You’ll learn:
- The latest trends in AI and automation, and what this means for an evolving paid search ecosystem.
- New developments in privacy and data regulation.
- Emerging ad formats that are expected to make an impact next year.
Watch Sreekant Lanka from iQuanti and Irina Klein from OneMain Financial as they dive into the future of paid search and explore the trends, strategies, and technologies that will shape the search marketing landscape.
If you’re looking to assess your paid search strategy and design an industry-aligned plan for 2024, then this webinar is for you.
5 Public speaking tips from TED - Visualized summarySpeakerHub
From their humble beginnings in 1984, TED has grown into the world’s most powerful amplifier for speakers and thought-leaders to share their ideas. They have over 2,400 filmed talks (not including the 30,000+ TEDx videos) freely available online, and have hosted over 17,500 events around the world.
With over one billion views in a year, it’s no wonder that so many speakers are looking to TED for ideas on how to share their message more effectively.
The article “5 Public-Speaking Tips TED Gives Its Speakers”, by Carmine Gallo for Forbes, gives speakers five practical ways to connect with their audience, and effectively share their ideas on stage.
Whether you are gearing up to get on a TED stage yourself, or just want to master the skills that so many of their speakers possess, these tips and quotes from Chris Anderson, the TED Talks Curator, will encourage you to make the most impactful impression on your audience.
See the full article and more summaries like this on SpeakerHub here: https://speakerhub.com/blog/5-presentation-tips-ted-gives-its-speakers
See the original article on Forbes here:
http://www.forbes.com/forbes/welcome/?toURL=http://www.forbes.com/sites/carminegallo/2016/05/06/5-public-speaking-tips-ted-gives-its-speakers/&refURL=&referrer=#5c07a8221d9b
ChatGPT and the Future of Work - Clark Boyd Clark Boyd
Everyone is in agreement that ChatGPT (and other generative AI tools) will shape the future of work. Yet there is little consensus on exactly how, when, and to what extent this technology will change our world.
Businesses that extract maximum value from ChatGPT will use it as a collaborative tool for everything from brainstorming to technical maintenance.
For individuals, now is the time to pinpoint the skills the future professional will need to thrive in the AI age.
Check out this presentation to understand what ChatGPT is, how it will shape the future of work, and how you can prepare to take advantage.
A brief introduction to DataScience with explaining of the concepts, algorithms, machine learning, supervised and unsupervised learning, clustering, statistics, data preprocessing, real-world applications etc.
It's part of a Data Science Corner Campaign where I will be discussing the fundamentals of DataScience, AIML, Statistics etc.
Time Management & Productivity - Best PracticesVit Horky
Here's my presentation on by proven best practices how to manage your work time effectively and how to improve your productivity. It includes practical tips and how to use tools such as Slack, Google Apps, Hubspot, Google Calendar, Gmail and others.
The six step guide to practical project managementMindGenius
The six step guide to practical project management
If you think managing projects is too difficult, think again.
We’ve stripped back project management processes to the
basics – to make it quicker and easier, without sacrificing
the vital ingredients for success.
“If you’re looking for some real-world guidance, then The Six Step Guide to Practical Project Management will help.”
Dr Andrew Makar, Tactical Project Management
Unlocking the Power of ChatGPT and AI in Testing - A Real-World Look, present...Applitools
During this webinar, Anand Bagmar demonstrates how AI tools such as ChatGPT can be applied to various stages of the software development life cycle (SDLC) using an eCommerce application case study. Find the on-demand recording and more info at https://applitools.info/b59
Key takeaways:
• Learn how to use ChatGPT to add AI power to your testing and test automation
• Understand the limitations of the technology and where human expertise is crucial
• Gain insight into different AI-based tools
• Adopt AI-based tools to stay relevant and optimize work for developers and testers
* ChatGPT and OpenAI belong to OpenAI, L.L.C.
More than Just Lines on a Map: Best Practices for U.S Bike Routes
This session highlights best practices and lessons learned for U.S. Bike Route System designation, as well as how and why these routes should be integrated into bicycle planning at the local and regional level.
Presenters:
Presenter: Kevin Luecke Toole Design Group
Co-Presenter: Virginia Sullivan Adventure Cycling Association
Ride the Storm: Navigating Through Unstable Periods / Katerina Rudko (Belka G...DevGAMM Conference
Has your project been caught in a storm of deadlines, clashing requirements, and the need to change course halfway through? If yes, then check out how the administration team navigated through all of this, relocating 160 people from 3 countries and opening 2 offices during the most turbulent time in the last 20 years. Belka Games’ Chief Administrative Officer, Katerina Rudko, will share universal approaches and life hacks that can help your project survive unstable periods when there seem to be too many tasks and a lack of time and people.
This presentation was designed to provide strategic recommendations for a brand in decline. The deck also incorporates a situational assessment, including a brand identity, positioning, architecture, and portfolio strategy for the Brand.
Presentation originally created for NYU Stern's Brand Strategy course. Design by Erica Santiago & Chris Alexander.
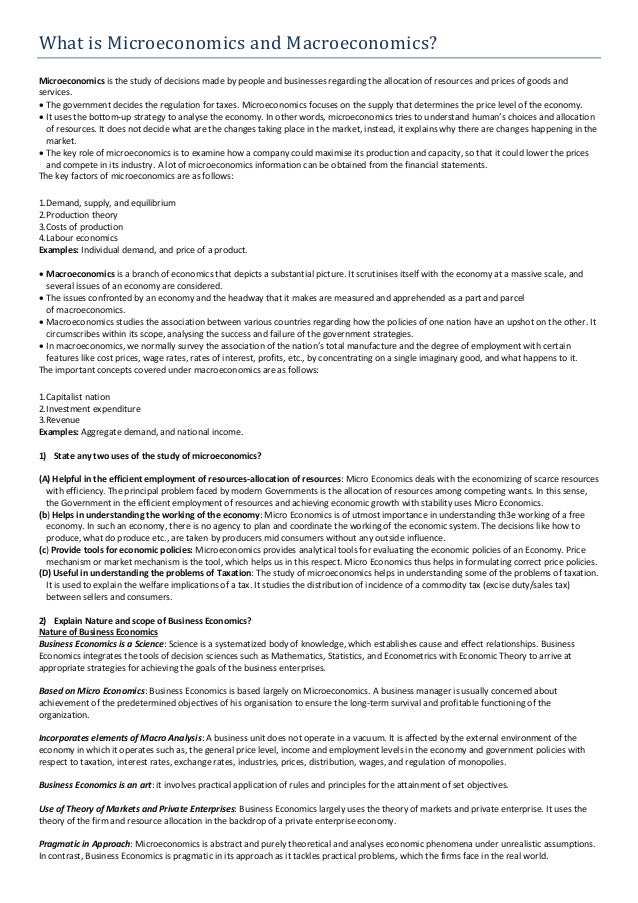
1. What is Microeconomics and Macroeconomics?
Microeconomics is the study of decisions made by people and businesses regarding the allocation of resources and prices of goods and
services.
The government decides the regulation for taxes. Microeconomics focuses on the supply that determines the price level of the economy.
It uses the bottom-up strategy to analyse the economy. In other words, microeconomics tries to understand human’s choices and allocation
of resources. It does not decide what are the changes taking place in the market, instead, it explains why there are changes happening in the
market.
The key role of microeconomics is to examine how a company could maximise its production and capacity, so that it could lower the prices
and compete in its industry. A lot of microeconomics information can be obtained from the financial statements.
The key factors of microeconomics are as follows:
1.Demand, supply, and equilibrium
2.Production theory
3.Costs of production
4.Labour economics
Examples: Individual demand, and price of a product.
Macroeconomics is a branch of economics that depicts a substantial picture. It scrutinises itself with the economy at a massive scale, and
several issues of an economy are considered.
The issues confronted by an economy and the headway that it makes are measured and apprehended as a part and parcel
of macroeconomics.
Macroeconomics studies the association between various countries regarding how the policies of one nation have an upshot on the other. It
circumscribes within its scope, analysing the success and failure of the government strategies.
In macroeconomics, we normally survey the association of the nation’s total manufacture and the degree of employment with certain
features like cost prices, wage rates, rates of interest, profits, etc., by concentrating on a single imaginary good, and what happens to it.
The important concepts covered under macroeconomics are as follows:
1.Capitalist nation
2.Investment expenditure
3.Revenue
Examples: Aggregate demand, and national income.
1) State any two uses of the study of microeconomics?
(A) Helpful in the efficient employment of resources-allocation of resources: Micro Economics deals with the economizing of scarce resources
with efficiency. The principal problem faced by modern Governments is the allocation of resources among competing wants. In this sense,
the Government in the efficient employment of resources and achieving economic growth with stability uses Micro Economics.
(b) Helps in understanding the working of the economy: Micro Economics is of utmost importance in understanding th3e working of a free
economy. In such an economy, there is no agency to plan and coordinate the working of the economic system. The decisions like how to
produce, what do produce etc., are taken by producers mid consumers without any outside influence.
(c) Provide tools for economic policies: Microeconomics provides analytical tools for evaluating the economic policies of an Economy. Price
mechanism or market mechanism is the tool, which helps us in this respect. Micro Economics thus helps in formulating correct price policies.
(D) Useful in understanding the problems of Taxation: The study of microeconomics helps in understanding some of the problems of taxation.
It is used to explain the welfare implications of a tax. It studies the distribution of incidence of a commodity tax (excise duty/sales tax)
between sellers and consumers.
2) Explain Nature and scope of Business Economics?
Nature of Business Economics
Business Economics is a Science: Science is a systematized body of knowledge, which establishes cause and effect relationships. Business
Economics integrates the tools of decision sciences such as Mathematics, Statistics, and Econometrics with Economic Theory to arrive at
appropriate strategies for achieving the goals of the business enterprises.
Based on Micro Economics: Business Economics is based largely on Microeconomics. A business manager is usually concerned about
achievement of the predetermined objectives of his organisation to ensure the long-term survival and profitable functioning of the
organization.
Incorporates elements of Macro Analysis: A business unit does not operate in a vacuum. It is affected by the external environment of the
economy in which it operates such as, the general price level, income and employment levels in the economy and government policies with
respect to taxation, interest rates, exchange rates, industries, prices, distribution, wages, and regulation of monopolies.
Business Economics is an art: it involves practical application of rules and principles for the attainment of set objectives.
Use of Theory of Markets and Private Enterprises: Business Economics largely uses the theory of markets and private enterprise. It uses the
theory of the firm and resource allocation in the backdrop of a private enterprise economy.
Pragmatic in Approach: Microeconomics is abstract and purely theoretical and analyses economic phenomena under unrealistic assumptions.
In contrast, Business Economics is pragmatic in its approach as it tackles practical problems, which the firms face in the real world.
2. Interdisciplinary in nature: Business Economics is interdisciplinary in nature as it incorporates tools from other disciplines such as
Mathematics, Operations Research, Management Theory, Accounting, and marketing, Finance, Statistics, and Econometrics.
Normative in Nature: Economic theory has developed along two lines – positive and normative. A positive or pure science analyses cause and
effect relationship between variables in an objective and scientific manner, but it does not involve any value judgement. As against this, a
normative science involves value judgement... Welfare considerations are embedded in normative science.
Scope of Business Economics
The scope of Business Economics may be discussed under the following two heads:-
1. Microeconomics applied to operational or internal Issues
Demand Analysis and Forecasting: Demand Analysis pertains to the behaviour of consumers in the market. It studies the nature of consumer
preferences and the effect of changes in the determinants of demand such as, price of the commodity, consumers’ income, prices of related
commodities, consumer tastes, etc.
Demand Forecasting is the technique of predicting future demand for goods and services based on the past behaviour of factors, which affect
demand. Accurate forecasting is essential for a firm to enable it to produce the required quantities at the right time and to arrange, well in
advance, for the various factors of production viz., raw materials, labour, machines, equipment, buildings etc.
Production and Cost Analysis: Production theory explains the relationship between inputs and output. A business economist has to decide on
the optimum size of output, given the objectives of the firm... Production analysis enables the firm to decide on the choice of appropriate
technology and selection of least - cost input-mix to achieve technically efficient way of producing output, given the inputs.
Cost analysis enables the firm to recognize the behaviour of costs when variables such as output, time, and size of plant change. The firm will
be able to identify ways to maximize profits by producing the desired level of output at the minimum possible cost.
Inventory Management: Inventory management theories pertain to rules that firms can use to minimize the costs associated with maintaining
inventory in the form of ‘work-in-process,’ ‘raw materials’, and ‘finished goods’. Inventory policies affect the profitability of the firm.
Market Structure and Pricing Policies: Analysis of the structure of the market provides information about the nature and extent of
competition, which the firms have to face. Price theory explains how prices are determined under different kinds of market conditions and
assists the firm in framing suitable price policies.
Resource Allocation: Business Economics, with the help of advanced tools such as linear programming, enables the firm to arrive at the best
course of action for optimum utilization of available resources.
Theory of Capital and Investment Decisions: For maximizing its profits, the firm has to carefully evaluate its investment decisions and carry out
a sensible policy of capital allocation. Theories related to capital and investment provides scientific criteria for choice of investment projects
and in assessment of the efficiency of capital. Business Economics supports decision making on allocation of scarce capital among competing
uses of funds.
Profit Analysis: Profits are, most often, uncertain due to changing prices and market conditions. Profit theory guides the firm in the
measurement and management of profit under conditions of uncertainty. Profit analysis is also immensely useful in future profit planning.
Risk and Uncertainty Analysis: Business firms generally operate under conditions of risk and uncertainty. Analysis of risks and uncertainties
helps the business firm in arriving efficient decisions and in formulating plans on the basis of past data, current information and future
prediction.
.
2. Macroeconomics applied to environmental or external issues
Environmental factors have significant influence upon the functioning and performance of business. The major macro-economic factors are
related to-
othe type of economic system
ostage of business cycle
oThe general trends in national income, employment, prices, saving and investment.
ogovernment’s economic policies like industrial policy, competition policy, monetary and fiscal policy, price policy, foreign trade policy and
globalization policies
oworking of financial sector and capital market
oSocio-economic organisations like trade unions, producer and consumer unions, and cooperatives.
oSocial and political environment.
4) Distinguish between positive and normative economics
Positive Economics
Positive economics is a stream of economics that focuses on the description, quantification, and explanation of economic developments,
expectations, and associated phenomena.
It relies on objective data analysis, relevant facts, and associated figures. It attempts to establish any cause-and-effect relationships or
behavioural associations, which can help, ascertain and test the development of economics theories.
Positive economics is objective and fact-based where the statements are precise, descriptive, and clearly measurable. These statements can
be measured against tangible evidence or historical instances. There are no instances of approval-disapproval in positive economics.
3. Here is an example of a positive economic statement: "Government-provided healthcare increases public expenditures." This statement is
fact-based and has no value judgment attached to it. Its validity can be proven (or disproven) by studying healthcare spending where
governments provide healthcare.
Normative Economics
Normative economics focuses on the ideological, opinion-oriented, prescriptive, value judgments, and "what should be" statements aimed
toward economic development, investment projects, and scenarios.
Its goal is to summarize people's desirability (or the lack thereof) to various economic developments, situations, and programs by asking or
quoting what should happen or what ought to be.
Normative economics is subjective and value-based, originating from personal perspectives, feelings, or opinions involved in the decision-
making process. Normative economics statements are rigid and prescriptive in nature. They often sound political or authoritarian, which is
why this economic branch is also called "what should be" or "what ought to be" economics.
An example of a normative economic statement is: "The government should provide basic healthcare to all citizens." As you can deduce from
this statement, it is value-based, rooted in personal perspective, and satisfies the requirement of what "should" be.
5) Explain various types of price elasticity of demand with the help of diagrams.
1. Perfectly Elastic Demand:
When a small change in price of a product causes a major change in its demand, it is said to be perfectly elastic demand. In perfectly elastic
demand, a small rise in price results in fall in demand to zero, while a small fall in price causes increase in demand to infinity. In such a case,
the demand is perfectly elastic or ep = 00
In perfectly elastic demand, the demand curve is represented as a horizontal straight line, which is shown in Figure-2:
2. Perfectly Inelastic Demand:
A perfectly inelastic demand is one when there is no change produced in the demand of a product with change in its price. The numerical value
for perfectly inelastic demand is zero (ep=0).
In case of perfectly inelastic demand, demand curve is represented as a straight vertical line, which is shown in Figure-3:
It can be interpreted from Figure-3 that the movement in price from OP1 to OP2 and OP2 to OP3 does not show any change in the demand of
a product (OQ). The demand remains constant for any value of price. Perfectly inelastic demand is a theoretical concept and cannot be applied
in a practical situation. However, in case of essential goods, such as salt, the demand does not change with change in price. Therefore, the
demand for essential goods is perfectly inelastic
3. Relatively Elastic Demand:
Relatively elastic demand refers to the demand when the proportionate change produced in demand is greater than the proportionate change
in price of a product. The numerical value of relatively elastic demand ranges between one to infinity.
Mathematically, relatively elastic demand is known as more than unit elastic demand (ep>1). For example, if the price of a product increases by
20% and the demand of the product decreases by 25%, then the demand would be relatively elastic.
The demand curve of relatively elastic demand is gradually sloping, as shown in Figure-4:
It can be interpreted from Figure-4 that the proportionate change in demand from OQ1 to OQ2 is relatively larger than the proportionate
change in price from OP1 to OP2. Relatively elastic demand has a practical application as demand for many of products respond in the same
manner with respect to change in their prices.
4. Relatively Inelastic Demand:
Relatively inelastic demand is one when the percentage change produced in demand is less than the percentage change in the price of a
product. For example, if the price of a product increases by 30% and the demand for the product decreases only by 10%, then the demand
would be called relatively inelastic. The numerical value of relatively elastic demand ranges between zero to one (ep<1). Marshall has termed
relatively inelastic demand as elasticity being less than unity.
The demand curve of relatively inelastic demand is rapidly sloping, as shown in Figure-5:
4. It can be interpreted from Figure-5 that the proportionate change in demand from OQ1 to OQ2 is relatively smaller than the proportionate
change in price from OP1 to OP2. Relatively inelastic demand has a practical application as demand for many of products respond in the same
manner with respect to change in their prices.
5. Unitary Elastic Demand:
When the proportionate change in demand produces the same change in the price of the product, the demand is referred as unitary elastic
demand. The numerical value for unitary elastic demand is equal to one (ep=1).
The demand curve for unitary elastic demand is represented as a rectangular hyperbola, as shown in Figure-6:
From Figure-6, it can be interpreted that change in price OP1 to OP2 produces the same change in demand from OQ1 to OQ2. Therefore, the
demand is unitary elastic.
7) State and explain with suitable diagrams the law of demand. What are the reasons for the downward slope of the demand?
Demand, in economic terms, basically means the desire to purchase something. However, the desire itself is not sufficient. It also requires the
willingness and purchasing power of people to acquire the commodity. According to the law of demand, when other factors are constant, there is an
inverse relationship between price and demand. In other words, the demand for something increases as its price false. Conversely, demand reduces
when the price increases. We can understand this inverse relationship using the following individual demand schedule:
Demand Curve
From the demand schedule we have seen above, we can derive the following demand curve:
Price Demand
5 100
4 200
3 300
2 400
1 500
5. This graph also shows the demand curve falling as the price reduces. The downward sloping of this curve explains the law of demand. Furthermore,
its rightward shift with falling prices indicates increasing demand.
Causes for Downward Sloping of Demand Curves
1) The law of diminishing the marginal utility
2) Substitution effect
3) Income effect
4) New buyers
5) Old buyers
8) Distinguish between cardinal and ordinal utility
Cardinal Utility Ordinal Utility
Definition
It explains that the satisfaction level after consuming
any goods or services can be scaled in terms of
countable numbers.
It explains that the satisfaction level after consuming any goods or services
cannot be scaled in numbers. However, these things can be arranged in the
order of preference.
Example
Pizza gives Sam 60 utile of satisfaction, whereas burger
gives him only 40 utile.
Sam gets more satisfaction from a pizza as compared to that of a burger.
Measurement
Utility is measured based on utile. Utility is ranked based on satisfaction.
Realistic
It is less practical. It is more practical and sensible.
Used By
This theory was applied by Prof. Marshall This theory was applied by Prof. J R Hicks
9) What is Demand forecasting and explain its methods?
Demand Forecasting is a systematic and scientific estimation of future demand for a product. Simply, estimating the sales proceeds
or demand for a product in the future is called as demand forecasting.
The methods of forecasting can be classified into two broad categories:
1.Survey Methods: Under the survey method, the consumers are contacted directly and are asked about their intentions for a product and
their future purchase plans. This method is often used when the forecasting of a demand is to be done for a short period of time.
The survey method includes:
Consumer Survey Method
Opinion Poll Methods
6. 2. Statistical Methods: The statistical methods are often used when the forecasting of demand is to be done for a longer period. The
statistical methods utilize the time-series (historical) and cross-sectional data to estimate the long-term demand for a product. The
statistical methods are used more often and are considered superior than the other techniques of demand forecasting due to the
following reasons:
There is a minimum element of subjectivity in the statistical methods.
The estimation method is scientific and depends on the relationship between the dependent and independent variables.
The estimates are more reliable
In addition, the cost involved in the estimation of demand is the minimum.
The statistical methods include:
Trend Projection Methods
Barometric Methods
Econometric Methods
10) What is meant by change in supply and change in quantity supplied?
Change in supply: When the supply of a commodity changes due to any factor (taxation policy, technology etc.) other than price, then such a
change is known as change in supply. This results in shift in the supply curve.
Change in Quantity supplied: When the supply of a commodity changes due to change in its price keeping other factors instant, then such a
change is known as Change in Quantity supplied. This results in movement along the supply curve
11) A good is an inferior good for one and at the same time normal good for another consumer. Do you agree? Explain with the help of an
example.
It is true as it is the income of a consumer which determines whether the good is inferior or normal. A good, which is a normal good for the
consumer having lower income, may become an inferior good for the consumer having higher income.
Let us assume that the income of consumer A is high and that of consumer B is low.
Let the good of interest be 'Keypad mobile phone'.
For consumer A with higher income, it is an 'inferior good'.
However, the same good is a 'normal good' for the consumer B who has a lower income level.
When income level increases, the demand for a normal good increases
CASE STUDY SOLUTION-
1. After the acquisition from Star Hub their announced a 4 dollar increase in and basic package from 20 to 24 dollars a month. They decided
to include the EPL on its sports package. They had also announces a 7 dollar increase in the sports package from eight to 15 dollars a
month. The sports packages included the ESPN star sports. This resulted in the TV operators paying a royalty to ESPN based on the
number of subscribers on Star Hub.
2. The payment of royalties to content providers is the main cause of the increase in pricing of pay TV within the country, especially
basing on Star Hub’s case study. In addition, the company is the only provider of the cable TV in the country and the licence of
acquiring the cable TV rights is very costly too.
3. Prior to the increase in 2007, star hub has already maximised the profits that it made from the provision of its services, This begins
from the sports package from $20 to $24 and raise in all new sports package airing EPL matches by $10 to $25.
4. Cable TV operator is bound by provision to ensure that he remits subsequent payments to the content provider for each of its
customer as royalty. It is against broadcast rights to air another company is content without prior permission from the content
provider, which in turn leads to the breaking of the terms of media broadcast rights.
5. A lump-sum bid would be instrumental in resolving the asymmetry of information between EPL and cable TV operators such as Star
Hub as this payment enables the live streaming of matches from EPL to these Cable TV providers. This covers the overhead costs
thereby enabling the fans to watch the games one on one.