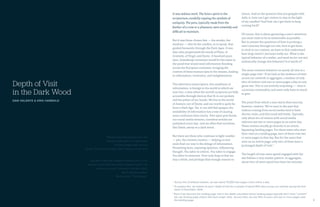
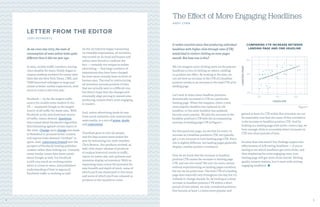
1. The document discusses how more engaging headlines on landing pages can increase clicks. Analyzing data from a landing page with 500k+ daily views, the author found that a 1% increase in a headline's click-through rate resulted in a typical 0.5% increase in the total landing page click-through rate.
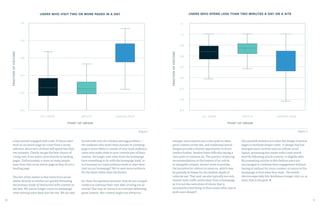
2. The rise of mobile traffic and applications has led to more "dark social" traffic where the referrer is not identified. For many domains, dark social accounts for 20-40% of external traffic. However, analyzing traffic patterns shows dark social often correlates with known sources like Reddit. Tracking user agents can also help attribute some dark social traffic.
3. Recent changes by sites like

![6 7
Over the past few years, Internet traffic has seen
major changes. As smartphones become more
ubiquitous, more and more people are spending
a significant amount of time on the web on
mobile devices, and in particular, via mobile
applications. In October, more than half of the
time Internet users spent online was via mobile
and tablet applications.1
With the rise in mobile application traffic, there
has been a parallel increase in unattributed
traffic to articles on the web—a bucket of traffic
referred to as dark social. This category of traffic
encompasses not only the visitors who enter a
URL directly, but also those who click on links
from email, instant messaging, and many mobile
and desktop applications. Unattributed traffic can
also result from a number of technical issues that
cause referrer information to be omitted from a
known traffic source. The lack of clear attribution
for this traffic is a big problem: for most domains
on our network, dark social accounts for 20% to
40% of overall external traffic to articles. Because
of the popularity of mobile applications, the
percentage of dark social traffic among mobile
users is even higher.
Fortunately, the problem of dark social is
becoming more widely acknowledged throughout
the industry. Individual domains have long
tried to manually alleviate the problem by
including tracking tags and custom URLs on
their social content, but are increasingly looking
for additional tools to confront the problem
head on. Analytics providers continue to refine
their offerings and take a leading role in driving
the conversation. Major referrer sources are
doing more to ensure that their traffic is properly
acknowledged. We’ll take a look at some of these
developments.
One way of getting a handle on this attribution
problem is to look carefully at traffic patterns among
the articles on your site. For a large majority of
the articles we have looked at, dark social traffic
closely correlates in time with other attribution
sources. For instance, several of the most popular
mobile applications for Reddit do not pass referrer
information. Consequentially, when we see spikes
in Reddit-based traffic on desktop, we tend to see
a corresponding spike of dark social traffic on
mobile. This suggests that a large portion of dark
social traffic is really just misattribution of known
referrers. As a result, for individual articles, you can
explicitly attribute much of this traffic to the correct
sources.
Chartbeat is now leveraging user agent profiles to
disambiguate a significant chunk of dark social
mobile application traffic. Many major mobile
applications such as Facebook, Twitter, Pinterest,
Drudge Report, and Flipboard set a tag in the user
agent to identify the application. For example, in
the following user agent, the tag “[FBAN/FBIOS…]”
identifies the use of the Facebook application on iOS:
The Evolution of Dark Social
Correcting Attribution in the Mobile App Age
CHRIS BREAUX
Mozilla/5.0 (iPhone; CPU iPhone OS
8_1_2 like Mac OS X) AppleWebKit/600.1.4
(KHTML, like Gecko) Mobile/12B440 [FBAN/
FBIOS;FBAV/21.0.0.25.14;FBBV/6017145;FBDV/
iPhone7,2;FBMD/iPhone;FBSN/iPhone
OS;FBSV/8.1.2;FBSS/2; FBCR/AT&T;FBID/phone;FBLC/
en_US;FBOP/5]
1
https://www.internetretailer.com/2014/12/10/mobile-apps-dominate-time-consumers-spend-online
In many cases, we saw an immediate difference
after Chartbeat started capturing missing referrers
for these user agent-tagged mobile applications.
For instance, we saw the traffic attributed to
mobile Facebook use jump as much as 40% from
previously misattributed dark social traffic.
Several large sites have also made recent efforts
to try to pass along referrer information more
of the time. In early 2014, Yahoo made a site-
wide conversion to use HTTPS instead of HTTP
by default, causing referrer data to be dropped.
Recently, however, we have observed changes from
the Yahoo site that now allow the referrer to be
passed for both Yahoo Search and Yahoo News.
Facebook also recently announced that it fixed a
bug that was causing referrer data to get lost on
outgoing mobile application clicks. This fix is
particularly notable because of how much traffic
originates from the social network.
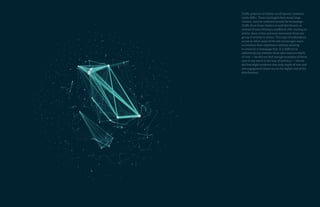
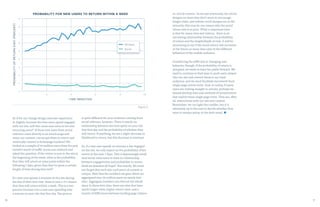
We can see the results of these changes across our
network. Figure 1 shows how the share of dark
social traffic has evolved over the second half of
2014. While dark social on desktop is relatively
stable, we can see a significant drop in dark social
for both mobile and tablet devices in November,
concurrent with the Facebook fix. (We also see a
corresponding rise in Facebook traffic).
As more sites pay closer attention to the analytics
needs of its publishers and as more mobile
applications pass referrer information or user agent
identification, perhaps we can make further inroads
into the problem of missing attribution. Still, even
with the most recent efforts, dark social share
remains at a third of external traffic. We still see
close time series correlations for major drivers of
traffic such as Facebook and Reddit. It is apparent
that we’ve made strong progress in mitigating dark
social traffic on mobile and tablet devices; but as a
share of traffic, dark social on mobile is still
significantly higher than dark social on desktop.
Unfortunately, we can’t give up on tracking codes
and custom URLs quite yet.
SHARE OF TRAFFIC BY REFERRER
DESKTOP
TRAFFICSHARE
0.5
0.4
0.3
0.2
0.6
AU
G
14
AU
G
14
AU
G
14
JU
LY
14
JU
LY
14
JU
LY
14
SEPT
14
SEPT
14
SEPT
14
O
C
T
14
O
C
T
14
O
C
T
14
N
O
V
14
N
O
V
14
N
O
V
14
D
EC
14
D
EC
14
D
EC
14
MOBILE TABLET
Dark Social
Facebook
Figure 1](https://image.slidesharecdn.com/6538d095-dd14-4557-9a94-8eaca78ea1bc-150610094928-lva1-app6891/85/quarterly_winter_2015-4-320.jpg)