Downloaded 26 times
![Qualitative Data Analysis 9
During an analysis meeting a team member would present one or two data segments. We also had
access to the original coded transcript and the video from which it was transcribed. We would spend
several hours analyzing and thinking about those segments. Each team member had a printout of
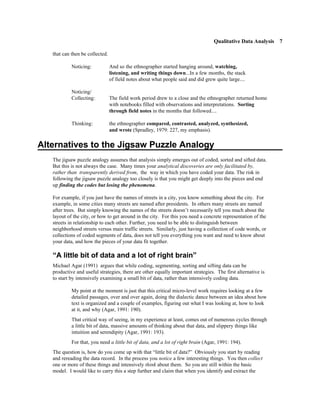
the segment and would cover it with notes, thoughts, and scribbles. An example printout is shown in
Figure 2. At the end of the session we would write up a preliminary memo summarizing our work.
During analysis our attention was not restricted to the particular segment. For example, we might
also examine and compare other “progress” segments with the segment we were analyzing. We
would also look at the transcript from which the segment came so that we could place our analysis
in the larger context from which the segment came. This context was not simply the immediately
adjacent text within which the segment was embedded, but the entire event of which it was a part.
Figure 2. Example of Intensively Analyzed Data
This type of analytic process was not focused on gross analysis and summarization of a category of
the data. Rather, it emerged out of preliminary coding and followed Agar’s prescription of working
with “a little bit of data, and a lot of right brain” (Agar, 1991: 194). Sometimes the process took us
beyond the topic of the segment. Sometimes it took us deeper into the topic.
Threads and Patterns in the Data;
Mapping the Data Landscape
Agar’s second analysis alternative is the analogy of the “multi-threaded DNA laid on the text so you
[can] look at the patterns that each thread reveal[s], and the patterns among the patterns”(Agar,
1991: 193). I argue that, because The Ethnograph lets you see your code words embedded in your](https://image.slidesharecdn.com/qualitativedataanalysis-121016122027-phpapp01/85/Qualitative-data-analysis-9-320.jpg)

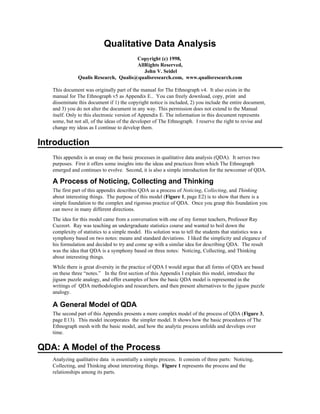
This document provides an overview of the process of qualitative data analysis (QDA). It describes QDA as consisting of three main parts: noticing interesting things in the data, collecting and sorting those things into categories, and thinking about the collected things by making connections between them. The process is iterative, with each step containing and leading back to the others. It is likened to solving a jigsaw puzzle by sorting pieces into groups. The document outlines this basic QDA process and model in more detail.