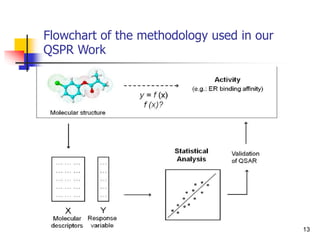
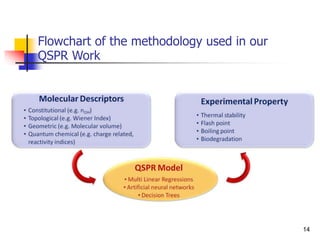
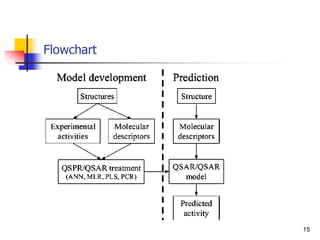
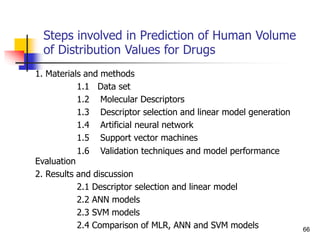
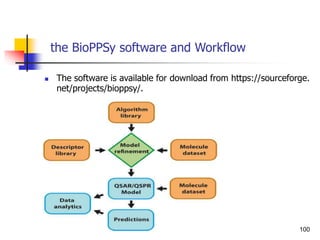
This document provides an overview of quantitative structure-property relationship (QSPR) modeling for drug disposition prediction. It discusses why QSPRs are useful, the general methodology used in QSPR modeling including descriptor generation, statistical analysis and model validation. Specific approaches covered include multiple linear regression, partial least squares, artificial neural networks and internal/external validation techniques. The overall goal of a QSPR approach is to mathematically relate molecular descriptors to physicochemical properties and pharmacokinetic parameters to allow for drug property prediction without additional experiments.
![INTRODUCTION
To obtain physical and chemical properties of these molecules. Chemical
structure of any drug determine its pharmacokinetics and
pharmacodynamic.
Detail understanding of relationship between the drug chemical structure
and individual pharmacokinetic parameter is required for efficient
development of new drug.
Different approaches have been developed for this purpose, ranging from
statistic based QSPR Aanalysis to physiologically based pharmacokinetic
models[PBPK].
Nowadays, a large amount of experimental and predicted data about the 3D
structure of organic molecules and biomolecules is available.
For drug discovery, it is very important It is very time consumming to
measure the properties. Therefore approaches for their prediction are a topic
of an intensive research.
QSPR models are very strong tools for predicting these properties](https://image.slidesharecdn.com/shatavarifinalpptqspr-200206134439/85/QSPR-For-Pharmacokinetics-5-320.jpg)
![QSPR [QUANTITATIVE STRUCTURE PROPERTY
RELATIONSHIP]
9
The rapid development of modern computational technology has created an e
ntirely new environment for the efficient use of the theoretical construction in
many areas of applied research.
The theoretical approach has proven to be especially beneficial in chemistry a
nd allied sciences, where the experimental-analysis and artificial developmen
t of new compounds and materials can be time-consuming, laborious, expensi
ve or even hazardous. Hence there is a need of alternate approach to experim
ental process.
A feasible estimation method should satisfy the following conditions:
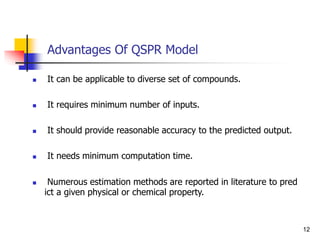
(i) It can be applicable to diverse set of compounds
(ii) It requires minimum number of inputs.
(iii) It should provide reasonable accuracy to the predicted output.
(iv) It needs minimum computation time.](https://image.slidesharecdn.com/shatavarifinalpptqspr-200206134439/85/QSPR-For-Pharmacokinetics-9-320.jpg)
![QSPR [QUANTITATIVE STRUCTURE PROPERTY
RELATIONSHIP]
10
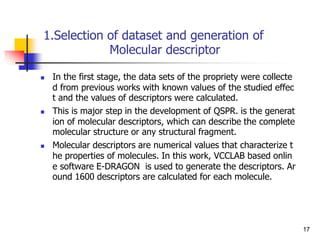
Numerous estimation methods are reported in literature to predict a given physi
cal or chemical property. On the other hand, as the heterogeneity in the chemica
l structure of the compounds increases, property prediction becomes less reliabl
e and consumes more time.
The different approaches generally used for prediction of physical properties ca
n be classified into the following categories
(1) Correlation based on experimental data.
(2) Group contribution method based on fragments.
(3) Correspondence theorem based on critical properties.
QSPRs are computer-assisted mathematical models, which relate the physicoch
emical property of compounds to their chemical structure QSPR studies are per
formed on the basis of the correlation between the experimental values and des
criptors which are derived from the molecular structure of respective compound
s.](https://image.slidesharecdn.com/shatavarifinalpptqspr-200206134439/85/QSPR-For-Pharmacokinetics-10-320.jpg)
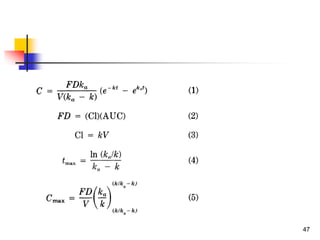
![Drug Absorption
The problems due to the use of these parameters ha
ve been recognized by, the direct comparison of the b
lood level of chemical analogs fails to take into accou
nt that these parameters are the complex result of th
ree pharmacokinetic phenomena.
Besides absorption, they contain the process of distri
bution and elimination [Equations. (1)-(5)].
46](https://image.slidesharecdn.com/shatavarifinalpptqspr-200206134439/85/QSPR-For-Pharmacokinetics-46-320.jpg)
![Drug Absorption
Another frequently used, but inappropriate, descriptor of absorp
tion in QSPR is the percentage of drug absorbed (%abs). It can
be demonstrated that the relationship between %abs and log P
[Eq. 6] is not correct for extrapolation to high lipophilicities, for
which %abs becomes greater than 100%
log (%abs) = a log P + b.........(6)
proposed for first-order absorption kinetics to transform %abs t
o ka by the expression
ka = -ln[1 -(%abs/100)]/t ……..(7)
Drug absorption has been extensively studied using two- and th
ree-compartment models.
Here we repeat only that these models revealed a bilinear relati
onship between drug absorption (log ka) and lipophilicity (log P)
. 50](https://image.slidesharecdn.com/shatavarifinalpptqspr-200206134439/85/QSPR-For-Pharmacokinetics-50-320.jpg)
![References
[1] S. Chtita, M. Larif, M. Ghamali, M. Bouachrine and T. Lakhlifi, Quantitative s
tructure–activity relationship studies of di-benzo[a,d]cycloalkenimine derivative
s for non-competitive antagonists of N-methyl-d-aspartate based on density fun
ctional theory with electronic and topological descriptors, J. of Taibah Univ. for
Sci., 9(2015)143–154.http://dx.doi.org/10.1016/j.jtusci.2014.10.006.
[2] S. Chtita, M. Larif, M. Ghamali, M. Bouachrine and T. Lakhlifi, QSAR Studies
of Toxicity Towards Monocytes with (1,3-benzothiazol-2-yl) amino-9-(10H)-acrid
inone Derivatives Using Electronic Descriptors, Orbital: Electron. J. Chem. 7 (2)
(2015) 176-184.
Hansch, C., Muir, R. M., Fujita, T., Maloney, P. P., Geiger, F., and Streich, M. The
correlationo f biologicala ctivity of plant growthr egulatorsa nd chloromycetind
erivativesw ith Hammett constantsa nd partitionc oefficients.J . Am. Chem.S oc.
85:2 817- 2824 (1963). 2. Hansch, C., and Fujita, T. p-or-r Analysis. A method f
or the correlation of biological activity and chemical structure. J. Am. Chem. So
c. 86: 1616-1626 (1964).
103](https://image.slidesharecdn.com/shatavarifinalpptqspr-200206134439/85/QSPR-For-Pharmacokinetics-103-320.jpg)