QNBFS Daily Market Report October 29, 2019
•
0 likes•100 views

The QE Index in Qatar declined 0.8% led by losses in the Insurance and Banks & Financial Services indices. Qatar General Insurance & Reinsurance Company and Mannai Corporation were the top losers falling 10.0% and 4.2% respectively. Most other GCC indices also declined except for Oman which gained 0.5%. Earnings releases from companies in Saudi Arabia showed declines in revenue and profits year-over-year for many except a few such as Saudi Cement Co.

Recommended
Recommended
More Related Content
What's hot
What's hot (20)
Similar to QNBFS Daily Market Report October 29, 2019
Similar to QNBFS Daily Market Report October 29, 2019 (20)
More from QNB Group
More from QNB Group (20)
Recently uploaded
Recently uploaded (20)
QNBFS Daily Market Report October 29, 2019
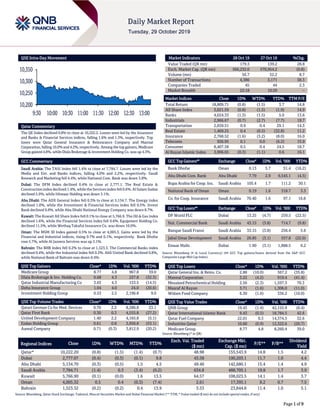
- 1. Page 1 of 9 QSE Intra-Day Movement Qatar Commentary The QE Index declined 0.8% to close at 10,222.2. Losses were led by the Insurance and Banks & Financial Services indices, falling 1.6% and 1.3%, respectively. Top losers were Qatar General Insurance & Reinsurance Company and Mannai Corporation, falling 10.0% and 4.2%, respectively. Among the top gainers, Medicare Group gained 4.8%, while Dlala Brokerage & Investment Holding Co. was up 4.3%. GCC Commentary Saudi Arabia: The TASI Index fell 1.4% to close at 7,784.7. Losses were led by the Media and Ent. and Banks indices, falling 4.0% and 2.2%, respectively. Saudi Research and Marketing fell 4.4%, while National Com. Bank was down 3.8%. Dubai: The DFM Index declined 0.4% to close at 2,777.1. The Real Estate & Construction index declined 1.4%,while the Services index fell 0.6%. Al Salam Sudan declined 5.9%, while Ithmaar Holding was down 5.1%. Abu Dhabi: The ADX General Index fell 0.3% to close at 5,134.7. The Energy index declined 1.0%, while the Investment & Financial Services index fell 0.5%. Invest Bank declined 9.8%, while Abu Dhabi National Energy Company was down 8.7%. Kuwait: The Kuwait All Share Index fell 0.1% to close at 5,766.9. The Oil & Gas index declined 1.6%, while the Financial Services index fell 0.6%. Equipment Holding Co. declined 11.5%, while Wethaq Takaful Insurance Co. was down 10.0%. Oman: The MSM 30 Index gained 0.5% to close at 4,005.3. Gains were led by the Financial and Industrial indices, rising 0.7% and 0.1%, respectively. Bank Dhofar rose 5.7%, while Al Jazeera Services was up 3.1%. Bahrain: The BHB Index fell 0.2% to close at 1,523.3. The Commercial Banks index declined 0.4%, while the Industrial index fell 0.2%. Ahli United Bank declined 0.8%, while National Bank of Bahrain was down 0.4%. QSE Top Gainers Close* 1D% Vol. ‘000 YTD% Medicare Group 8.77 4.8 967.8 39.0 Dlala Brokerage & Inv. Holding Co. 0.68 4.3 227.8 (32.3) Qatar Industrial Manufacturing Co 3.65 4.3 153.5 (14.5) Doha Insurance Group 1.04 4.0 24.0 (20.6) Investment Holding Group 0.53 2.5 2,196.8 9.0 QSE Top Volume Trades Close* 1D% Vol. ‘000 YTD% Qatari German Co for Med. Devices 0.70 2.2 8,286.8 23.1 Qatar First Bank 0.30 0.3 4,555.8 (27.2) United Development Company 1.40 2.2 4,165.8 (5.1) Ezdan Holding Group 0.61 0.8 3,956.8 (53.1) Aamal Company 0.71 (0.3) 3,812.9 (20.2) Market Indicators 28 Oct 19 27 Oct 19 %Chg. Value Traded (QR mn) 179.3 139.2 28.8 Exch. Market Cap. (QR mn) 566,232.0 570,954.2 (0.8) Volume (mn) 56.7 52.2 8.7 Number of Transactions 4,386 3,171 38.3 Companies Traded 45 44 2.3 Market Breadth 22:18 10:29 – Market Indices Close 1D% WTD% YTD% TTM P/E Total Return 18,809.71 (0.8) (1.5) 3.7 14.8 All Share Index 3,021.59 (0.8) (1.5) (1.9) 14.9 Banks 4,024.33 (1.3) (1.5) 5.0 13.6 Industrials 2,966.67 (0.7) (2.7) (7.7) 19.7 Transportation 2,659.51 0.9 0.4 29.1 14.3 Real Estate 1,469.25 0.4 (0.5) (32.8) 11.2 Insurance 2,768.52 (1.6) (3.2) (8.0) 16.0 Telecoms 926.95 0.1 0.0 (6.2) 15.9 Consumer 8,407.58 0.5 0.4 24.5 18.7 Al Rayan Islamic Index 3,906.65 (0.3) (1.1) 0.6 16.1 GCC Top Gainers## Exchange Close# 1D% Vol. ‘000 YTD% Bank Dhofar Oman 0.13 5.7 51.4 (16.2) Abu Dhabi Com. Bank Abu Dhabi 7.79 2.9 9,545.1 (4.5) Bupa Arabia for Coop. Ins. Saudi Arabia 105.4 1.7 111.2 30.1 National Bank of Oman Oman 0.19 1.6 318.7 3.3 Co. for Coop. Insurance Saudi Arabia 70.40 1.6 97.1 16.8 GCC Top Losers## Exchange Close# 1D% Vol. ‘000 YTD% DP World PLC Dubai 13.25 (4.7) 259.5 (22.5) Nat. Commercial Bank Saudi Arabia 43.15 (3.8) 714.7 (9.8) Banque Saudi Fransi Saudi Arabia 33.15 (3.8) 256.4 5.6 Jabal Omar Development Saudi Arabia 26.85 (3.1) 557.8 (22.0) Emaar Malls Dubai 1.90 (3.1) 1,888.5 6.2 Source: Bloomberg (# in Local Currency) (## GCC Top gainers/losers derived from the S&P GCC Composite Large Mid Cap Index) QSE Top Losers Close* 1D% Vol. ‘000 YTD% Qatar General Ins. & Reins. Co. 2.88 (10.0) 567.2 (35.8) Mannai Corporation 3.22 (4.2) 919.4 (41.4) Mesaieed Petrochemical Holding 2.56 (2.3) 1,597.3 70.3 Masraf Al Rayan 3.71 (1.6) 1,306.0 (11.0) Widam Food Company 6.30 (1.6) 336.2 (10.0) QSE Top Value Trades Close* 1D% Val. ‘000 YTD% QNB Group 19.43 (1.4) 42,155.9 (0.4) Qatar International Islamic Bank 9.43 (0.5) 18,784.5 42.6 Qatar Fuel Company 22.01 0.3 14,374.5 32.6 Industries Qatar 10.60 (0.9) 12,322.6 (20.7) Medicare Group 8.77 4.8 8,260.4 39.0 Source: Bloomberg (* in QR) Regional Indices Close 1D% WTD% MTD% YTD% Exch. Val. Traded ($ mn) Exchange Mkt. Cap. ($ mn) P/E** P/B** Dividend Yield Qatar* 10,222.20 (0.8) (1.5) (1.4) (0.7) 48.98 155,543.9 14.8 1.5 4.2 Dubai 2,777.07 (0.4) (0.3) (0.1) 9.8 43.58 100,203.1 11.7 1.0 4.4 Abu Dhabi 5,134.70 (0.3) (0.5) 1.5 4.5 49.40 142,680.1 15.4 1.4 4.9 Saudi Arabia 7,784.71 (1.4) 0.3 (3.4) (0.2) 634.8 488,705.1 19.8 1.7 3.9 Kuwait 5,766.90 (0.1) (0.0) 1.6 13.5 64.57 108,023.5 14.1 1.4 3.7 Oman 4,005.32 0.5 0.4 (0.3) (7.4) 2.61 17,395.1 8.2 0.7 7.5 Bahrain 1,523.32 (0.2) (0.2) 0.4 13.9 3.53 23,844.8 11.4 1.0 5.1 Source: Bloomberg, Qatar Stock Exchange, Tadawul, Muscat Securities Market and Dubai Financial Market (** TTM; * Value traded ($ mn) do not include special trades, if any) 10,200 10,250 10,300 10,350 9:30 10:00 10:30 11:00 11:30 12:00 12:30 13:00
- 2. Page 2 of 9 Qatar Market Commentary The QE Index declined 0.8% to close at 10,222.2. The Insurance and Banks & Financial Services indices led the losses. The index fell on the back of selling pressure from GCC shareholders despite buying support from Qatari and non-Qatari shareholders. Qatar General Insurance & Reinsurance Company and Mannai Corporation were the top losers, falling 10.0% and 4.2%, respectively. Among the top gainers, Medicare Group gained 4.8%, while Dlala Brokerage & Investment Holding Company was up 4.3%. Volume of shares traded on Monday rose by 8.7% to 56.7mn from 52.2mn on Sunday. However, as compared to the 30-day moving average of 65.1mn, volume for the day was 12.8% lower. Qatari German Company for Medical Devices and Qatar First Bank were the most active stocks, contributing 14.6% and 8% to the total volume, respectively. Source: Qatar Stock Exchange (* as a % of traded value) Earnings Releases, Global Economic Data and Earnings Calendar Earnings Releases Company Market Currency Revenue (mn) 3Q2019 % Change YoY Operating Profit (mn) 3Q2019 % Change YoY Net Profit (mn) 3Q2019 % Change YoY Al Hammadi Co. for Dev. and Inv. Saudi Arabia SR 220.0 -12.1% 34.4 -3.3% 21.2 -0.7% Saudi Industrial Investment Group Saudi Arabia SR 1,958.0 -14.8% 410.0 -45.3% 160.0 -49.8% National Petrochemical Co. Saudi Arabia SR 1,958.0 -14.8% 335.0 -41.1% 171.0 -44.3% Electrical Industries Co. Saudi Arabia SR 132.8 -23.7% 4.9 -46.5% (1.5) N/A Saudi Cement Co. Saudi Arabia SR 310.1 29.4% 92.8 15.1% 83.0 10.1% Saudi Ceramic Co. Saudi Arabia SR 291.7 16.7% 48.6 N/A 34.5 N/A Southern Province Cement Co. Saudi Arabia SR 286.0 45.9% 96.0 860.0% 90.3 1572.2% United Electronics Co. Saudi Arabia SR 1,035.0 15.7% 37.5 10.0% 27.2 -12.3% Saudi Advanced Industries Co. Saudi Arabia SR 13.6 5.4% 11.8 -0.4% 11.5 -0.3% Savola Group Saudi Arabia SR 5,335.9 2.4% 427.1 151.4% 221.8 N/A Al Abdullatif Industrial Investment Co.# Saudi Arabia SR 133.9 -9.3% 4.4 -9.6% 2.2 27.9% Al Hammadi Company for Development and Investment Saudi Arabia SR 220.0 -12.1% 34.4 -3.3% 21.2 -0.7% Saudi Industrial Investment Group Saudi Arabia SR 1,958.0 -14.8% 410.0 -45.3% 160.0 -49.8% Source: Company data, DFM, ADX, MSM, TASI, BHB. (# – Values in Thousands) Global Economic Data Date Market Source Indicator Period Actual Consensus Previous 10/28 EU European Central Bank M3 Money Supply YoY Sep 5.5% 5.7% 5.8% 10/28 Japan Bank of Japan PPI Services YoY Sep 0.5% 0.5% 0.5% Source: Bloomberg (s.a. = seasonally adjusted; n.s.a. = non-seasonally adjusted; w.d.a. = working day adjusted) Earnings Calendar Tickers Company Name Date of reporting 3Q2019 results No. of days remaining Status SIIS Salam International Investment Limited 29-Oct-19 0 Due QFBQ Qatar First Bank 29-Oct-19 0 Due ZHCD Zad Holding Company 29-Oct-19 0 Due GISS Gulf International Services 29-Oct-19 0 Due QISI Qatar Islamic Insurance Group 29-Oct-19 0 Due DOHI Doha Insurance Group 29-Oct-19 0 Due ORDS Ooredoo 29-Oct-19 0 Due AHCS Aamal Company 30-Oct-19 1 Due QOIS Qatar Oman Investment Company 30-Oct-19 1 Due QIMD Qatar Industrial Manufacturing Company 30-Oct-19 1 Due Source: QSE Overall Activity Buy %* Sell %* Net (QR) Qatari Individuals 26.04% 27.84% (3,238,860.36) Qatari Institutions 26.24% 16.87% 16,794,924.63 Qatari 52.28% 44.71% 13,556,064.27 GCC Individuals 1.17% 4.96% (6,807,441.94) GCC Institutions 4.89% 11.30% (11,493,909.79) GCC 6.06% 16.26% (18,301,351.73) Non-Qatari Individuals 9.74% 9.51% 400,112.16 Non-Qatari Institutions 31.93% 29.51% 4,345,175.30 Non-Qatari 41.67% 39.02% 4,745,287.45
- 3. Page 3 of 9 News Qatar VFQS posts 13.6% YoY increase but 12.1% QoQ decline in net profit in 3Q2019, misses our estimate – Vodafone Qatar's (VFQS) net profit rose 13.6% YoY (but declined 12.1% on QoQ basis) to QR30.4mn in 3Q2019, missing our estimate of QR43.0mn (variation of -29.5%). The company's revenue came in at QR491.0mn in 3Q2019, which represents an increase of 1.5% YoY. However, on QoQ basis, revenue fell 6.9%. EPS amounted to QR0.026 in 9M2019 as compared to QR0.018 in 9M2018. VFQS reported a net profit of QR108.4mn for the nine months ended September 2019, a significant growth of 44% compared with same period in 2018. The huge jump in net profit is mainly driven by higher EBITDA. Total revenue improved by 1% YoY to reach QR1.55bn with service revenue up by 2% driven by a growth in postpaid subscribers and the increasing popularity of home broadband solutions. The period was further highlighted by a 24% increase in EBITDA YoY to reach QR 529mn, supported by higher revenue, lower costs and the adoption of International Financial Reporting Standard (IFRS) 16. This reflects a healthy 34% EBITDA margin, representing an improvement of 6.3 percentage points YoY and the highest ever in the Company’s history. VFQS is now serving nearly 1.7mn mobile customers with solid growth coming from the postpaid segment led by its innovative products and exciting plans. Commenting on the results, VFQS’ Chairman, Abdulla Nasser Al Misnad, said, “We are pleased to report a continuation of growth in all key financial metrics for the period, which indicates the Company’s successful strategy in developing and building investment plans that fit the current period. We will continue to make advanced investments in both our radio and fixed access networks with a significant portion towards expanding our 5G network rollout, as part of our commitment to building a world class infrastructure that supports the realization of Qatar National Vision 2030.” VFQS’ CEO, Sheikh Hamad bin Abdullah Al Thani, added, “Last month, we proudly unveiled the extensive reach of our 5G network roll- out that is live across the country including 70% of Doha, with this percentage continually on the rise. In parallel, we launched the country’s first ‘Unlimited 5G Plans’ to give mobile users the full 5G experience, and allow them to take advantage of its unprecedented speed. These have proven very popular as is our GigaHome residential broadband solution which is seeing a strong growth. Moreover, with the expansion of our fiber footprint in key locations, we are confident that we will make further headway in the residential and business segment.” VFQS provides a comprehensive range of services including voice, messaging, data, fixed communications, IoT and ICT managed services in Qatar, for both consumers and businesses alike. The Company’s state-of-the-art network infrastructure is expanding to cover key locations in the country with fiber connectivity and 5G, along with an extensive digital ecosystem, which will contribute to Qatar’s continued growth and prosperity. (QNB FS Research, Gulf-Times.com, Peninsula Qatar) QNNS' bottom line rises 0.3% YoY and 172.9% QoQ in 3Q2019, in-line with our estimate – Qatar Navigation's (QNNS) net profit rose 0.3% YoY (+172.9% QoQ) to QR102.7mn in 3Q2019, in line with our estimate of QR107.5mn (variation of -4.4%). The company's operating revenue came in at QR572.8mn in 3Q2019, which represents an increase of 2.9% YoY (+4.2% QoQ). EPS amounted to QR0.37 in 9M2019 as compared to QR0.35 in 9M2018. Earnings expansion in its maritime and logistics business as well as gas and petrochem helped Qatar Navigation (Milaha) report a 5% YoY increase in net profit to QR419mn in the first nine months of this year. Operating revenues stood at QR1.83bn for the nine months ended September 30, 2019, against QR1.81bn for the same period in 2018. Milaha Maritime and Logistics’ operating revenue increased by QR18mn and net profit by QR52mn, driven by lower vessel impairments and higher profit from its ports business. Milaha Gas and Petrochem’s operating revenue was down QR14mn, while net profit grew by QR238mn against the same period last year, driven by strong performance from its joint venture and associate companies and lower vessel impairments. Milaha Offshore saw its operating revenue increase by QR118mn. The addition of new vessels and the increase in utilization contributed to the double digit increase in operating profit; but the bottom line declined by QR194mn mainly due to vessel impairments. Milaha Capital’s revenue and net profit decreased by QR56mn and QR73mn respectively, owing to lower dividends and ‘held-for-trading’ portfolio income. “This decrease was driven mainly by the liquidation of the majority of the trading portfolio and the reinvestment of the proceeds into acquiring an additional 6% stake in Nakilat,” a company spokesman said. Milaha Trading’s revenue was down QR28mn and bottom line fell by QR5mn, with a decline in heavy equipment sales beingthe main contributing factor. (QNB FS Research, Company press release, Gulf-Times.com) QATI posts ~12% YoY increase but ~48% QoQ decline in net profit in 3Q2019 – Qatar Insurance Company's (QATI) net profit rose ~12% YoY (but declined ~48% on QoQ basis) to ~QR75mn in 3Q2019. In 9M2019, QATI reported a net profit of QR485mn as compared to QR452mn in 9M2018. EPS amounted to QR0.130 in 9M2019 as compared to QR0.114 in 9M2018. QATI’s Gross Written Premium (GWP) expanded by 3% to QR9.8bn for the period compared with the first nine months of 2018. The Group announced its financial results for the first nine months ended September 30, 2019. Following a meeting of the Board of Directors, which was presided over by Sheikh Khalid bin Mohammed bin Ali Al Thani, Chairman & Managing Director of the Board of Directors. The Group said that the MENA markets continued to produce stable premiums with underwriting profitability, weathering geopolitical headwinds in the region. Qatar Insurance Company’s international operations further expanded in select low volatility classes. The Group’s international carriers namely Qatar Re, Antares, QIC Europe Limited (QEL) and its Gibraltar based carriers account for approximately 76% of the Group’s total GWP. QIC Insured, the personal insurance division of Qatar Insurance Company, continued its growth in digital transformation and innovative products. As a testament to its leading role in driving innovation Qatar Insurance Company was conferred the “Best Digital
- 4. Page 4 of 9 Transformation in Insurance Award” at the inaugural edition of the Enterprise Transformation Summit held in Doha. The Group’s net underwriting result improved by 11% to QR420mn compared with QR378mn for the same period last year. Low- severity high frequency business now accounts for a significant portion of Qatar Insurance Company’s total underwriting portfolio. The underwriting performance during the reporting period was adversely affected by the UK Government’s decision to revise the Ogden discount rate to minus 0.25% on July 15, 2019. The UK Motor insurance and reinsurance business is exposed to impacts caused by the changed discount rates and expected future lump sum settlements of personal injury cases Investment income came in at QR610mn for the first nine months of 2019. Qatar Insurance Company’s current investment return amounted to an annualized 4.6%, compared with 4.5% for the same period of 2018. The Group’s investment performance remains unrivalled by any of its peers, based on careful diversification across geographies and asset classes. Regional and global market conditions remained favorable. Qatar Insurance Company has vigorously maintained its focus on streamlining operations in order to further improve its operational efficiency. During the reporting period, the administrative expense ratio for its core operations came in at 6.8%. The Group’s ongoing endeavor towards process efficiencies and automation continued to yield fruit. Khalifa Abdulla Turki Al Subaey, Group President & CEO of the Group, said: “We continue to execute on our strategic shift towards lower volatility segments of the international markets. Qatar Insurance Company’s stable underwriting profitability testifies to the attractive economics of this business, with relatively stable and predictable margins.” He added, “The Group’s near- term outlook remains cautiously optimistic. Our exposure to the geopolitical situation in the Middle East and the vagaries of global re/insurance pricing is relatively moderate. As Qatar Insurance Company does not underwrite the market but focuses on bespoke, innovative and expertise-based transactions we continue to be shielded from a number of major risk scenarios presented by the political and economic environment.” (QSE, Peninsula Qatar) IGRD's net profit declines ~19% YoY and ~45% QoQ in 3Q2019, beating our estimate – Investment Holding Group 's (IGRD) net profit declined ~19% YoY (~-45% QoQ) to ~QR7mn in 3Q2019, beating our estimate of QR4.7mn (variation of ~+43%). In 9M2019, IGRD reported a net profit of QR34.5mn as compared to QR31.6mn in 9M2018. EPS amounted to QR0.042 in 9M2019 as compared to QR0.038 in 9M2018. (QSE) BRES' bottom line rises ~5% YoY and ~209% QoQ in 3Q2019 – Barwa Real Estate Company's (BRES) net profit rose ~5% YoY (+~209% QoQ) to ~QR294mn in 3Q2019. In 9M2019, BRES reported a net profit of QR804mn as compared to QR1,083mn in 9M2018. EPS amounted to QR0.21 in 9M2019 as compared to QR0.28 in 9M2018. (QSE) DOHI to hold Investors Relation Conference Call on November 04 – Doha Insurance Group (DOHI) announced that Investors Relation Conference Call will be held on November 04, 2019 to discuss financial results for 3Q2019. (QSE) MPHC posts 47.8% YoY decrease but 702.1% QoQ increase in net profit in 3Q2019 – Mesaieed Petrochemical Holding Company's (MPHC) net profit declined 47.8% YoY (but rose 702.1% on QoQ basis) to QR188.8mn in 3Q2019.The company's Share of profit from joint ventures came in at QR178.7mn in 3Q2019, which represents a decrease of 43.8% YoY (-17.9% QoQ). EPS amounted to QR0.039 in 9M2019 as compared to QR0.082 in 9M2018. (Gulf-Times.com, QSE) MCCS reports net loss of QR6.5mn in 3Q2019 – Mannai Corporation (MCCS) reported net loss of QR6.5mn in 3Q2019 as compared to net profit of QR54.4mn in 3Q2018 and net profit of QR37.9mn in 2Q2019. The company's revenue came in at QR2,824.9mn in 3Q2019, which represents an increase of 12.3% YoY. However, on QoQ basis, revenue fell 0.8%. EPS amounted to QR0.18 in 9M2019 as compared to QR0.49 in 9M2018. (Company press release) QFBQ to hold Investors Relation Conference Call on November 04 – Qatar First Bank (QFBQ) announced that Investors Relation Conference Call will be held on November 04, 2019 to discuss financial results for 3Q2019. (QSE) Q-Chem boosting ethylene production by 7% – Q-Chem, a subsidiary of Mesaieed Petrochemical Holding (MPHC), is enhancing its ethylene production by 7% by 2022 at an estimated investment of QR364mn. “Upon completion in 2022, the expansion program will provide a sustained increase in ethylene production by approximately 7%, thereby providing increased utilization of Q-Chem’s existing derivatives production capacity,’ an MPHC spokesman said. With an estimated investment of QR364mn, the expansion program is predicated on “positive” capital returns and the increased operational flexibility. Shareholders of Q-Chem have given their nod for the expansion of its ethylene production facilities in Mesaieed. The Q-Chem facility is a world-class integrated petrochemical plant producing high-density and medium- density polyethylene, 1-hexene and other products, using technology provided by Chevron Phillips Chemical, an integrated producer of chemicals and plastics. (Gulf-Times.com) QBA hosts roundtable focusing on enhancing Qatar-France business ties – The Qatari Businessmen Association (QBA) on Monday organized a roundtable with representatives of three leading French investment funds during which ways to further strengthen Qatar-France business ties were discussed. The roundtable was attended by representatives of three of France's leading investment funds, Ardian, Iris Capital and LBO France and held in co-operation with the French Embassy in Doha and in the presence of Franck Gellet, French ambassador. The QBA was represented by Sheikh Faisal bin Fahad Al-Thani, Abdulsalam Abu Issa, Sheikh Khalid bin Nawaf Al-Thani, Mohamed Althaf and Ihsan Al-Khiyami. Also, Sheikh Nawaf bin Jabor Al-Thani, managing director, Al Jabor Trading attended, in addition to representatives from distinguished private sector companies such as Al Mana Group, Al Sawari Group and Al Balagh for Trading. Representatives from Qatar Free Zones, Qinvest, BNP Paribas and Invest House besides QBA deputy general manager Sarah Abdulla attended the roundtable. Sheikh Faisal reiterated that Qatari businessmen were aware of the great potential the French market offered. Qatari businessmen are always in search of profitable investments and successful partnership opportunities to expand their business. The meeting highlighted the strength and the diversity of the French private
- 5. Page 5 of 9 equity industry with the participation of the three leading fund managers. (Gulf-Times.com) Baladna is increasingly tapping Horeca, airline sectors to expand its revenue – Baladna Food Industries (BFI) is increasingly tapping the Horeca (hotels, restaurants and cafe) sector, including airlines, as part of expanding its revenue, in view of saturation in the retail segment with more than 90% market share. Most of BFI’s revenues are in retail markets and therefore the Horeca market presents a large opportunity, and BFI, as a new market entrant, did not have substantial Horeca accounts prior to 2019, said the initial public offering (IPO) prospectus of Baladna, a yet-to-be established holding arm of BFI. Stressing that in 2019 BFI increased its sales channels from almost purely retail channels to include Horeca channels, including airlines, it said "the Horeca market presents an opportunity for BFI to increase its revenues domestically." On the basis of developments in the fiscal period ended June 30, 2019, the founders and senior management currently expect higher revenue growth to be in the range of 150-170% for the fiscal year ending December 31, 2019, compared to the fiscal year ended December 31, 2018. In the medium term, the company currently targets annual comparable revenue growth of 20-30% and 3- 10% for fiscal year 2020 and fiscal year 2021, respectively, for BFI, driven primarily by the planned launch of new products lines, segments and expansions into new markets. BFI’s share of the non-retail market (the Horeca market, which comprises hotels, restaurants, and catering) has steadily increased from 2017, the prospectus said, adding BFI will continue to increase its Horeca revenues. (Gulf-Times.com) QNB Group named ‘Best Investment Bank in Qatar’ by Global Finance – QNB, the largest financial institution in the Middle East and Africa, was recently distinguished as the “Best Investment Bank in Qatar” by Global Finance magazine as part of the “World’s Best Investment Banks 2019 Awards.” QNB received the award during a ceremony held recently in Washington, DC, on the sidelines of the International Monetary Fund and World Bank Annual Meetings. The Bank was selected by Global Finance’s editors with the input of industry experts using criteria ranging from market share to number and size of deals, service and advice, structuring capabilities, distribution network, efforts to address market conditions, innovation, pricing, after-market performance of underwritings, and market reputation. The award is a new addition to QNB’s numerous awards and international recognitions that acknowledge the excellence of the Bank’s products and services, as well as its success in maintaining and strengthening its market position. (QNB Group Press Release) Ooredoo Cloud Backup bolsters data protection – Ooredoo is launching at Qitcom 2019 today a new cloud-based data protection solution – the Ooredoo Cloud Backup Service for large enterprises, small- and medium-sized enterprises, and small offices to bolster data protection and secure digital transformation journeys. Across Qatar, many organizations face challenges when designing, implementing, and managing or supporting their in house data backup and disaster recovery solutions. Organizations often face limited IT resources and budgets to scale up their backup platform. As Qatar’s organizations face an increase in the amount of data to protect, the Ooredoo Cloud Backup Service provides an elastic, protected, and always-on backup and disaster recovery solution, available at any time and from any location. One of the biggest business benefits is to optimize IT costs and lower the total cost of ownership by switching from a capex-based model to an opex cloud-based model. Through a self-service control panel, organizations can also configure their backup policies and schedules, define the data retention period, and restore their data within seconds. (Gulf-Times.com) International Ebbing flows curb US goods trade deficit; inventories mixed – The US goods trade deficit fell in September as trade tensions restricted the flow of goods, but that did not change views that economic growth decelerated further in the third quarter amid slowing consumer spending and declining business investment. The report from the Commerce Department on Monday also showed inventories at retailers rising moderately last month, but stocks at wholesalers dropping, leading the Atlanta Federal Reserve to trim its gross domestic product growth estimate for the third quarter by one-tenth of a percentage point to a 1.7% annualized rate. The economy grew at a 2.0% rate in the second quarter, slowing from the January-March quarter’s 3.1% pace. The economy is losing momentum largely because of a 15-month trade war between the United States and China, which has sapped business confidence and undermined capital expenditure. Though President Donald Trump this month announced a truce in the trade war with China, delaying additional tariffs that were due in October, economists say the longest economic expansion on record remains in danger without all import duties being rolled back. Trump said on Monday he expected to sign a significant part of the trade deal with China ahead of schedule but did not elaborate on the timing. Economists, however, remain skeptical of the White House’s so- called Phase 1 trade deal and warned slower economic growth around the world would lead to a global recession. (Reuters) CBI: UK retail sales fall eases, stocks at record high – British retailers reported that their sales fell at the gentlest pace in six months in October but uncertainty about Brexit contributed to the highest stock levels on record, an industry survey showed. The Confederation of British Industry said on Monday its monthly index of reported sales rose to -10 from -16 in September. Economists who took part in a Reuters poll had forecast on average a reading of -20. However, the six-month run of falling sales represented the longest such period of decline since the global financial crisis a decade ago, the CBI said. The highest level of stocks since 1983, when the CBI began its surveys, also reflected Brexit uncertainty on top of preparations by retailers for the busy Christmas trading period. Earlier on Monday, the European Union agreed a 3-month flexible delay to Britain’s departure from the bloc which had been scheduled for Oct. 31. The CBI survey showed a small positive net balance of +1 among retailers when asked about sales expectations for November, the first positive figure since June. The survey was conducted between Sept. 26 and Oct. 17 and 82 firms took part, of which 41 were retailers, 38 were wholesalers and three were motor traders, the CBI said. (Reuters) Eurozone business lending growth plunges in September – Bank lending to Eurozone companies fell last month with all big
- 6. Page 6 of 9 countries recording drops, suggesting that the bloc’s economic slowdown is increasingly persistent and widespread, data from the European Central Bank showed on Monday. Hoping to arrest a lengthy economic slump originating mostly from Germany’s vast industrial sector, the ECB approved a fresh stimulus scheme last month, partly aimed at banks so they would continue to provide credit to the real economy. But data suggests that the slowdown is spreading to other countries and also to the services sector, pointing to a protracted period of anaemic growth that is weighing on jobs growth. Indeed, corporate lending growth across the 19-member currency bloc slowed to 3.7% in September from 4.3% in August, with France, Germany, Italy and Spain all showing drops. The monthly flow of credit to corporations across the bloc was a negative 8.1 billion, the biggest monthly drop since January 2015 and the first negative reading since January 2019. In France alone, the monthly credit growth rate fell to 6.7% from 8.3% in August, as monthly flows were negative 11.7 billion euros, indicating that banks were withdrawing credit from the economy. Monthly flows were barely in positive territory in Italy and Spain while in Germany, the monthly flow fell by two-thirds compared to August and the annual growth rate dropped to 6.4% from 6.8%. Household lending growth meanwhile held steady at 3.4%, unchanged for the third straight month. (Reuters) Draghi: ECB policy losing some potency, needs fiscal help – Europe must take a leap forward in integration and create the institutions needed for economic stabilization as monetary policy loses potency, outgoing European Central Bank President Mario Draghi said on Monday. Having faced years of crises or weak growth, the ECB has exhausted its conventional policy arsenal and now relies on untested, unconventional tools to stimulate growth. Speaking to an audience that included German Chancellor Angela Merkel and French President Emmanuel Macron, Draghi argued that a common budget for the EU was necessary so there would be a centralized capacity to stabilize the monetary union. EU finance ministers agreed on a small budget for the euro zone earlier this month, but it fell short of the original ambitions or the sort of tool ECB officials had hoped for. Germany has long resisted a large common budget or more risk- sharing, fearing that its taxpayers would have to foot the bill for the fiscal irresponsibility of other countries. Speaking at the event, Macron said that it was up to governments to fix the euro zone. (Reuters) Tokyo inflation remains stagnant after Japan's Oct sales tax hike – Core consumer prices in Tokyo, a leading indicator of nationwide inflation, rose 0.5% in October from a year earlier, data showed on Tuesday, staying distant from the Bank of Japan’s elusive 2% target and keeping it under pressure to ramp up stimulus. The data offered the first clue on how a sales tax hike that kicked off in October could affect price growth, which remains subdued despite years of heavy money printing by the BOJ. The rise in the core consumer price index (CPI) in the Japanese capital, which includes oil products but excludes fresh food prices, was slower than a median market estimate for a 0.7 percent gain and flat from the pace of increase in September. Japan’s government proceeded with a twice-delayed increase in the sales tax rate to 10% from 8% in October as part of efforts to rein in the country’s huge public debt. To ease the burden from the higher levy, the government started to offer discounts or make childcare services free of charge from October. When excluding the impact of the tax hike and the childcare discount, core consumer inflation in Tokyo hit 0.34% in October to mark the slowest pace in more than two years, according to the government’s estimate. Years of ultra-loose policy has failed to fire up inflation to the BOJ’s 2% target, forcing the central bank to maintain its massive stimulus program despite the strain on financial institutions’ profits from near-zero interest rates. In forecasts made in July, the BOJ was counting on nationwide core consumer inflation hitting 1.0% in the current fiscal year ending in March 2020, including the effect of the higher tax. (Reuters) Regional IMF slashes growth outlook in GCC states over oil production cuts – Growth in GCC countries is projected to decelerate to 0.7% in 2019 from 2% in 2018, due to oil production cuts in line with OPEC+ agreements, according to the IMF. In April, IMF had forecast 2.1% growth in 2019. However, growth in 2020 is expected to rebound to 2.5%, driven by a recovery in real oil GDP growth of 1.9% (compared to –1.4% in 2019 and 2.5% in 2018), the IMF stated in its October 2019 Regional Economic Outlook (REO) report for the Middle East, North Africa, Afghanistan and Pakistan(MENAP), launched in Dubai. The report stated that the recovery in 2020 reflects a mix of rising oil production in Kuwait and Saudi Arabia, the Jizan refinery becoming fully operational (Saudi Arabia), and a pickup in gas output in Oman and Qatar. However, there is uncertainty on whether the OPEC+ agreement will expire by March 2020. Meanwhile, the report noted, infrastructure spending in Kuwait, the UAE and Qatar is forecast to lift non-oil GDP growth from 2.4% this year to 2.8% in 2020. The UAE expects a boost in tourism from Expo 2020, and Qatar is expecting the same given its preparations towards hosting the 2022 FIFA World Cup. However, global trade uncertainties and rising geopolitical tensions continue to affect the prospects of oil exporters in the region. Director of the IMF’s Middle East and Central Asia Department, Jihad Azour said: “To pave the way for higher growth in the face of a challenging global environment, countries of the region should accelerate structural reforms that boost private sector activity and lift productivity." (Zawya) IMF: Unemployment, unrest hurt MENA growth – Unemployment and sluggish economic growth are fuellingsocial tension and popular protests in several Arab countries, the IMF stated. The unrest is in turn contributing to slower growth in the Middle East and North Africa (MENA) region, alongside global trade tensions, oil price volatility and a disorderly BREXIT process, the IMF stated in a report on the regional economic outlook. Earlier this month it lowered the 2019 forecast for the region — taking in the Arab nations and Iran — to a meagre 0.1% from 1.1% last year. The risks around the forecast of earlier this month “are skewed to the downside and are highly dependent on global factors,” the IMF stated in its report. “The level of growth that countries in the region are having is below what is needed to address unemployment,” the IMF’s Director for the Middle East and Central Asia, Jihad Azour said. “We are in a region where the rate of unemployment at the youth level exceeds 25%-30% and this requires growth to be higher by 1%-2%” in order to make a dent in joblessness, he added. The IMF report stated that the high unemployment was worsening social tensions in Arab countries. “Unemployment averages 11%
- 7. Page 7 of 9 throughout the region versus 7% across other emerging market and developing economies,” it stated. “Women and young people are particularly likely to be out of work, with more than 18% of women without jobs in 2018.” (Gulf-Times.com) IMF says Middle East markets twice as sensitive to global risk as emerging markets – Markets in the Middle East and Central Asia may have more to lose from a shift in global risk sentiment than other developing nations, according to an IMF report highlighting the region’s increased reliance on hot money. Capital inflows into the region have almost doubled over the last decade, as governments grappling with low oil prices rushed to bond markets to finance their budget and current-account deficits. Long-term foreign direct investment, on the other hand, has dropped almost by half. While the funds provided some governments the means to plug deficits relatively cheaply, “lower government and corporate transparency” make them twice as sensitive to changes in risk appetite than inflows into other emerging markets, the IMF said. (Bloomberg) Gulf CEOs remain largely upbeat about region’s outlook – GCC CEOs who participated in an Oxford Business Group (OBG) survey remain largely upbeat about the outlook for the region, despite escalating tensions with Iran in recent months. As part of its survey on the economy, the global research and advisory firm asked around 300 C-suite executives from across the GCC region a wide-ranging series of face-to-face questions aimed at gauging business sentiment. Almost three-quarters (72%) of those interviewed described their expectations of local business conditions as positive or very positive for the coming 12 months, up from 70.3% in OBG’s 2018 survey on the region. Most of the business leaders surveyed reacted favorably to the level of transparency in place for conducting business relative to the region, with 71% describing it as high or very high. An even larger majority (80%) told OBG that they viewed the current tax environment (business and personal) as competitive or very competitive on a global scale. Obtaining financing remains problematic for some, however, with a more modest 53% describing the ease of access to credit in their market as easy or very easy. Unsurprisingly, regional political volatility was by far the biggest business environment concern among executives, beyond movements in commodity prices. More than three- quarters (76%) identified it as the top external event they felt could impact the economy in the short to medium term, up from 71% last year and well ahead of China demand growth, which garnered 9% of responses. (Gulf-Times.com) Saudi Arabia's healthcare spending to reach $160bn by 2030 – Saudi Arabia’s Healthcare spending is expected to increase to $160bn by 2030, thanks to a burgeoning population and urbanization efforts in the Kingdom, advisory firm Colliers International said in a report. Population growth at a CAGR of 2.5% will be one of the key factors fueling a demand increase in healthcare services. Among other key factors are a rise in life expectancy and urbanization, the report, which is part of the Arab Health Market Series, noted. The age group new-born to 19 is expected to increase to 13.7mn by 2030 while population growth in the 20 to 39-year age group is expected to increase to 13.8mn by 2030 and the highest increase will be in the over 60 group age, as this category is expected to grow from 1.8mn in 2018 to 5mn in 2030, it stated. Spending on healthcare in the Kingdom has grown at a compound annual growth rate (CAGR) of 12.1% in the last nine years to $45.9bn. Director (MENA Region) Valuation & Advisory - Healthcare at Colliers International, Mansoor Ahmed said: “With the changing population composition alongside advancements in treatment technology, the provision of healthcare services in Saudi Arabia will undoubtedly change considerably.” “We anticipate, in line with many other developed nations, a realignment of treatment through the establishment of specialized Centres of Excellence (CoE) instead of clinics and general hospitals, providing further opportunities for operators and investors,” he added. (Zawya) SAMBA's net profit falls 2.5% YoY to SR1,226mn in 3Q2019 – Samba Financial Group (SAMBA) recorded net profit of SR1,226mn in 3Q2019, registering decrease of 2.5% YoY. Total operating profit rose 4.0% YoY to SR2,195mn in 3Q2019. Total revenue for special commissions/investments rose 7.5% YoY to SR2,102mn in 3Q2019. Total assets stood at SR237.3bn at the end of September 30, 2019 as compared to SR228.3bn at the end of September 30, 2018. Loans and advances stood at SR125.5bn (+9.4% YoY), while customer deposits stood at SR165.5bn (-2.4% YoY) at the end of September 30, 2019. EPS came in at SR1.65 in 3Q2019 as compared to SR1.86 in 3Q2018. (Tadawul) Vedomosti: DP World and RDIF again seeking to buy Fesco – DP World and Russian Direct Investment Fund (RDIF) have prepared to improve offer to buy Fesco after previous bid was not approved by the Russian government, Vedomosti reported, citing unidentified sources. The partners are ready to invest $2bn in Russian logistics projects as part of the deal. Russian President, Vladimir Putin has given order to study the proposal, meaning that there is a chance it may be approved by the foreign investment commission. (Bloomberg) Abu Dhabi billionaire considers IPO of pharmaceuticals business – Abu Dhabi billionaire Bavaguthu Raghuram Shetty, the founder of two London-listed companies, is considering selling shares in his pharmaceuticals business. "It makes sense to take it down this path where an IPO as an option is a good thing," Chief Executive Officer of BRS Ventures, Binay Shetty said. Work on the potential share sale in Neopharma is at an initial stage, he said. He said that the business could be listed in the next three years however, that there was no decision on whether to return to London again. "We want to work on this for the next six months internally." Shetty’s father founded London-traded NMC Health and Finablr, the payments processor that went public in May. Neopharma currently operates in about 50 markets, including Middle East, Africa and Asia. (Bloomberg) BBK posts 13.5% YoY rise in net profit to BHD15.5mn in 3Q2019 – BBK recorded net profit of BHD15.5mn in 3Q2019, an increase of 13.5% YoY. Net interest and similar income fell 8.5% YoY to BHD26.4mn in 3Q2019. Total operating income fell 5.8% YoY to BHD36.7mn in 3Q2019. Total assets stood at BHD3.7bn at the end of September 30, 2019 as compared to BHD3.6bn at the end of December 31, 2018. Loans and advances to customers stood at BHD1.7bn (-3.3% YTD), while customers’ current, savings and other deposits stood at BHD2.2bn (-7.1% YTD) at the end of September 30, 2019. Diluted EPS came in at BHD0.012 in 3Q2019 as compared to BHD0.013 in 3Q2018. (Bahrain Bourse) Bahrain sells BHD70mn 91-day bills; bid-cover at 1.6x – Bahrain sold BHD70mn of 91 day bills due on January 29, 2020. Investors
- 8. Page 8 of 9 offered to buy 1.6 times the amount of securities sold. The bills were sold at a price of 99.3, having a yield of 2.79% and will settle on October 30, 2019. (Bloomberg)
- 9. Contacts Saugata Sarkar, CFA, CAIA Shahan Keushgerian Zaid al-Nafoosi, CMT, CFTe Head of Research Senior Research Analyst Senior Research Analyst Tel: (+974) 4476 6534 Tel: (+974) 4476 6509 Tel: (+974) 4476 6535 saugata.sarkar@qnbfs.com.qa shahan.keushgerian@qnbfs.com.qa zaid.alnafoosi@qnbfs.com.qa Mehmet Aksoy, PhD QNB Financial Services Co. W.L.L. Senior Research Analyst Contact Center: (+974) 4476 6666 Tel: (+974) 4476 6589 PO Box 24025 mehmet.aksoy@qnbfs.com.qa Doha, Qatar Disclaimer and Copyright Notice: This publication has been prepared by QNB Financial Services Co. W.L.L. (“QNB FS”) a wholly-owned subsidiary of Qatar National Bank (Q.P.S.C.). QNB FS is regulated by the Qatar Financial Markets Authority and the Qatar Exchange. Qatar National Bank (Q.P.S.C.) is regulated by the Qatar Central Bank. This publication expresses the views and opinions of QNB FS at a given time only. It is not an offer, promotion or recommendation to buy or sell securities or other investments, nor is it intended to constitute legal, tax, accounting, or financial advice. QNB FS accepts no liability whatsoever for any direct or indirect losses arising from use of this report. Any investment decision should depend on the individual circumstances of the investor and be based on specifically engaged investment advice. We therefore strongly advise potential investors to seek independent professional advice before making any investment decision. Although the information in this report has been obtained from sources that QNB FS believes to be reliable, we have not independently verified such information and it may not be accurate or complete. QNB FS does not make any representations or warranties as to the accuracy and completeness of the information it may contain, and declines any liability in that respect. For reports dealing with Technical Analysis, expressed opinions and/or recommendations may be different or contrary to the opinions/recommendations of QNB FS Fundamental Research as a result of depending solely on the historical technical data (price and volume). QNB FS reserves the right to amend the views and opinions expressed in this publication at any time. It may also express viewpoints or make investment decisions that differ significantly from, or even contradict, the views and opinions included in this report. This report may not be reproduced in whole or in part without permission from QNB FS. COPYRIGHT: No part of this document may be reproduced without the explicit written permission of QNB FS. Page 9 of 9 Rebased Performance Daily Index Performance Source: Bloomberg Source: Bloomberg Source: Bloomberg Source: Bloomberg (*$ adjusted returns) 60.0 80.0 100.0 120.0 140.0 Sep-15 Sep-16 Sep-17 Sep-18 Sep-19 QSEIndex S&P Pan Arab S&P GCC (1.4%) (0.8%) (0.1%) (0.2%) 0.5% (0.3%) (0.4%) (2.0%) (1.0%) 0.0% 1.0% SaudiArabia Qatar Kuwait Bahrain Oman AbuDhabi Dubai Asset/Currency Performance Close ($) 1D% WTD% YTD% Global Indices Performance Close 1D%* WTD%* YTD%* Gold/Ounce 1,492.48 (0.8) (0.8) 16.4 MSCI World Index 2,231.40 0.4 0.4 18.4 Silver/Ounce 17.85 (1.0) (1.0) 15.2 DJ Industrial 27,090.72 0.5 0.5 16.1 Crude Oil (Brent)/Barrel (FM Future) 61.57 (0.7) (0.7) 14.4 S&P 500 3,039.42 0.6 0.6 21.2 Crude Oil (WTI)/Barrel (FM Future) 55.81 (1.5) (1.5) 22.9 NASDAQ 100 8,325.99 1.0 1.0 25.5 Natural Gas (Henry Hub)/MMBtu 2.49 9.2 9.2 (21.9) STOXX 600 398.99 0.5 0.5 14.6 LPG Propane (Arab Gulf)/Ton 46.88 0.3 0.3 (26.8) DAX 12,941.71 0.6 0.6 18.9 LPG Butane (Arab Gulf)/Ton 60.75 0.8 0.8 (12.6) FTSE 100 7,331.28 0.5 0.5 10.0 Euro 1.11 0.2 0.2 (3.2) CAC 40 5,730.57 0.4 0.4 17.4 Yen 108.95 0.3 0.3 (0.7) Nikkei 22,867.27 0.1 0.1 15.8 GBP 1.29 0.3 0.3 0.9 MSCI EM 1,042.97 0.7 0.7 8.0 CHF 1.01 (0.0) (0.0) (1.3) SHANGHAI SE Composite 2,980.05 0.8 0.8 16.3 AUD 0.68 0.2 0.2 (3.0) HANG SENG 26,891.26 0.8 0.8 3.9 USD Index 97.76 (0.1) (0.1) 1.7 BSE SENSEX 39,250.20 - 0.5 7.1 RUB 63.77 (0.2) (0.2) (8.0) Bovespa 108,187.10 1.4 1.4 19.6 BRL 0.25 0.3 0.3 (2.8) RTS 1,411.92 (0.7) (0.7) 32.1 109.1 105.0 89.5