Motorola reported first-quarter 2007 sales of $9.4 billion and a net loss of $0.08 per share. Sales increased 20% in Networks and Enterprise and 42% in Connected Home Solutions, but declined 15% in Mobile Devices. For the second quarter, Motorola expects sales to be flat with Q1 and earnings per share between $0.02-$0.03. While Mobile Devices performance was unacceptable, Networks and Enterprise and Connected Home Solutions performed well. Motorola expects gradual improvements in the second half of 2007 and to be profitable for the full year.
Q4 2007 Earnings Press Release and Financial Tablesfinance7
Motorola reported fourth-quarter sales of $9.65 billion and a net earnings of $0.04 per share, including charges that reduced earnings by $0.09 per share. For the full year, Motorola reported sales of $36.6 billion and a net loss of $0.02 per share, including charges that reduced earnings by $0.29 per share. Mobile Devices sales declined 38% in the quarter and 33% for the full year, while Home and Networks Mobility and Enterprise Mobility Solutions continued strong performance. Motorola expects a first-quarter loss from continuing operations of $0.05 to $0.07 per share.
Q3 2008 Earnings Press Release and Financial Tablesfinance7
Motorola reported third quarter 2008 financial results. Sales were $7.5 billion. The company had a net loss of $397 million but positive operating cash flow of $180 million. Key highlights included a loss in Mobile Devices but increased earnings in Home and Networks Mobility and Enterprise Mobility Solutions. Motorola expects earnings per share of $0.02 to $0.04 in Q4 2008 and $0.05 to $0.07 for the full year.
- Net operating revenues increased 7% year-over-year to $10.4 billion in Q4 2006 and increased 7% to $41 billion for full-year 2006 compared to pro forma 2005.
- Adjusted OIBDA increased 13% to $3.2 billion in Q4 2006 and increased 12% to $12.7 billion for full-year 2006 compared to pro forma 2005.
- Diluted EPS from continuing operations was $0.09 in Q4 2006 compared to break-even in Q4 2005, and was $0.34 for full-year 2006 compared to $0.40 for full-year 2005.
Kodak reported significantly improved second quarter operating results with a $121 million year-over-year improvement in pre-tax results from continuing operations. Digital earnings improved by $97 million and traditional earnings improved by $31 million as expenses declined. Gross profit margins increased across all major business units driven by reduced costs. Kodak reaffirmed its full-year goals for net cash generation, digital revenue growth, and digital earnings.
- Sprint Nextel reported first quarter 2006 results with strong wireless demand and 1.3 million net subscriber additions. Revenue increased 66% year-over-year to $11.5 billion.
- Wireless revenue grew 13% to $8.5 billion with Adjusted OIBDA increasing 15% and margins improving. Long distance revenue declined 3% while local revenue grew 1%.
- The company added 84,000 net DSL subscribers and continued progress on strategic initiatives including the planned spin-off of the local business under the EMBARQ brand.
- Second quarter revenue increased 76% year-over-year to $10 billion due to growth in wireless segment offset by decline in long distance. Adjusted operating income was $865 million.
- Wireless segment saw 8% revenue growth driven by larger subscriber base but this was offset by lower ARPU and migrations to lower price plans. Adjusted OIBDA for wireless increased 11% to $2.94 billion.
- In response to slower growth, the company announced actions to improve competitiveness including adjusting credit policies, marketing initiatives, product innovation, and operational restructuring to generate annual savings of $0.07-0.08 EPS. The company also authorized a $6 billion share buyback over 18 months.
1) The company reported strong first quarter 2008 results with revenue increasing 14% to $8.4 billion and operating cash flow growing 15% to $3.2 billion.
2) Cable revenue increased 10% to $7.9 billion driven by growth in high-speed internet and phone subscribers, while advertising revenue saw continued softness.
3) The company returned 142% of free cash flow to shareholders through $1 billion in stock repurchases and dividend payments, demonstrating its commitment to enhancing shareholder value.
- Microsoft reported fiscal Q4 2005 revenue of $10.2 billion, a 9% increase over the previous year. Operating income was $3 billion including legal charges and stock-based compensation.
- Server and tools revenue grew 16% driven by strong demand for flagship server products like SQL Server. Client revenue grew 10% from higher OEM sales.
- For fiscal Q1 2006, Microsoft expects revenue of $9.7-9.8 billion, operating income of $4.3-4.5 billion, and EPS of $0.29-0.31. For fiscal 2006, guidance is for revenue of $43.7-44.5 billion and EPS of $1.27-
Internap reported financial results for the fourth quarter of 2014, with consolidated revenue increasing 14% year-over-year. Data center services revenue grew 23% year-over-year and now makes up 73% of total revenue, driven by a strategic shift toward higher-margin data center services. Adjusted EBITDA increased 45% year-over-year due to favorable revenue mix and tight cost controls, with adjusted EBITDA margin expanding 590 basis points. Management expects continued revenue and profit growth in 2015 through leveraging data center capacity expansions and migrating customers to new infrastructure.
Sprint Nextel reported financial results for the first quarter of 2008, with consolidated revenues declining 8% year-over-year to $9.3 billion due to lower contributions from Wireless. Wireless revenues fell 9% to $8 billion as average revenue per user and subscriber numbers declined. Wireline revenues grew 2% to $1.6 billion on strong demand for IP services. The company reported a net loss of $505 million for the quarter and saw post-paid subscriber losses of over 1 million. Sprint focused on improving the customer experience and reducing costs, while making progress on wireless integration goals.
Texas Instruments reported financial results for the 4th quarter and full year of 2008. Revenue declined 30% from the previous year's 4th quarter to $2.49 billion due to weakness in all segments. Net income was $107 million compared to $753 million in the prior year. For the full year, revenue declined 10% to $12.5 billion and net income fell 27% to $1.92 billion. TI is reducing expenses through layoffs and plant closures in response to the weakened global economy and reduced demand.
Juniper Networks reported its financial results for Q2 2013. Revenue increased 7% year-over-year to $1.15 billion. Non-GAAP operating margin was 18.9% and non-GAAP diluted EPS increased 10% year-over-year to $0.29. The company provided guidance for Q3 2013 of revenue between $1.14-1.18 billion and non-GAAP EPS of $0.29-0.32.
This presentation summarizes Internap's 3rd quarter 2016 earnings results. Revenue declined year-over-year primarily due to lower IP connectivity pricing and customer churn. The company reported a large net loss that included a non-cash goodwill impairment charge. Looking forward, the new CEO plans to improve operations, cut costs, and explore ways to recapitalize the business in order to focus on growth. Financial guidance for 2016 was reaffirmed with some minor adjustments to revenue and adjusted EBITDA expectations.
Juniper Networks reported strong financial results for Q4 2013 with record revenue and earnings growth. Revenue for Q4 2013 increased 7% quarter-over-quarter and 12% year-over-year to $1.27 billion. Non-GAAP diluted earnings per share for Q4 2013 was $0.43, up $0.10 from the previous quarter and $0.15 from the same quarter a year ago. For the full year 2013, revenue increased 7% to $4.67 billion while non-GAAP diluted EPS increased $0.43 to $1.28. Juniper expects revenue for Q1 2014 to be between $1.12 billion to $1.16 billion and non-GA
Cincinnati Bell reported second quarter 2012 results with the following highlights:
- Revenue was $368 million, a 1% increase over Q1 2012. Adjusted EBITDA was $140 million, up from $137 million in Q2 2011.
- CyrusOne data center colocation revenue increased 20% year-over-year to $54 million.
- Wireline revenue was flat at $184 million compared to Q2 2011. Fioptics revenue grew 43% and helped offset access line losses.
- Wireless revenue decreased due to fewer subscribers but Adjusted EBITDA margin improved to a high of 39%.
BlackBerry reported financial results for the fourth quarter and fiscal year 2013. For Q4, revenue was $2.7 billion with income of $94 million. For fiscal 2013, revenue declined 40% to $11.1 billion with a net loss of $628 million. BlackBerry shipped 6 million smartphones in Q4 including 1 million BlackBerry 10 devices and expects to approach breakeven results in Q1 2014 with increased marketing investment for the BlackBerry 10 launch. Mike Lazaridis will retire from BlackBerry's board effective May 1, 2013.
- Cree reported revenue of $131.1 million for its third quarter of fiscal year 2009, a 5% increase from the same quarter last year. Net income was $4 million, down 29% from the prior year.
- On a non-GAAP basis, net income was $11.8 million, down slightly from $12 million in the previous year. Cash flow from operations was $49.9 million.
- For the fourth quarter of fiscal 2009, Cree expects revenue in the range of $137-143 million and non-GAAP earnings per share of $0.13 to $0.15.
This presentation contains forward-looking statements, including our expectations for revenue, adjusted EBITDA and capital expenditures in 2016 and our ability to deliver growth from our high-performance, hybridized Internet infrastructure services.
Telecom Italia 1H 2013 Results - Franco BernabèGruppo TIM
Telecom Italia Group reported financial results for the first half of 2013. Revenues declined 2.7% to 13.8 billion euros due to decreases in the domestic market. EBITDA fell 6.8% to 5.4 billion euros, with declines in the domestic market partially offset by growth in Brazil. Net financial debt increased slightly to 28.8 billion euros. The company updated guidance and confirmed its debt reduction target while providing details on expected regulatory developments regarding its fixed network separation project.
- TRW reported financial results for the 4th quarter and full year of 2008. 4th quarter sales were $2.8 billion, down 28% from the previous year, and full year sales were $15 billion, up 2%.
- The company reported a 4th quarter net loss of $946 million and a full year net loss of $779 million due to asset impairments and restructuring charges. Excluding special items, the 4th quarter net loss was $74 million and full year net earnings were $153 million.
- Cash flow from operations was $769 million for the 4th quarter and $773 million for the full year. Free cash flow was $625 million and $291 million respectively.
direc tv group Fourth Quarter 2008 Financial Results and Outlook finance15
The DIRECTV Group reported strong financial results for Q4 2008 and full year 2008:
- Q4 net subscriber additions totaled 461,000, with 301,000 from DIRECTV US. Full year 2008 free cash flow increased 76% to $1.68 billion.
- DIRECTV US had its best quarterly net subscriber growth in over 3 years and record annual revenue, operating profit before depreciation and amortization, and cash flow.
- DIRECTV Latin America added 160,000 subscribers in Q4, its best year ever with 623,000 net additions, driving revenue growth of 15% for the quarter and 39% for the full year.
- Juniper Networks reported financial results for Q2 2014 with total revenue of $1.229 billion, a 7% increase year-over-year.
- Non-GAAP operating margin was 22.3%, an improvement of 3.4 percentage points from the previous year.
- Net income increased 28% year-over-year to $190 million, with non-GAAP EPS of $0.40, up $0.11 from the previous year.
- Comcast reported increased revenue, operating cash flow, and operating income for Q1 2009 compared to Q1 2008. Revenue grew 5% to $8.8 billion while operating cash flow grew 8% to $3.4 billion and operating income grew 16% to $1.8 billion.
- EPS grew 13% to $0.27 per share from $0.24 in Q1 2008. Adjusted EPS, which excludes a one-time gain, grew 42% to $0.27.
- Free cash flow increased 95% to $1.4 billion driven by lower capital expenditures and growth in operating cash flow.
- Keynote Systems reported financial results for its fiscal first quarter ended December 31, 2008, with total revenue increasing 16.5% year-over-year to $20.6 million.
- Net income improved to $0.06 per diluted share compared to a net loss of $0.04 per share in the prior year. Non-GAAP earnings were $0.18 per diluted share versus $0.06 in the previous year.
- The company exceeded revenue and earnings guidance for the quarter and generated positive operating cash flow and free cash flow.
TRW Automotive Holdings Corp. reported first quarter 2008 financial results with sales of $4.1 billion, a 16.2% increase over the same period in 2007. Net earnings were $94 million or $0.92 per diluted share, compared to a net loss of $86 million or $0.87 per share in 2007. The company increased its full year 2008 sales outlook to a range of $16.2 to $16.6 billion and net earnings per share outlook to a range of $2.30 to $2.60.
Fiscal 2005 was a successful year for Rockwell Automation. Sales increased 11% to $5 billion and earnings per share grew 50% to $2.77. The company continued executing its strategy of investing in organic growth initiatives while maintaining cost productivity. This includes enhancing its Logix control platform, expanding into new industries and markets globally, and deepening relationships with customers. Rockwell Automation is well positioned for continued growth and shareholder value creation through its balanced focus on technology leadership, market expansion, and operational excellence.
The document summarizes CNO Financial Group's 4Q13 financial and operating results. Key points include:
- Businesses continued performing well with sales, premium, and earnings growth.
- Returning value to shareholders while continuing on path to investment grade status.
- Completed an OCB long-term care reinsurance transaction that reduced LTC exposure by 12% and was accretive to earnings.
- Investments in distribution channels drove consolidated sales growth of 6% for 2013.
- 4Q and full year results showed strength in annuity margins, investment returns, and OCB performance.
- Capital and liquidity positions remained strong with deployable capital of $160 million.
Altria Group reported its 2007 second quarter results. Reported diluted EPS from continuing operations was up 5.0% to $1.05, including charges of $0.12 per share. Adjusted diluted EPS excluding charges was up 9.5% to $1.15. Full-year 2007 guidance was revised to $4.05-$4.10 diluted EPS from continuing operations. PM USA operating income declined due to $318 million in charges from closing a manufacturing plant but adjusted income was up 1.6%. PMI international cigarette shipment volume was up 3.3% excluding acquisitions.
Q3 2003 Motorola Inc. Earnings Conference Call Presentationfinance7
- Motorola reported Q3 2003 earnings with total sales of $6.8 billion, a 4.5% increase over Q3 2002. Earnings per share remained flat at $0.06 excluding special items.
- Gross margin declined due to increased handset competition and pricing pressures in Asia combined with sales of discontinued low-margin products. However, SG&A and R&D expenses as a percentage of sales improved.
- Operating margin remained flat at 4.4% compared to Q3 2002. Cash flow was strong with $1.1 billion in operating cash flow and $0.9 billion in free cash flow.
Supervalu operates grocery retail stores and provides food distribution and logistics services. In fiscal year 2005, Supervalu had 1,549 retail stores, served as the primary supplier to 2,300 retail stores, and as a secondary supplier to 700 additional stores. Supervalu focuses on retail growth through new store development, remodels, licensee growth, and acquisitions. In 2005, Supervalu acquired Total Logistics, a third-party logistics provider, and added 66 net new retail stores. Supervalu aims to leverage its distribution operations by providing additional logistics and service solutions through an efficient supply chain.
Motorola's 2003 annual report highlights opportunities in multiple areas:
1) Personal communications including 3G handsets and push-to-talk over cellular.
2) Networking through equipment sales to major telecom operators and new switching technology.
3) Mission-critical communications for public safety and enterprises.
4) Emerging technologies like wireless home networking, mobile broadband, and automotive electronics.
Motorola held an earnings conference call on January 22, 2003 to discuss its Q4 2002 results. The call included a presentation with 21 slides covering key financial metrics and forecasts. Motorola exceeded expectations for Q4 sales and earnings per share. All major segments were profitable excluding special items, with the largest improvements in Consumer and Government & Industrial Solutions segments. Motorola also improved its cash position and reduced debt levels compared to prior periods. Looking ahead, Motorola forecast positive operating and free cash flow for 2003.
Motorola reported strong financial results for the second quarter of 2004, with sales increasing 41% compared to the second quarter of 2003. However, Motorola reported a net loss due to a large non-cash tax expense related to the IPO of Freescale Semiconductor. Excluding this tax expense, pre-tax earnings increased significantly. All of Motorola's business segments saw sales increases, with the Personal Communications segment experiencing the largest growth. Motorola provided guidance for the third quarter of 2004 with sales expected to increase 25-30% and earnings per share of $0.15 to $0.19.
Q2 2007 Earnings Release and Financial Tablesfinance7
Motorola reported second quarter sales of $8.7 billion. While sales increased for its Home and Networks Mobility and Enterprise Mobility Solutions segments, overall sales and earnings declined from the prior year due to lower mobile device shipments. Motorola expects financial results to improve in the second half of the year due to cost reductions and new product launches, but does not expect its Mobile Devices business to be profitable for the full year.
Motorola reported record quarterly and annual sales and shipments. For the fourth quarter, sales were $11.8 billion, up 17% from the previous year. Shipments of mobile devices totaled 65.7 million units. Earnings from continuing operations were $0.21 per share, including charges. For the full year, sales reached a record $42.9 billion, up 22% compared to 2005. Motorola shipped a record 217.4 million mobile devices and expects first quarter 2007 sales to be between $10.4-10.6 billion.
Q2 2008 Earnings Press Release and Financial Tablesfinance7
Motorola reported second-quarter financial results that exceeded expectations, with sales of $8.1 billion and positive operating cash flow of $204 million. The Home and Networks Mobility and Enterprise Mobility Solutions segments saw sales and operating earnings growth compared to the previous year. Mobile Devices shipped 28.1 million handsets and maintained market share, while launching 10 new products globally. The company expects earnings per share of $0.00 to $0.02 for the third quarter and $0.06 to $0.08 for the full year.
Motorola announced record second quarter sales and earnings, with sales up 17% to $8.83 billion and earnings per share up 52% to $0.38. Mobile device shipments reached a record 33.9 million units, representing 18.1% of the global market. All four of Motorola's business segments grew profitability. For the third quarter, Motorola expects sales between $8.9-9.1 billion and earnings per share of $0.27-0.29.
Q4 2008 Earnings Press Release and Financial Tablesfinance7
Motorola reported financial results for the fourth quarter of 2008 with $7.1 billion in sales and a GAAP net loss of $3.6 billion or $1.57 per share. For the full year 2008, Motorola had $30.1 billion in sales and a net loss of $4.2 billion or $1.84 per share. Motorola generated $201 million in positive operating cash flow for the fourth quarter. Motorola also announced cost-reduction actions of $1.5 billion for 2009 in response to economic challenges.
motorola Q4 2008 Earnings Press Release and Financial Tablesfinance7
Motorola reported financial results for the fourth quarter of 2008 with $7.1 billion in sales and a GAAP net loss of $3.6 billion or $1.57 per share. The company implemented cost reduction actions of approximately $1.5 billion for 2009 in response to economic challenges. Mobile Devices sales were $2.35 billion with an operating loss of $595 million, while Home and Networks Mobility operating earnings increased 34% to $257 million on sales of $2.6 billion. The company expects cost savings of more than $1.2 billion from Mobile Devices restructuring in 2009.
Motorola announced record third-quarter sales of $10.6 billion, up 17% year-over-year. Net earnings were $0.39 per share including $0.10 from discontinued operations. Mobile Devices sales increased 26% to $7.03 billion with operating earnings of $819 million. Networks and Enterprise sales rose slightly to $2.78 billion with operating earnings of $378 million. Connected Home Solutions sales increased 9% to $812 million with operating earnings of $21 million. Motorola expects fourth-quarter sales between $11.8-12.1 billion.
Q3 2007 Earnings Press Release and Financial Tablesfinance7
Motorola reported third quarter sales of $8.8 billion and GAAP earnings of $0.02 per share. While Mobile Devices sales decreased 36% year-over-year, the business showed financial improvements. Enterprise Mobility Solutions sales grew 47% year-over-year and operating earnings increased despite charges. The company expects fourth quarter earnings per share between $0.12-$0.14.
This document summarizes Intel's fourth-quarter and annual financial results for 2008. Some key points:
- Fourth-quarter revenue was $8.2 billion, down 19% sequentially and 23% year-over-year.
- Annual revenue was $37.6 billion, down 2% year-over-year but up slightly adjusted for divestitures.
- Gross margin declined to 53% in Q4, down from 59% in Q3, due to higher factory underutilization and inventory write-offs.
- For 2009, Intel expects revenue to be around $7 billion in Q1 with gross margins in the low 40s, and spending of $10.4-10.6 billion
Motorola announced record second quarter sales and earnings. Key highlights included:
- Record quarterly sales of $10.88 billion, up 29% from the previous year.
- Earnings of $0.55 per share, up 46% and 49% from the previous year.
- Record handset shipments of 51.9 million units and global handset market share of 22%.
- Mobile Devices segment set new records for unit shipments, sales, and profits.
Intel reported record quarterly revenue of $10.7 billion for Q4 2007, up 10.5% year-over-year. Net income was $2.3 billion, up 51% from Q4 2006. For the full year 2007, operating income grew 45% to $8.2 billion on revenue of $38.3 billion, an 8% increase. Looking ahead, Intel expects Q1 2008 revenue to be between $9.4-10 billion and gross margin of 56% plus or minus a couple points.
Motorola reported financial results for the first quarter of 2004 with sales of $8.6 billion, up 42% from the previous year, and net earnings of $609 million, up 257% over the previous year. The company ended the quarter with a net cash position of $902 million, the first time in over 35 years. Motorola provided guidance for the second quarter of 2004 of sales between $8.2-8.6 billion and earnings per share of $0.14-0.18, excluding potential impacts from the proposed IPO of its semiconductor business.
- Motorola reported record first-quarter sales of $10.01 billion, up 23% from the previous year, and earnings per share of $0.27.
- Key results included record handset shipments of 46.1 million units and global handset market share of 21%.
- The Mobile Devices segment saw sales increase 45% and operating earnings increase 59% due to strong handset sales and market share gains.
- Motorola announced plans to sell its automotive business and streamline operations to improve efficiency and reduce costs.
This document summarizes Kodak's preliminary Q4 2008 financial results and actions being taken in response to the global recession. Key points:
- Q4 sales declined 24% to $2.433B due to declines in digital (-23%) and traditional (-27%) businesses.
- Q4 loss from continuing operations was $133M; full year earnings were $54M (results are preliminary pending impairment assessments).
- Kodak is aligning its cost structure to current economic conditions through executive pay cuts, expense reductions, and job cuts.
intel Second Quarter 2007 Earnings Releasefinance6
- Intel reported second-quarter revenue of $8.7 billion, up 8% year-over-year, with operating income of $1.35 billion and net income of $1.3 billion.
- For the third quarter, Intel expects revenue between $9.0-9.6 billion with a gross margin of 52% plus or minus a couple points.
- For 2007, Intel expects gross margin of 51% plus or minus a few points and capital spending of $4.9 billion plus or minus $200 million.
- Intel reported first-quarter revenue of $8.9 billion, operating income of $1.7 billion, and earnings per share of 23 cents. Excluding share-based compensation, operating income was $2.1 billion and EPS was 27 cents.
- Revenue declined 5% year-over-year and 12% sequentially due to moderating PC growth rates leading to slower chip-level inventory reductions and affecting revenue.
- The outlook for the second quarter expects revenue between $8.0-8.6 billion and gross margin of 49%, plus or minus a couple points.
Motorola reported record third quarter sales and earnings. Sales increased 26% to $9.42 billion and earnings per share increased 283% to $0.69. Mobile device shipments reached a record 38.7 million units and global market share increased 5.5 percentage points to 19%. All four of Motorola's business segments grew profitably with the mobile devices segment achieving a record $5.6 billion in sales. Motorola provided an outlook for fourth quarter 2005 sales between $10.3-10.5 billion and earnings per share of $0.32-0.34.
Intel reported fourth quarter revenue of $9.7 billion, operating income of $1.5 billion, and earnings per share of $0.26. For the full year 2006, Intel achieved revenue of $35.4 billion, operating income of $5.7 billion, net income of $5 billion and earnings per share of $0.86. Key highlights included record microprocessor and flash unit sales, and record mobile and server microprocessor revenue. For the first quarter of 2007, Intel expects revenue between $8.7-9.3 billion and earnings per share of approximately $0.30.
Intel reported third quarter revenue of $8.7 billion, a 12% decrease from the previous year. Operating income was $1.4 billion and earnings per share were 22 cents. Record shipments of mobile and server microprocessors drove results. Looking forward, Intel expects fourth quarter revenue between $9.1-9.7 billion and gross margin around 50%, and provided additional financial forecasts. Key risks include intense competition, transition to new manufacturing processes, and demand variability.
- Net revenues for the company increased 28.8% to R$367 million in the first quarter of 2012 compared to the same period in 2011. EBITDA grew 15% to R$9 million for the quarter.
- Two subsequent transactions were completed in April where Ideiasnet sold its stakes in two companies.
- Results were mixed among subsidiaries, with some experiencing revenue and profit growth while others faced challenges from delays, exchange rates, or changes in strategy and client mix.
Return on total capital for the trailing 12 months ended June 28, 2008 was 20.8%. Net earnings for the 4 fiscal quarters spanning September 29, 2007 to June 28, 2008 totaled $1,104,607. The average total capital over the last 5 quarters, consisting of long-term debt, short-term debt, and equity, was $5,303,913. Return on capital was calculated by taking net earnings for the 12 month period and dividing by the average total capital.
This document is Sysco Corporation's 2000 annual report. It summarizes that fiscal 2000 was Sysco's 30th anniversary as a public company and marked record sales of $19.3 billion, up 11% from the previous fiscal year. Key drivers of growth were increased sales to customers served by Sysco marketing associates and continued growth of Sysco Brand sales. The report discusses Sysco's strategy of pursuing both acquisitions and internal expansion to continue driving future success through offering customers a breadth of products and superior service.
1) SYSCO reported strong sales and earnings growth in fiscal year 2001, with sales topping $20 billion for the first time.
2) Net earnings increased over 30% compared to the previous year, and return on shareholders' equity reached 31%.
3) Growth was driven by acquisitions, internal expansion, and a focus on customer relationships through initiatives like C.A.R.E.S.
SYSCO is a food distribution company that supplies over 415,000 customers like restaurants, hospitals, and schools. In fiscal year 2002, SYSCO reported $23.35 billion in sales, a 7% increase from the previous year. Net earnings increased 14% to $679.78 million compared to fiscal year 2001. SYSCO has over 46,800 employees and operates from 142 locations across North America, helping their customers succeed by providing food and related products and services.
This annual report summarizes Sysco Corporation's financial performance for fiscal year 2003. Key highlights include:
- Sales increased 12% to $26.14 billion and net earnings increased 14% to $778.28 million.
- Diluted earnings per share increased 17% to $1.18.
- Return on average shareholders' equity was 36%.
- The company distributed products from 145 locations across North America to over 420,000 customer locations.
This document provides an annual report for Sysco Corporation for the fiscal year ending July 3, 2004. It includes financial highlights showing sales increased 12% to $29.3 billion and net earnings increased 17% to $907 million. It discusses challenges in the year from high product cost inflation of 6.3% and fuel costs. It outlines Sysco's focus on growing profitable customer businesses and improving customer relationships. It describes Sysco's national supply chain initiative including new regional distribution centers to enhance service and reduce costs. In closing, it expresses confidence in addressing economic uncertainty through its employees, products/services, and financial resources.
The passage discusses the importance of summarization in an age of information overload. It notes that with the massive amounts of data available online, being able to quickly understand the key points of lengthy documents, articles, or reports is crucial. The ability to produce clear, concise summaries helps people filter through large amounts of information and identify what is most important or relevant to them.
- SYSCO achieved record sales of $37.5 billion and record net earnings of $1.1 billion in fiscal year 2008 despite challenging economic conditions.
- The company's focus on supply chain efficiency and helping customers succeed through business reviews allowed it to contain costs while growing market share.
- SYSCO continues to invest in its business, people, facilities, fleet and technology to support long-term growth while exploring alternative energy sources.
This document summarizes reconciling items for 2001 by quarter and fiscal year. It reports reorganization costs of $19.1 million in Q2 2001, $11.7 million in Q3 2001, and $10.6 million in Q4 2001 for workforce reductions and facility consolidations worldwide. Special items include a $19.4 million write-off in Q3 2001 and $3.5 million impairment charge in Q4 2001. The total net reconciling items after tax was $42.1 million for fiscal year 2001.
This document shows the reconciliation between GAAP and non-GAAP operating income for different regions and worldwide for 2001. For each quarter and the full year, it provides the operating income under GAAP and non-GAAP measurements, as well as the reconciling items between the two. On a non-GAAP basis, operating income margins ranged from -1.25% to 1.23% by region for the full year.
This document provides a reconciliation of GAAP to non-GAAP financial metrics for 2001. For each quarter and full year, it shows gross sales, gross profit, operating expenses, operating income, net income, and diluted EPS under GAAP and non-GAAP after adjusting for reconciling items. The reconciling items reduced operating expenses and increased operating income, net income, and diluted EPS for the non-GAAP results compared to GAAP.
This document summarizes reconciling items for 2002 by quarter and fiscal year total. It includes reorganization costs, other major program costs, gains/losses on securities sales, and tax effects. Total net reorganization and other major program costs for the fiscal year were $116.6 million. A $280.9 million cumulative effect of a new accounting standard adoption was also recorded. The total net impact of reconciling items for the fiscal year was $350.2 million.
The document shows the reconciliation between GAAP and non-GAAP operating income for North America, Europe, Asia-Pacific, Latin America, and worldwide total for Q1 2002 through FY 2002. It provides the operating income under GAAP and non-GAAP measurements, as well as the reconciling items and non-GAAP operating income as a percentage of revenue for each region and time period.
This document provides a reconciliation of net income and earnings per share (EPS) between Generally Accepted Accounting Principles (GAAP) and non-GAAP measures for 4 quarters (Q1 2002 - Q4 2002) and the full fiscal year 2002 for an unnamed company. It shows that reconciling items reduced operating expenses and increased operating income, net income, and EPS under the non-GAAP measures compared to the GAAP measures.
This document summarizes reconciling items for 2003, including reorganization costs and other major program costs by quarter. Total reorganization costs for the year were $21.6 million. Other costs included in selling, general and administrative expenses were $23.3 million and costs of sales were $0.5 million. Pre-tax items totaled $45.4 million for the year. A favorable tax resolution of $70.5 million occurred in Q3 03. The total net effect was a $39.6 million benefit.
This document shows the operating income for different regions and worldwide both according to GAAP (Generally Accepted Accounting Principles) standards and on a non-GAAP basis for Q1 2003, Q2 2003, Q3 2003, Q4 2003 and FY 2003. It provides the figures in US dollars and also shows the operating income as a percentage of revenue. The non-GAAP operating income is higher due to reconciling items which are additional costs excluded from the non-GAAP calculation.
This document presents a bridge between GAAP and non-GAAP financial results for a company for 2003. It shows GAAP and non-GAAP results for net income, earnings per share, gross profit, operating expenses, operating income, and sales on a quarterly and full year basis. Reconciling items between GAAP and non-GAAP results include adjustments to operating expenses that increased non-GAAP operating income and net income compared to GAAP.
This document summarizes reconciling items for 2004 by quarter and fiscal year. It includes reorganization costs, other major program costs, foreign exchange gains and losses, and tax effects. Reorganization costs were credits in Q3 and Q4 2004 due to lower than expected facility consolidation costs. Foreign exchange gains stemmed from a currency contract for an acquisition. A favorable tax resolution in Q3 and Q4 2004 reversed previously accrued federal and state income taxes. The total net tax effect for the fiscal year was a credit of $58.8 million.
The Rise of Generative AI in Finance: Reshaping the Industry with Synthetic DataChampak Jhagmag
In this presentation, we will explore the rise of generative AI in finance and its potential to reshape the industry. We will discuss how generative AI can be used to develop new products, combat fraud, and revolutionize risk management. Finally, we will address some of the ethical considerations and challenges associated with this powerful technology.
Lecture slide titled Fraud Risk Mitigation, Webinar Lecture Delivered at the Society for West African Internal Audit Practitioners (SWAIAP) on Wednesday, November 8, 2023.
Turin Startup Ecosystem 2024 - Ricerca sulle Startup e il Sistema dell'Innov...Quotidiano Piemontese
Turin Startup Ecosystem 2024
Una ricerca de il Club degli Investitori, in collaborazione con ToTeM Torino Tech Map e con il supporto della ESCP Business School e di Growth Capital
5 Tips for Creating Standard Financial ReportsEasyReports
Well-crafted financial reports serve as vital tools for decision-making and transparency within an organization. By following the undermentioned tips, you can create standardized financial reports that effectively communicate your company's financial health and performance to stakeholders.
What price will pi network be listed on exchangesDOT TECH
The rate at which pi will be listed is practically unknown. But due to speculations surrounding it the predicted rate is tends to be from 30$ — 50$.
So if you are interested in selling your pi network coins at a high rate tho. Or you can't wait till the mainnet launch in 2026. You can easily trade your pi coins with a merchant.
A merchant is someone who buys pi coins from miners and resell them to Investors looking forward to hold massive quantities till mainnet launch.
I will leave the what's app number of my personal pi vendor to trade with.
+12349014282
^%$Zone1:+971)581248768’][* Legit & Safe #Abortion #Pills #For #Sale In #Duba...mayaclinic18
Whatsapp (+971581248768) Buy Abortion Pills In Dubai/ Qatar/Kuwait/Doha/Abu Dhabi/Alain/RAK City/Satwa/Al Ain/Abortion Pills For Sale In Qatar, Doha. Abu az Zuluf. Abu Thaylah. Ad Dawhah al Jadidah. Al Arish, Al Bida ash Sharqiyah, Al Ghanim, Al Ghuwariyah, Qatari, Abu Dhabi, Dubai.. WHATSAPP +971)581248768 Abortion Pills / Cytotec Tablets Available in Dubai, Sharjah, Abudhabi, Ajman, Alain, Fujeira, Ras Al Khaima, Umm Al Quwain., UAE, buy cytotec in Dubai– Where I can buy abortion pills in Dubai,+971582071918where I can buy abortion pills in Abudhabi +971)581248768 , where I can buy abortion pills in Sharjah,+97158207191 8where I can buy abortion pills in Ajman, +971)581248768 where I can buy abortion pills in Umm al Quwain +971)581248768 , where I can buy abortion pills in Fujairah +971)581248768 , where I can buy abortion pills in Ras al Khaimah +971)581248768 , where I can buy abortion pills in Alain+971)581248768 , where I can buy abortion pills in UAE +971)581248768 we are providing cytotec 200mg abortion pill in dubai, uae.Medication abortion offers an alternative to Surgical Abortion for women in the early weeks of pregnancy. Zone1:+971)581248768’][* Legit & Safe #Abortion #Pills #For #Sale In #Dubai Abu Dhabi Sharjah Deira Ajman Fujairah Ras Al Khaimah%^^%$Zone1:+971)581248768’][* Legit & Safe #Abortion #Pills #For #Sale In #Dubai Abu Dhabi Sharjah Deira Ajman Fujairah Ras Al Khaimah%^^%$Zone1:+971)581248768’][* Legit & Safe #Abortion #Pills #For #Sale In #Dubai Abu Dhabi Sharjah Deira Ajman Fujairah Ras Al Khaimah%^^%$Zone1:+971)581248768’][* Legit & Safe #Abortion #Pills #For #Sale In #Dubai Abu Dhabi Sharjah Deira Ajman Fujairah Ras Al Khaimah%^^%$Zone1:+971)581248768’][* Legit & Safe #Abortion #Pills #For #Sale In #Dubai Abu Dhabi Sharjah Deira Ajman Fujairah Ras Al Khaimah%^^%$Zone1:+971)581248768’][* Legit & Safe #Abortion #Pills #For #Sale In #Dubai Abu Dhabi Sharjah Deira Ajman Fujairah Ras Al Khaimah%^^%$Zone1:+971)581248768’][* Legit & Safe #Abortion #Pills #For #Sale In #Dubai Abu Dhabi Sharjah Deira Ajman Fujairah Ras Al Khaimah%^^%$Zone1:+971)581248768’][* Legit & Safe #Abortion #Pills #For #Sale In #Dubai Abu Dhabi Sharjah Deira Ajman Fujairah Ras Al Khaimah%^^%$Zone1:+971)581248768’][* Legit & Safe #Abortion #Pills #For #Sale In #Dubai Abu Dhabi Sharjah Deira Ajman Fujairah Ras Al Khaimah%^^%$Zone1:+971)581248768’][* Legit & Safe #Abortion #Pills #For #Sale In #Dubai Abu Dhabi Sharjah Deira Ajman Fujairah Ras Al Khaimah%^^%$Zone1:+971)581248768’][* Legit & Safe #Abortion #Pills #For #Sale In #Dubai Abu Dhabi Sharjah Deira Ajman Fujairah Ras Al Khaimah%^^%$Zone1:+971)581248768’][* Legit & Safe #Abortion #Pills #For #Sale In #Dubai Abu Dhabi Sharjah Deira Ajman Fujairah Ras Al Khaimah%^^%$Zone1:+971)581248768’][* Legit & Safe #Abortion #Pills #For #Sale In #Dubai Abu Dhabi Sharjah Deira Ajman Fujairah Ras Al Khaimah%^^%$Zone1:+971)581248768’][* Legit & Safe #Abortion #Pills #For #Sale In #Dubai Abu Dhabi Sharjah Deira Ajman
1. Elemental Economics - Introduction to mining.pdfNeal Brewster
After this first you should: Understand the nature of mining; have an awareness of the industry’s boundaries, corporate structure and size; appreciation the complex motivations and objectives of the industries’ various participants; know how mineral reserves are defined and estimated, and how they evolve over time.
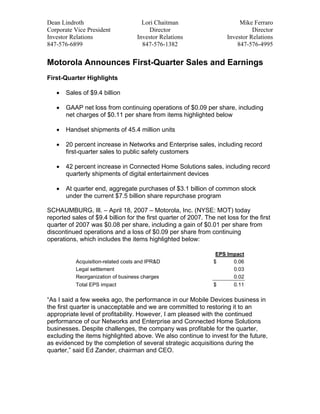
1. Dean Lindroth Lori Chaitman Mike Ferraro
Corporate Vice President Director Director
Investor Relations Investor Relations Investor Relations
847-576-6899 847-576-1382 847-576-4995
Motorola Announces First-Quarter Sales and Earnings
First-Quarter Highlights
• Sales of $9.4 billion
• GAAP net loss from continuing operations of $0.09 per share, including
net charges of $0.11 per share from items highlighted below
• Handset shipments of 45.4 million units
• 20 percent increase in Networks and Enterprise sales, including record
first-quarter sales to public safety customers
• 42 percent increase in Connected Home Solutions sales, including record
quarterly shipments of digital entertainment devices
• At quarter end, aggregate purchases of $3.1 billion of common stock
under the current $7.5 billion share repurchase program
SCHAUMBURG, Ill. – April 18, 2007 – Motorola, Inc. (NYSE: MOT) today
reported sales of $9.4 billion for the first quarter of 2007. The net loss for the first
quarter of 2007 was $0.08 per share, including a gain of $0.01 per share from
discontinued operations and a loss of $0.09 per share from continuing
operations, which includes the items highlighted below:
EPS Impact
Acquisition-related costs and IPR&D $ 0.06
Legal settlement 0.03
Reorganization of business charges 0.02
Total EPS impact $ 0.11
“As I said a few weeks ago, the performance in our Mobile Devices business in
the first quarter is unacceptable and we are committed to restoring it to an
appropriate level of profitability. However, I am pleased with the continued
performance of our Networks and Enterprise and Connected Home Solutions
businesses. Despite challenges, the company was profitable for the quarter,
excluding the items highlighted above. We also continue to invest for the future,
as evidenced by the completion of several strategic acquisitions during the
quarter,” said Ed Zander, chairman and CEO.
2. “We also continued our ongoing efforts to return capital to our shareholders by
accelerating the repurchase of $2.0 billion of our shares under our current share
repurchase program. With these purchases, in less than two years we have
repurchased $7.1 billion of common stock out of a total authorized repurchase of
$11.5 billion,” noted Zander.
Operating Results
“Over the past several weeks, we have made progress on the steps we outlined
on March 21. In the Mobile Devices business, we are very focused on improving
operating cash flow and profitability. Across the company, the previously
announced cost reduction actions are on schedule. In addition, we are identifying
additional cost structure improvements while ensuring that we do not
compromise future growth opportunities,” said Greg Brown, president and COO.
Mobile Devices segment sales were $5.4 billion, down 15 percent compared
with the year-ago quarter. Excluding highlighted items, the segment incurred an
operating loss of $231 million, compared with operating earnings of $701 million
in the year-ago quarter. Lower sales and earnings are attributable to lower
overall unit volumes, particularly in the emerging markets and Europe. Motorola’s
share of the global handset market for the quarter is estimated to be 17.5%.
During the quarter, Mobile Devices:
• Shipped 45.4 million handsets
• Continued solid results in North America and Latin America
• Began shipping eight new products
• Announced several new products, including 3G MOTO Q, video-
optimized RIZR Z8, and music-enabled Linux/Java ROKR Z6
• Completed the acquisition of Good Technology
The company is pursuing aggressive actions to improve the performance of the
business, including:
• Streamlining the product portfolio, as evidenced by the discontinuation of
six legacy products during the quarter
• Continuing to carry out previously announced workforce reduction
initiatives
• Further implementing our strategy to utilize alternate source silicon
providers
• Continuing to introduce more devices based on Linux/Java™
• Rationalizing the segment’s product pricing structure and distribution
strategy
3. Networks and Enterprise segment sales were $3.0 billion, up 20 percent
compared with the year-ago quarter. Excluding highlighted items, operating
earnings were $343 million, compared with operating earnings of $328 million in
the year-ago quarter. Operating margin, excluding highlighted items, was 11.4
percent compared to 13.0 percent in the year-ago quarter.
During the quarter, Networks and Enterprise:
• Achieved double-digit sales growth in the Enterprise Mobility and Public
Safety businesses
• Accelerated WiMax momentum with additional trials
• Completed the acquisition of Symbol Technologies
Connected Home Solutions segment sales were $1.0 billion, up 42 percent
compared with the year-ago quarter. Excluding highlighted items, operating
earnings were $113 million, compared with operating earnings of $47 million in
the year-ago quarter. Operating margin, excluding highlighted items, was 10.9
percent compared to 6.4 percent in the year-ago quarter.
During the quarter, Connected Home Solutions:
• Achieved double-digit growth in sales and operating margin
• Set a quarterly record with 4.9 million digital entertainment device
shipments, including shipments of 1.1 million digital video recorders
• Shipped the company’s one millionth IPTV set top
• Reached the 500,000 video stream milestone, shipping to service
providers worldwide
• Completed the acquisitions of Netopia and Tut Systems
• Following the close of the quarter, began shipping digital cable set-tops
that support FCC-mandated separable security
Second-Quarter and Full Year 2007 Outlook
The company’s second-quarter outlook for sales is essentially flat with first
quarter 2007. The outlook for earnings per share in the second quarter is in the
range of $.02 to $.03. This outlook excludes any reorganization of business
charges associated with the company's operating expense reduction initiatives,
as well as any other items of the variety highlighted by the company in its
quarterly earnings releases.
The company expects to see gradual quarterly improvements in both sales and
operating margin in the second half of the year. The company expects the Mobile
Devices business to experience a gradual recovery in the second half and be
profitable for the full year. Overall for the full year, Motorola expects to be
profitable and to generate positive operating cash flow.
4. Conference Call and Webcast
Motorola will host its quarterly conference call beginning at 8:00 a.m. Eastern
Time (USA) on Wednesday, April 18th, 2007. The conference call will be web-
cast live with audio and slides at www.motorola.com/investor.
Consolidated GAAP Results
A comparison of results from operations is as follows:
First Quarter
(In millions, except per share amounts) 2007 2006
Net sales $ 9,433 $ 9,608
Gross margin 2,454 2,931
Operating earnings (loss) (366) 849
Earnings (loss) from continuing operations (218) 656
Net earnings (loss) (181) 686
Diluted earnings (loss) per common share:
Continuing operations $ (0.09) $ 0.26
Discontinued operations 0.01 0.01
$ (0.08) $ 0.27
Weighted average diluted common shares
Outstanding 2,372.3 2,553.6
Business Risks
This press release contains “forward-looking statements” as that term is defined in the Private
Securities Litigation Reform Act of 1995. Such forward-looking statements include, but are not
limited to, Motorola’s outlook for sales and earnings in the second quarter of 2007 and anticipated
profitability and operating cash flow for 2007. Motorola cautions the reader that the risk factors
below, as well as those on pages 16 through 24 in Item 1A of Motorola’s 2006 Annual Report on
Form 10-K and in its other SEC filings, could cause Motorola’s actual results to differ materially
from those estimated or predicted in the forward-looking statements. Factors that may impact
forward-looking statements include, but are not limited to: (1) the company’s ability to return to
profitability and increase market share in its wireless handset business; (2) the level of demand
for the company’s products, including products related to new technologies; (3) the company’s
ability to introduce new products and technologies in a timely manner; (4) the company’s ability to
continue generating meaningful savings from supply-chain improvements, manufacturing
consolidation and other cost-reduction initiatives; (5) the uncertainty of current economic and
political conditions, as well as the economic outlook for the telecommunications and broadband
industries; (6) the company’s ability to purchase sufficient materials, parts and components to
meet customer demand; (7) unexpected negative consequences from the company’s ongoing
restructuring and cost-reduction activities; (8) risks related to dependence on certain key
suppliers; (9) the impact on the company’s performance and financial results from strategic
acquisitions or divestitures, including those that may occur in the future; (10) risks related to the
company’s high volume of manufacturing and sales in Asia; (11) the creditworthiness of the
company’s customers, particularly purchasers of large infrastructure systems; (12) variability in
income generated from licensing the company’s intellectual property; (13) unexpected liabilities or
expenses, including unfavorable outcomes to any pending or future litigation or regulatory or
5. similar proceedings, including without limitation any relating to the Iridium project; (14) the timing
and levels at which design wins become actual orders and sales; (15) the impact of foreign
currency fluctuations; (16) the impact on the company from continuing hostilities in Iraq and
conflict in other countries; (17) the impact on the company from ongoing consolidation in the
telecommunications and broadband industries; (18) the impact of changes in governmental
policies, laws or regulations; (19) the outcome of currently ongoing and future tax matters; and
(20) unforeseen negative consequences from the company’s outsourcing of various activities,
including certain manufacturing, information technology and administrative functions. Motorola
undertakes no obligation to publicly update any forward-looking statement or risk factor, whether
as a result of new information, future events or otherwise.
Additional Information and Where to Find It
While Motorola does not believe that this communication constitutes solicitation material in
respect of Motorola’s solicitation of proxies in connection with its 2007 Annual Stockholders
Meeting, this communication may be deemed to be solicitation material. In connection with the
solicitation of proxies, Motorola has filed with the Securities and Exchange Commission (the
“SEC”) a definitive proxy statement on March 15, 2007 (the “Proxy Statement”). THE PROXY
STATEMENT CONTAINS IMPORTANT INFORMATION ABOUT MOTOROLA AND THE 2007
ANNUAL STOCKHOLDERS MEETING. MOTOROLA’S STOCKHOLDERS ARE URGED TO
READ THE PROXY STATEMENT CAREFULLY.
On March 19, 2007, Motorola began the process of mailing the Proxy Statement, together with a
WHITE proxy card. Stockholders may obtain additional free copies of the Proxy Statement and
other documents filed with the SEC by Motorola through the website maintained by the SEC at
www.sec.gov. The Proxy Statement and other relevant documents may also be obtained free of
charge from Motorola by contacting Investor Relations in writing at Motorola, Inc., 1303 E.
Algonquin Road, Schaumburg, IL 60196; or by phone at 1-800-262-8509; or by email at
investors@motorola.com. The Proxy Statement is also available on Motorola’s website at
www.motorola.com/investor. The contents of the websites referenced above are not deemed to
be incorporated by reference into the Proxy Statement. In addition, copies of the Proxy
Statement may be requested by contacting the company’s proxy solicitor, D.F. King & Co. Inc. by
phone toll-free at 1-800-488-8095.
Motorola and its directors and executive officers and other members of management and
employees may be deemed to be participants in the solicitation of proxies in connection with the
2007 Annual Stockholders Meeting. You can find information about Motorola’s executive officers
and directors in the Proxy Statement.
About Motorola
Motorola is known around the world for innovation and leadership in wireless and
broadband communications. Inspired by our vision of seamless mobility, the
people of Motorola are committed to helping you connect simply and seamlessly
to the people, information and entertainment that you want and need. We do this
by designing and delivering quot;must havequot; products, quot;must doquot; experiences and
powerful networks -- along with a full complement of support services. A Fortune
100 company with global presence and impact, Motorola had sales of US $42.9
billion in 2006. For more information about our company, our people and our
innovations, please visit http://www.motorola.com.
###