Download to read offline


![The ranges around the estimates in this table define the boundaries within which the actual numbers lie, based on the best available information. Regional HIV and AIDS statistics and features 2009 TOTAL 33.3 million [31.4 million – 35.3 million] 2.6 million [2.3 million – 2.8 million] Adults and children newly infected with HIV Adults and children living with HIV Sub-Saharan Africa Middle East and North Africa South and South-East Asia East Asia Central and South America Caribbean Eastern Europe and Central Asia Western and Central Europe North America Oceania 22.5 million [20.9 million – 24.2 million] 4.1 million [3.7 million – 4.6 million] 1.4 million [1.2 million – 1.6 million] 1.4 million [1.3 million – 1.6 million] 1.5 million [1.2 million – 2.0 million] 1.8 million [1.6 million – 2.0 million] 270 000 [240 000 – 320 000] 92 000 [70 000 – 120 000] 130 000 [110 000 – 160 000] 70 000 [44 000 – 130 000] 460 000 [400 000 – 530 000] 770 000 [560 000 – 1.0 million] 240 000 [220 000 – 270 000] 820 000 [720 000 – 910 000] 57 000 [50 000 – 64 000] 75 000 [61 000 – 92 000] 82 000 [48 000 – 140 000] 17 000 [13 000 – 21 000] 31 000 [23 000 – 40 000] 4500 [3400 – 6000] 1.8 million [1.6 million – 2.1 million] Adult & child deaths due to AIDS 1.3 million [1.1 million – 1.5 million] 260 000 [230 000 – 300 000] 58 000 [43 000 – 70 000] 76 000 [60 000 – 95 000] 26 000 [22 000 – 44 000] 24 000 [20 000 – 27 000] 36 000 [25 000 – 50 000] 12 000 [8500 – 15 000] 8500 [6800 – 19 000] 1400 [<1000 – 2400] 0.8% [0.7% - 0.8%] Adult prevalence (15‒49) [%] 5.0% [4.7% – 5.2%] 0.3% [0.3% – 0.3%] 0.5% [0.4% – 0.6%] 0.8% [0.7% – 0.9%] 0.5% [0.4% – 0.7%] 0.2% [0.2% – 0.3%] 0.1% [0.1% – 0.1%] 1.0% [0.9% – 1.1%] 0.2% [0.2% – 0.2%] 0.3% [0.2% – 0.3%]](https://image.slidesharecdn.com/publicinjecting-110504085048-phpapp01/75/Public-injecting-harm-reduction-services-32-2048.jpg)

![Thank you for your attention! [email_address]](https://image.slidesharecdn.com/publicinjecting-110504085048-phpapp01/75/Public-injecting-harm-reduction-services-82-2048.jpg)

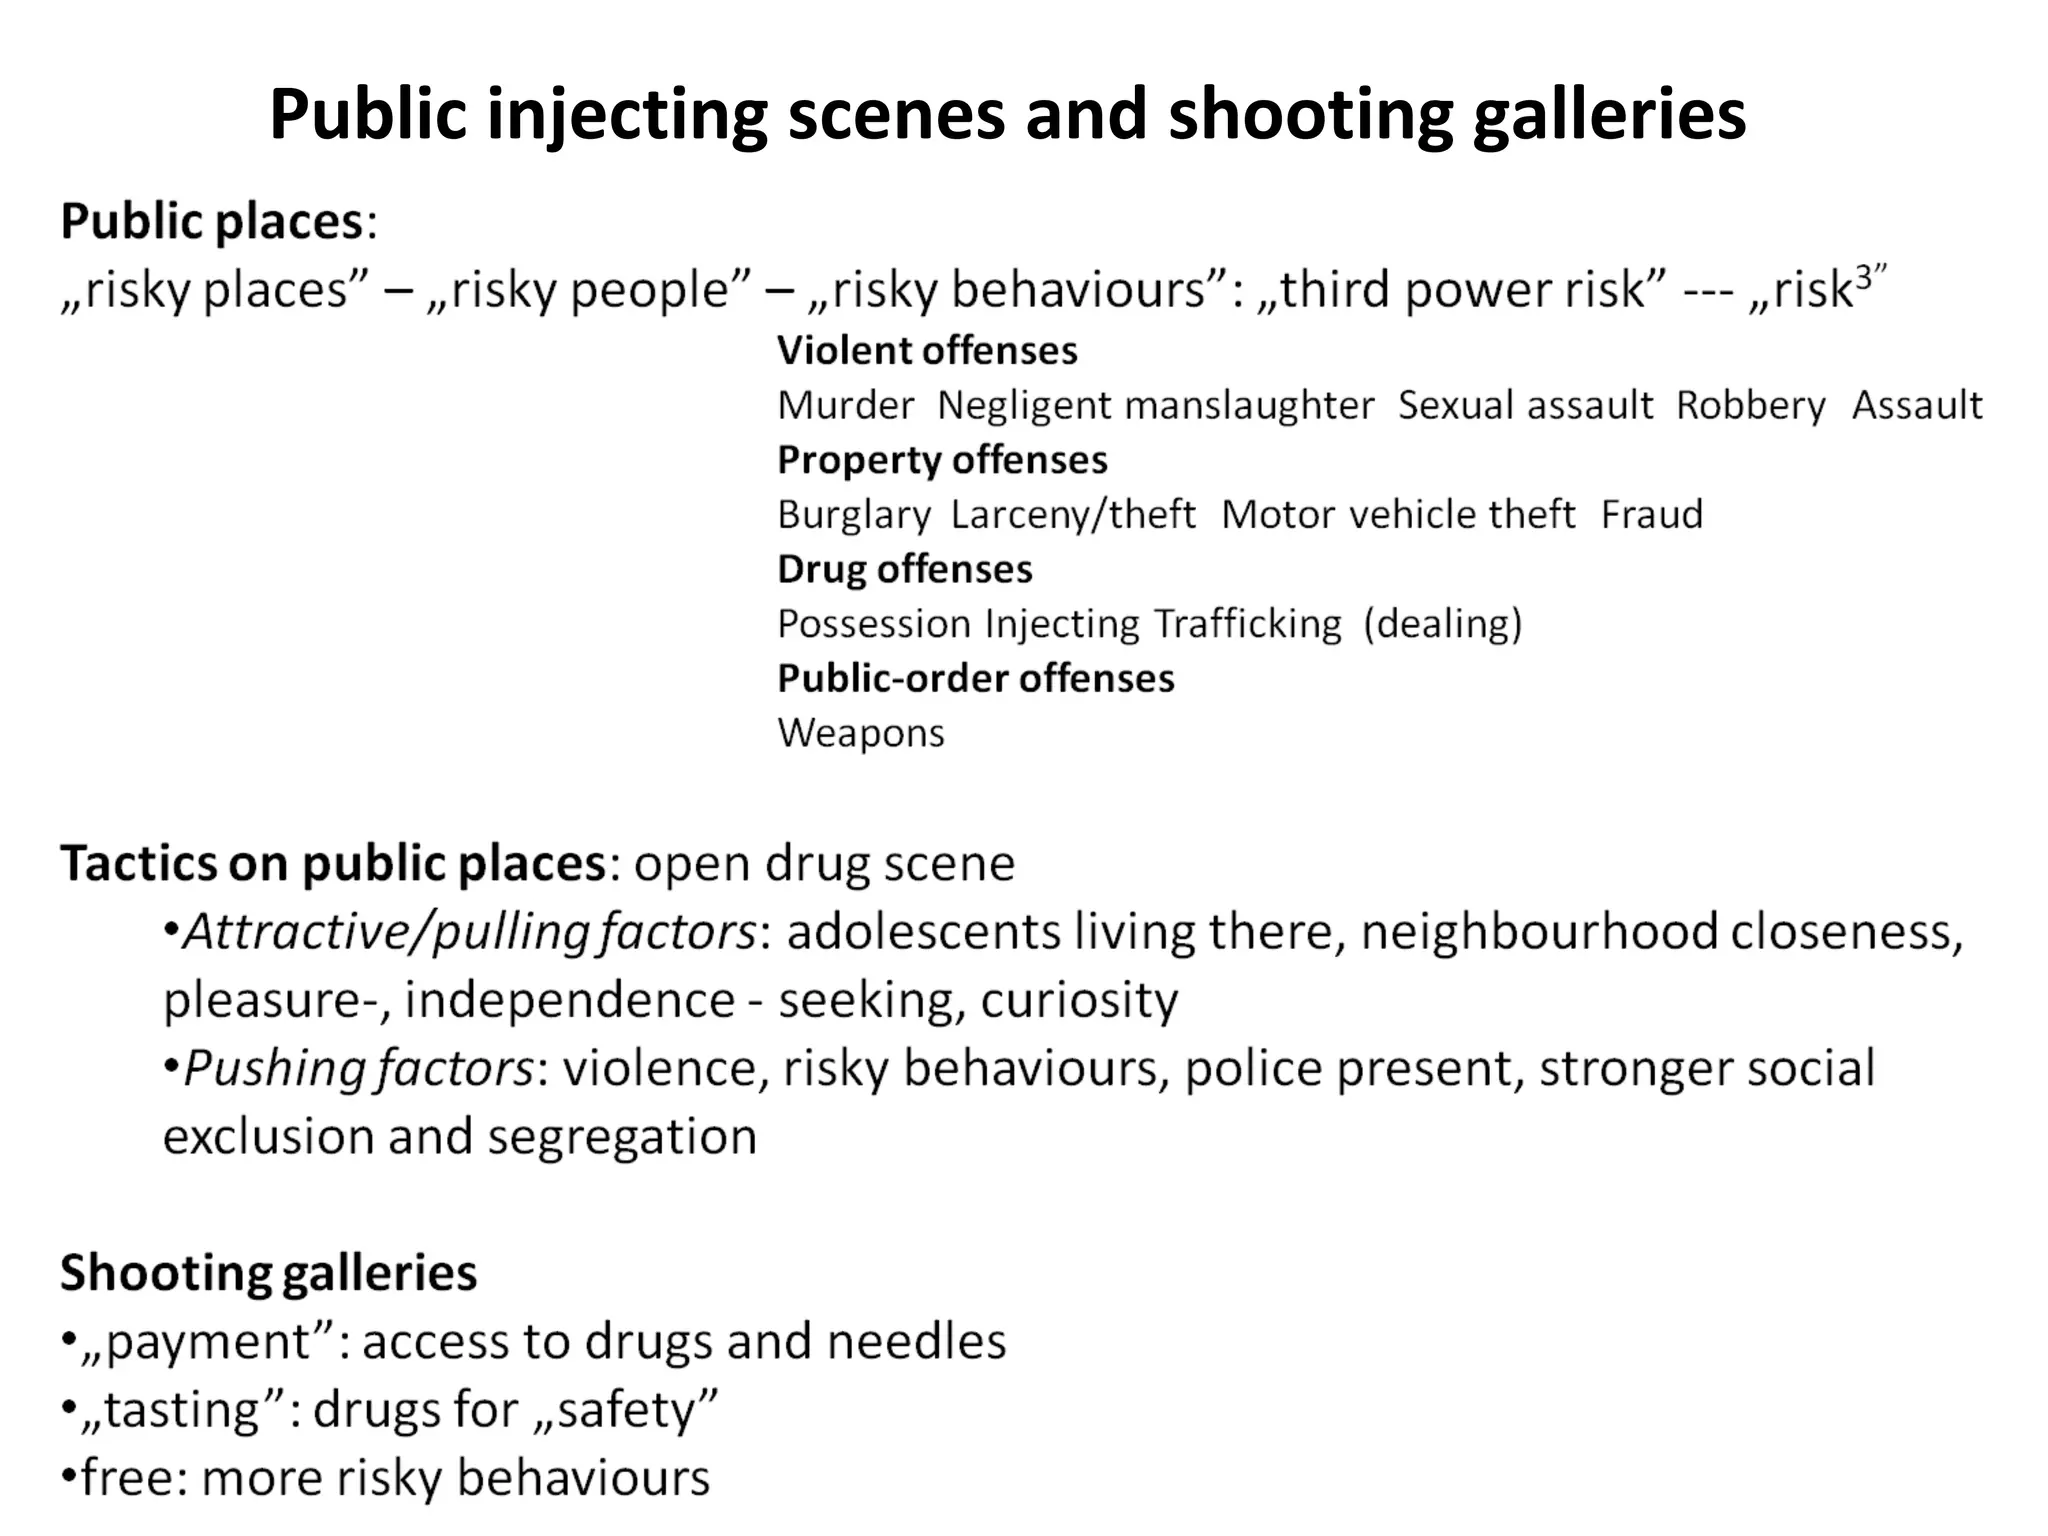
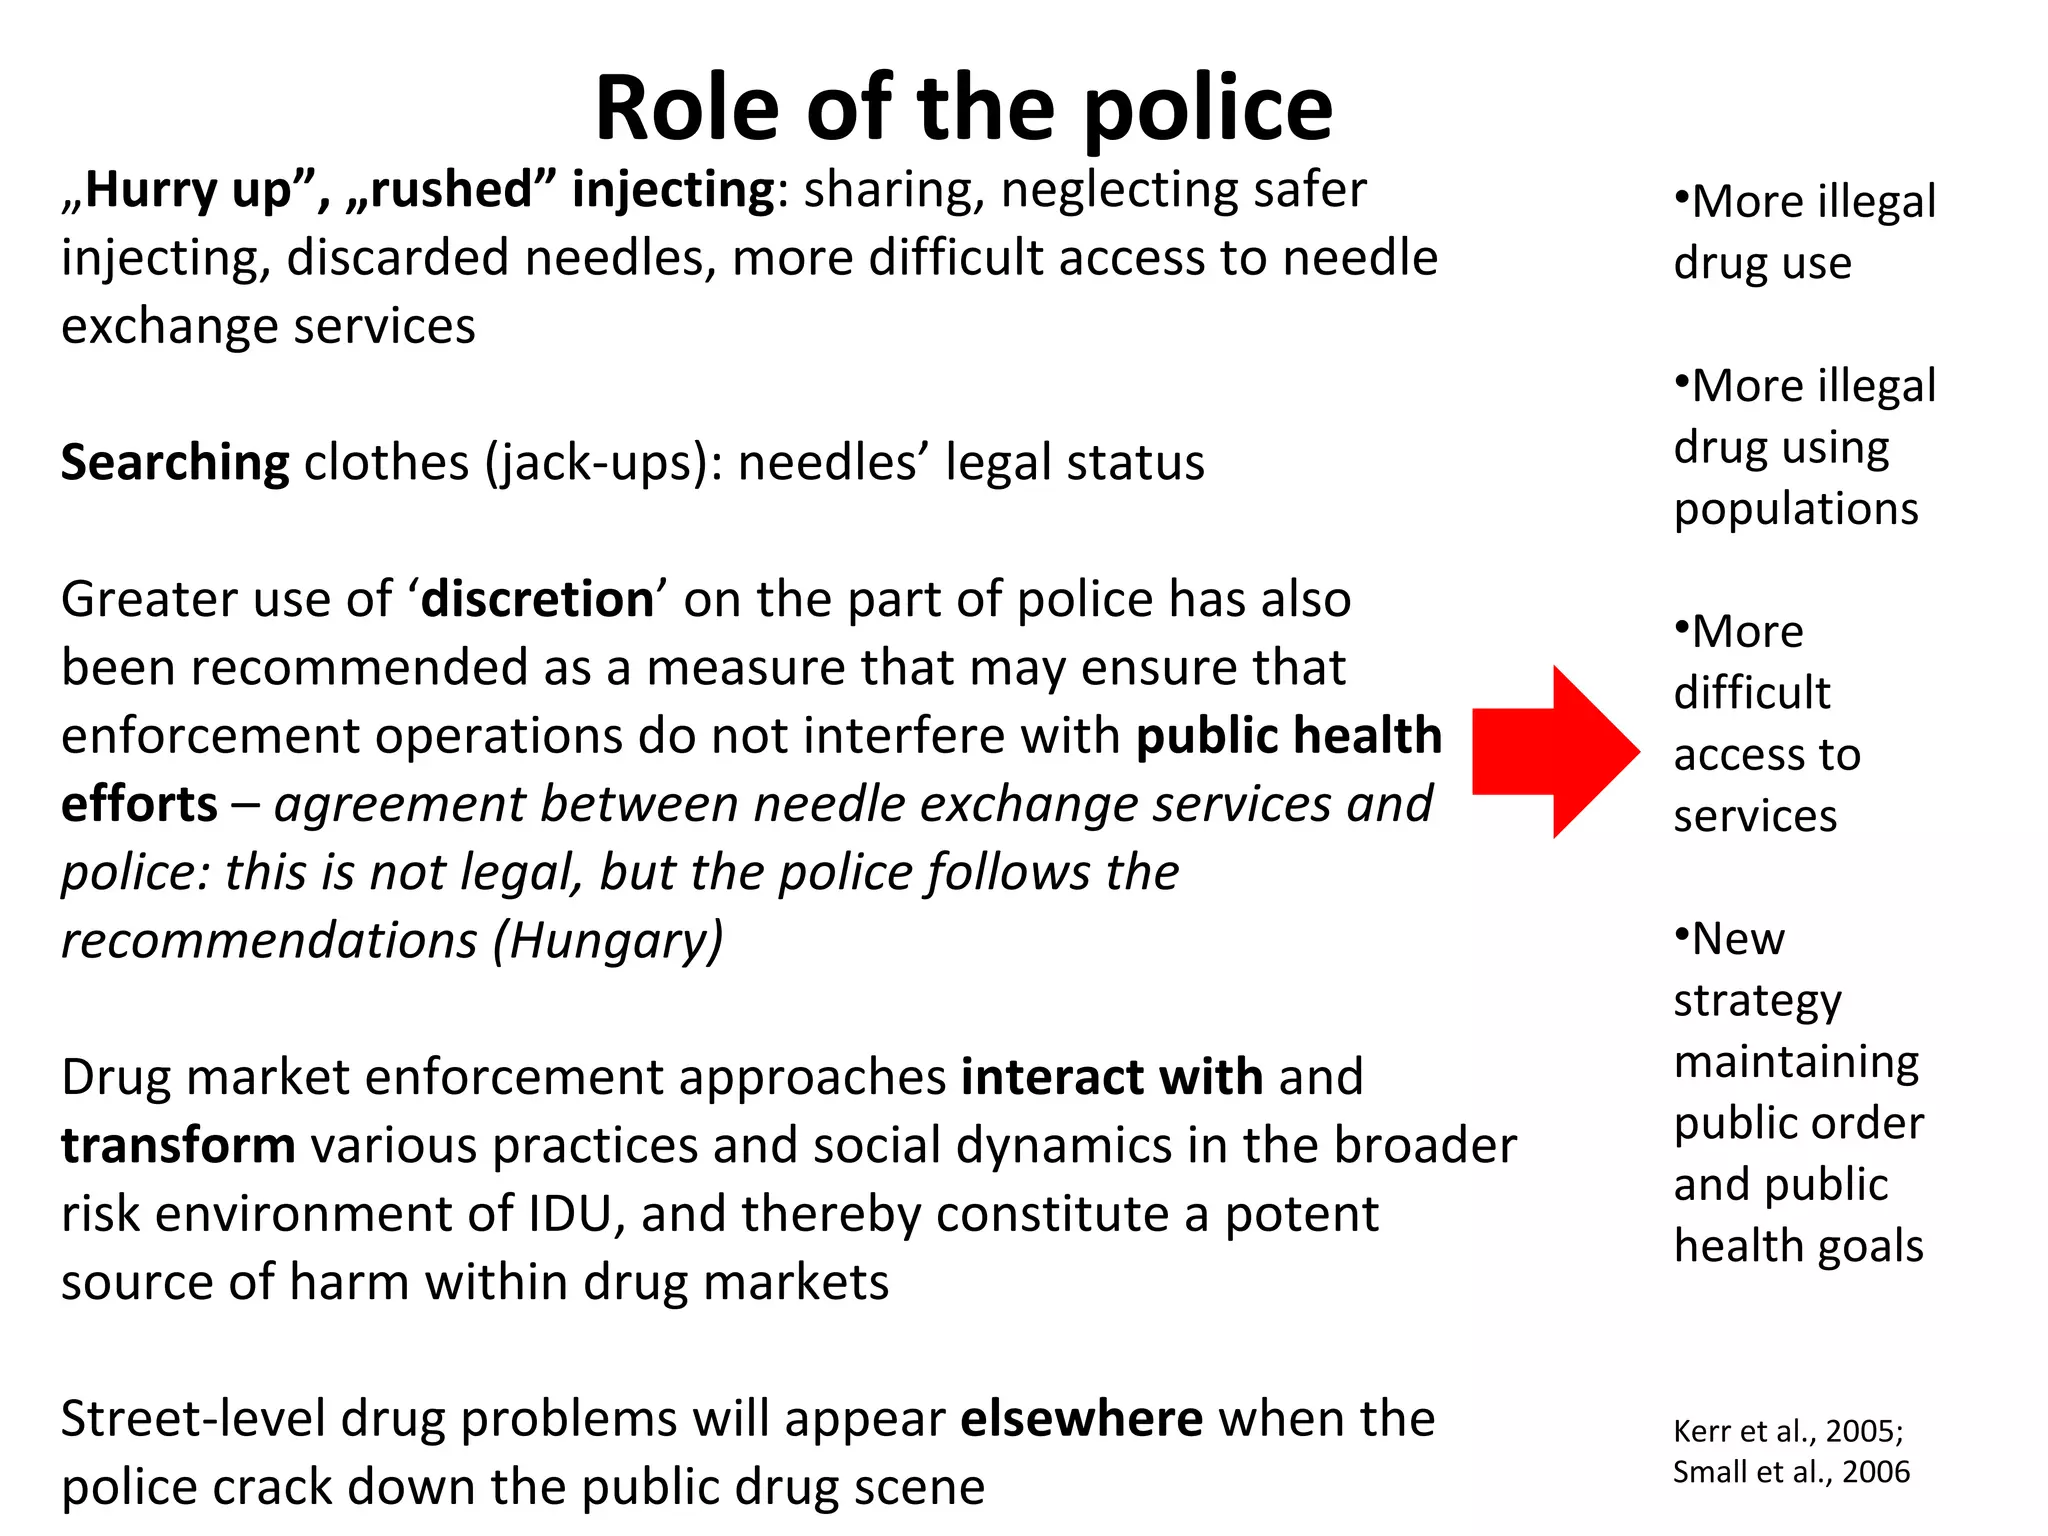
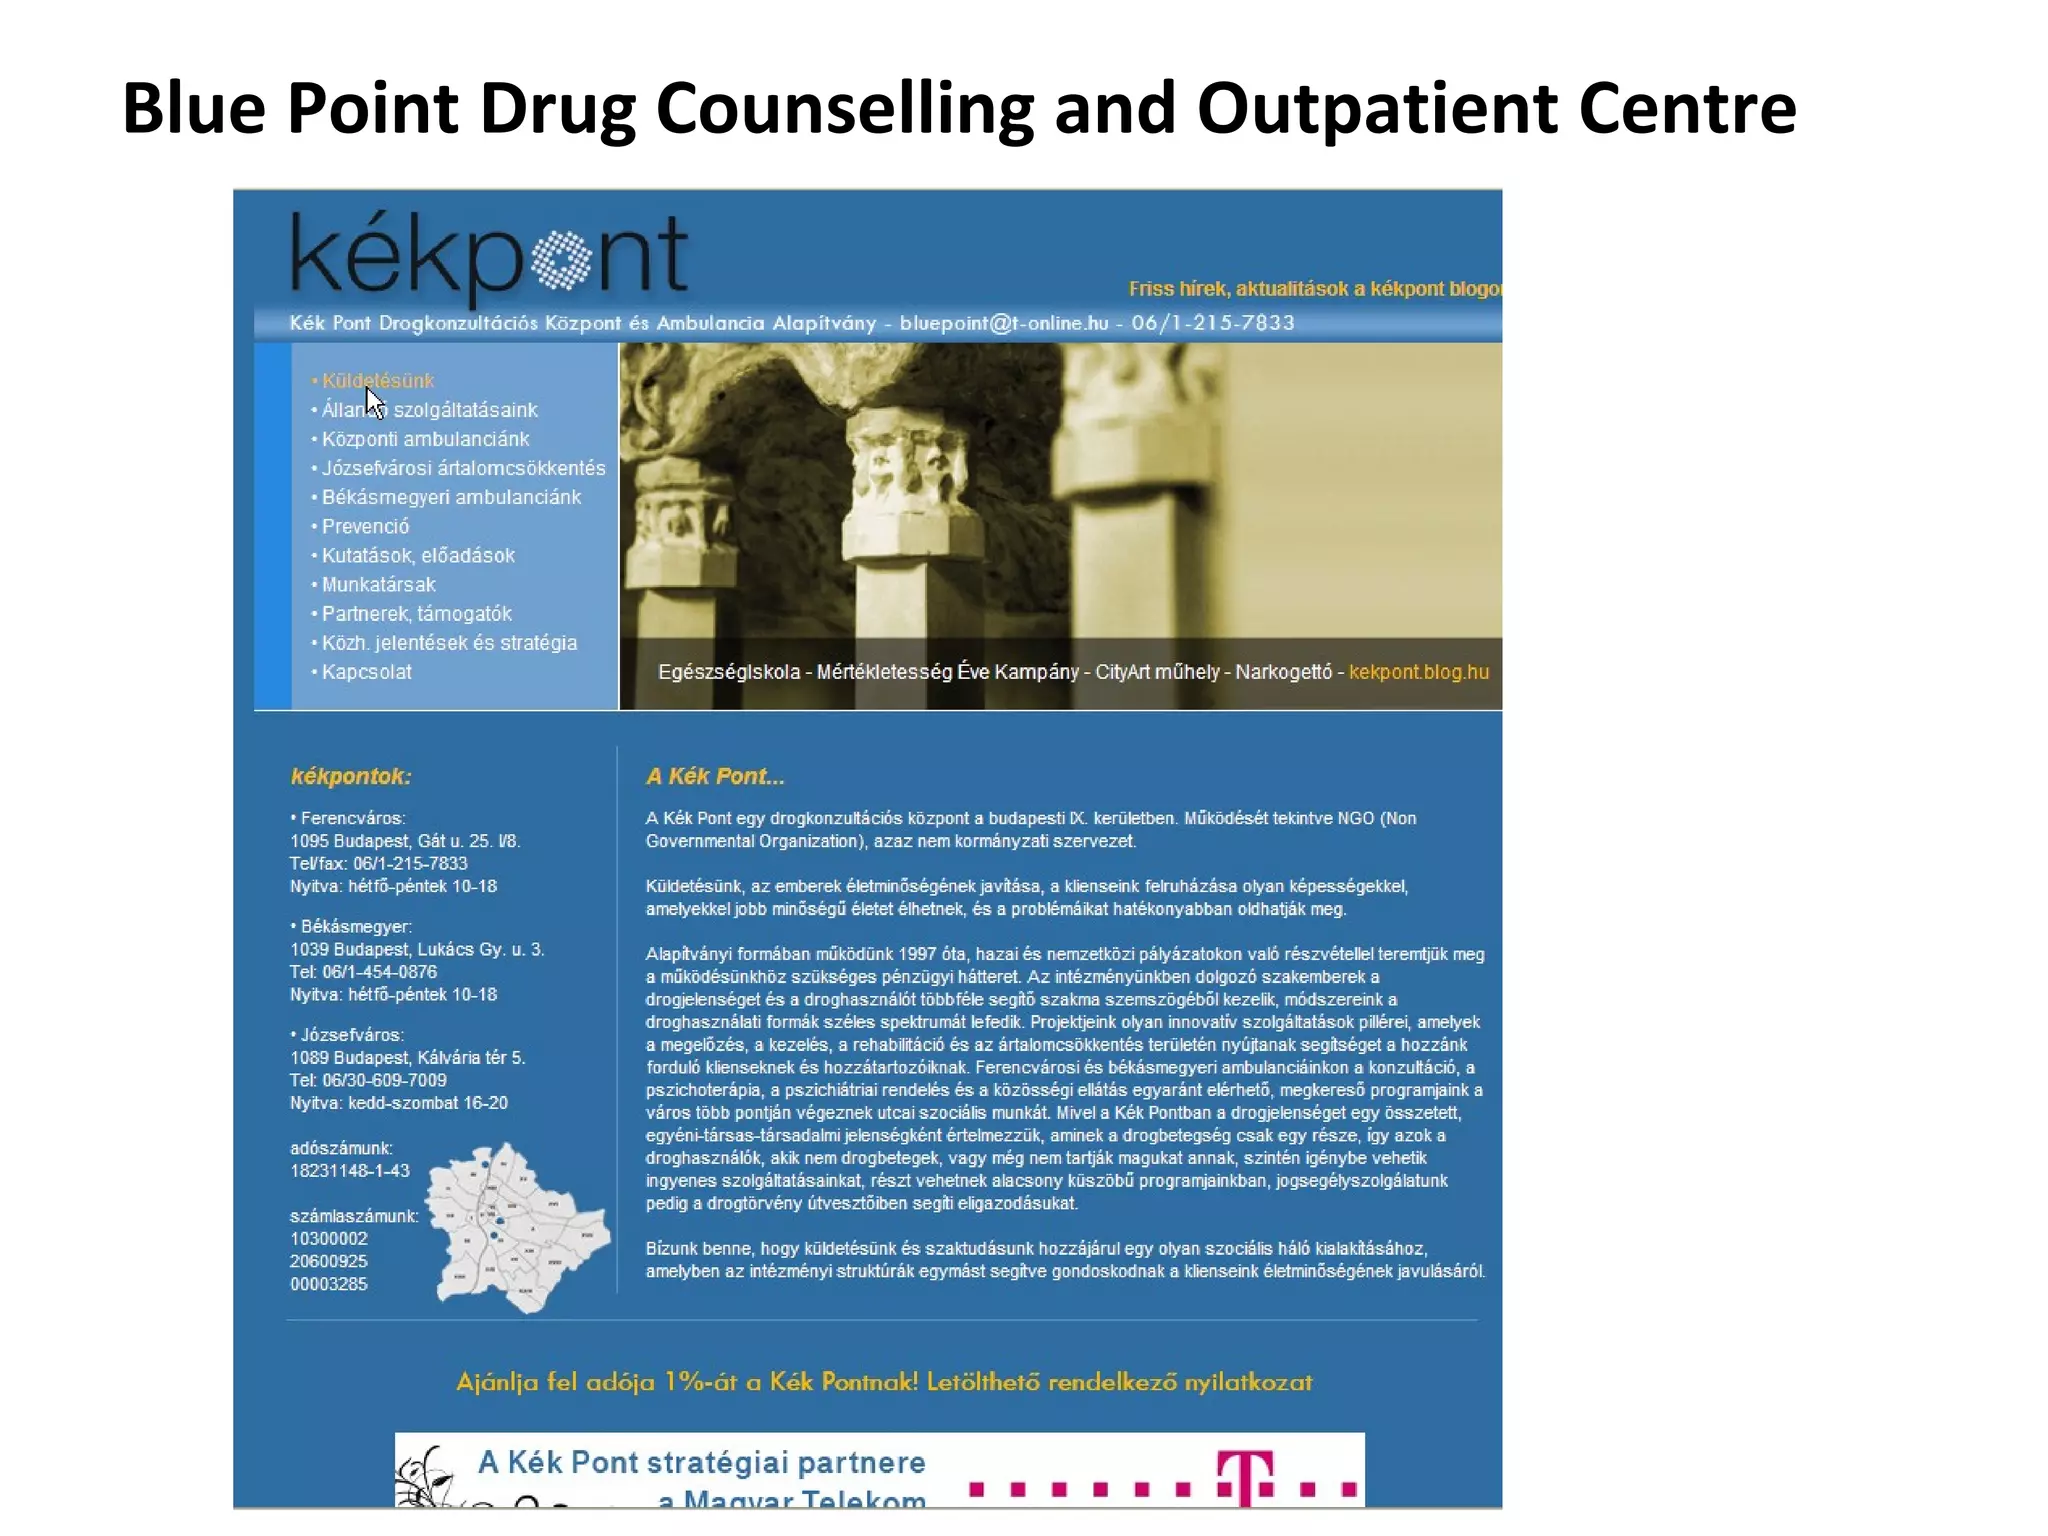
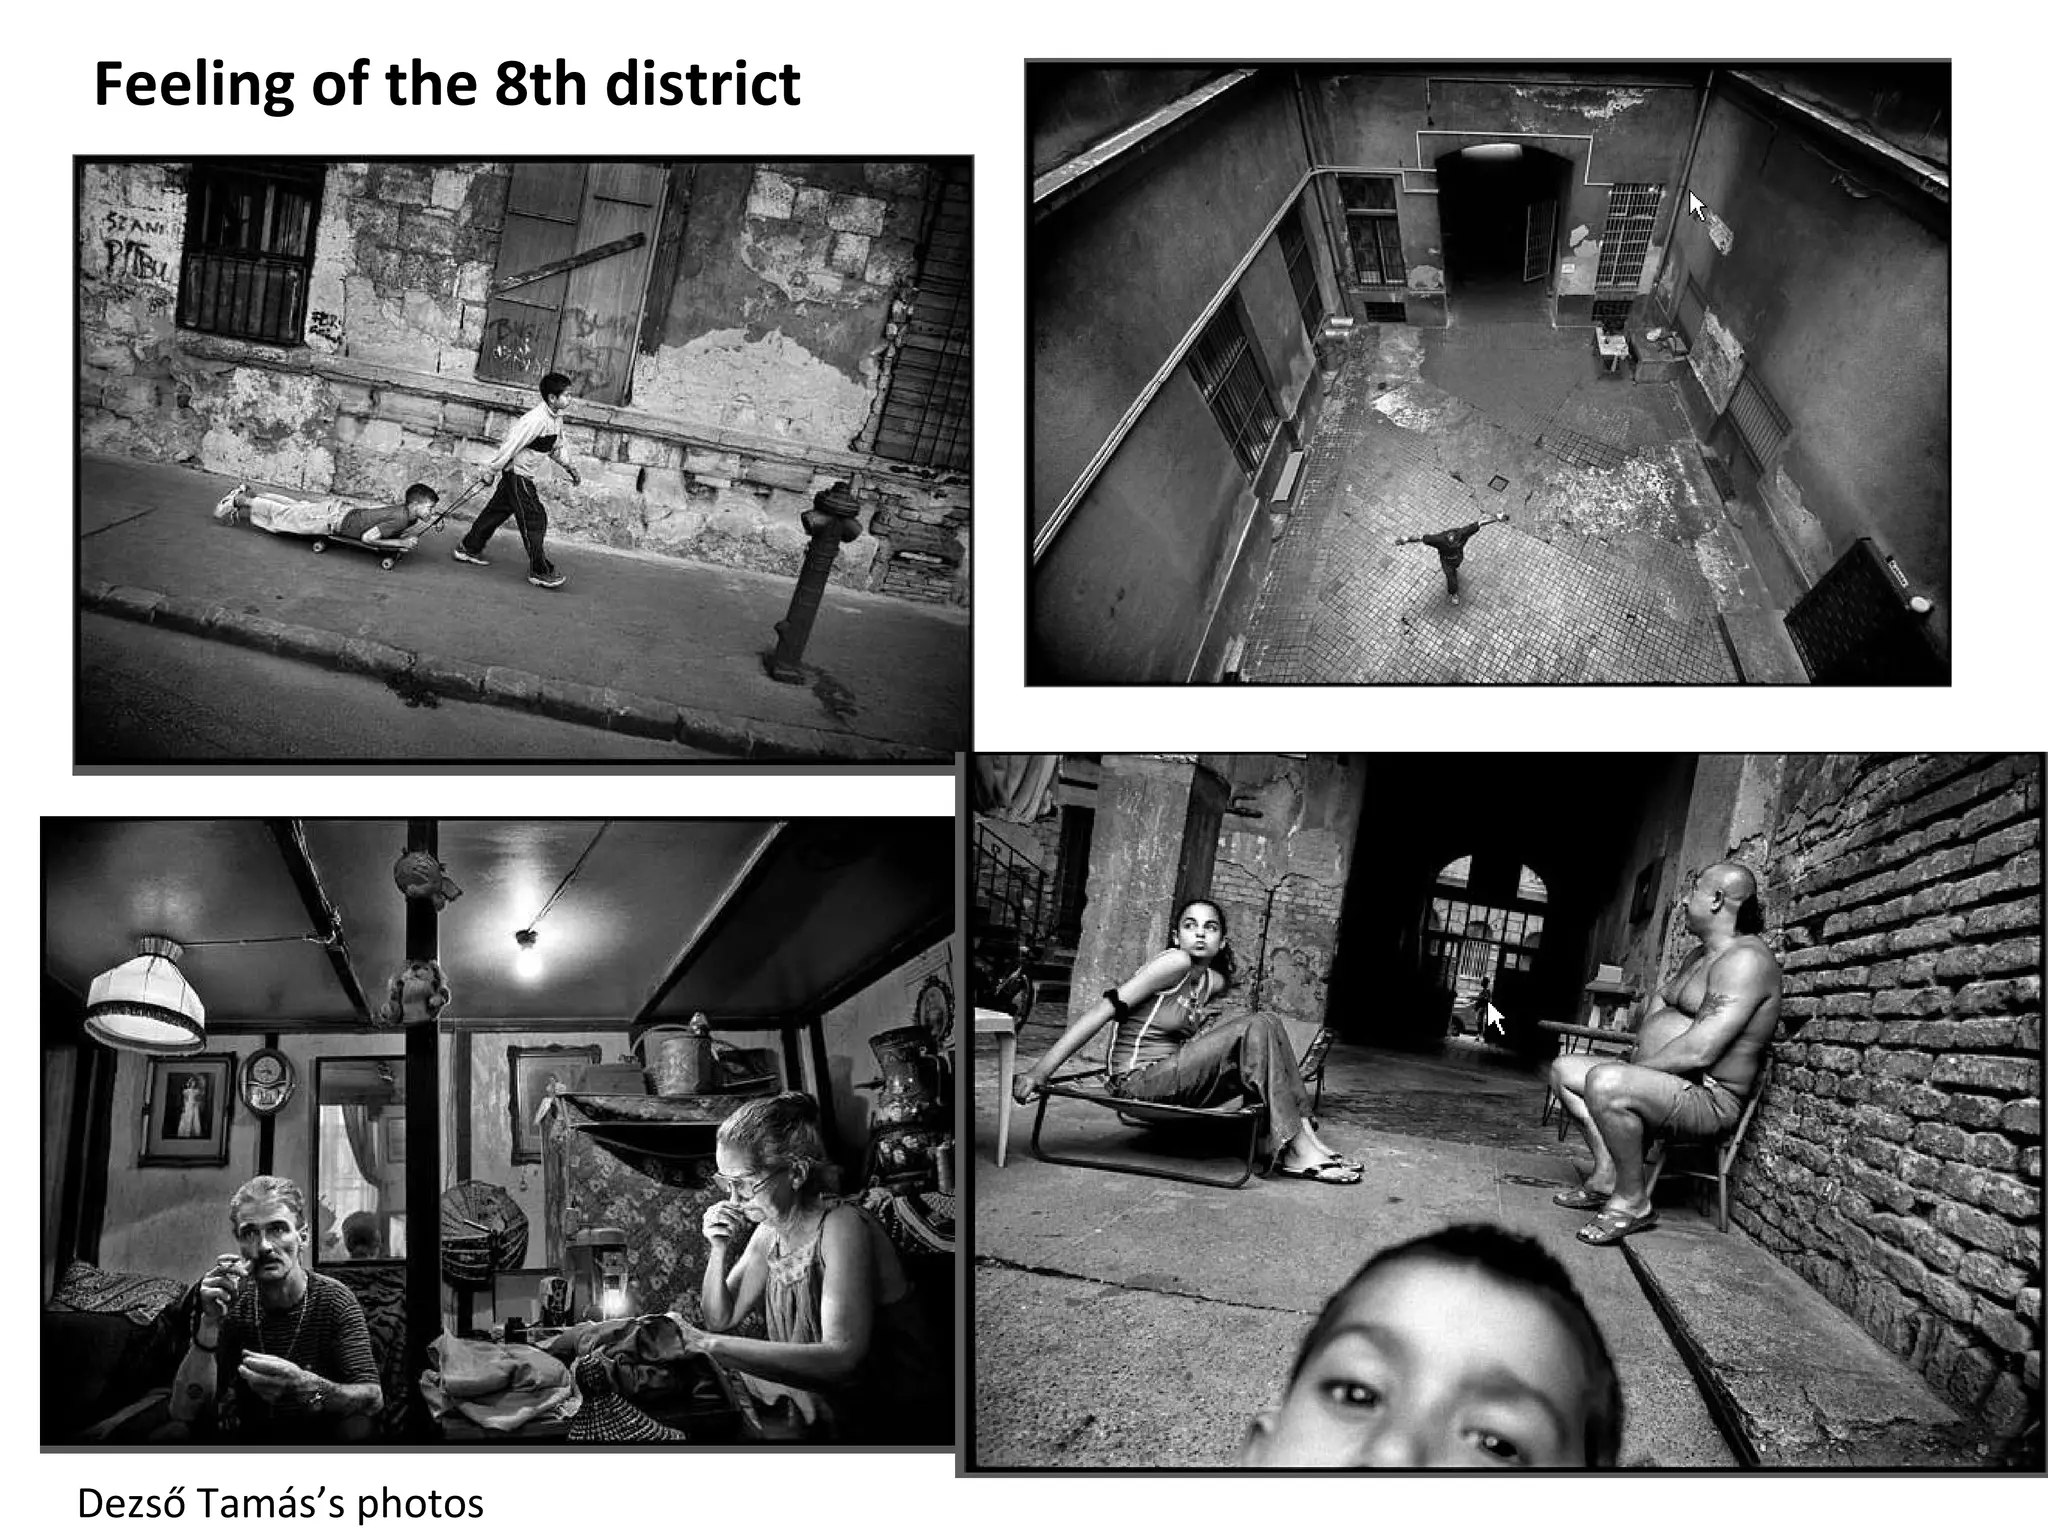
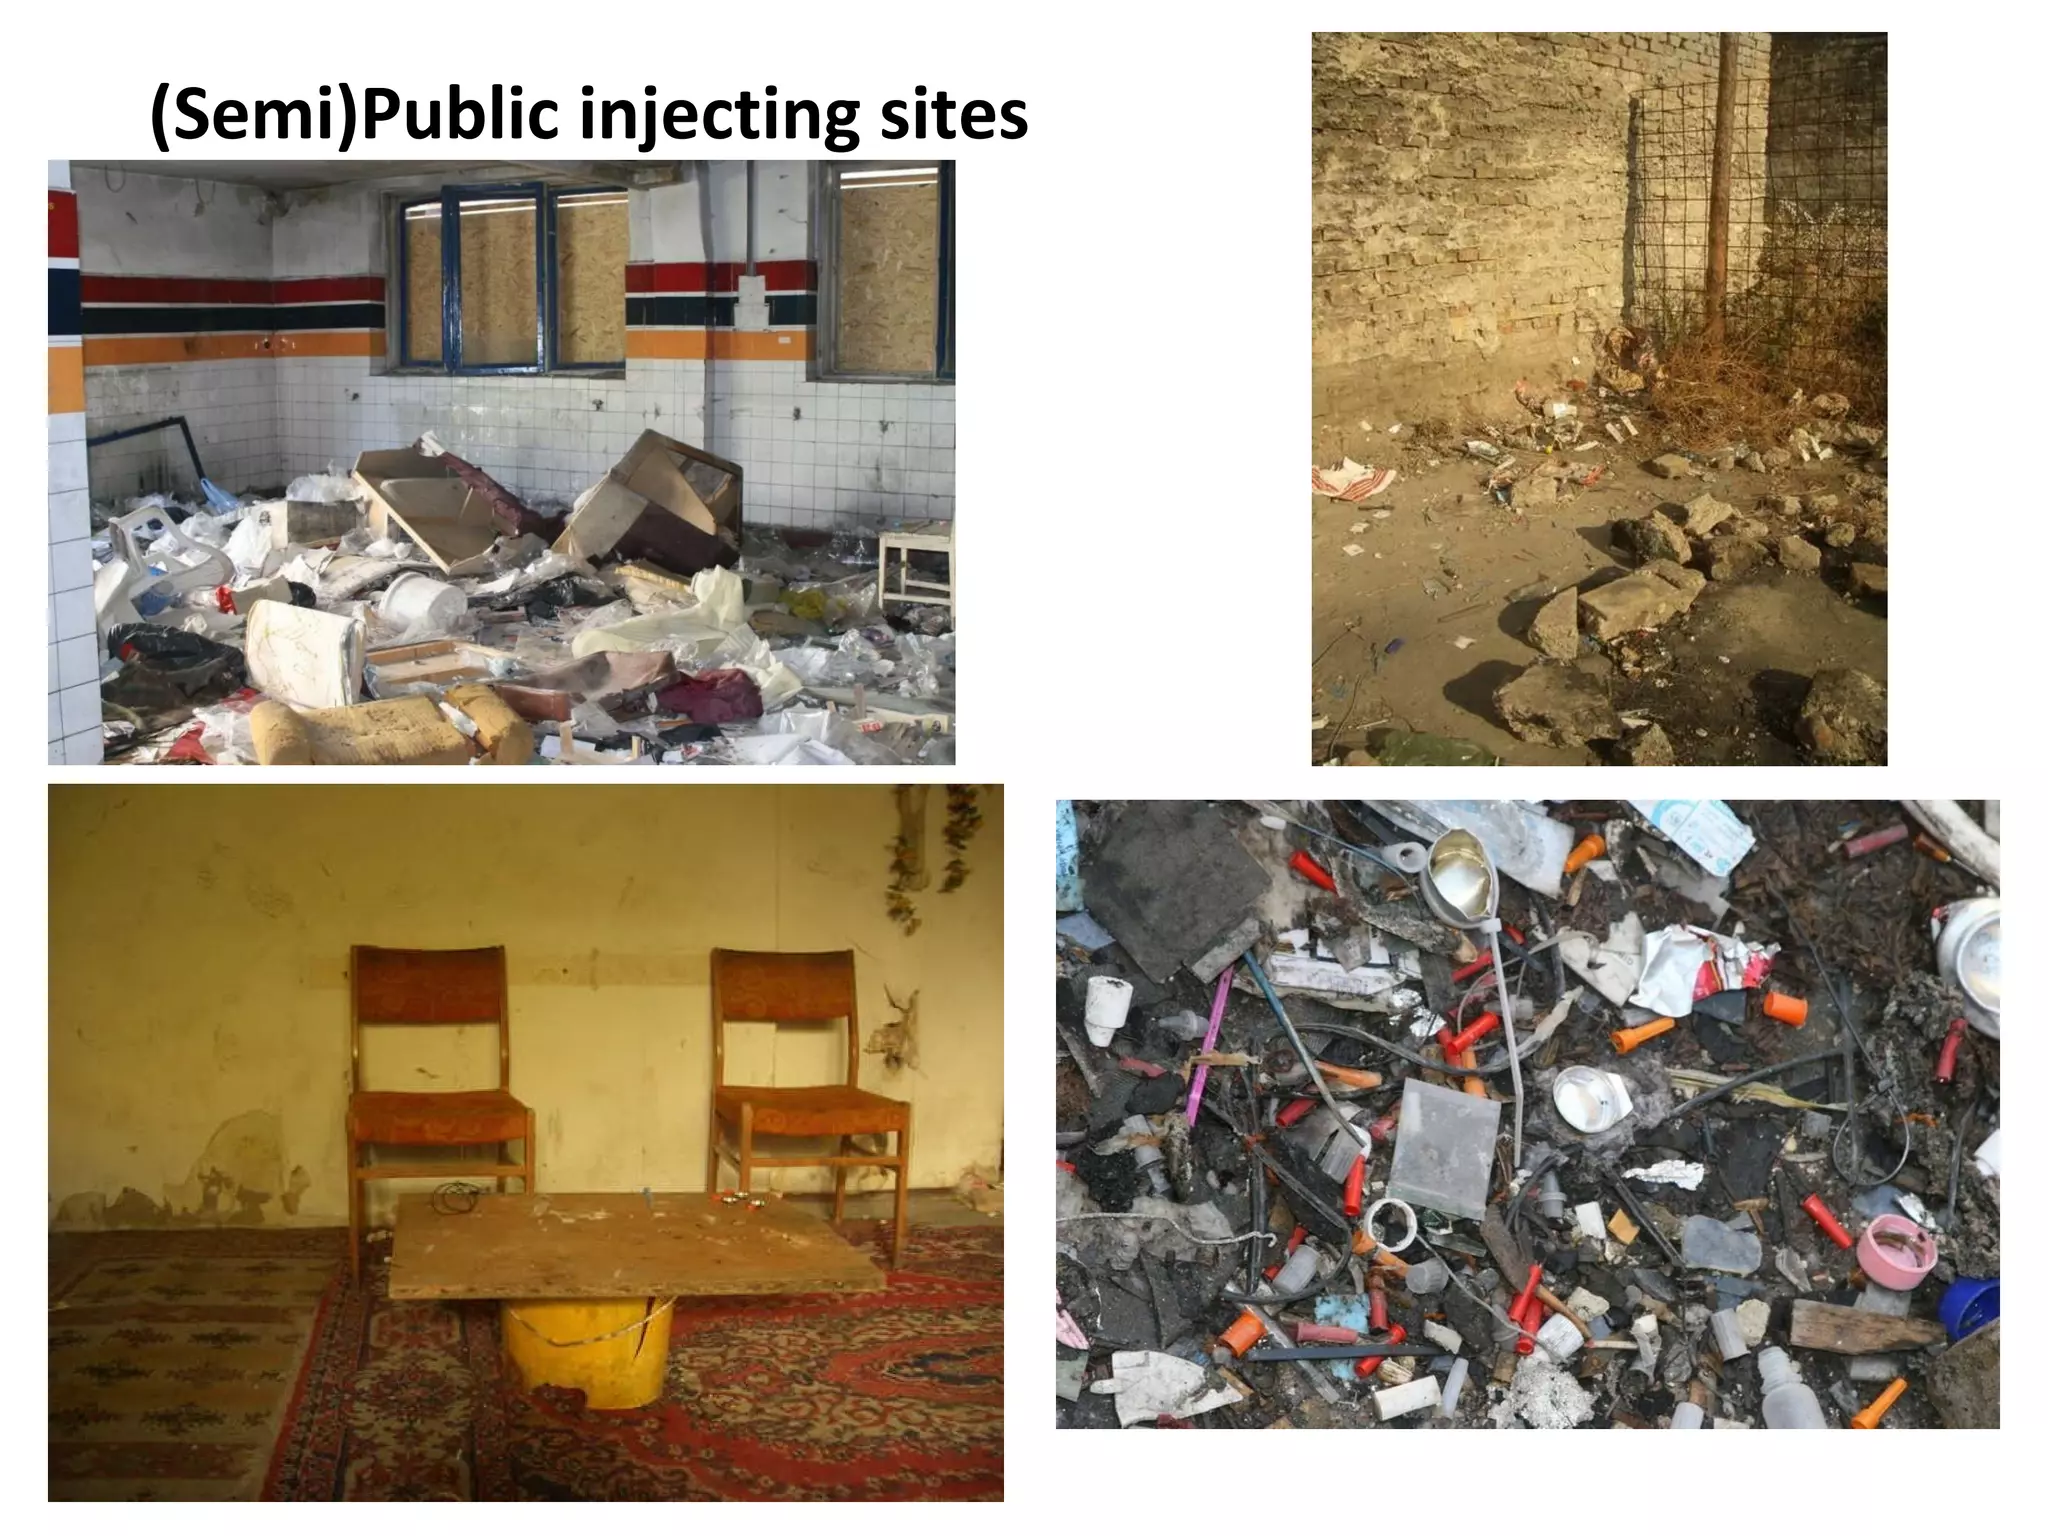
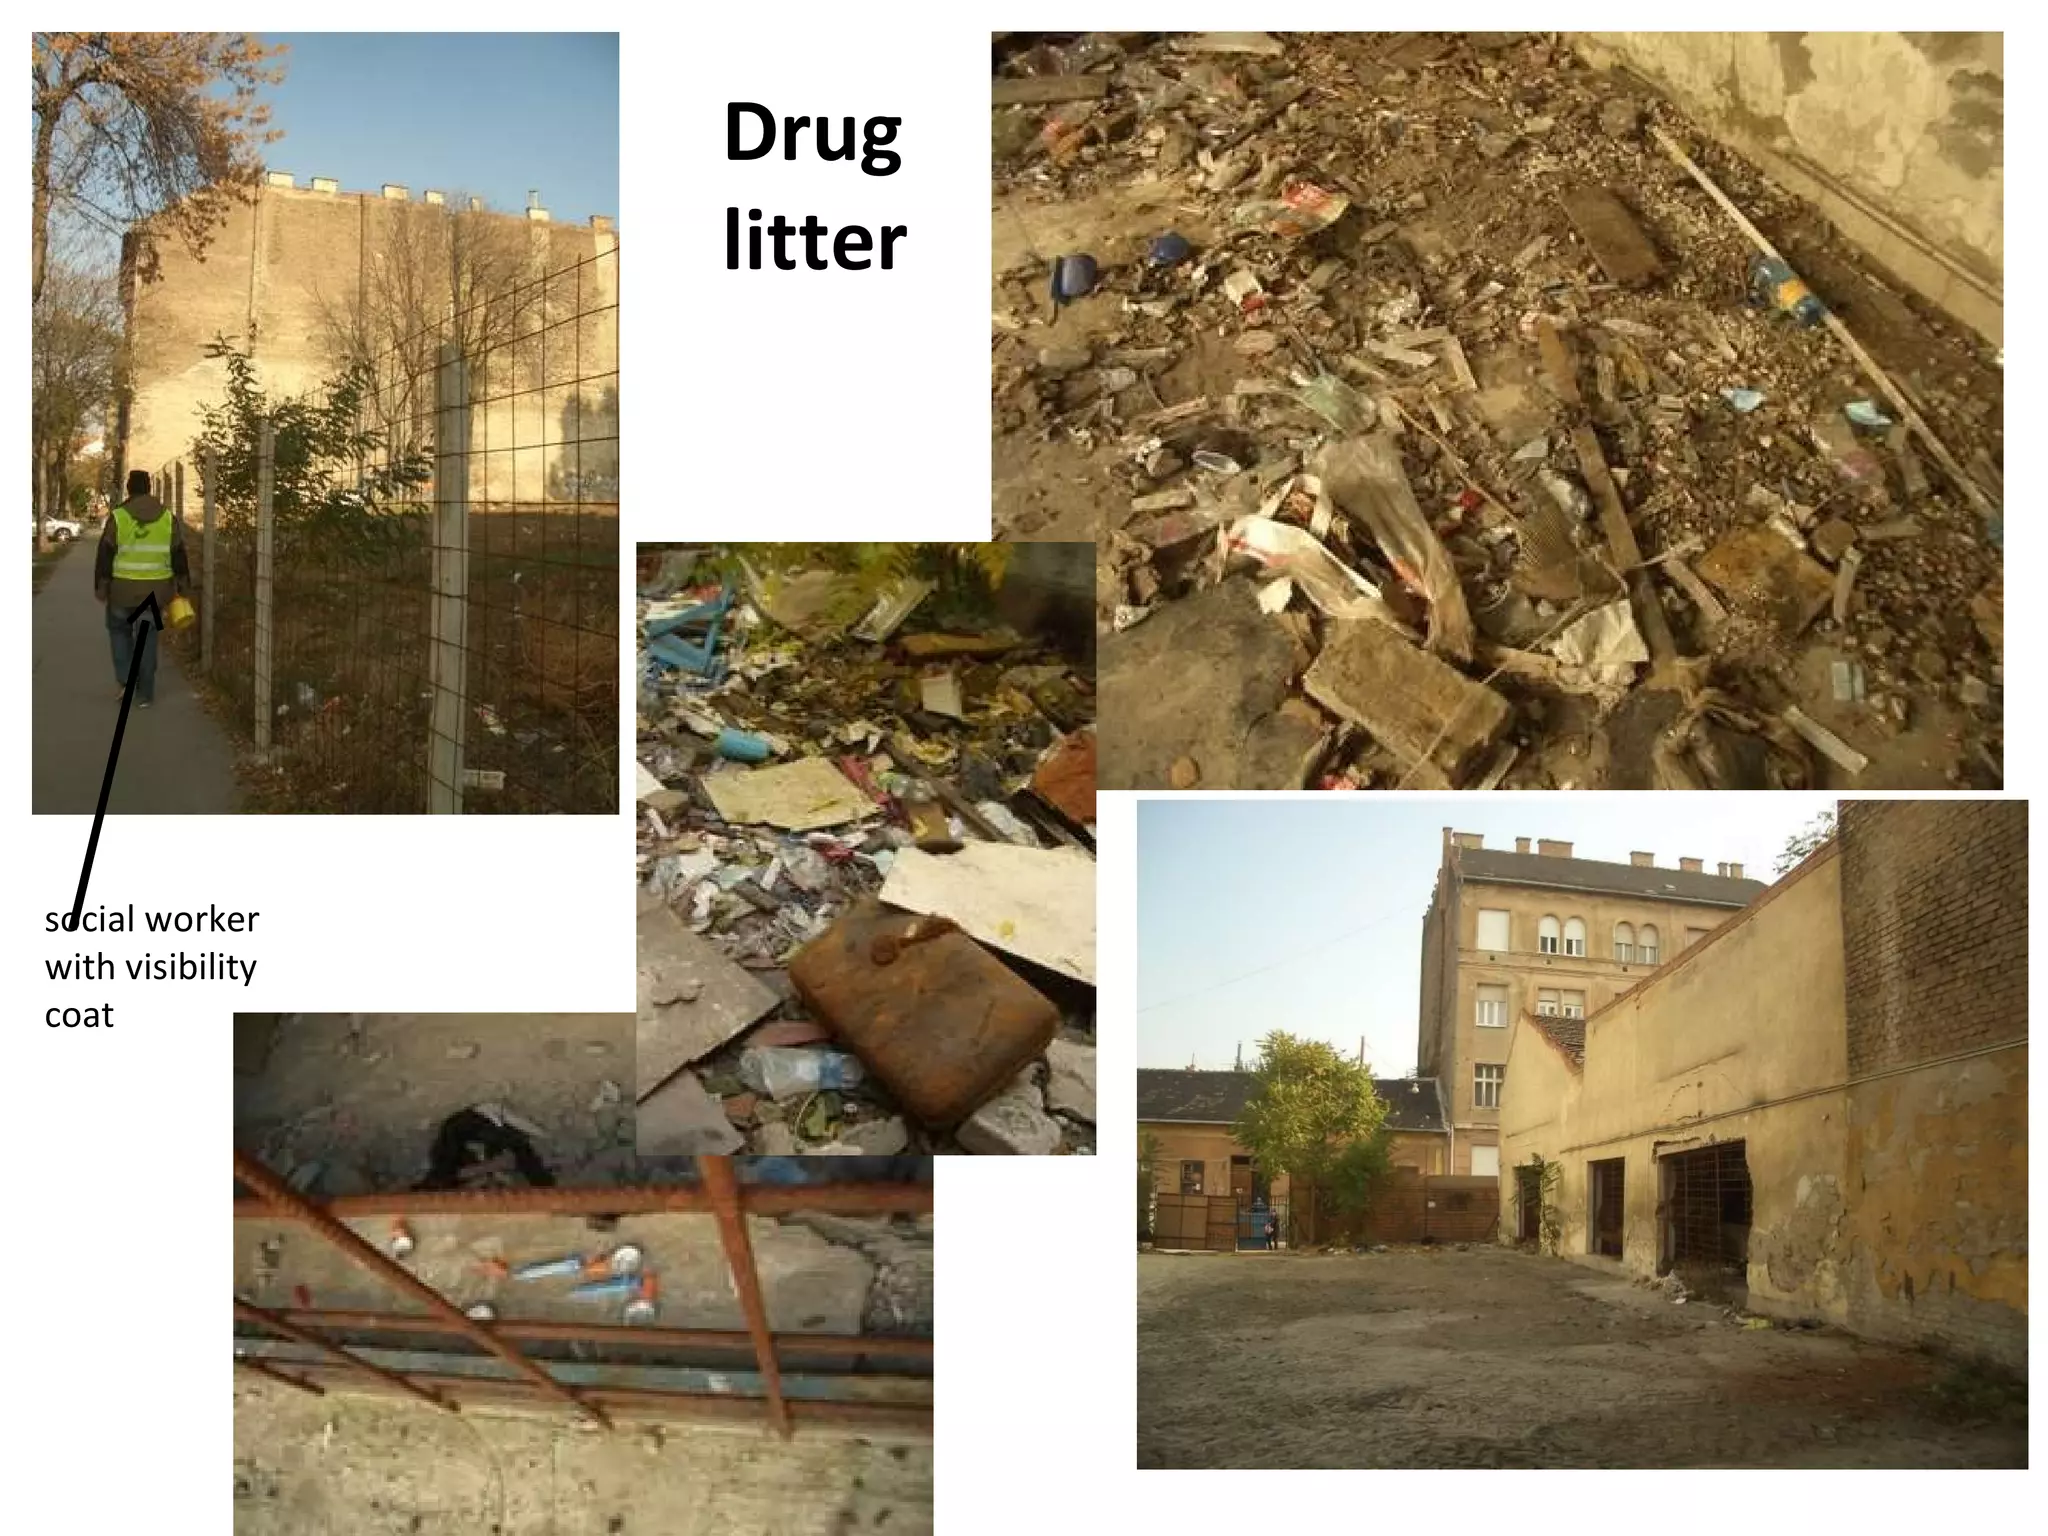
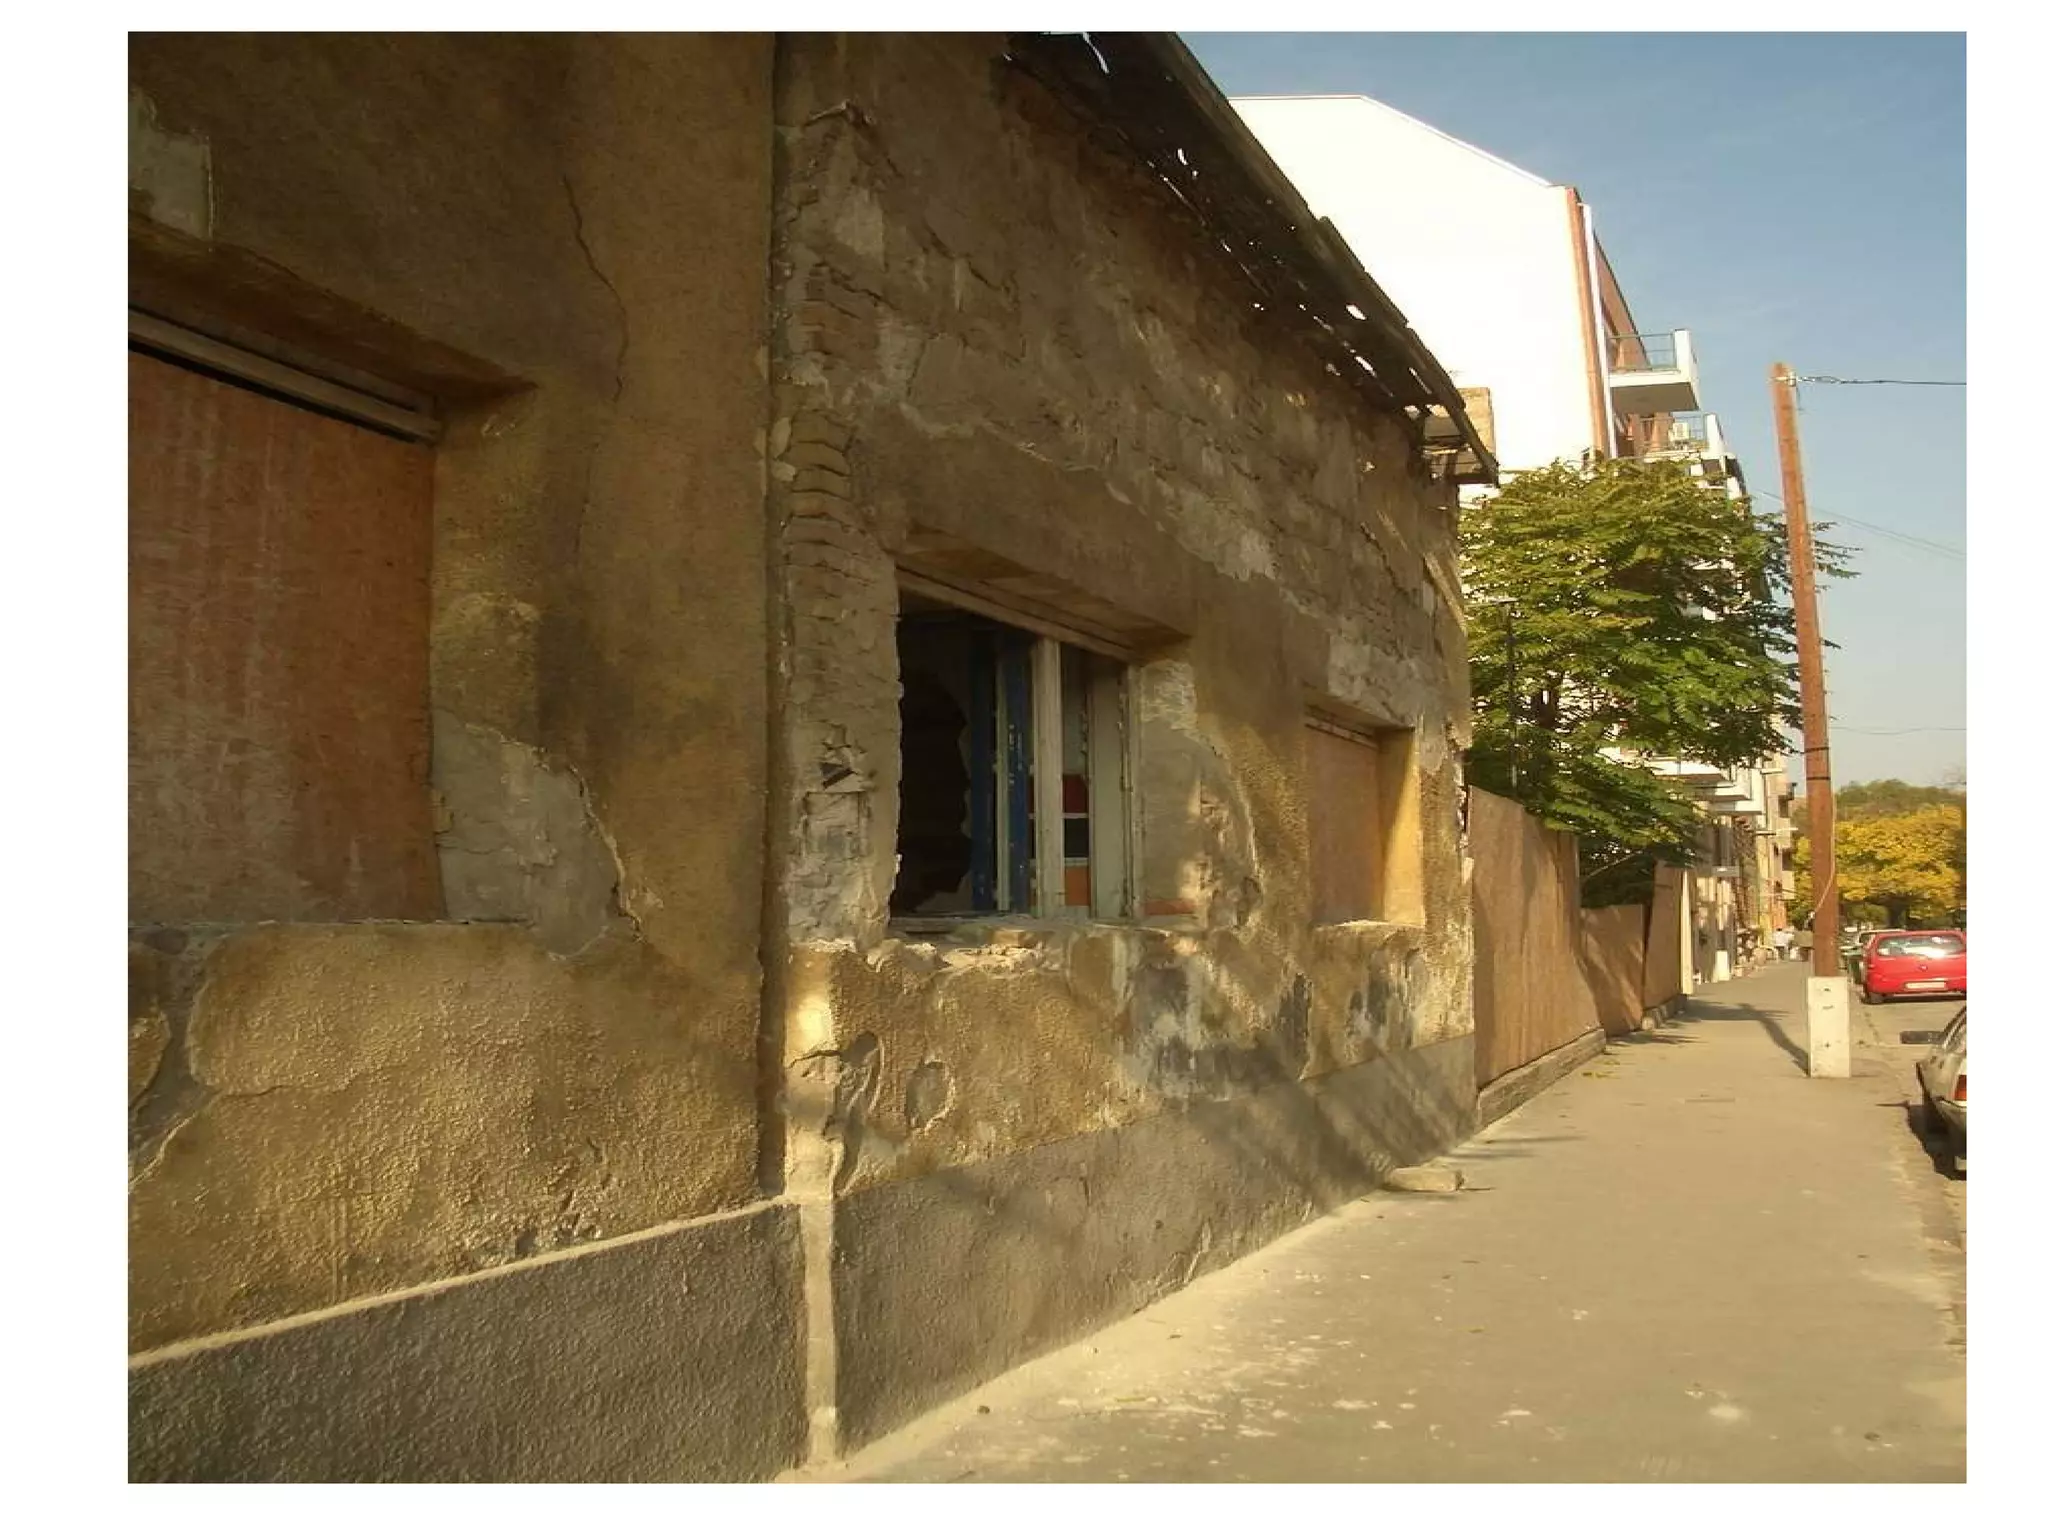
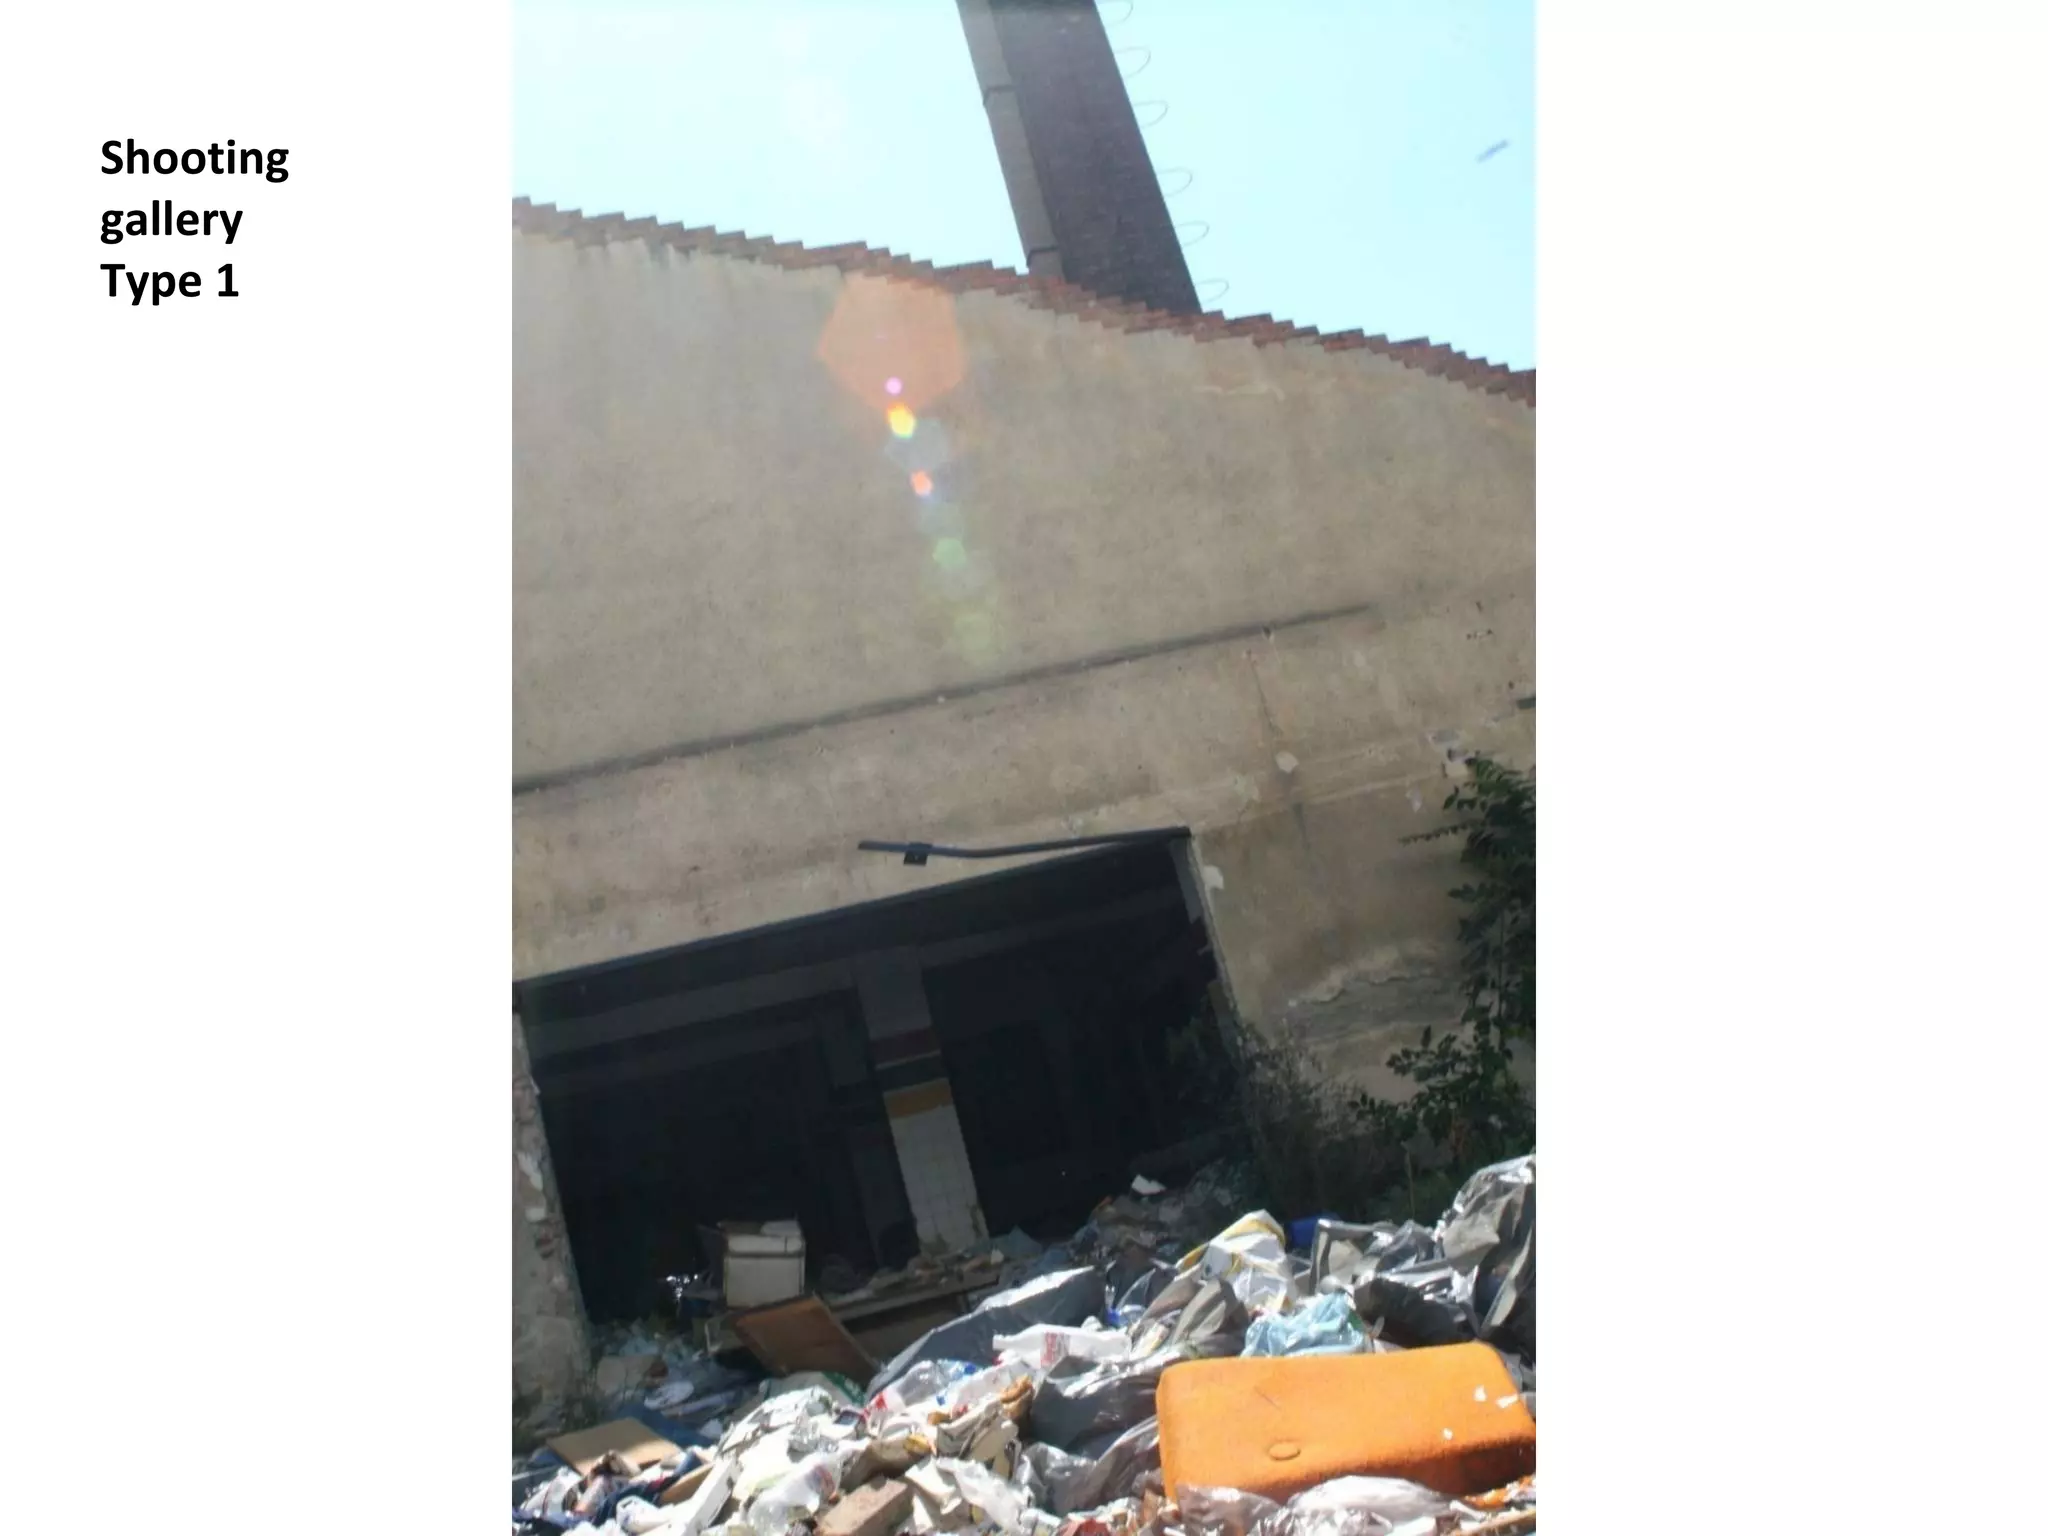
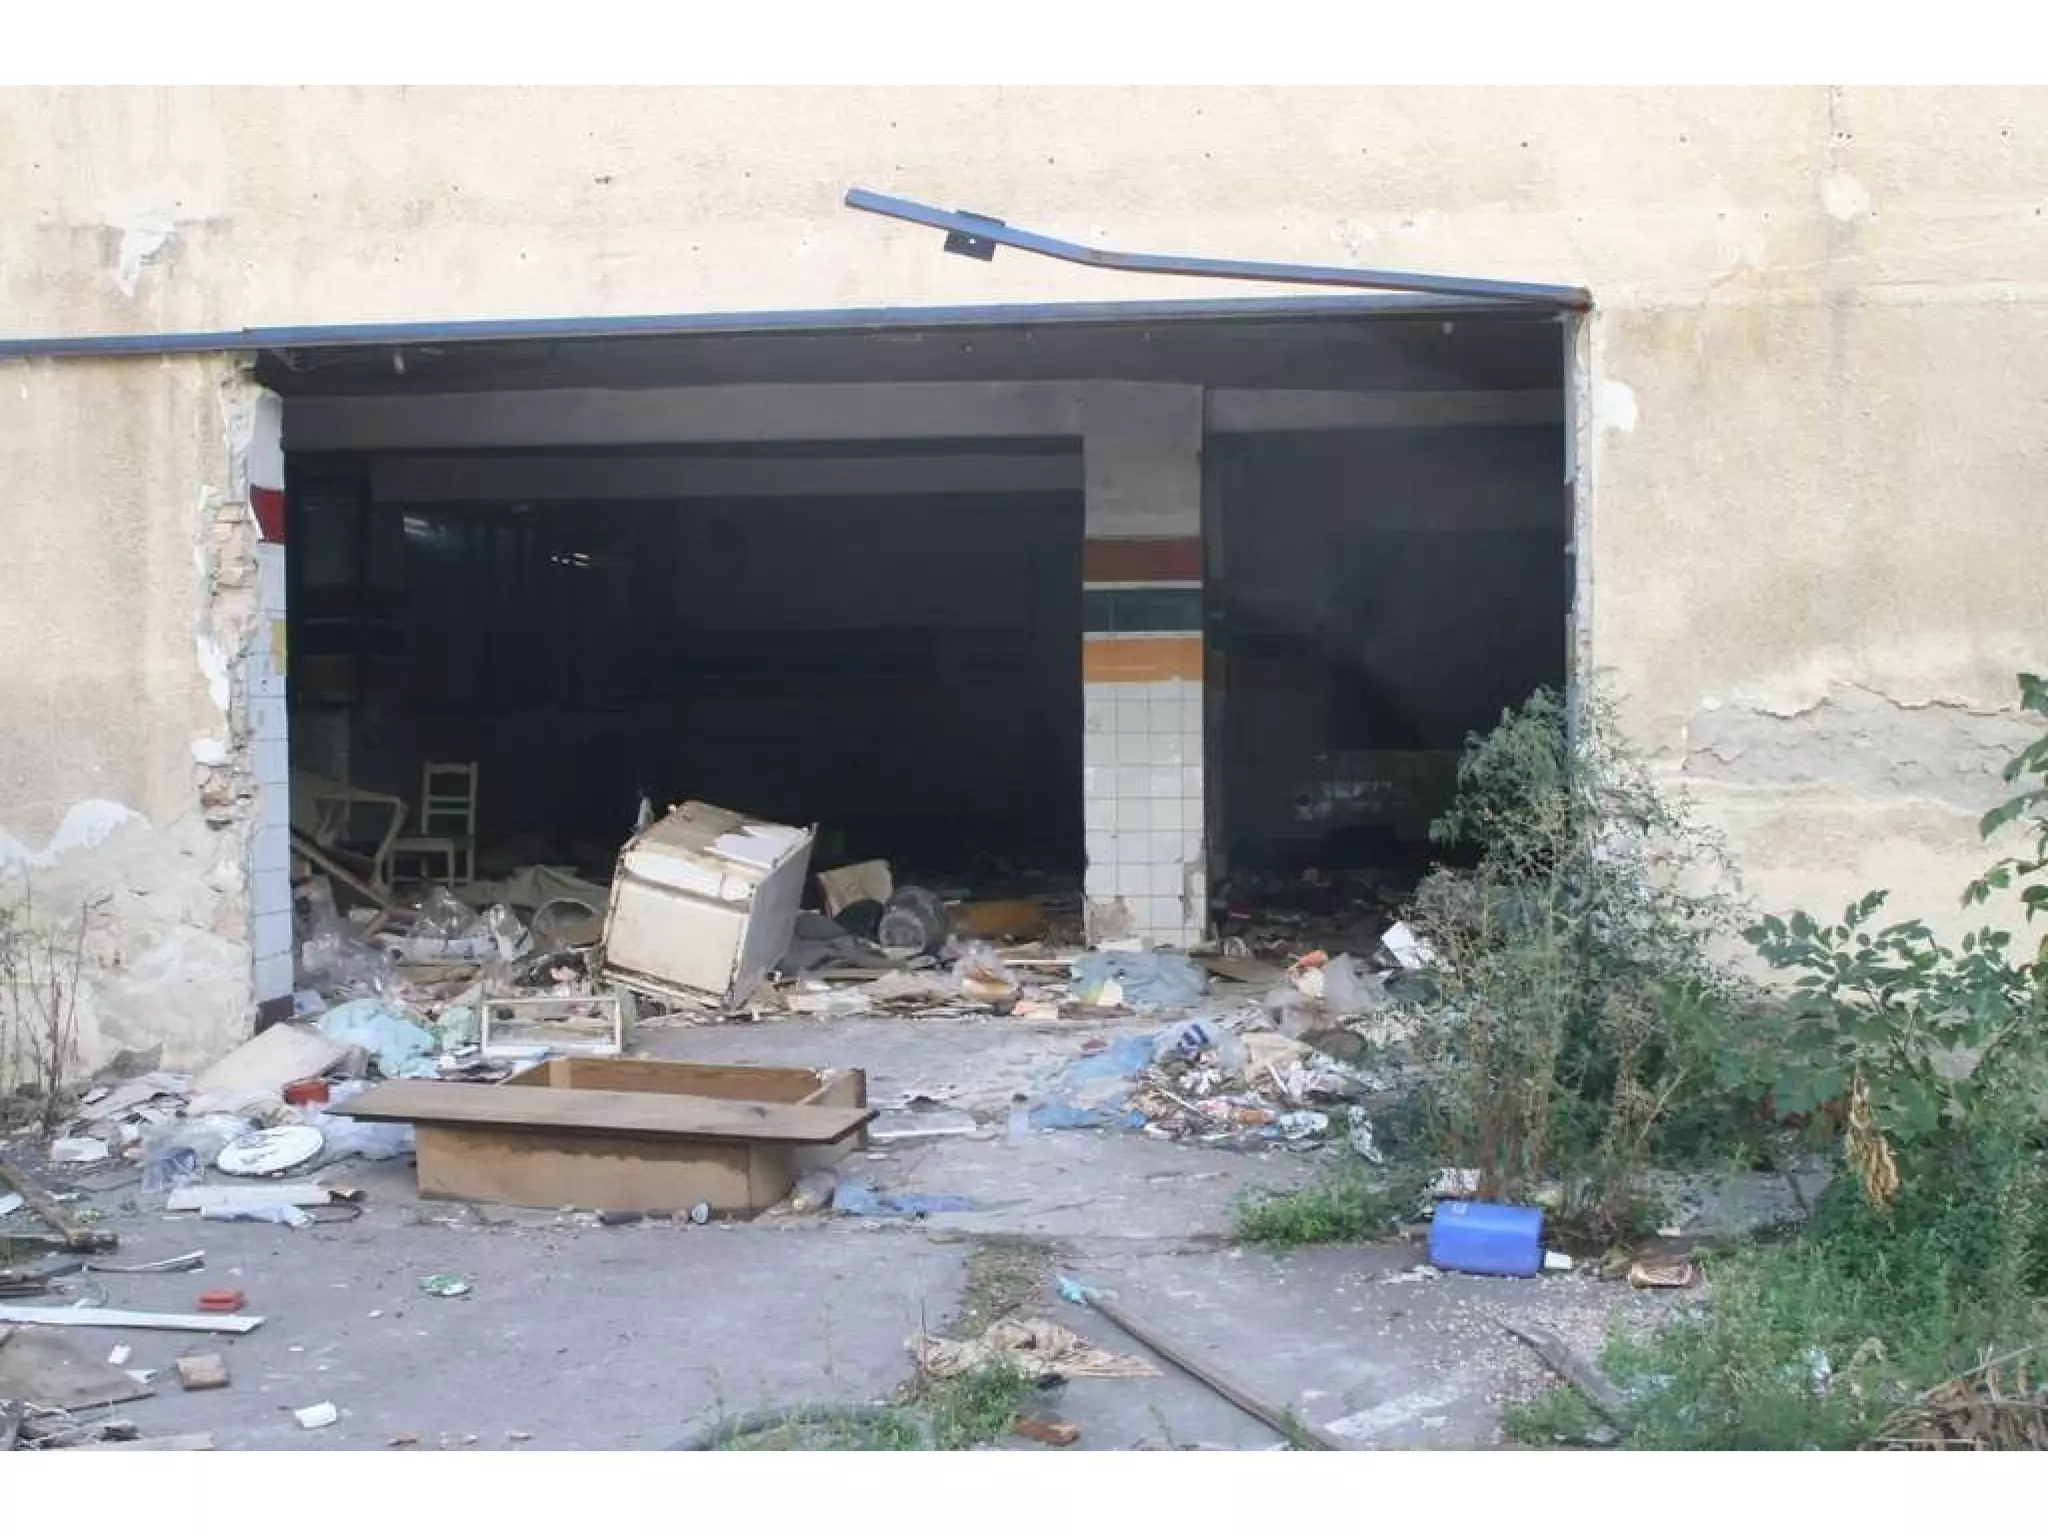
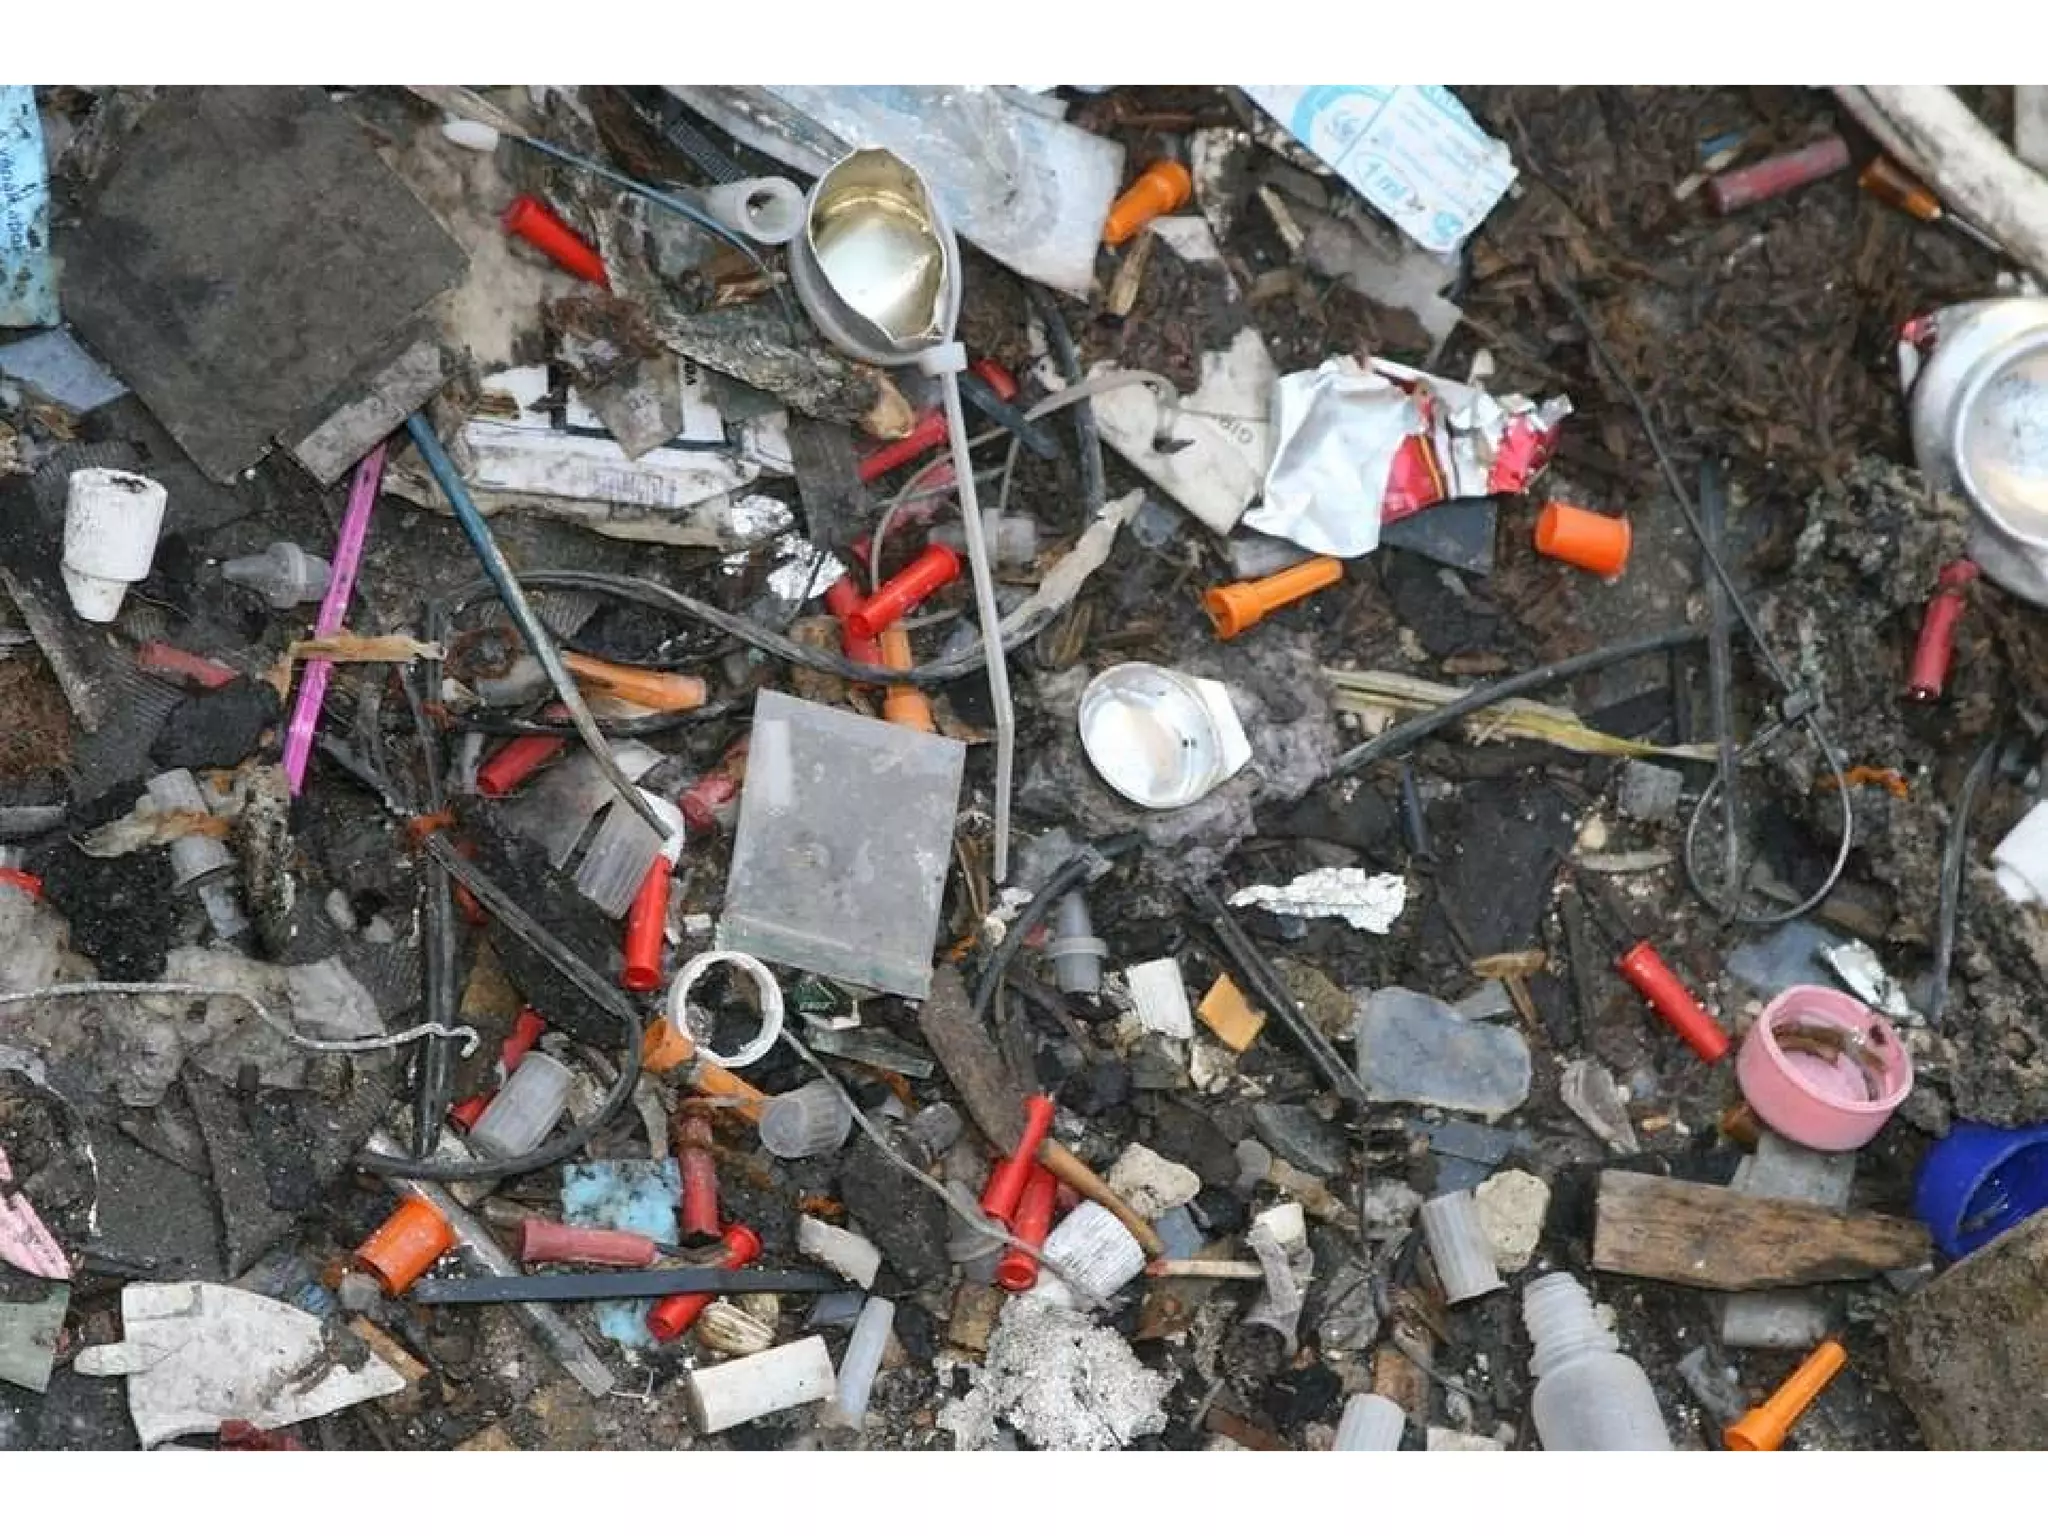
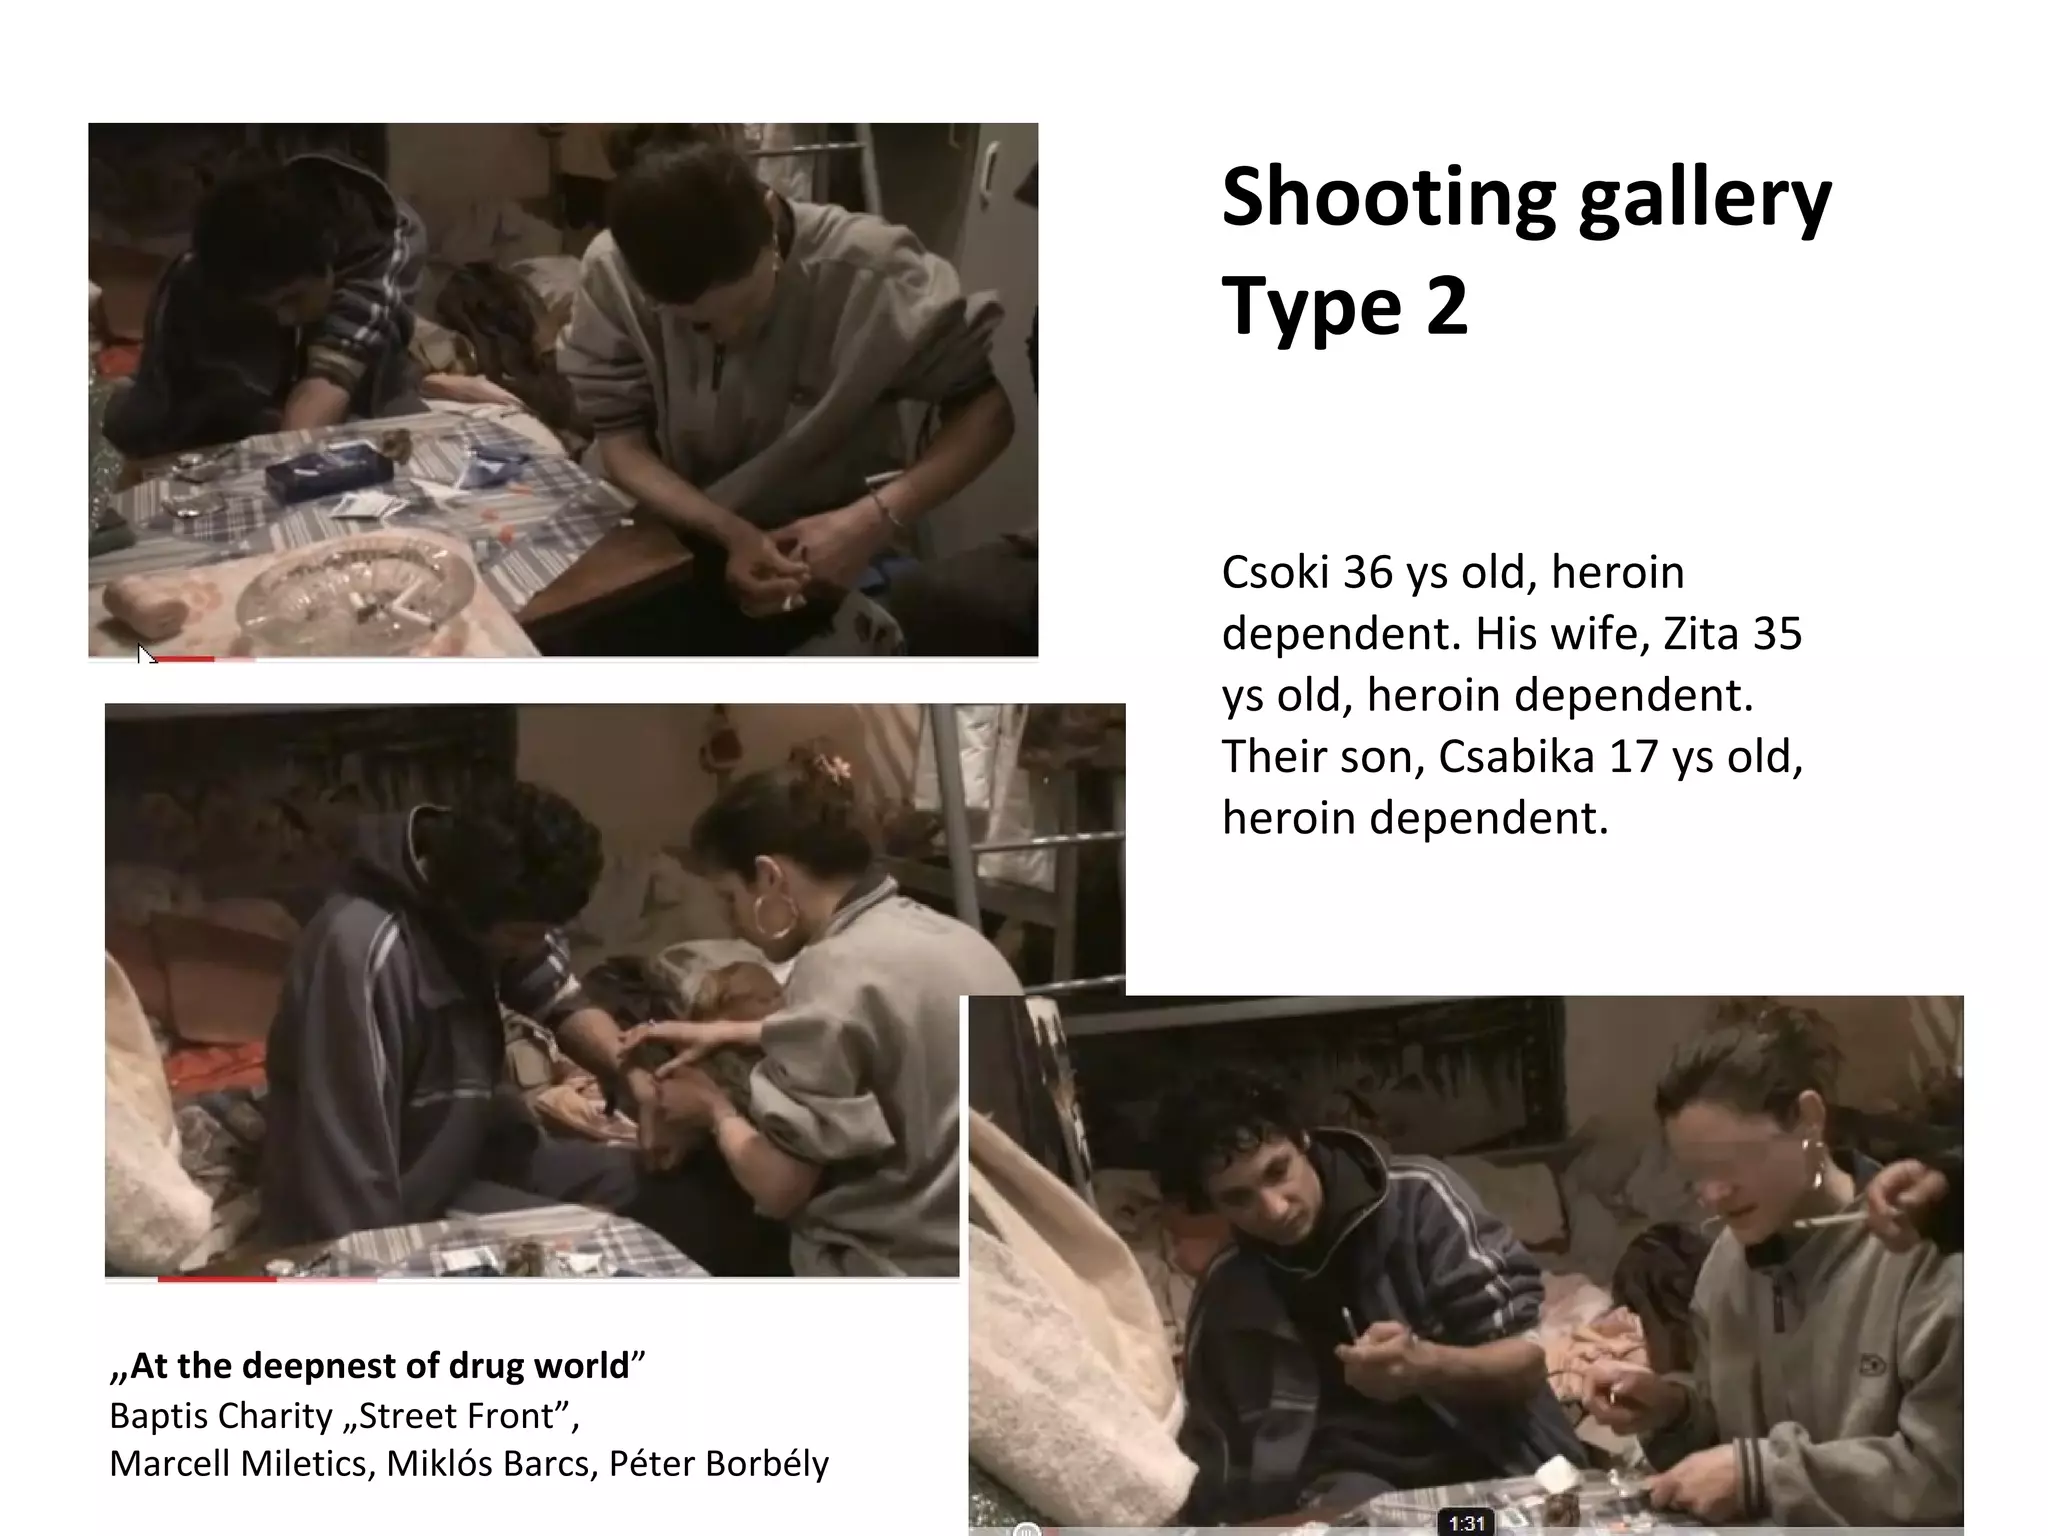
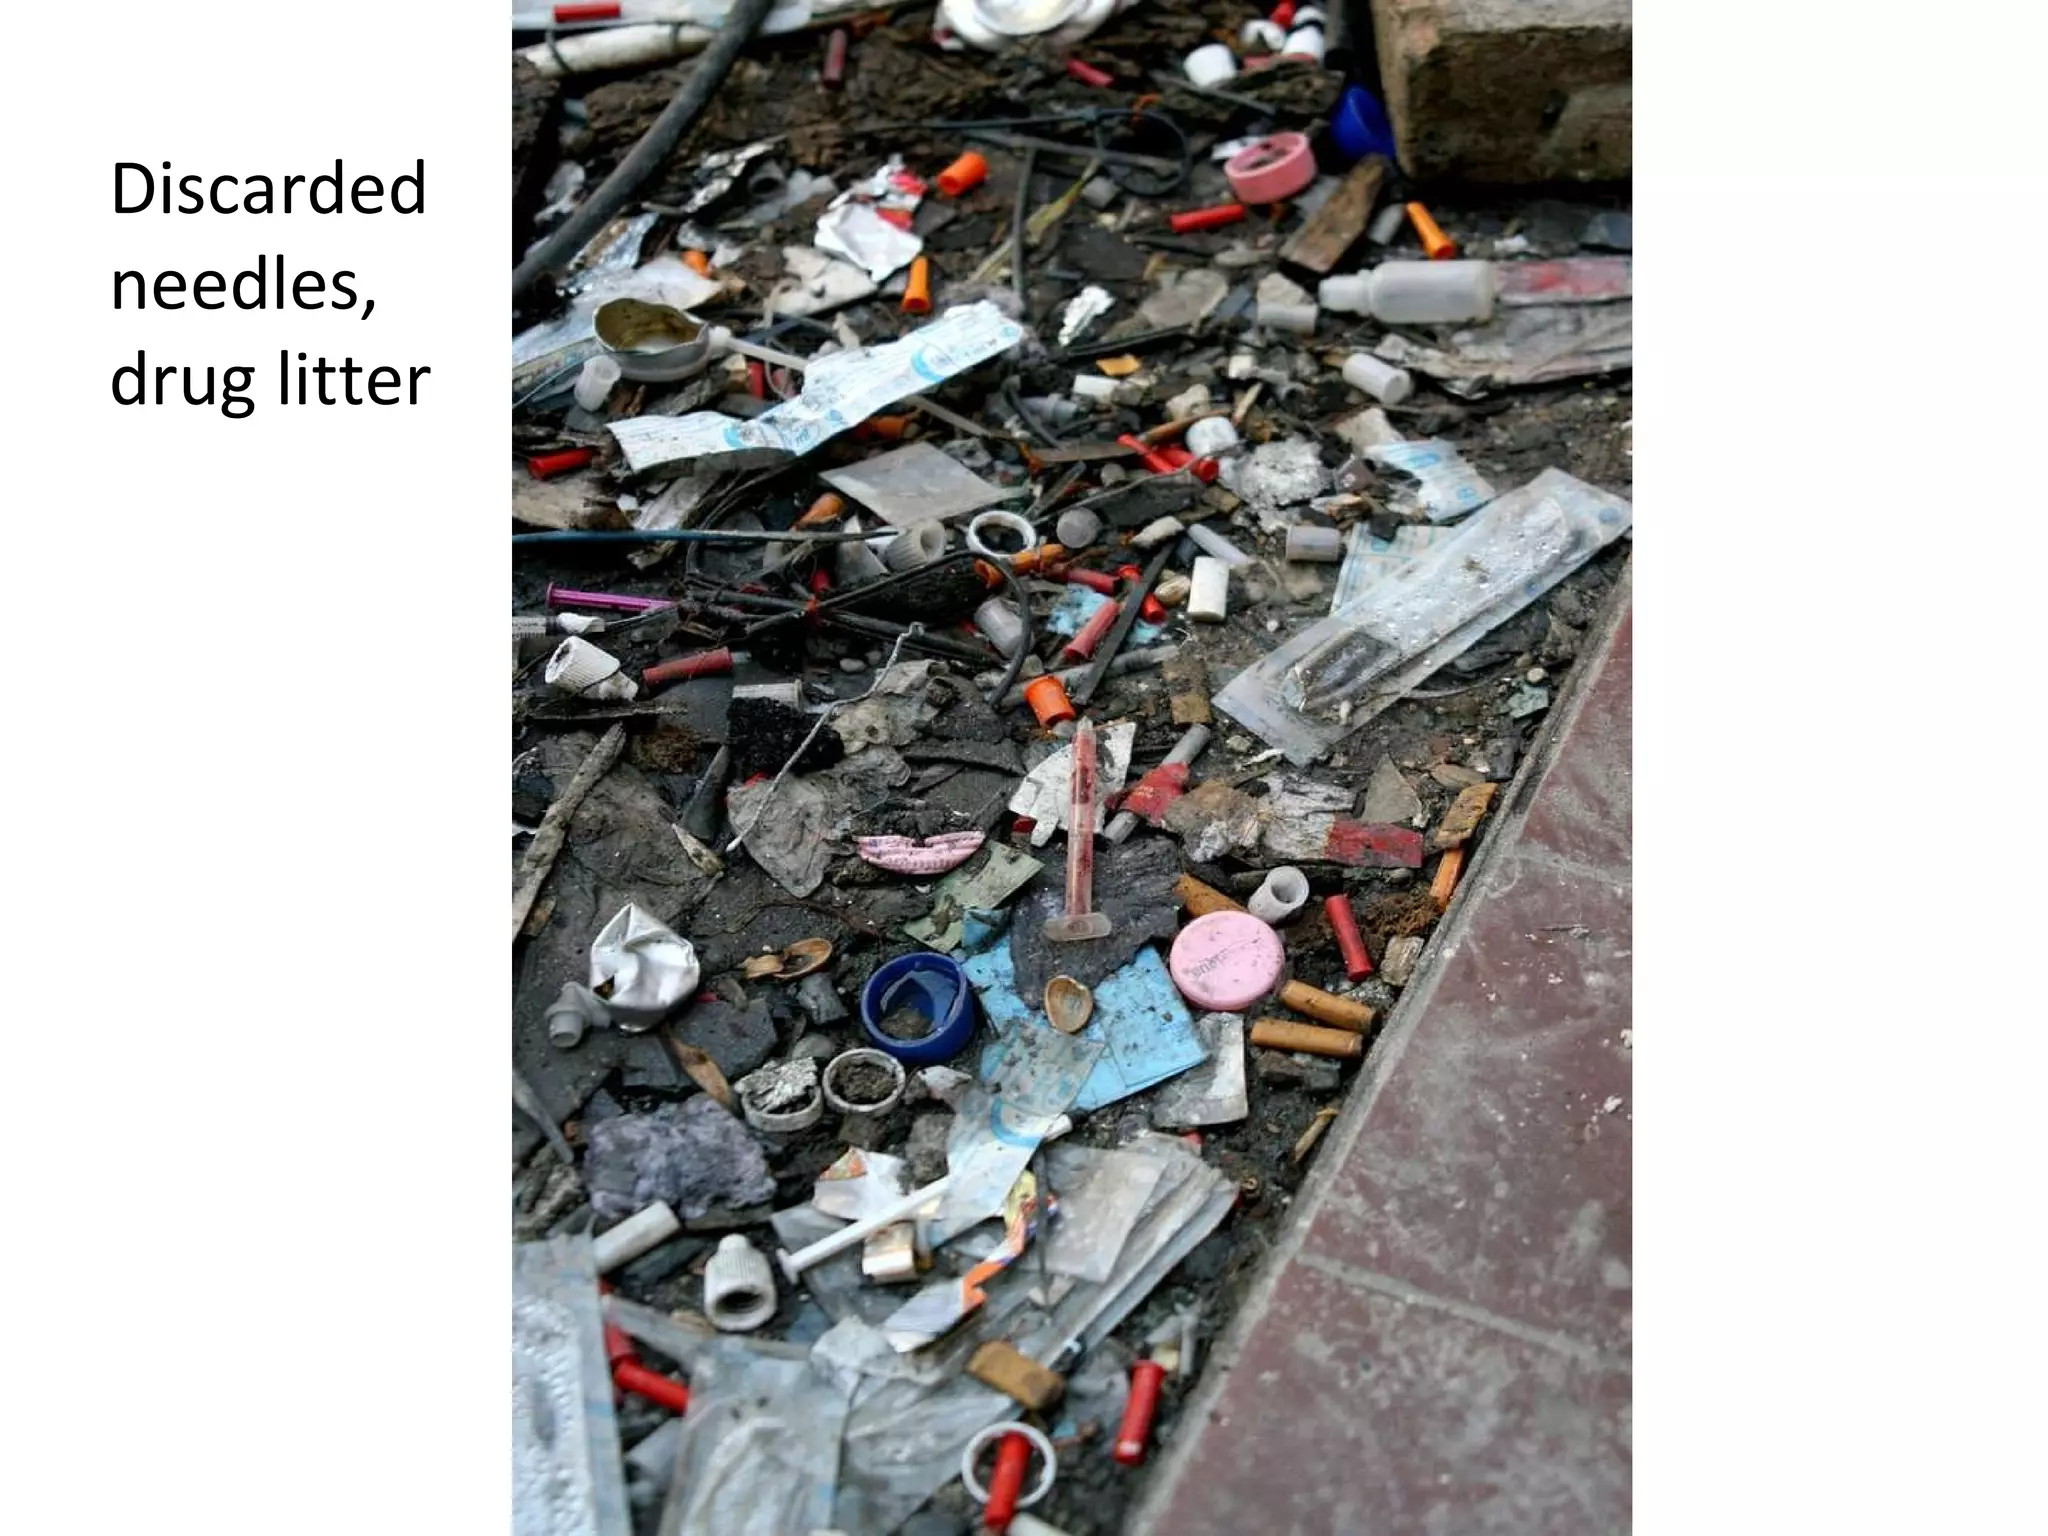
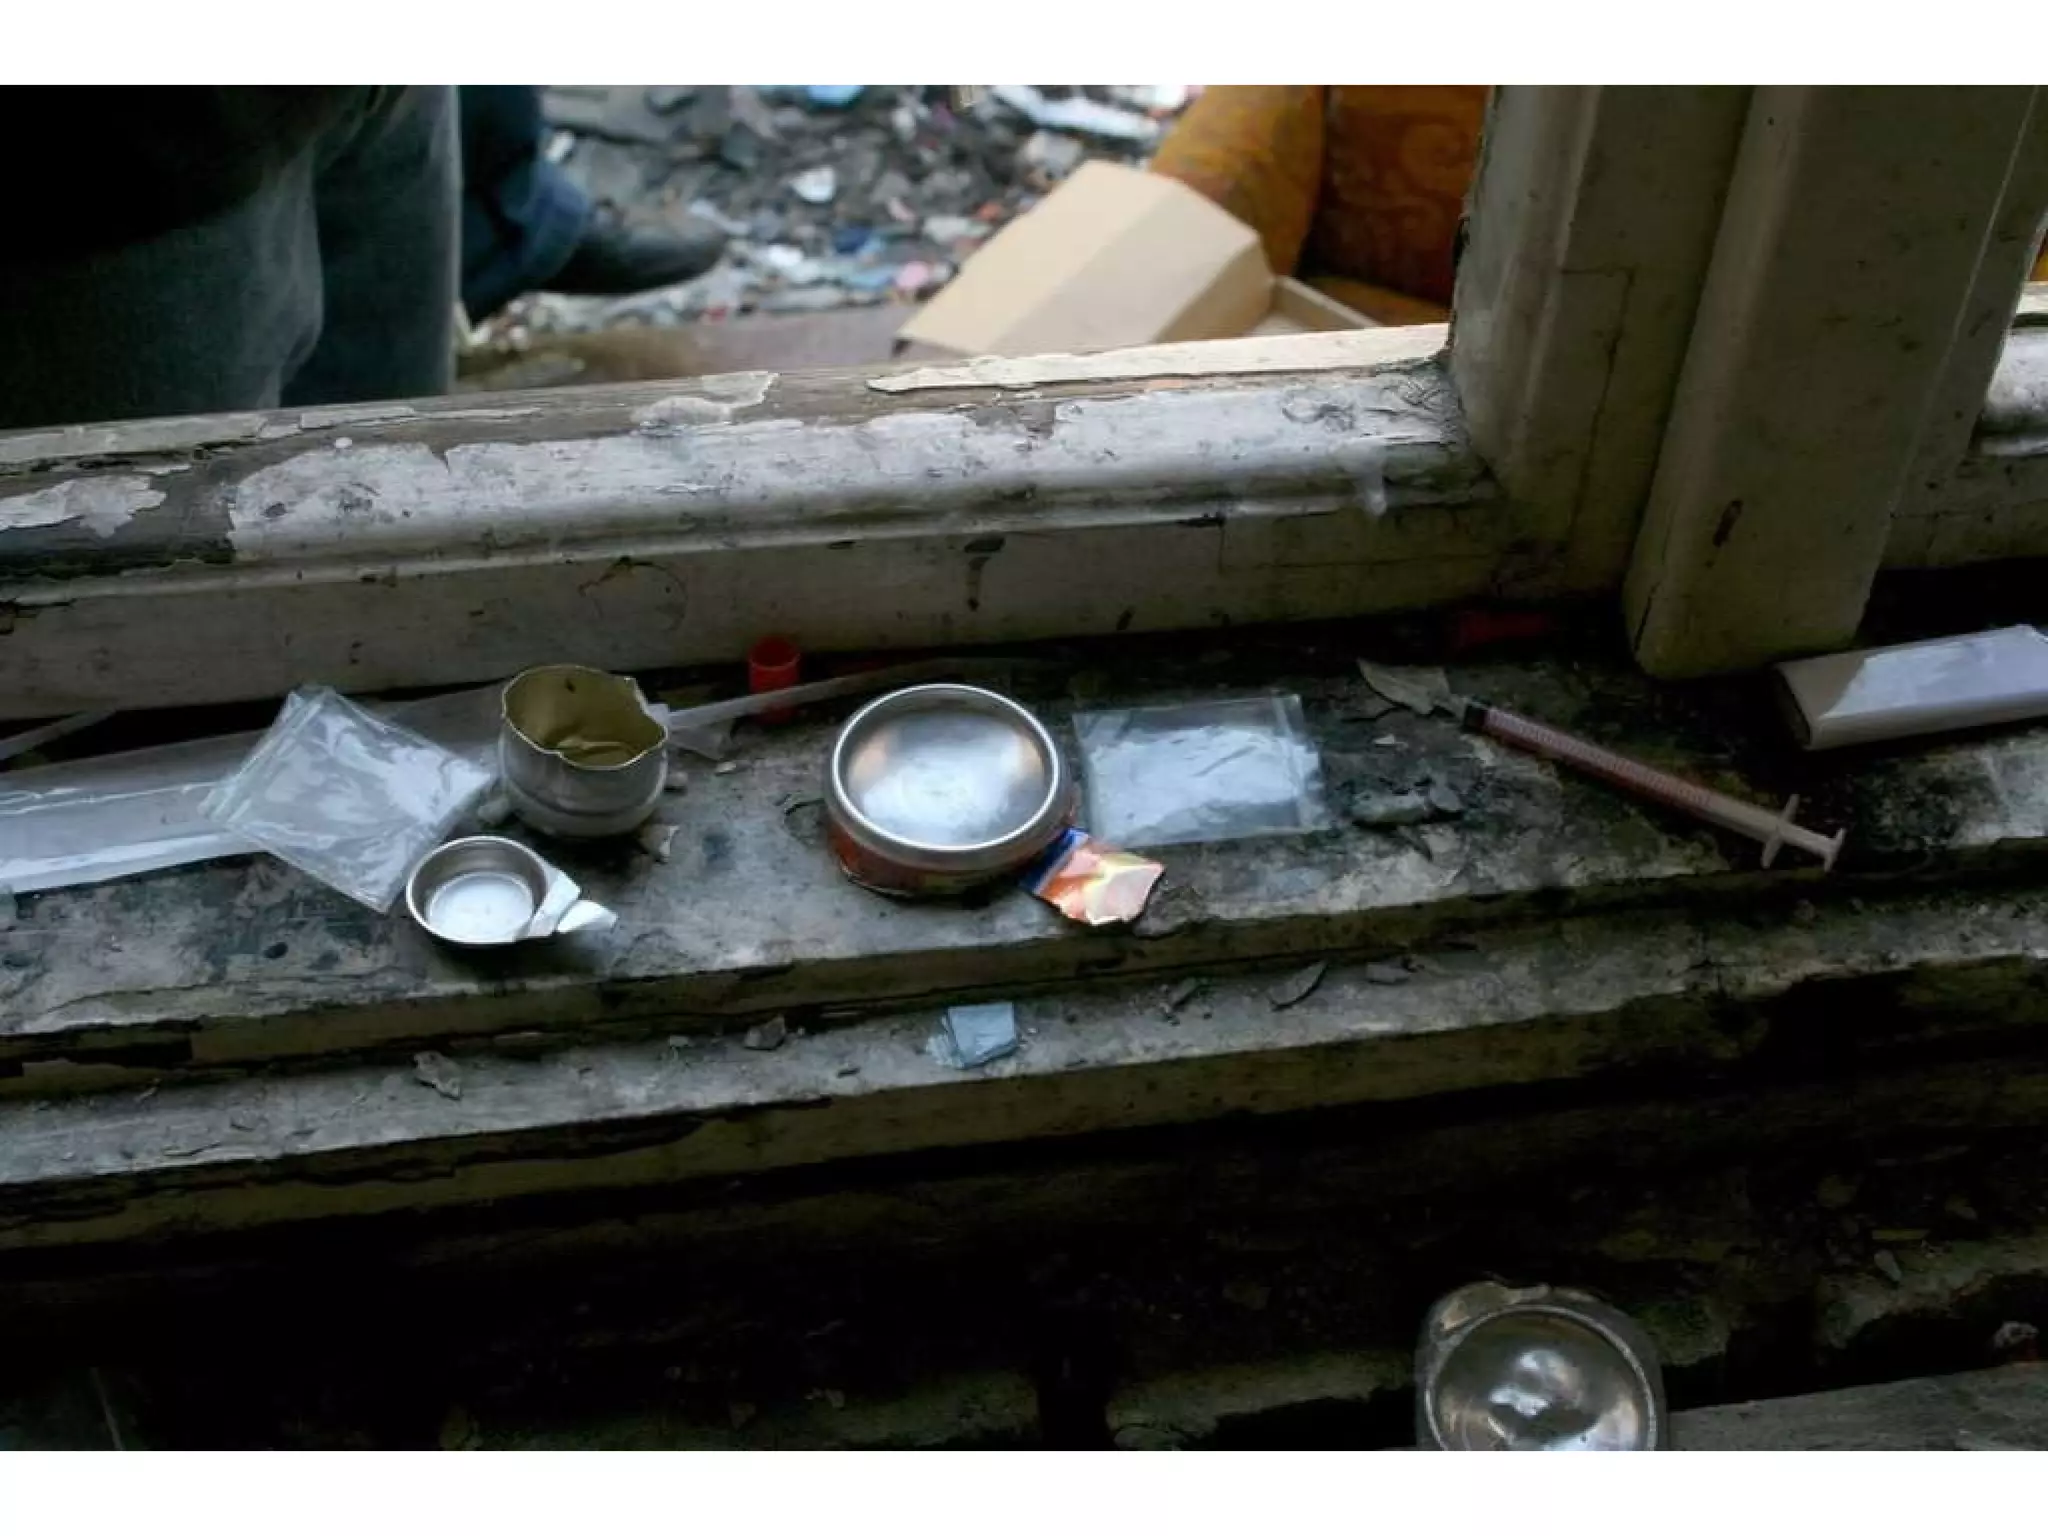
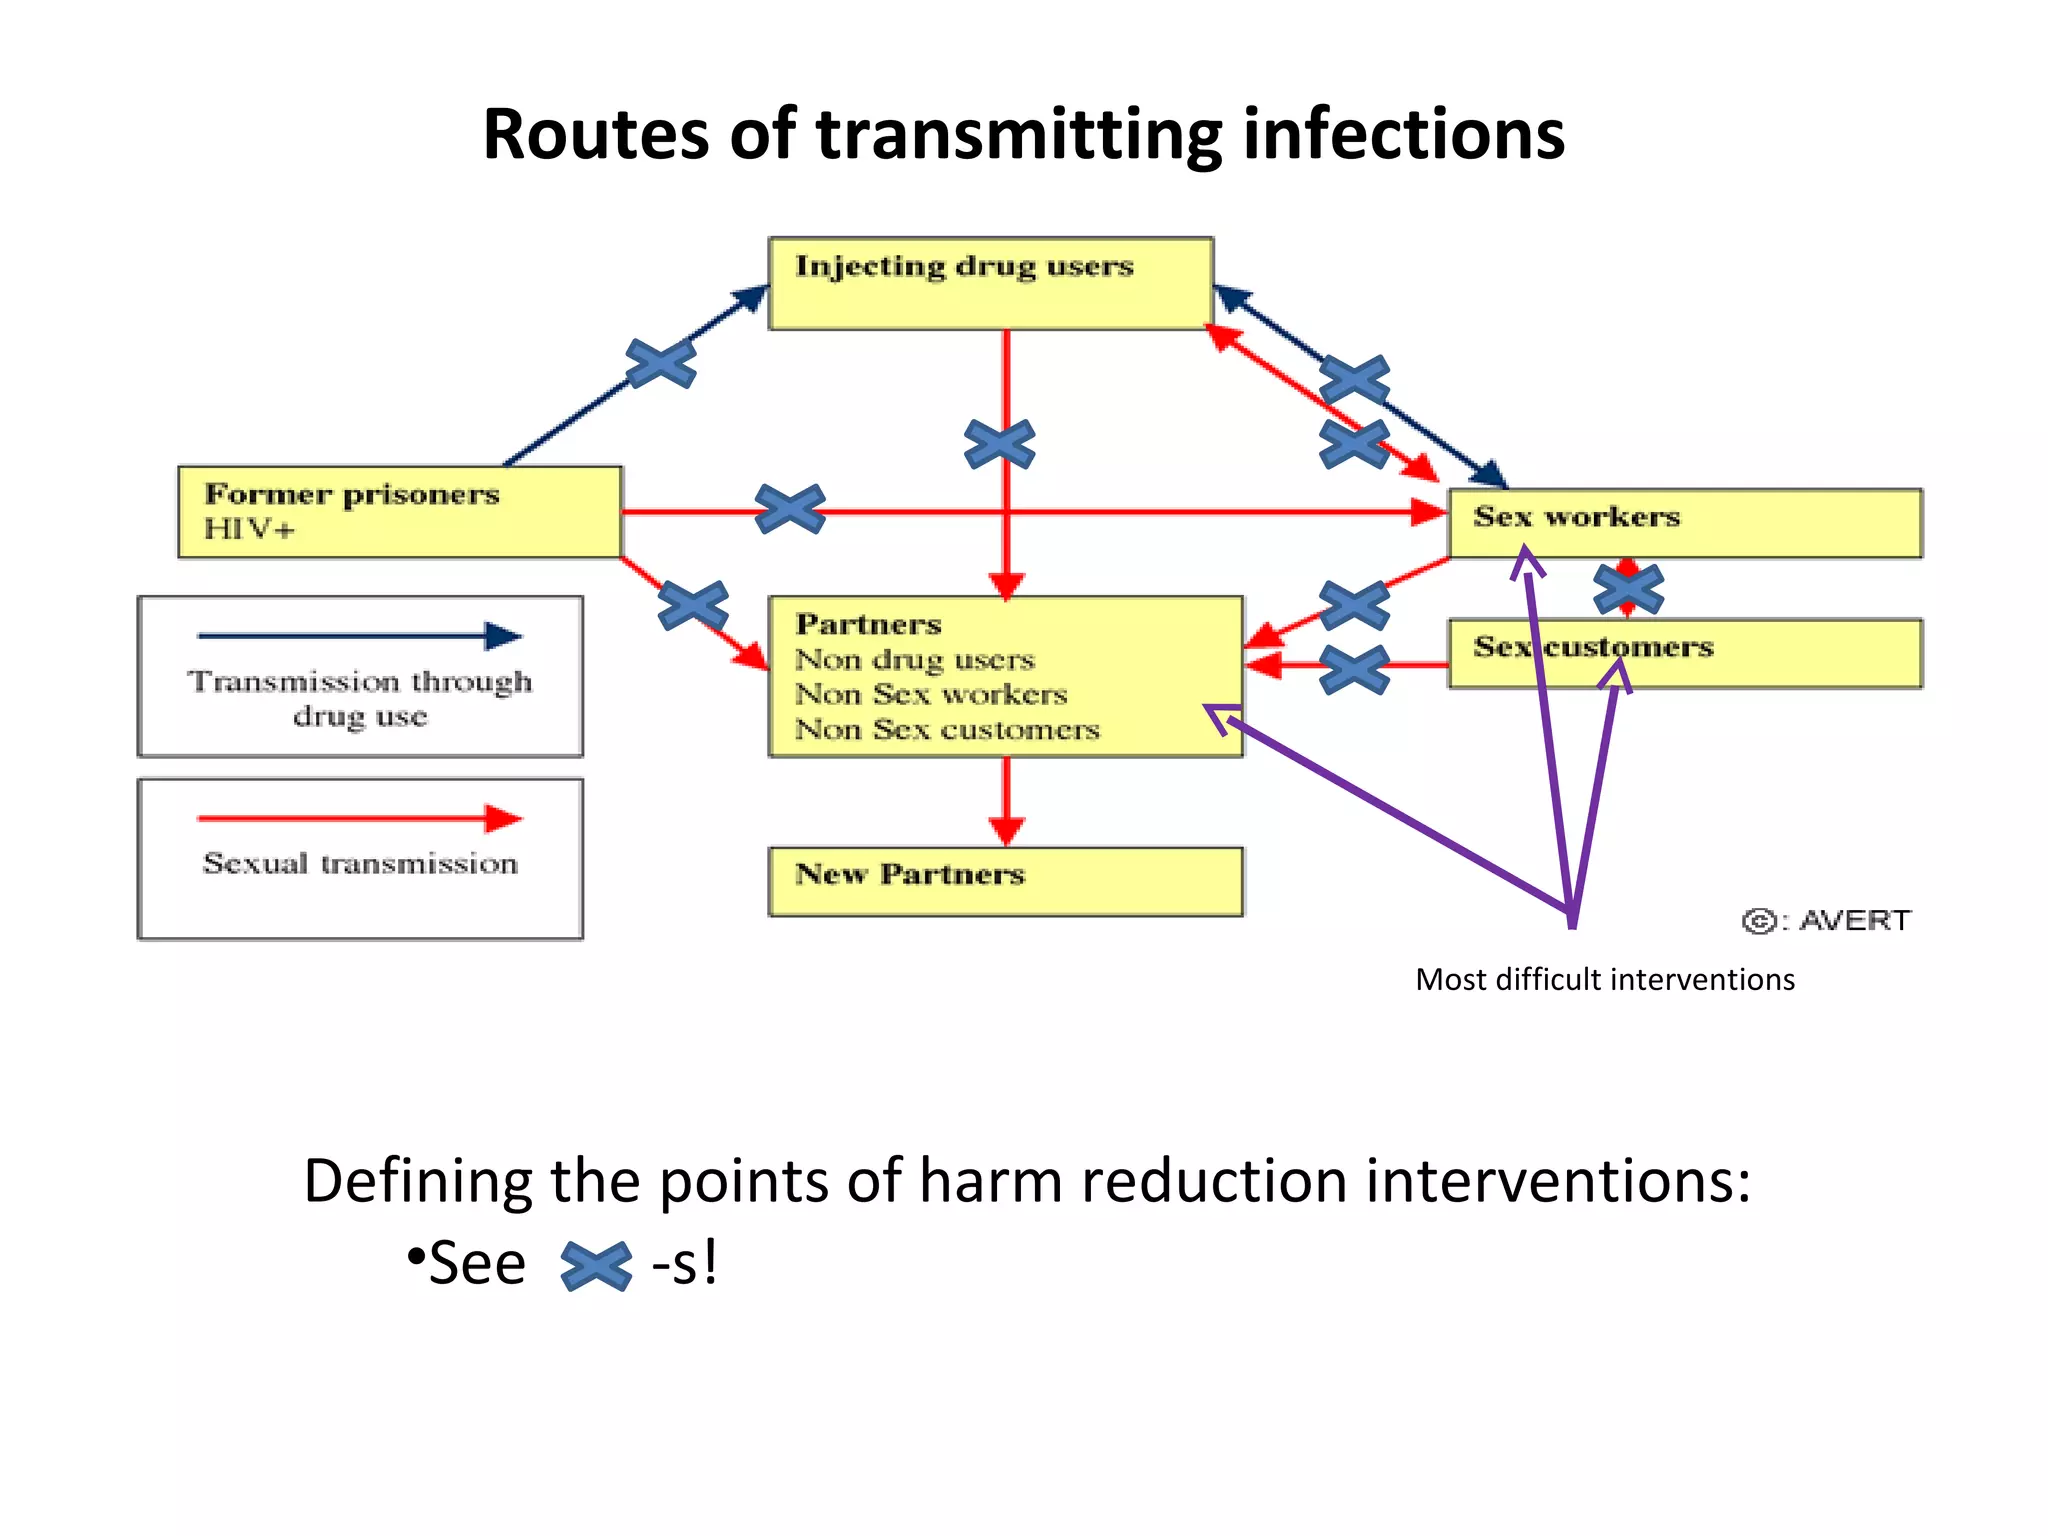
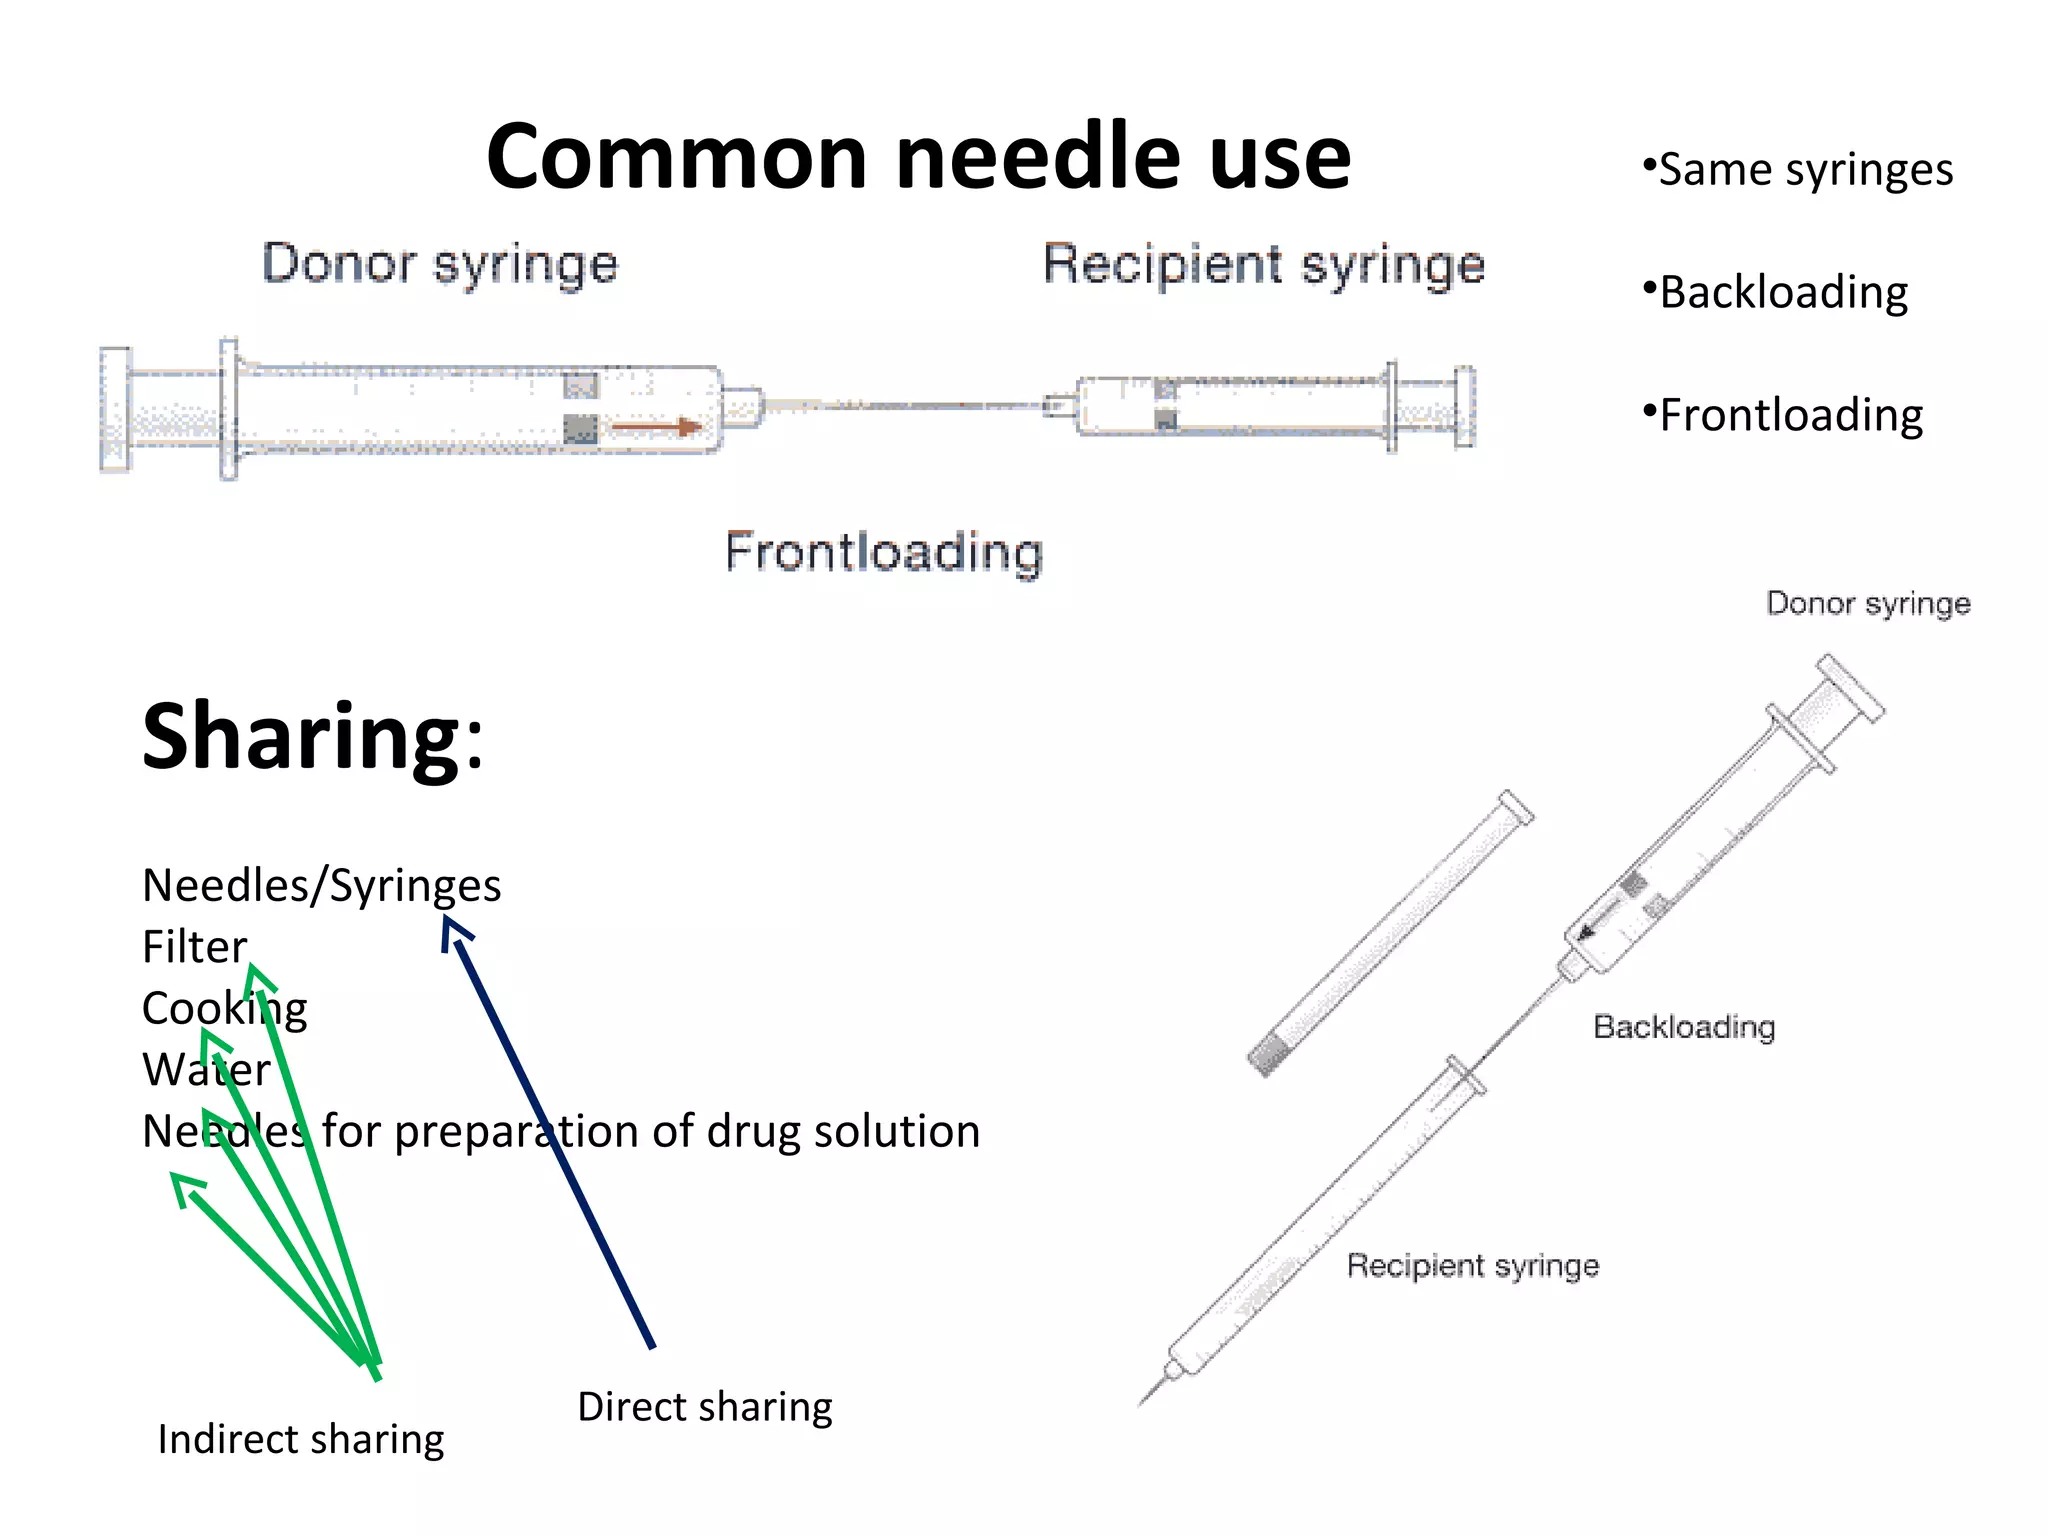
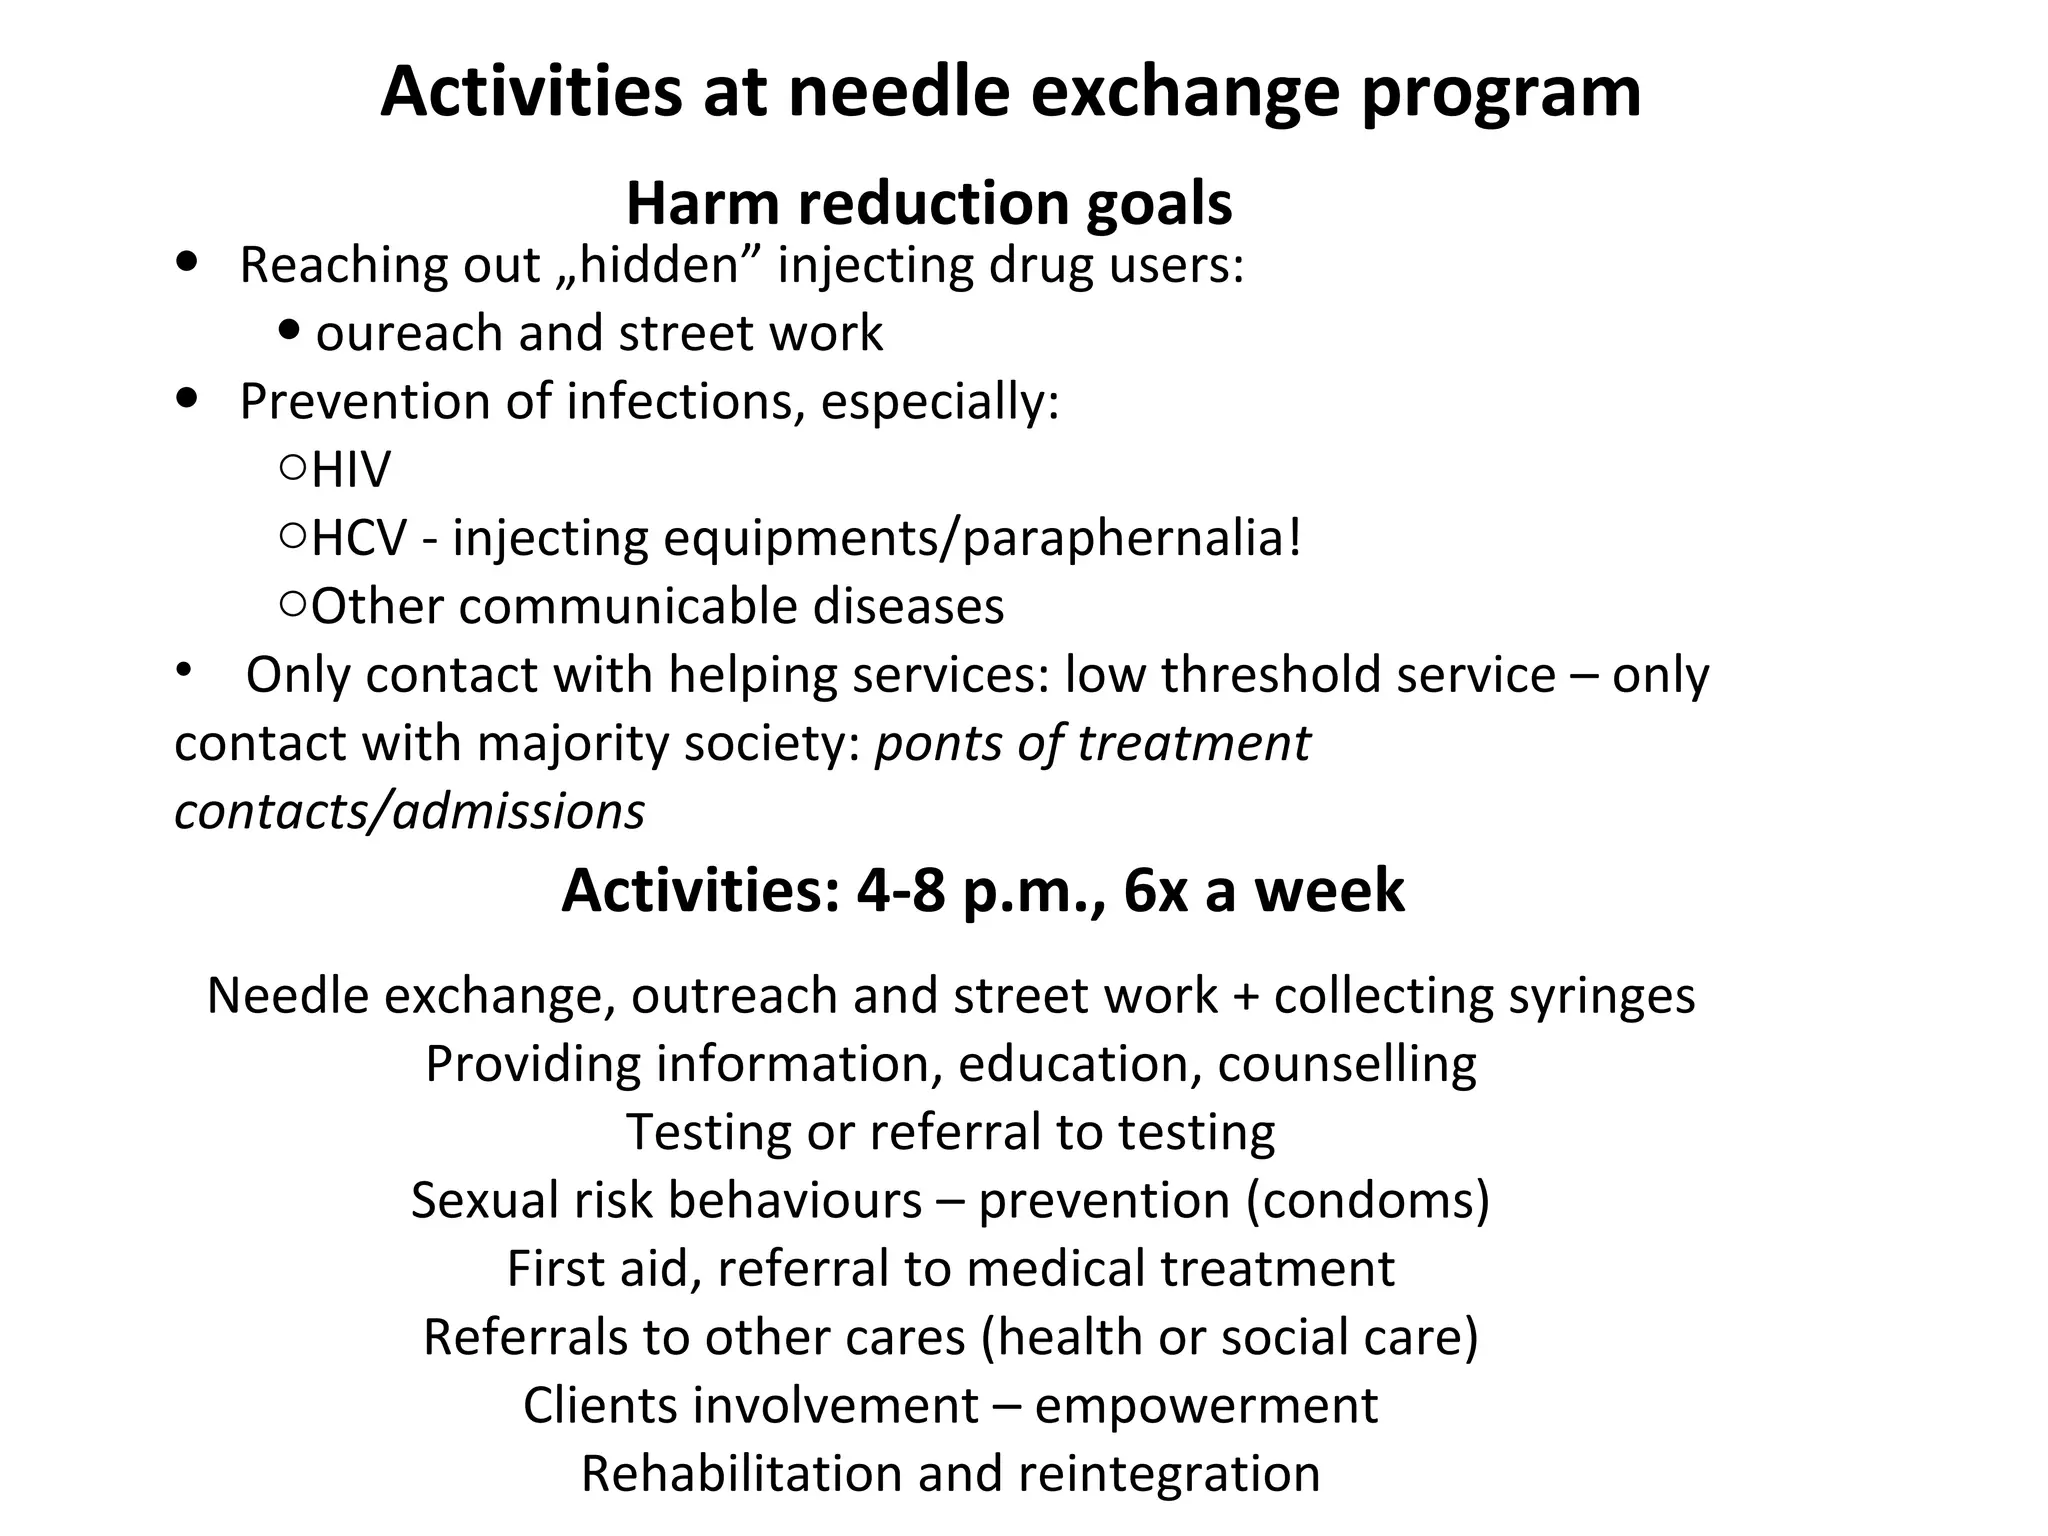
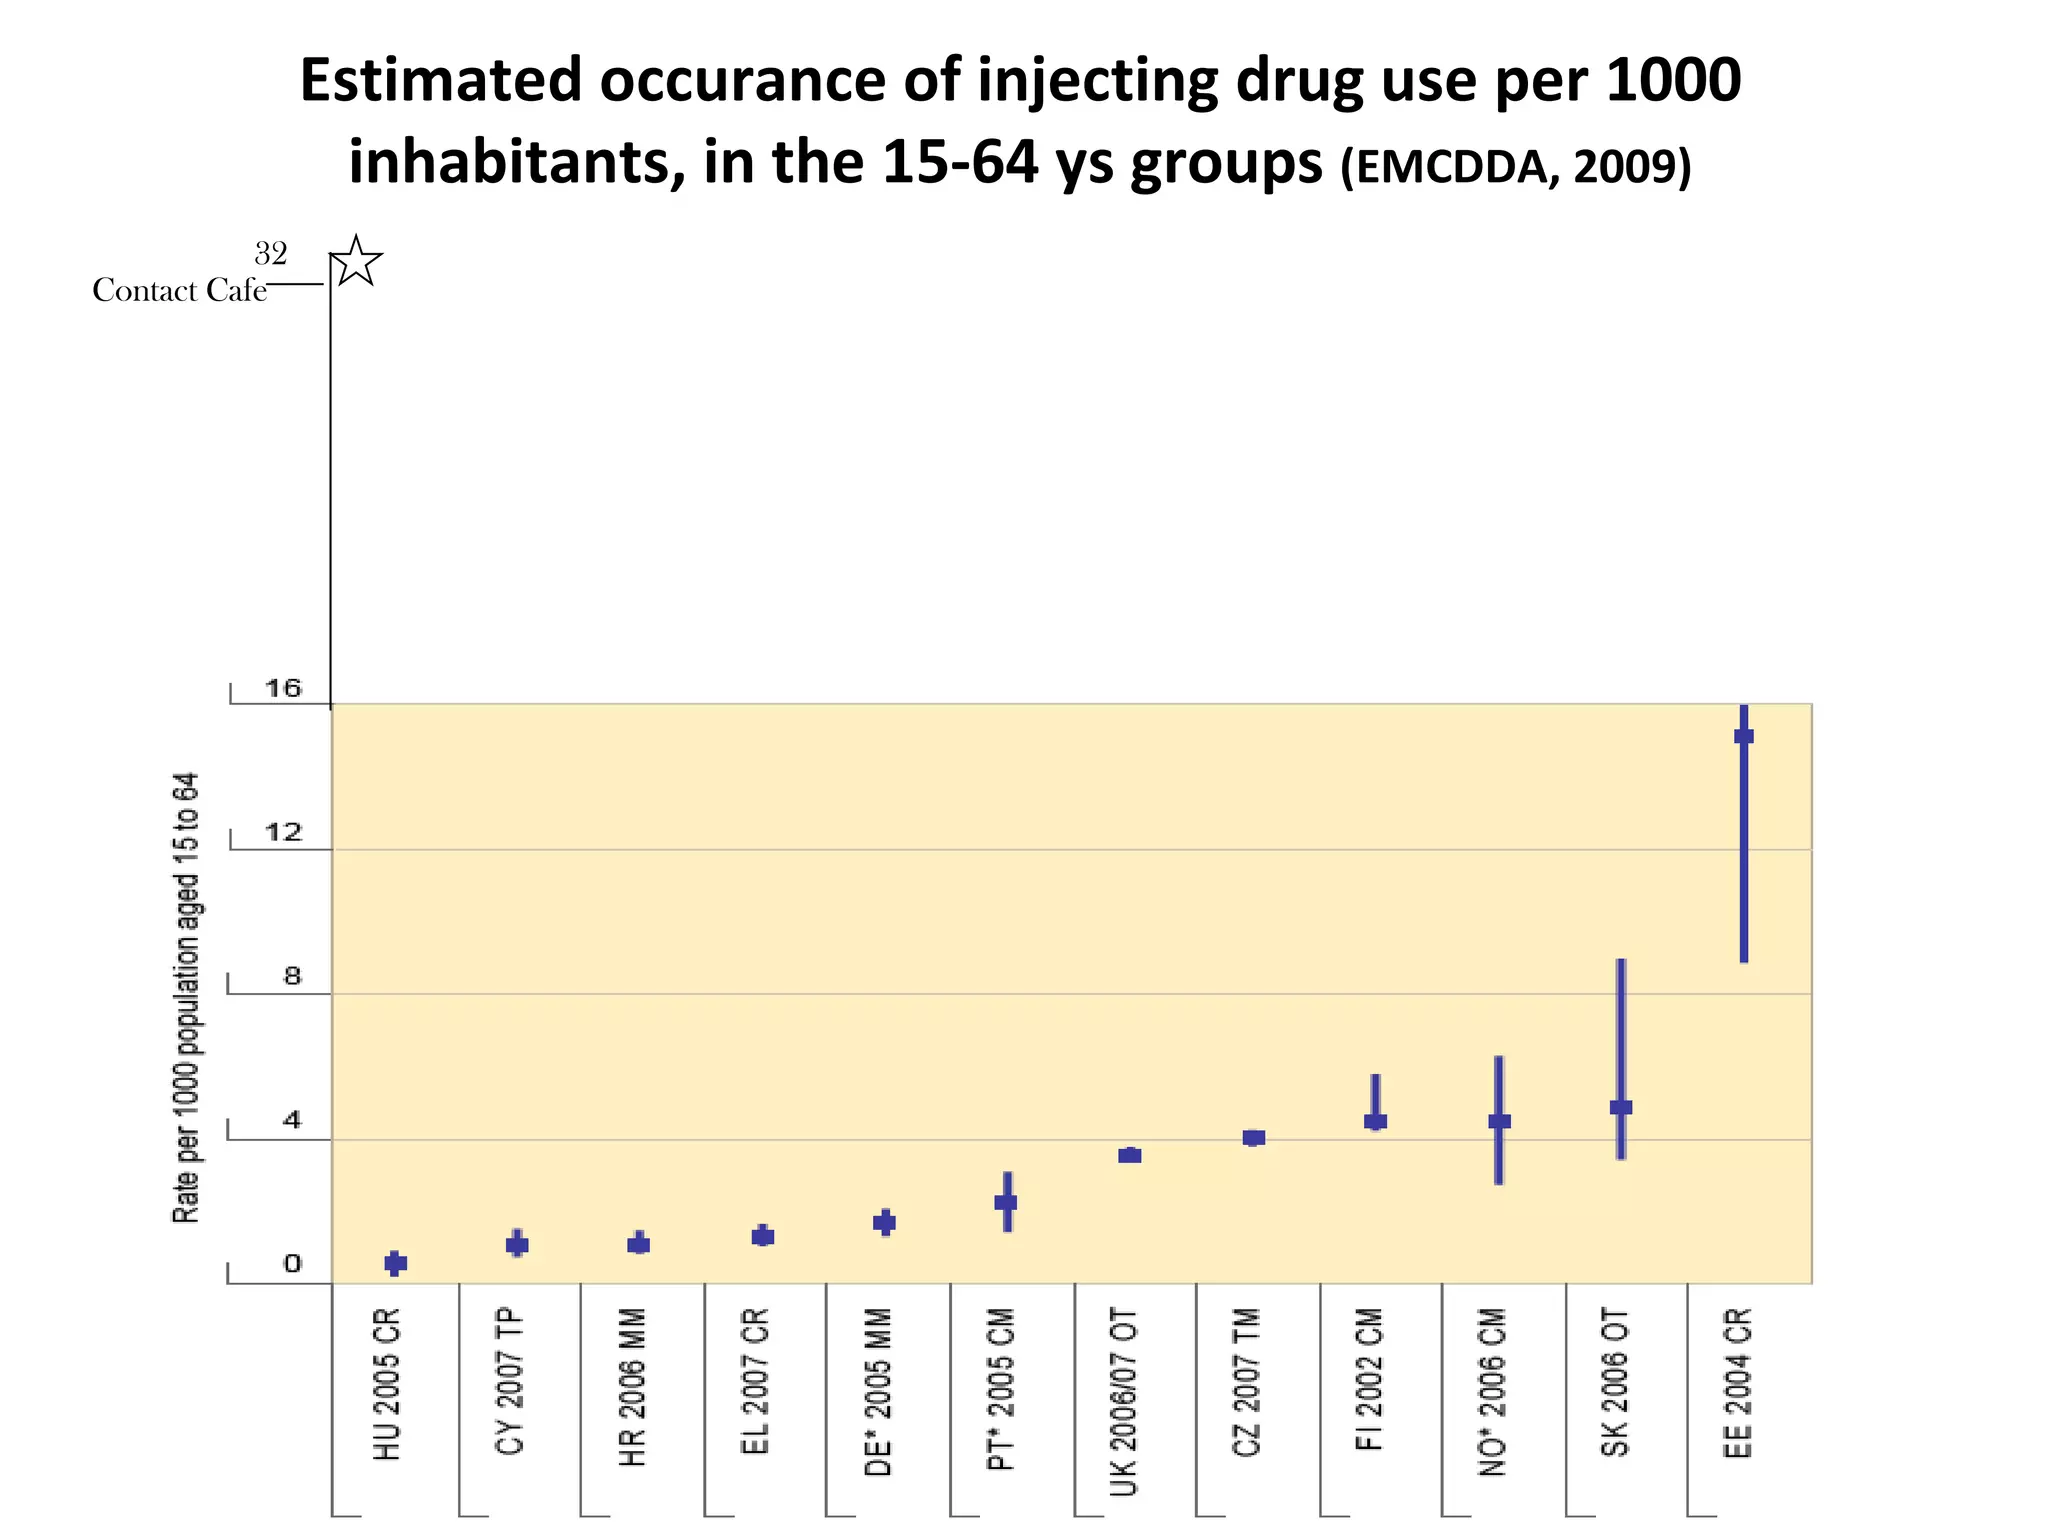
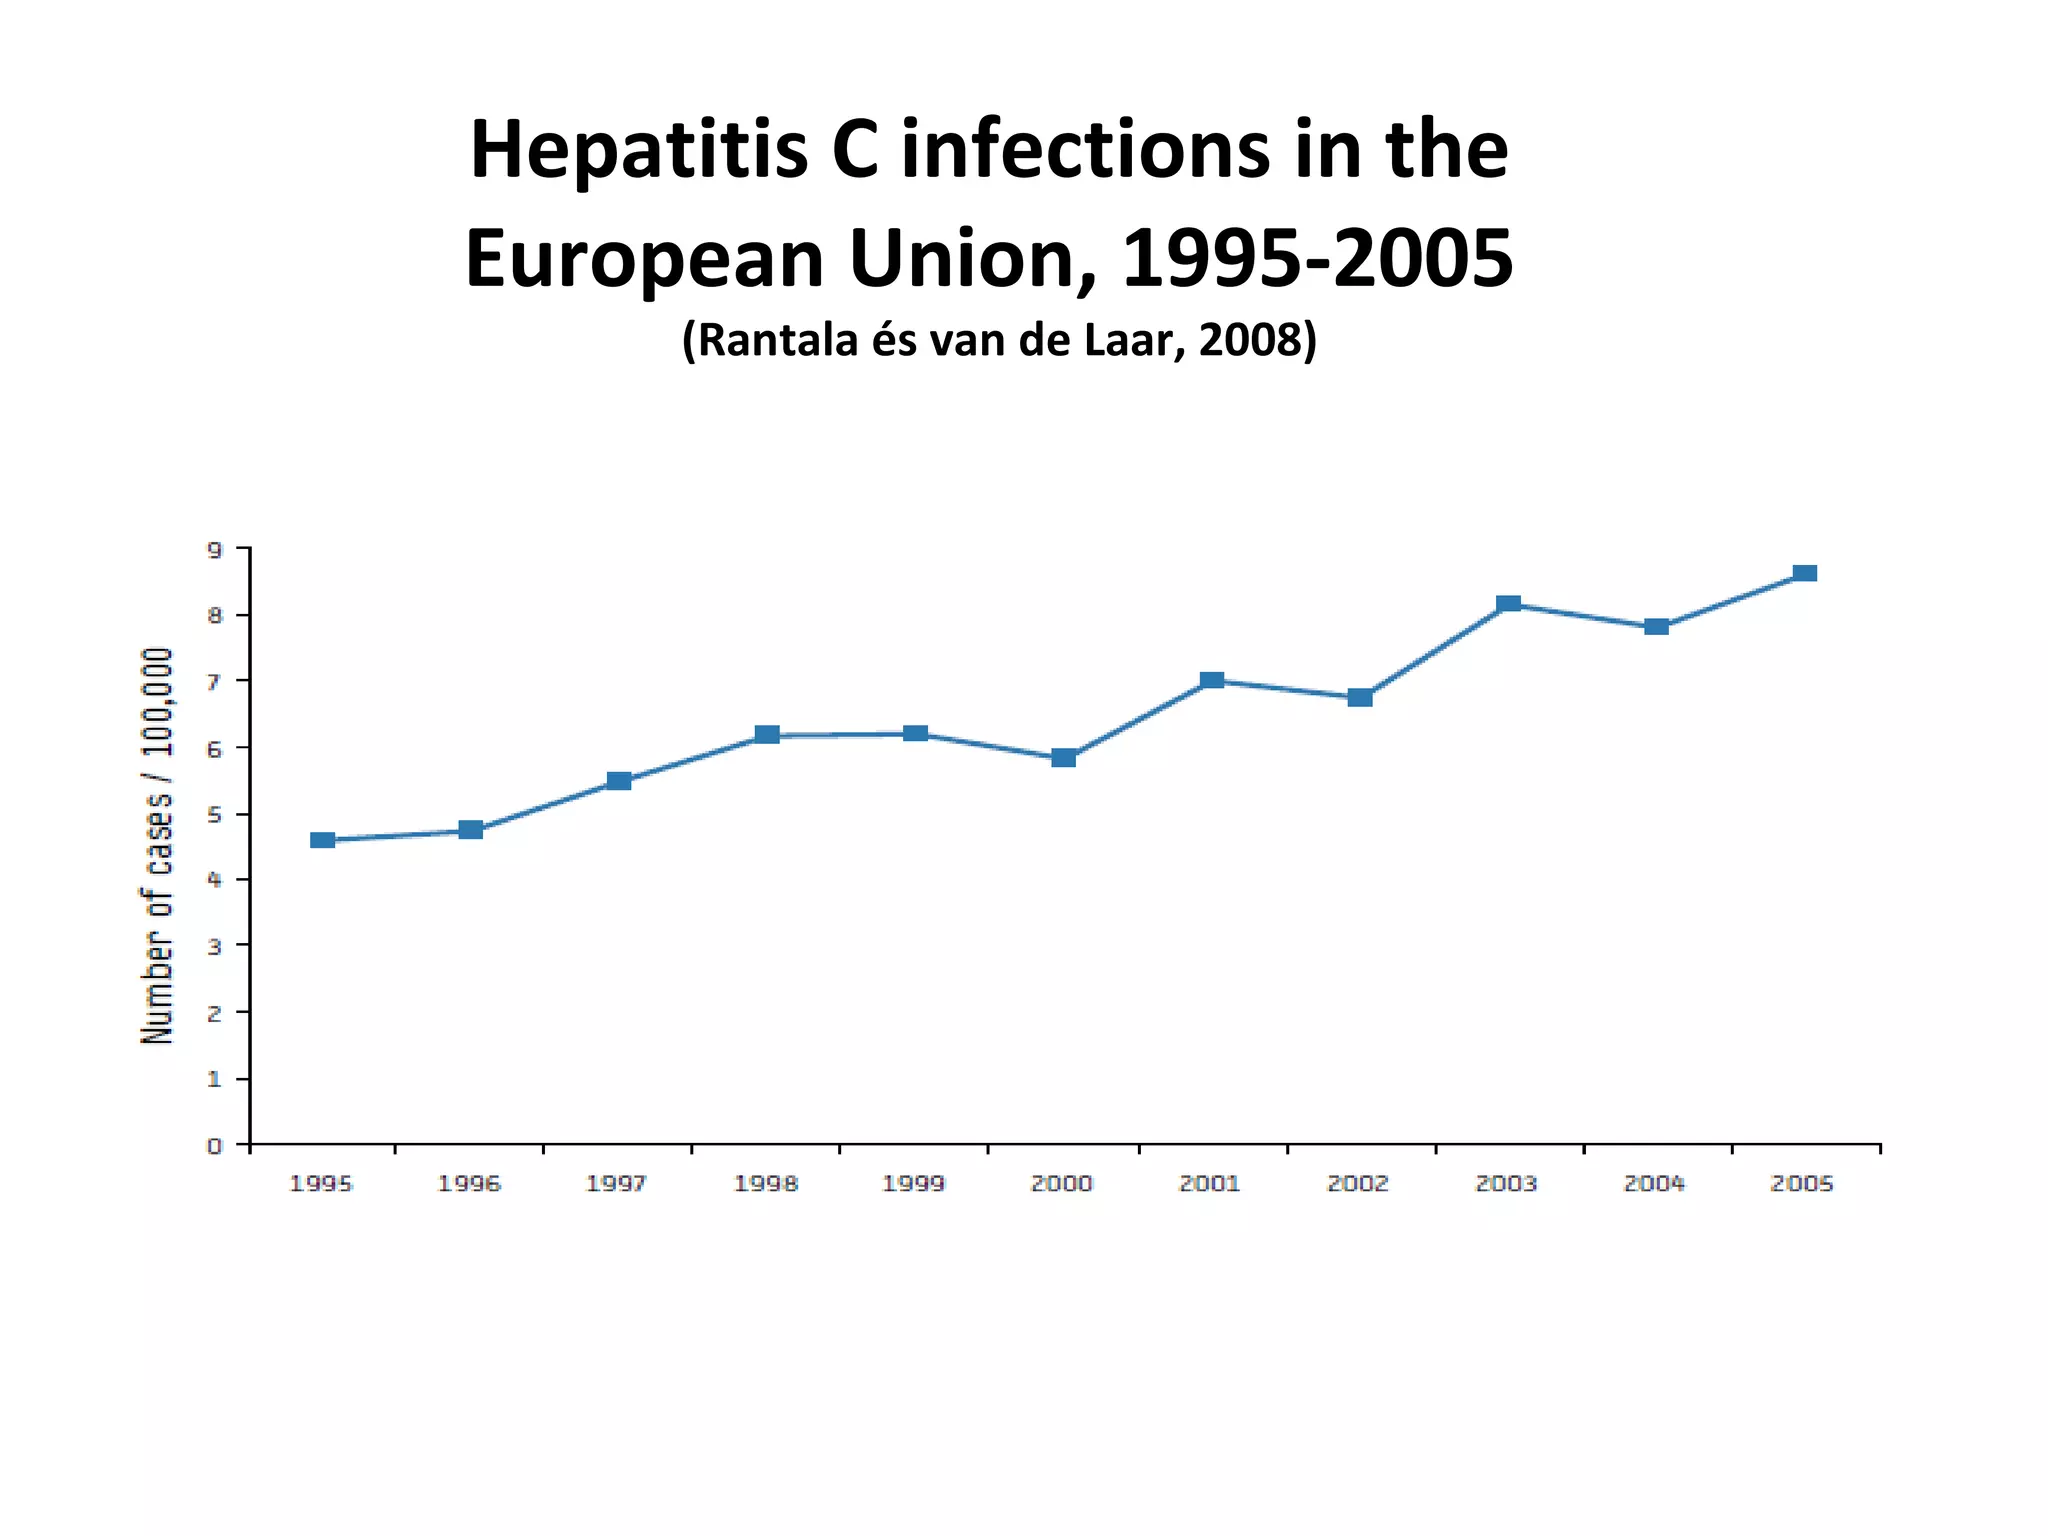
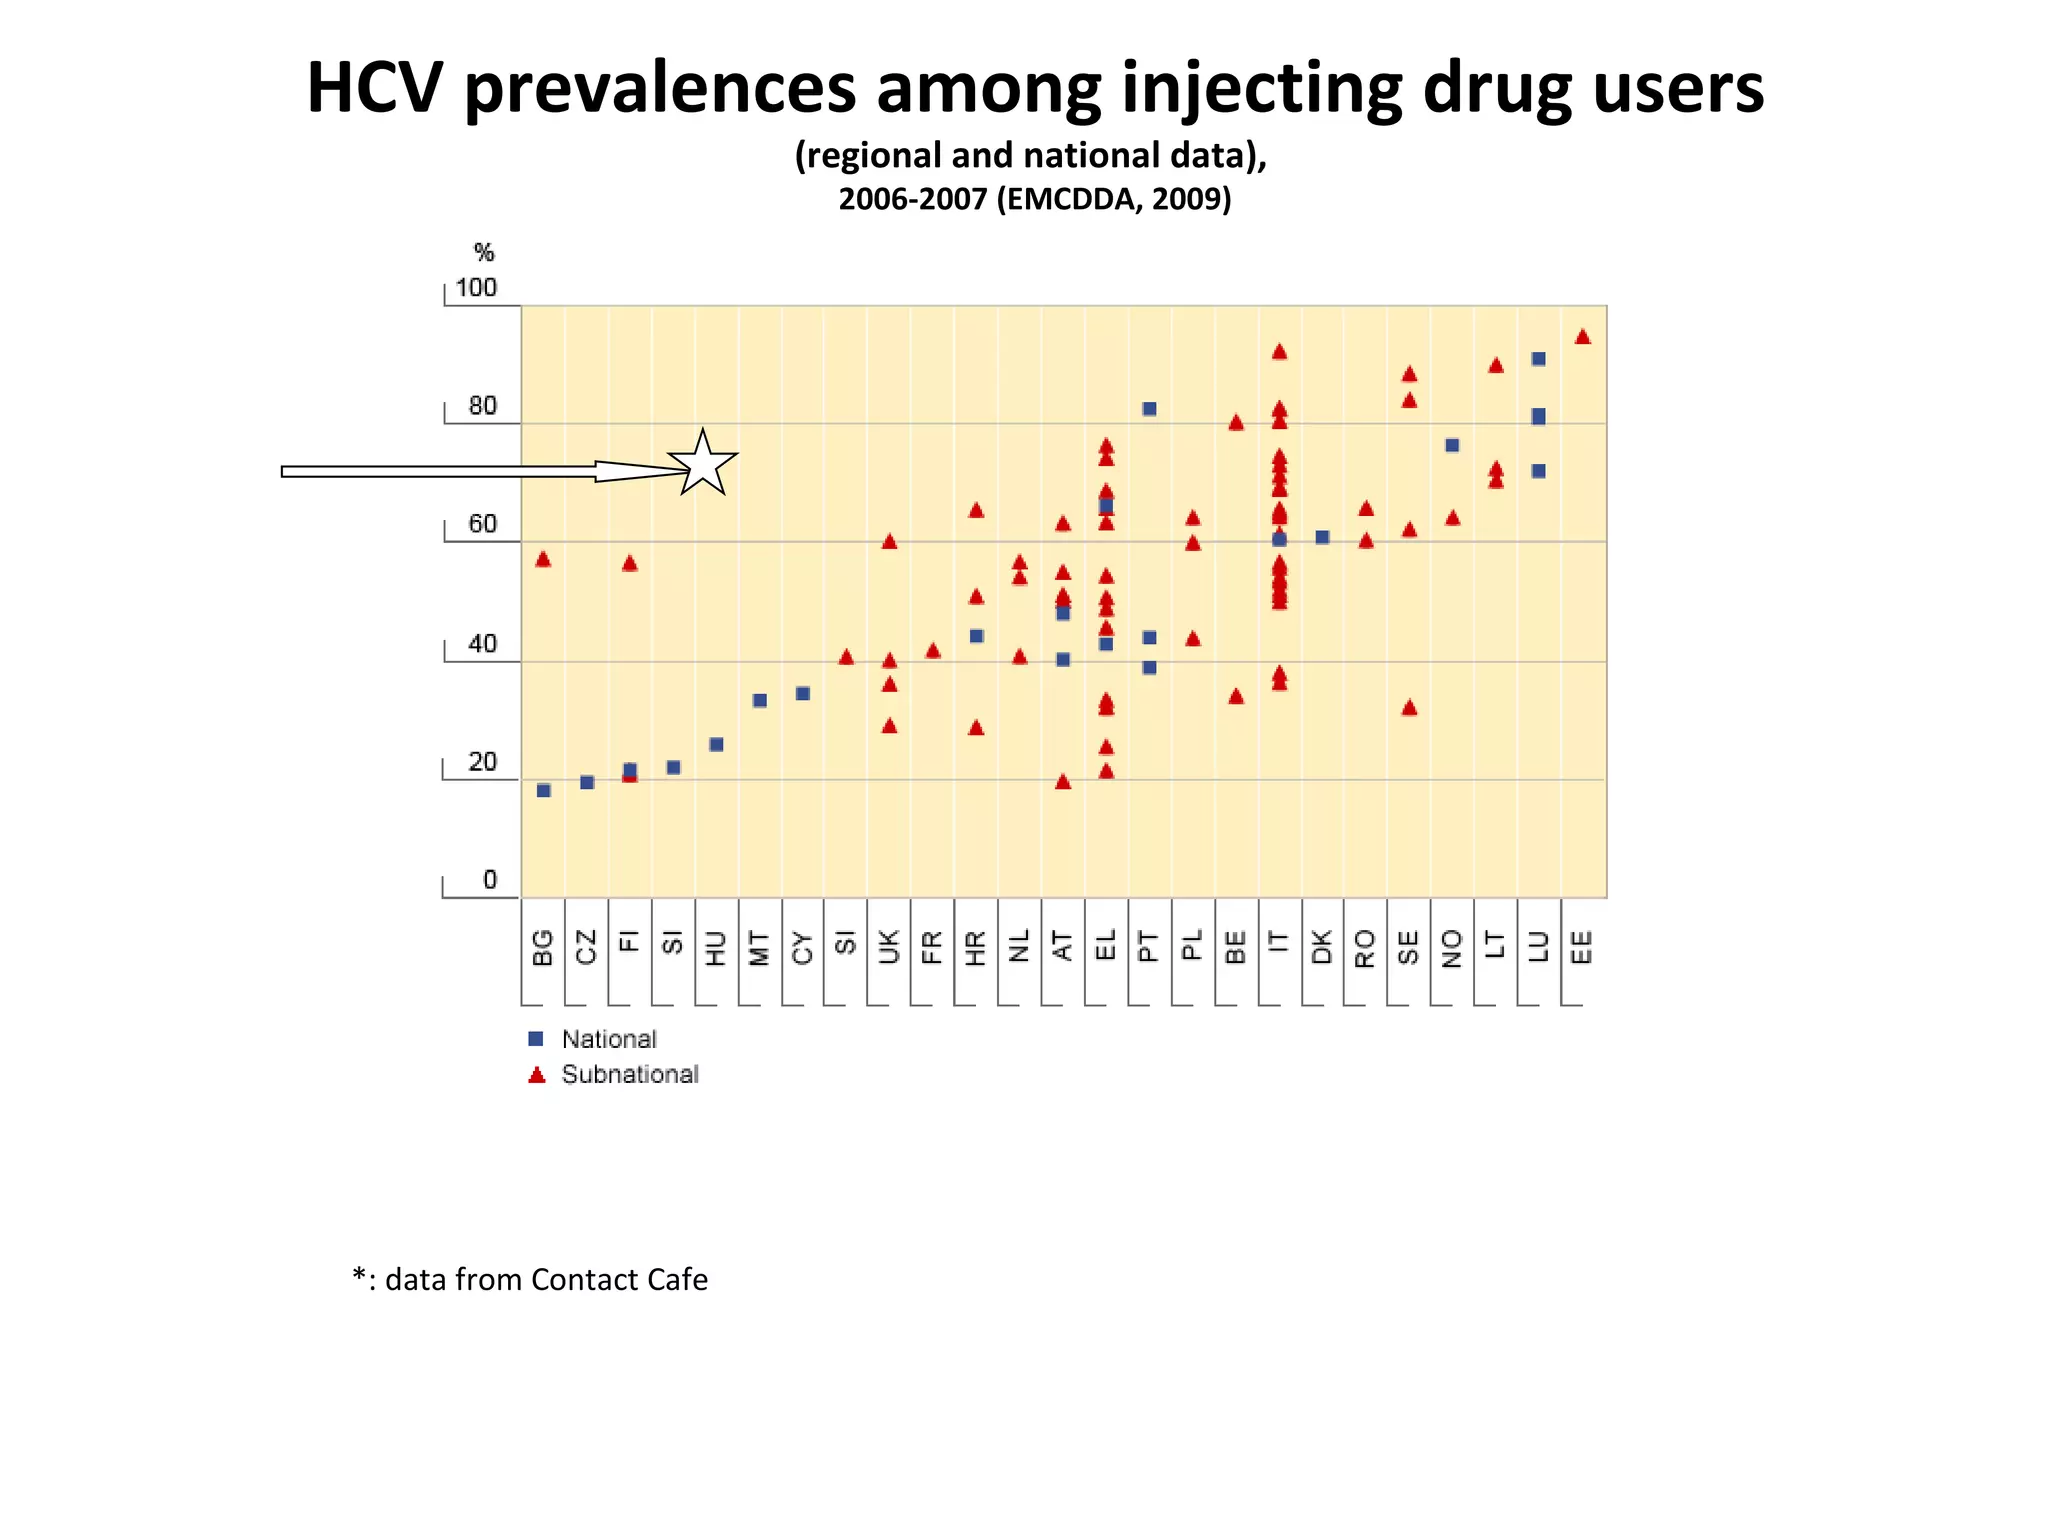
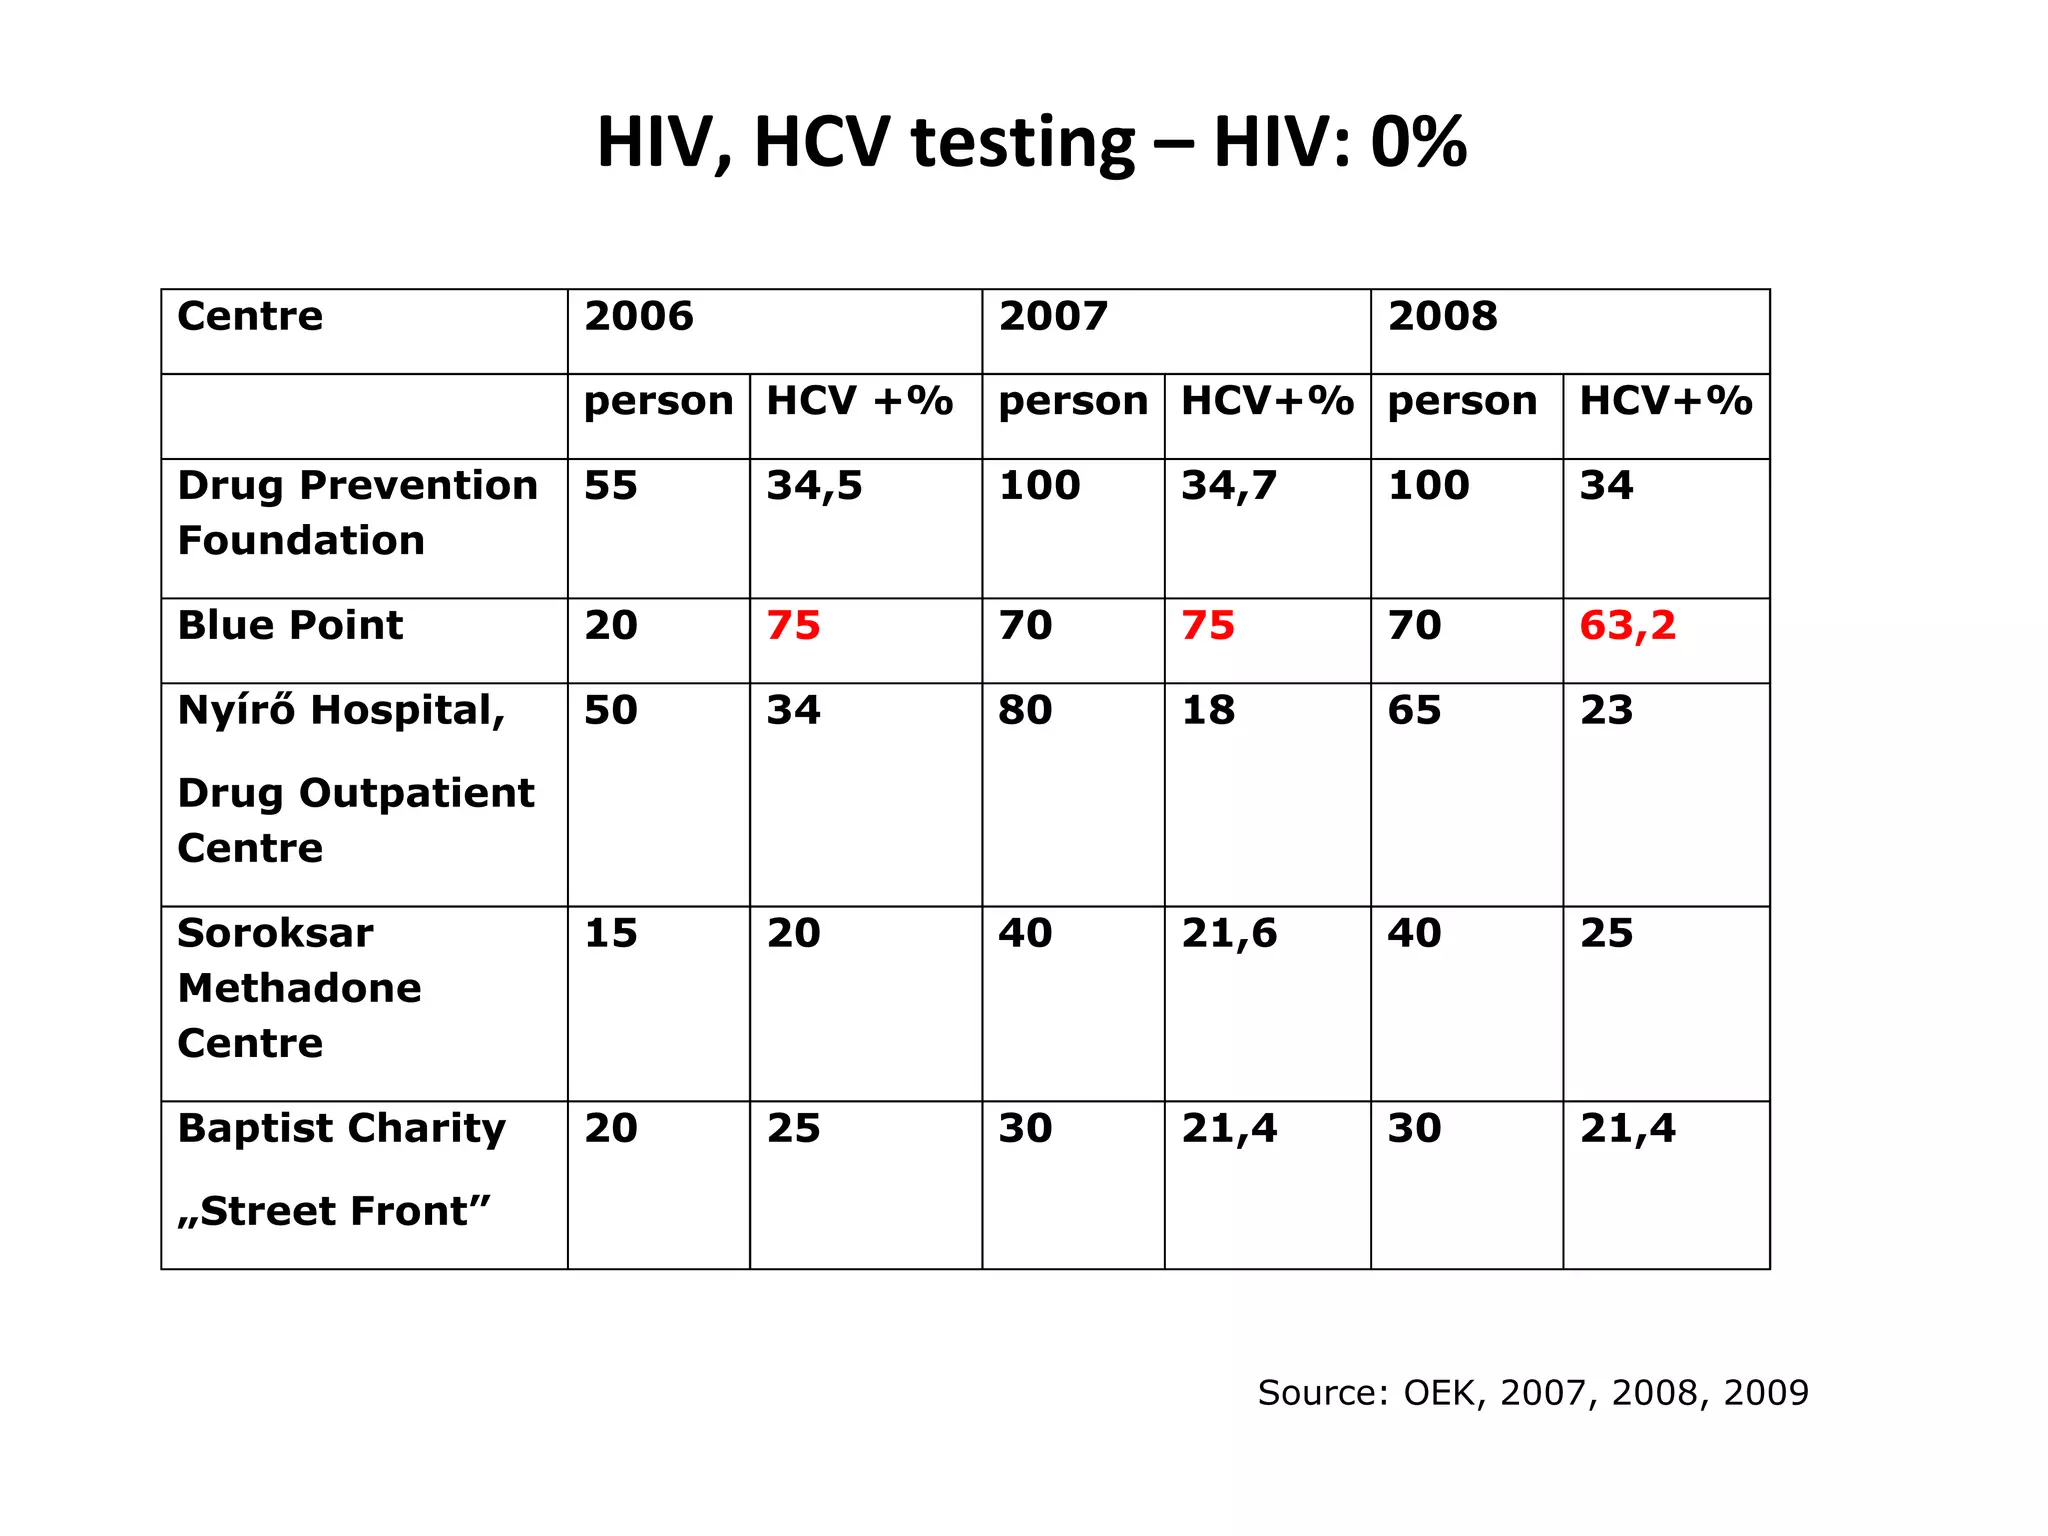
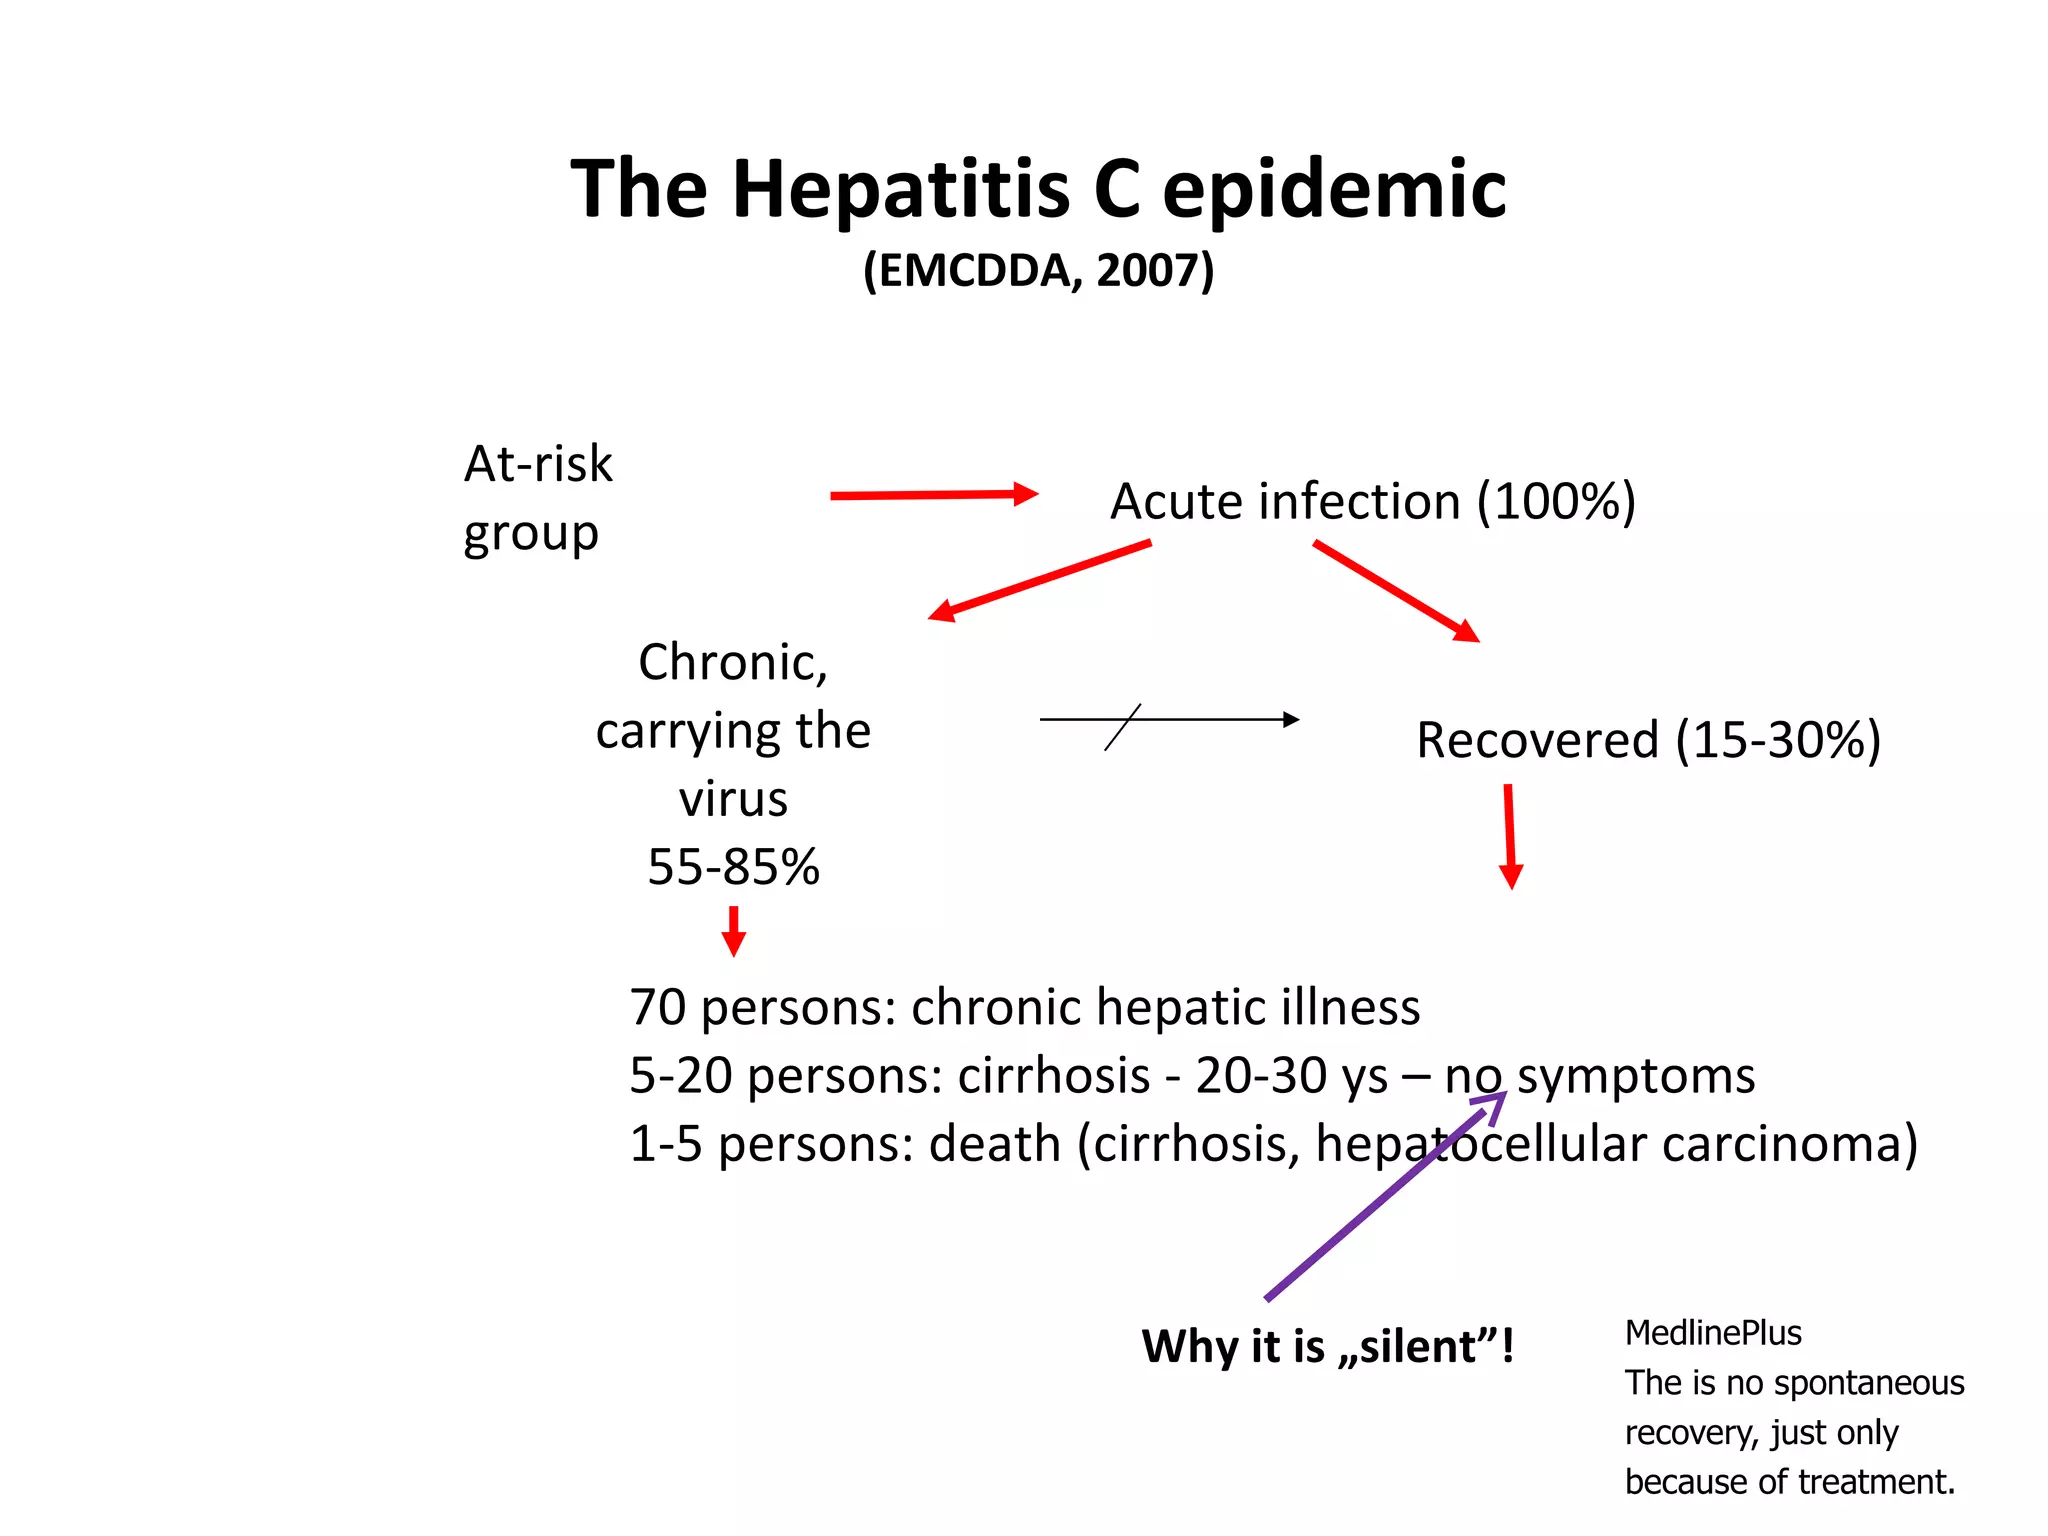
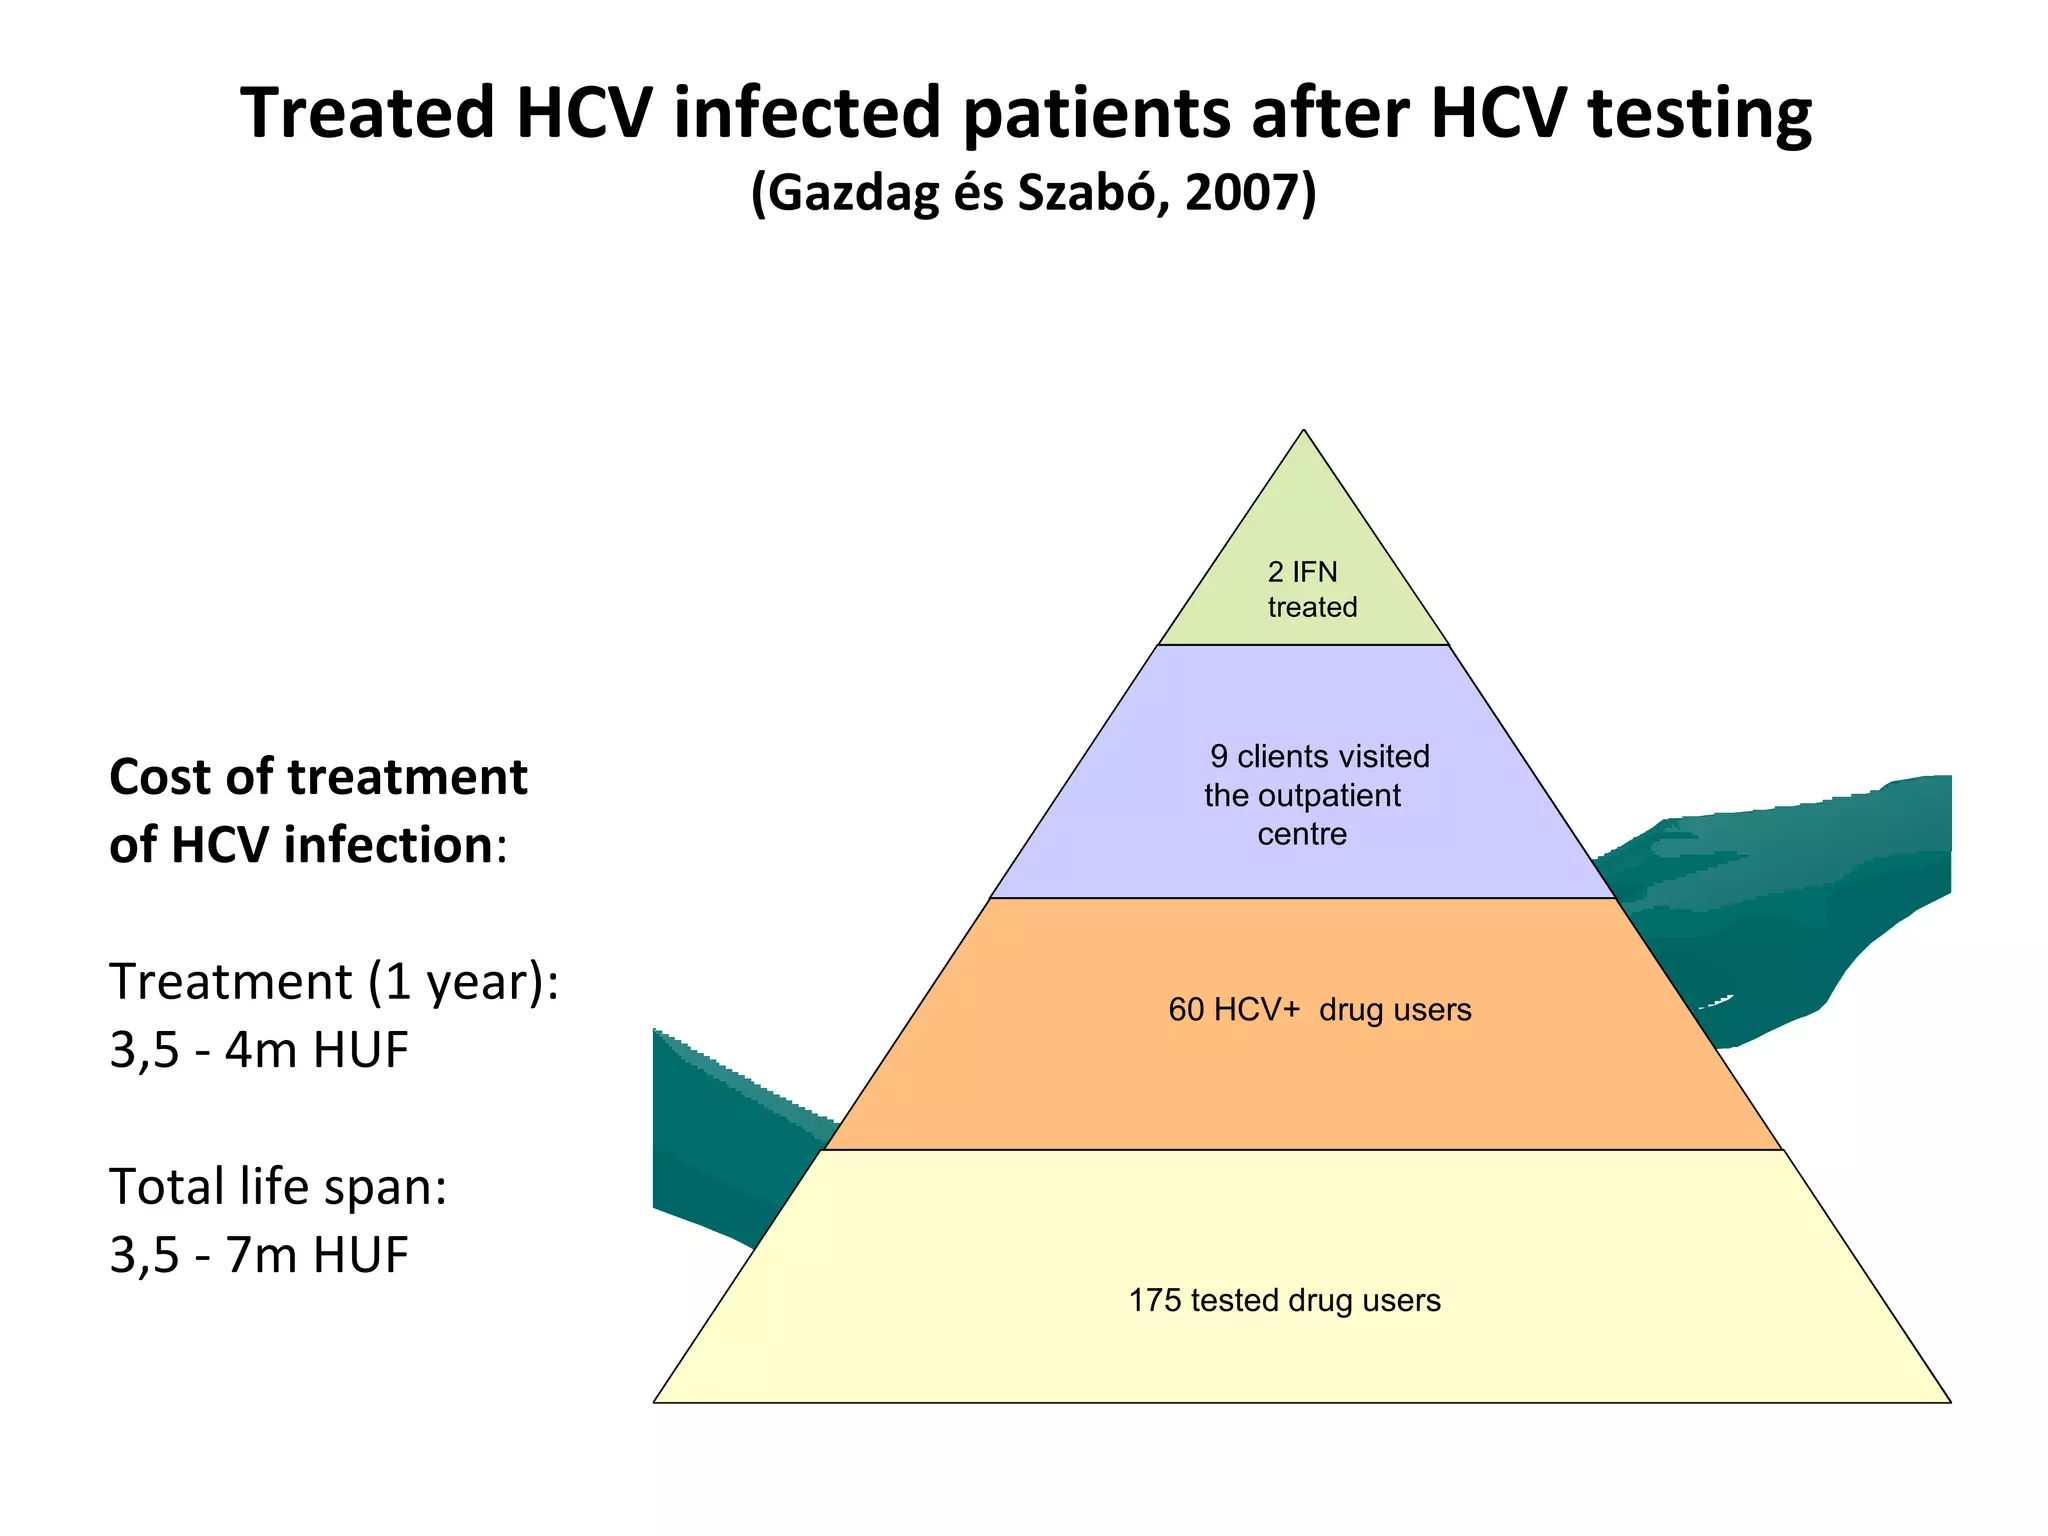
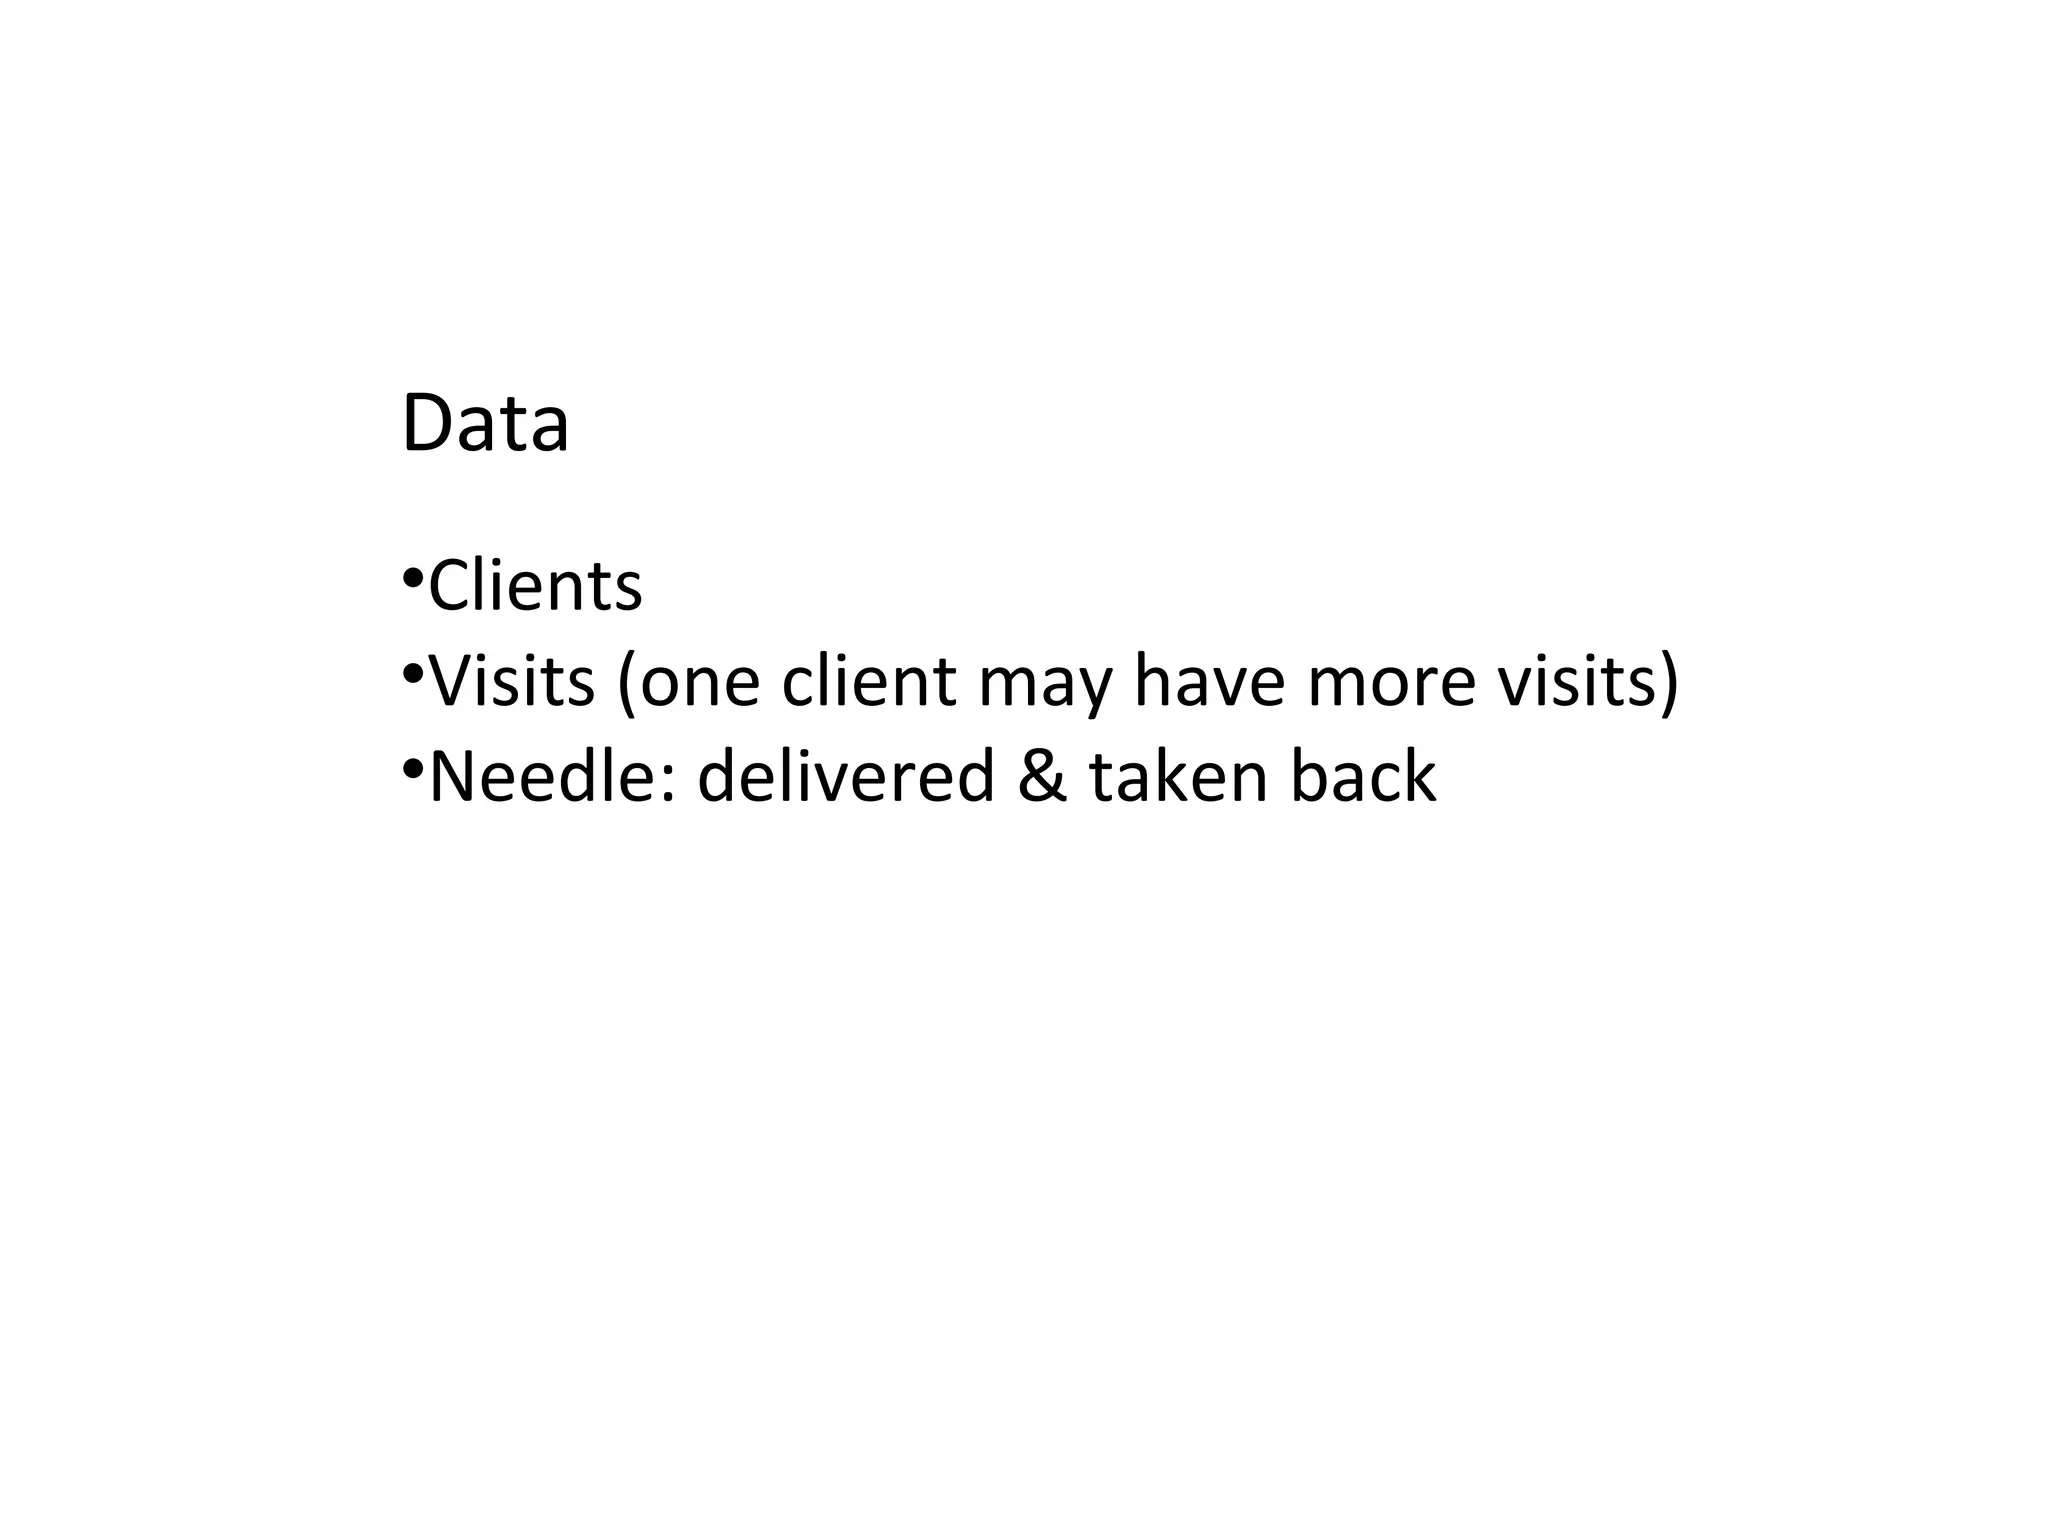
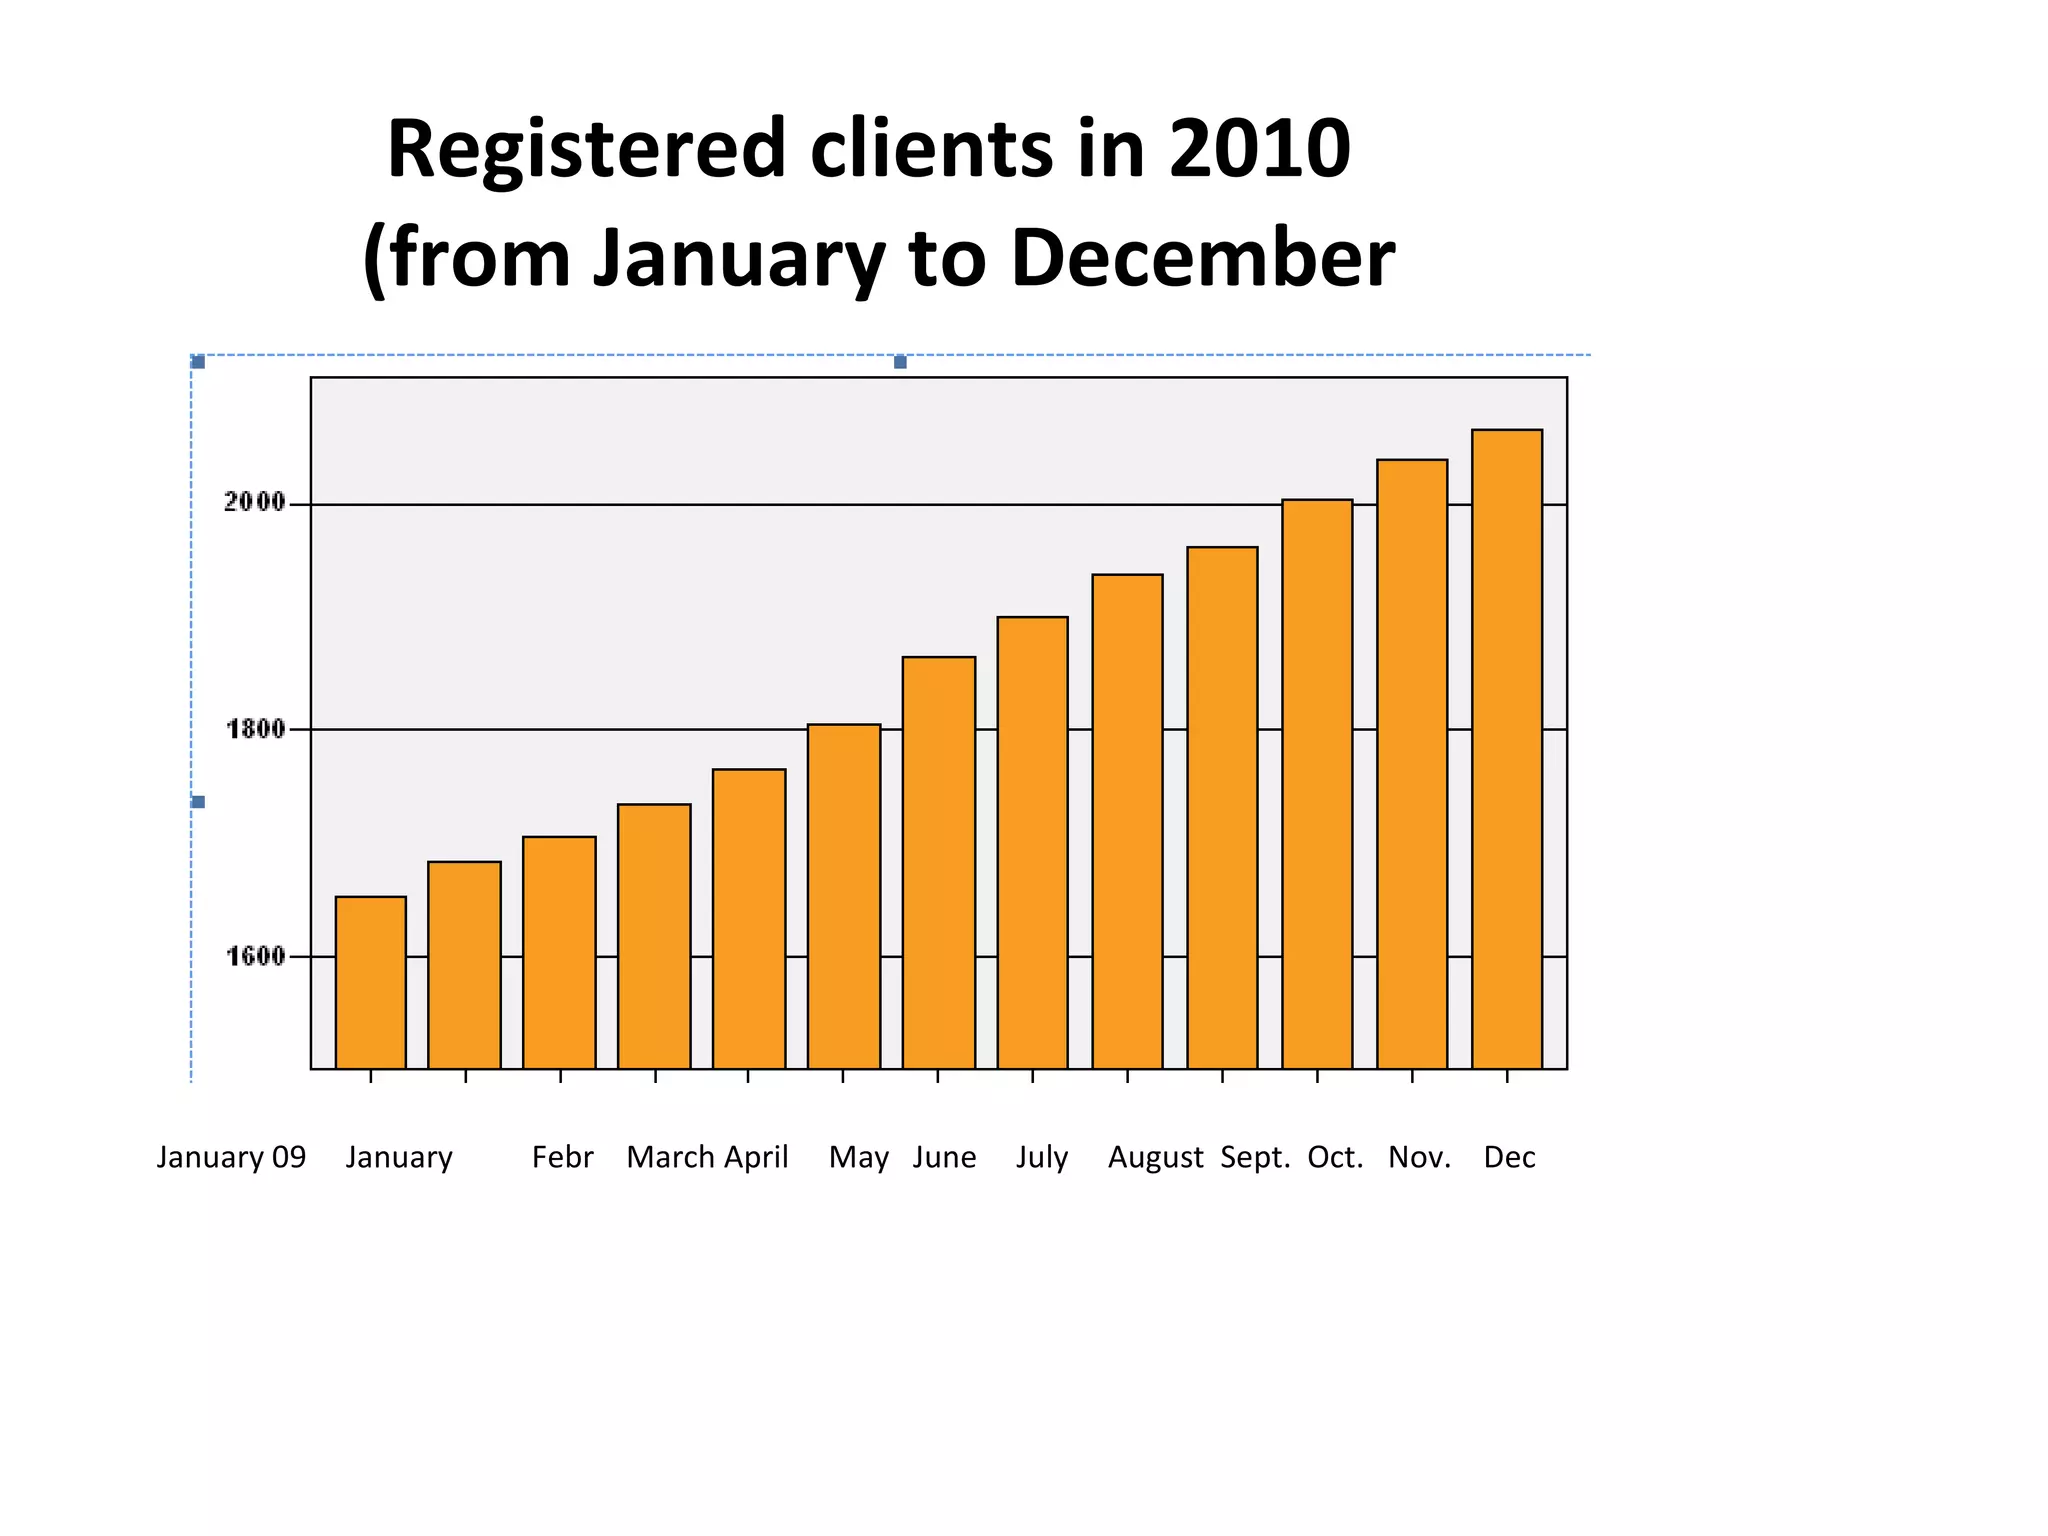
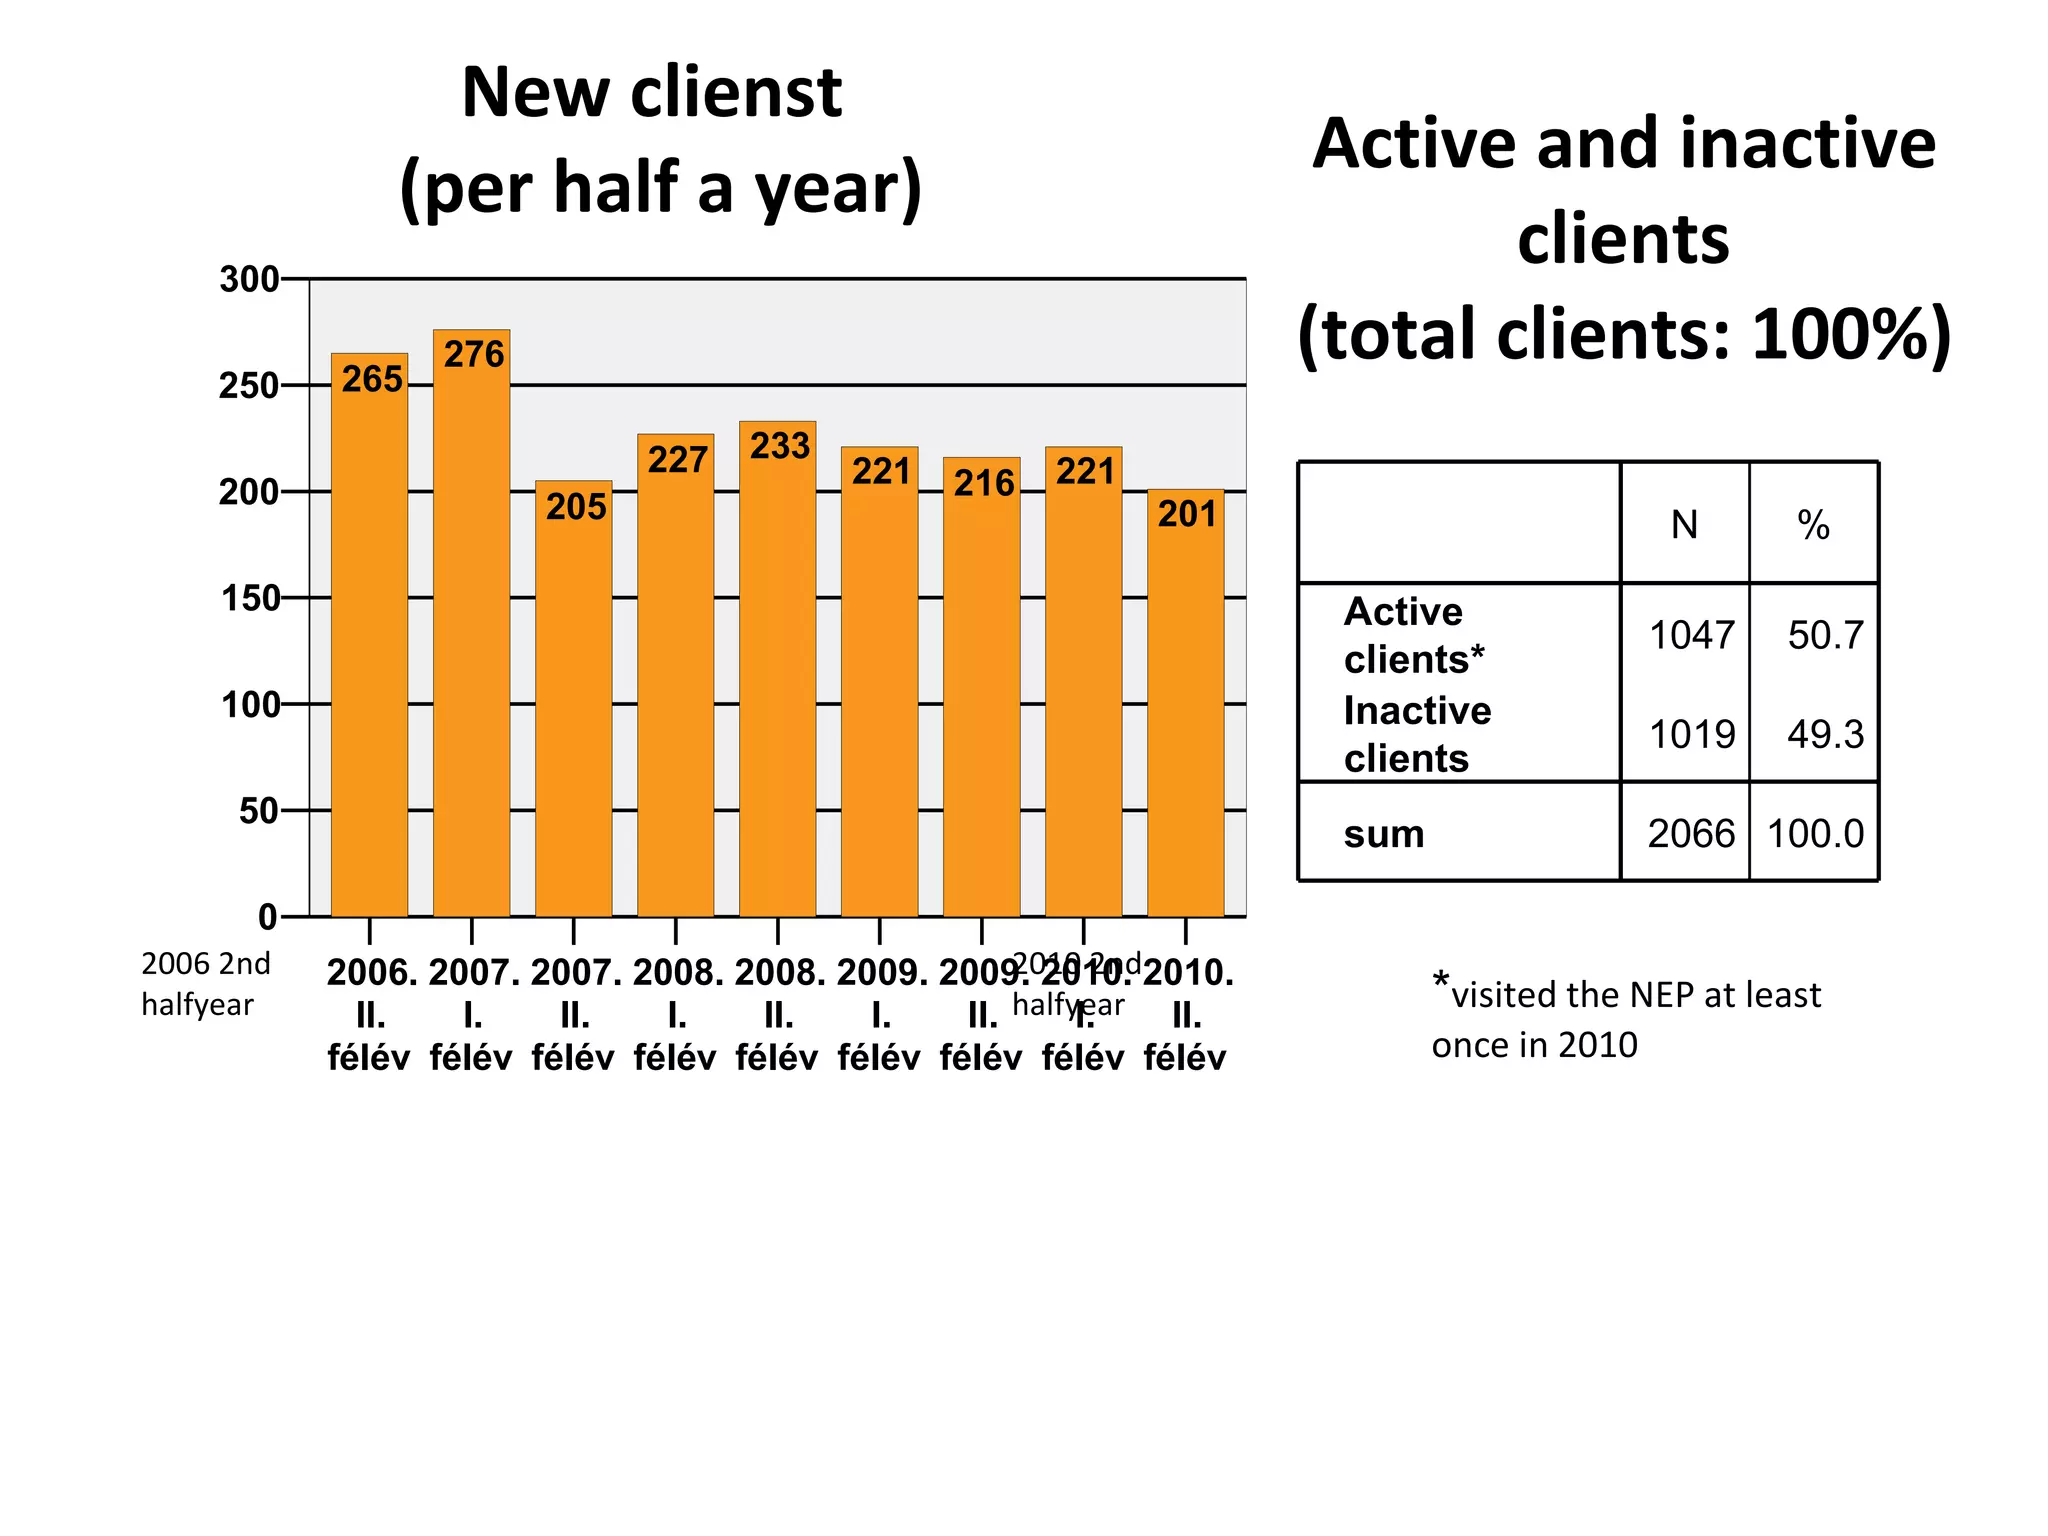
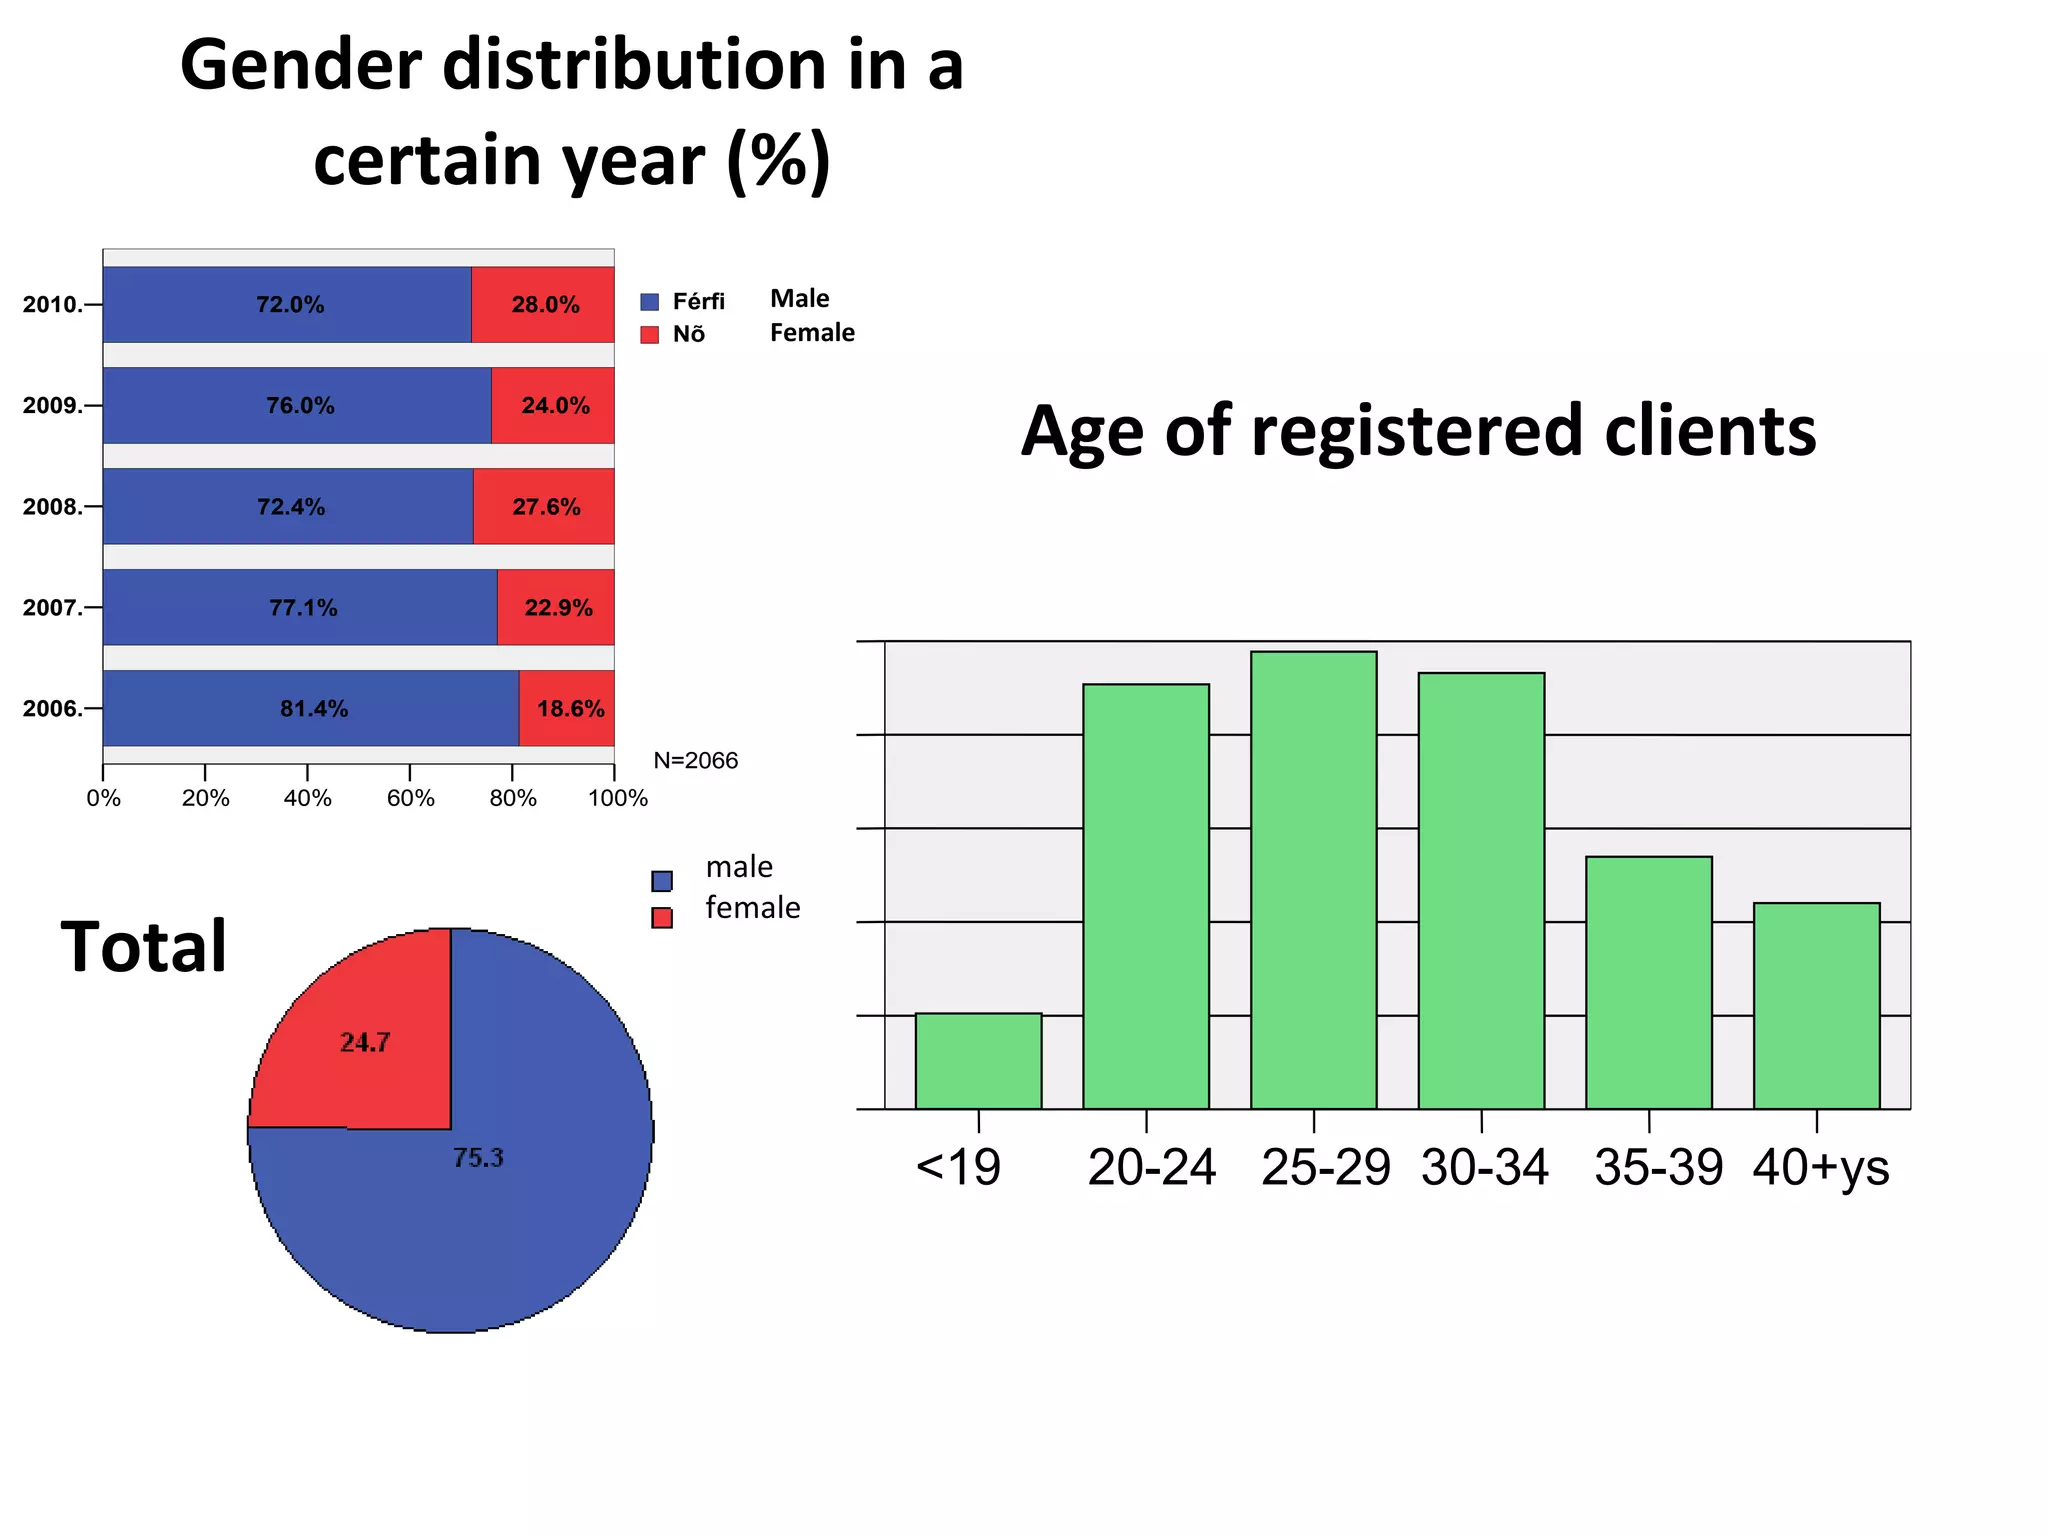
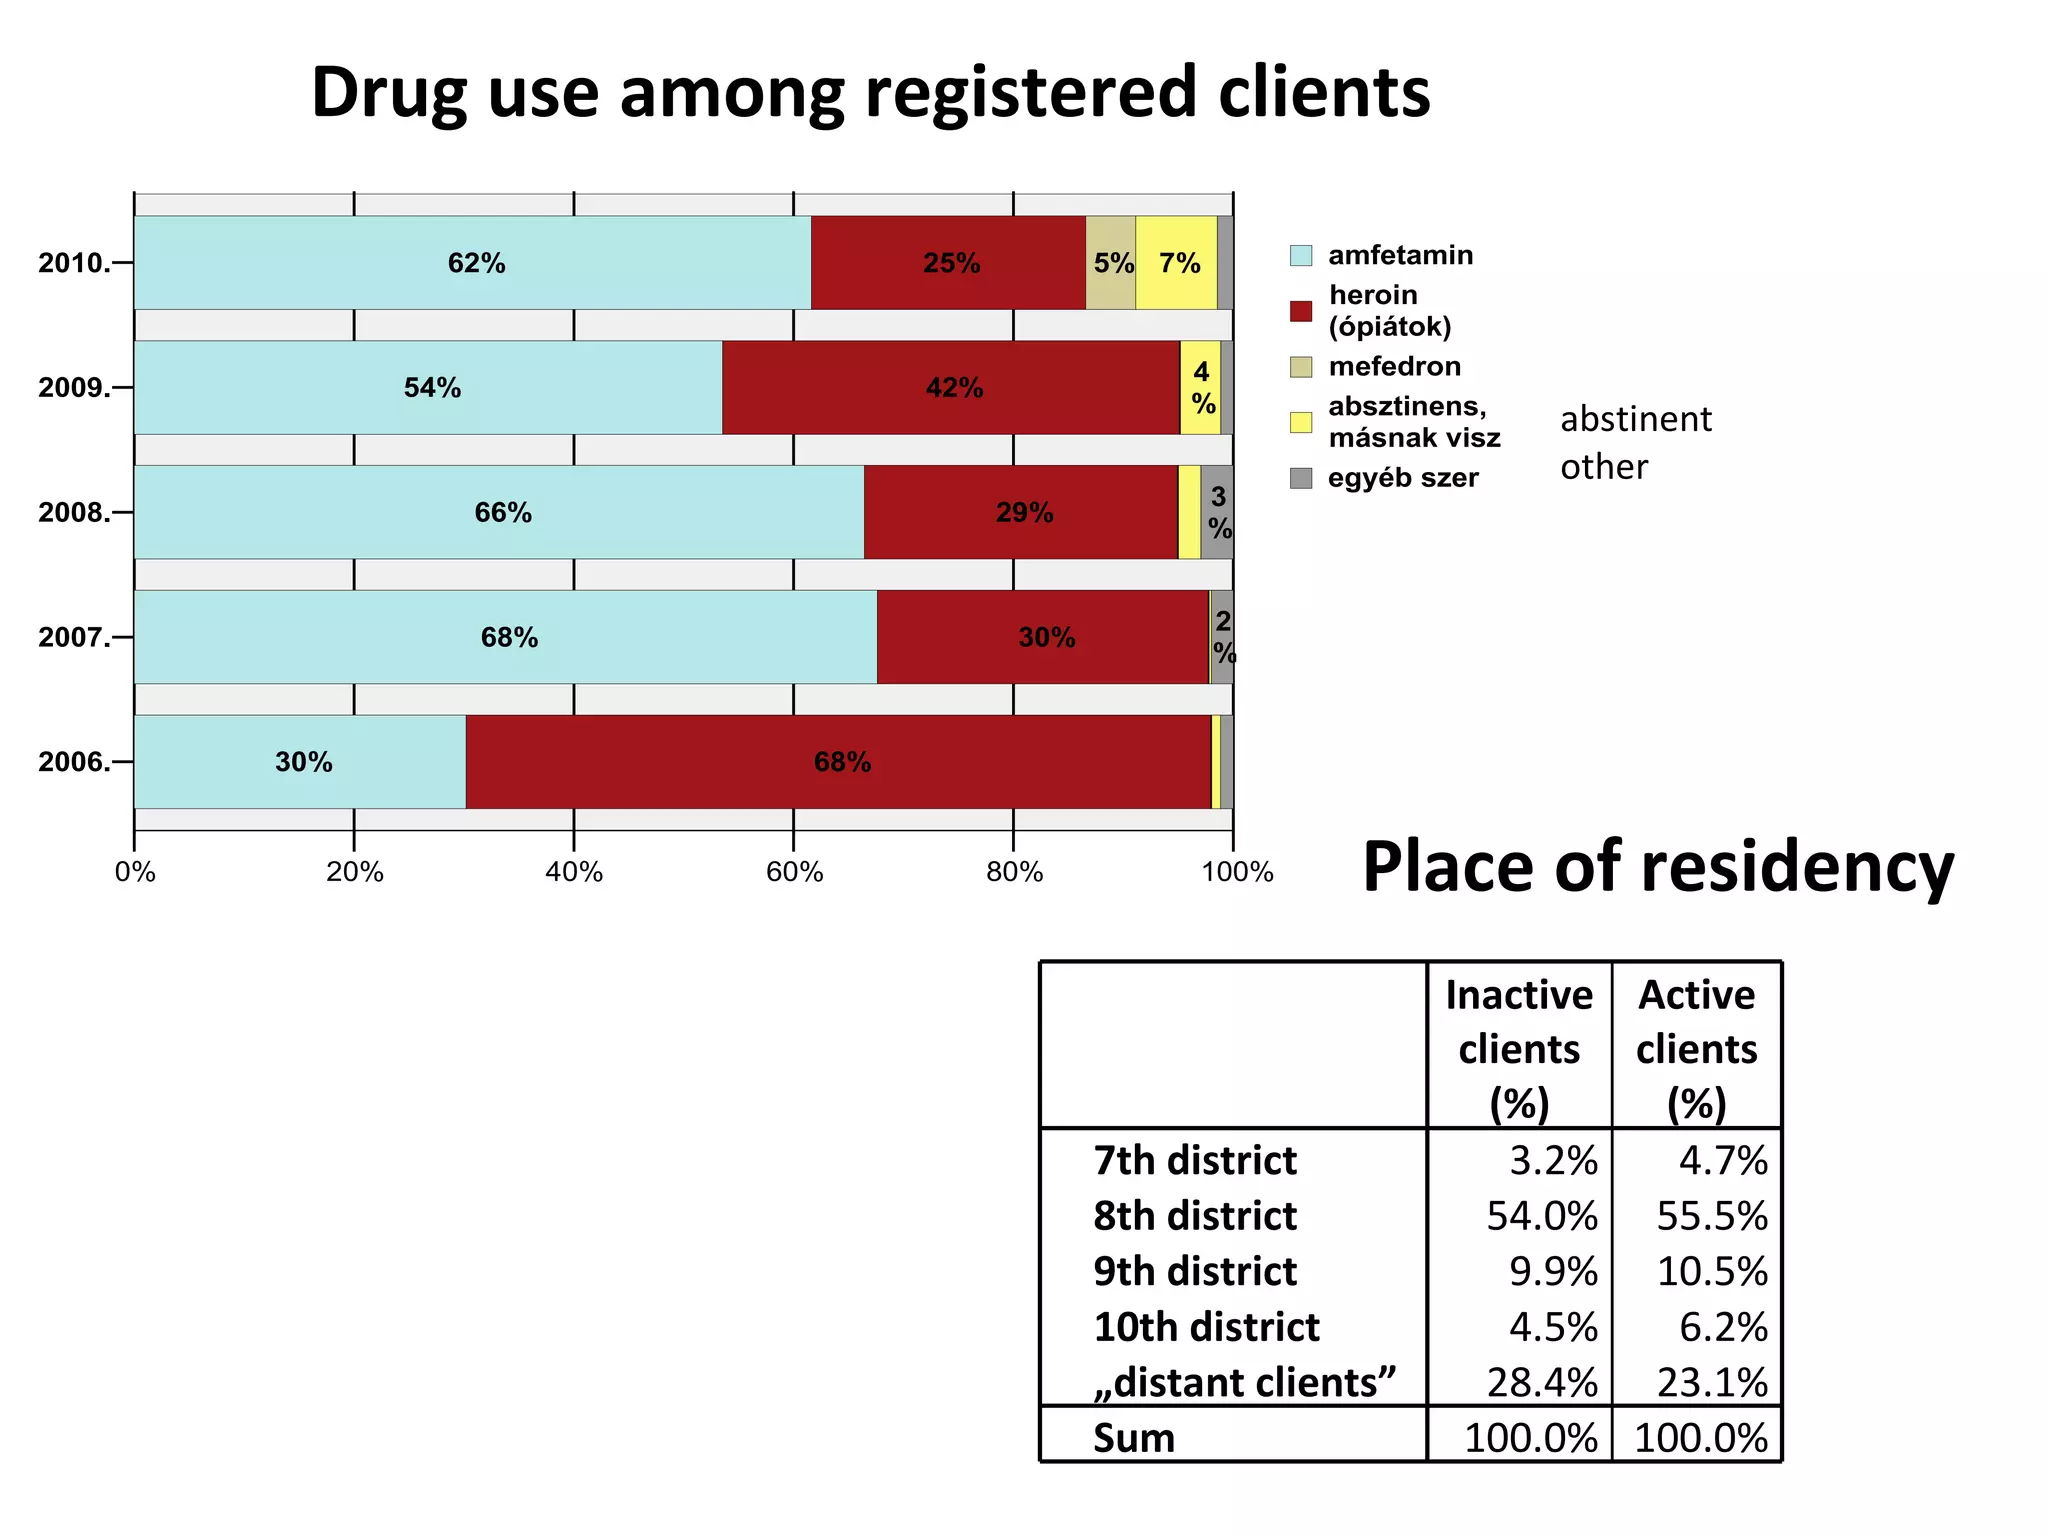
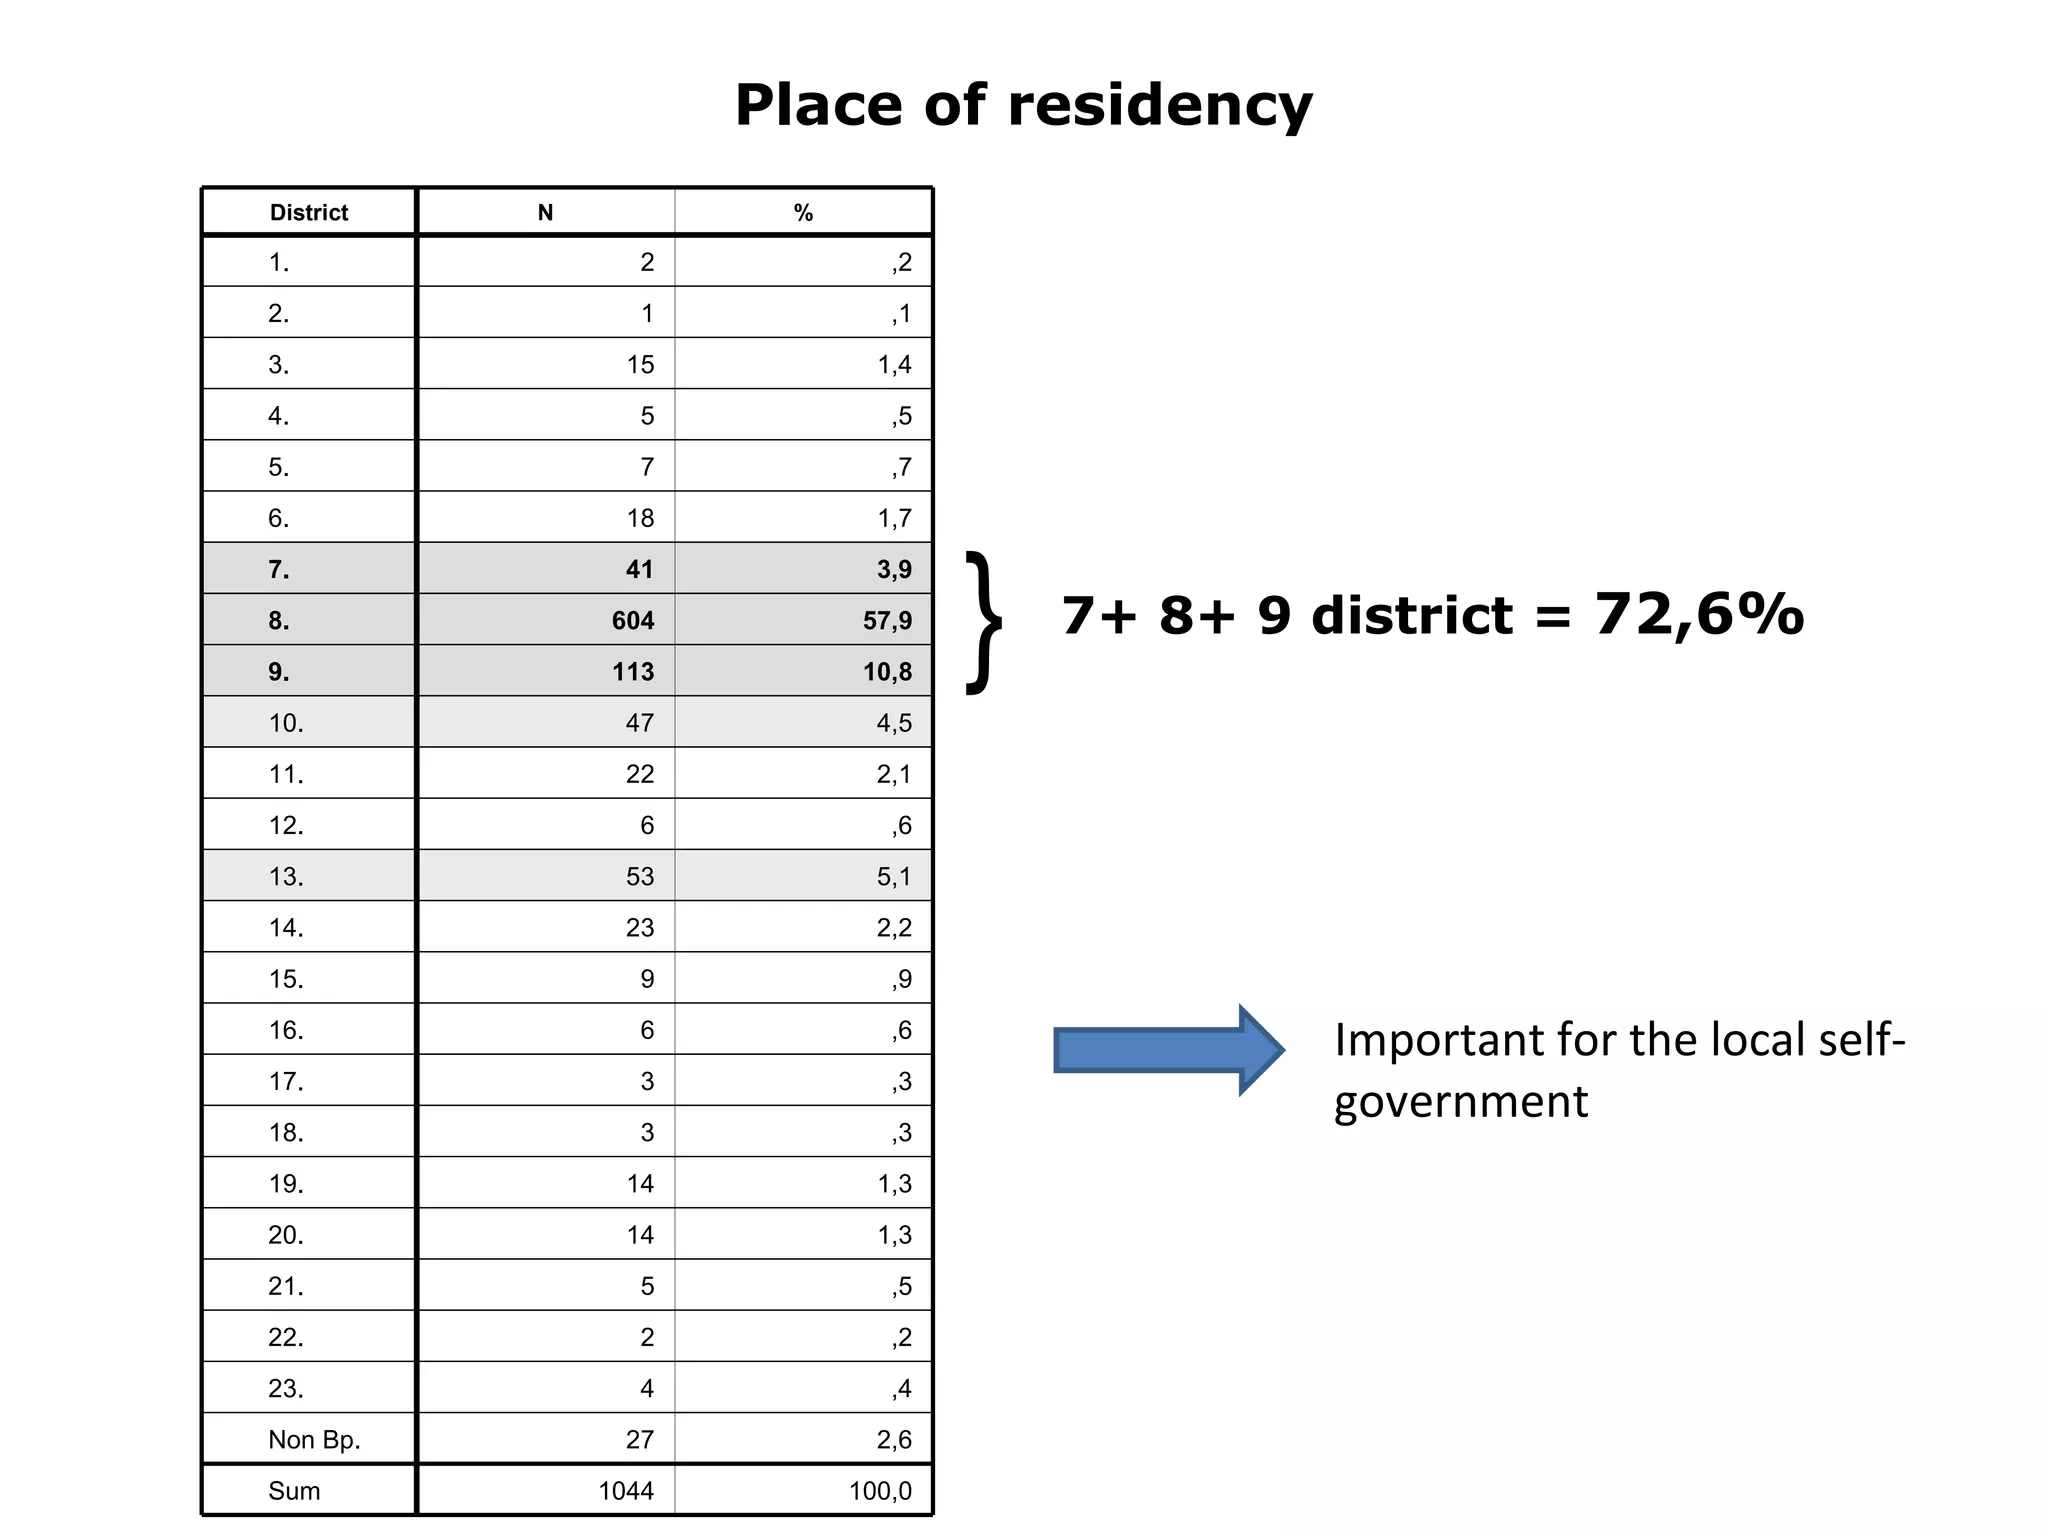
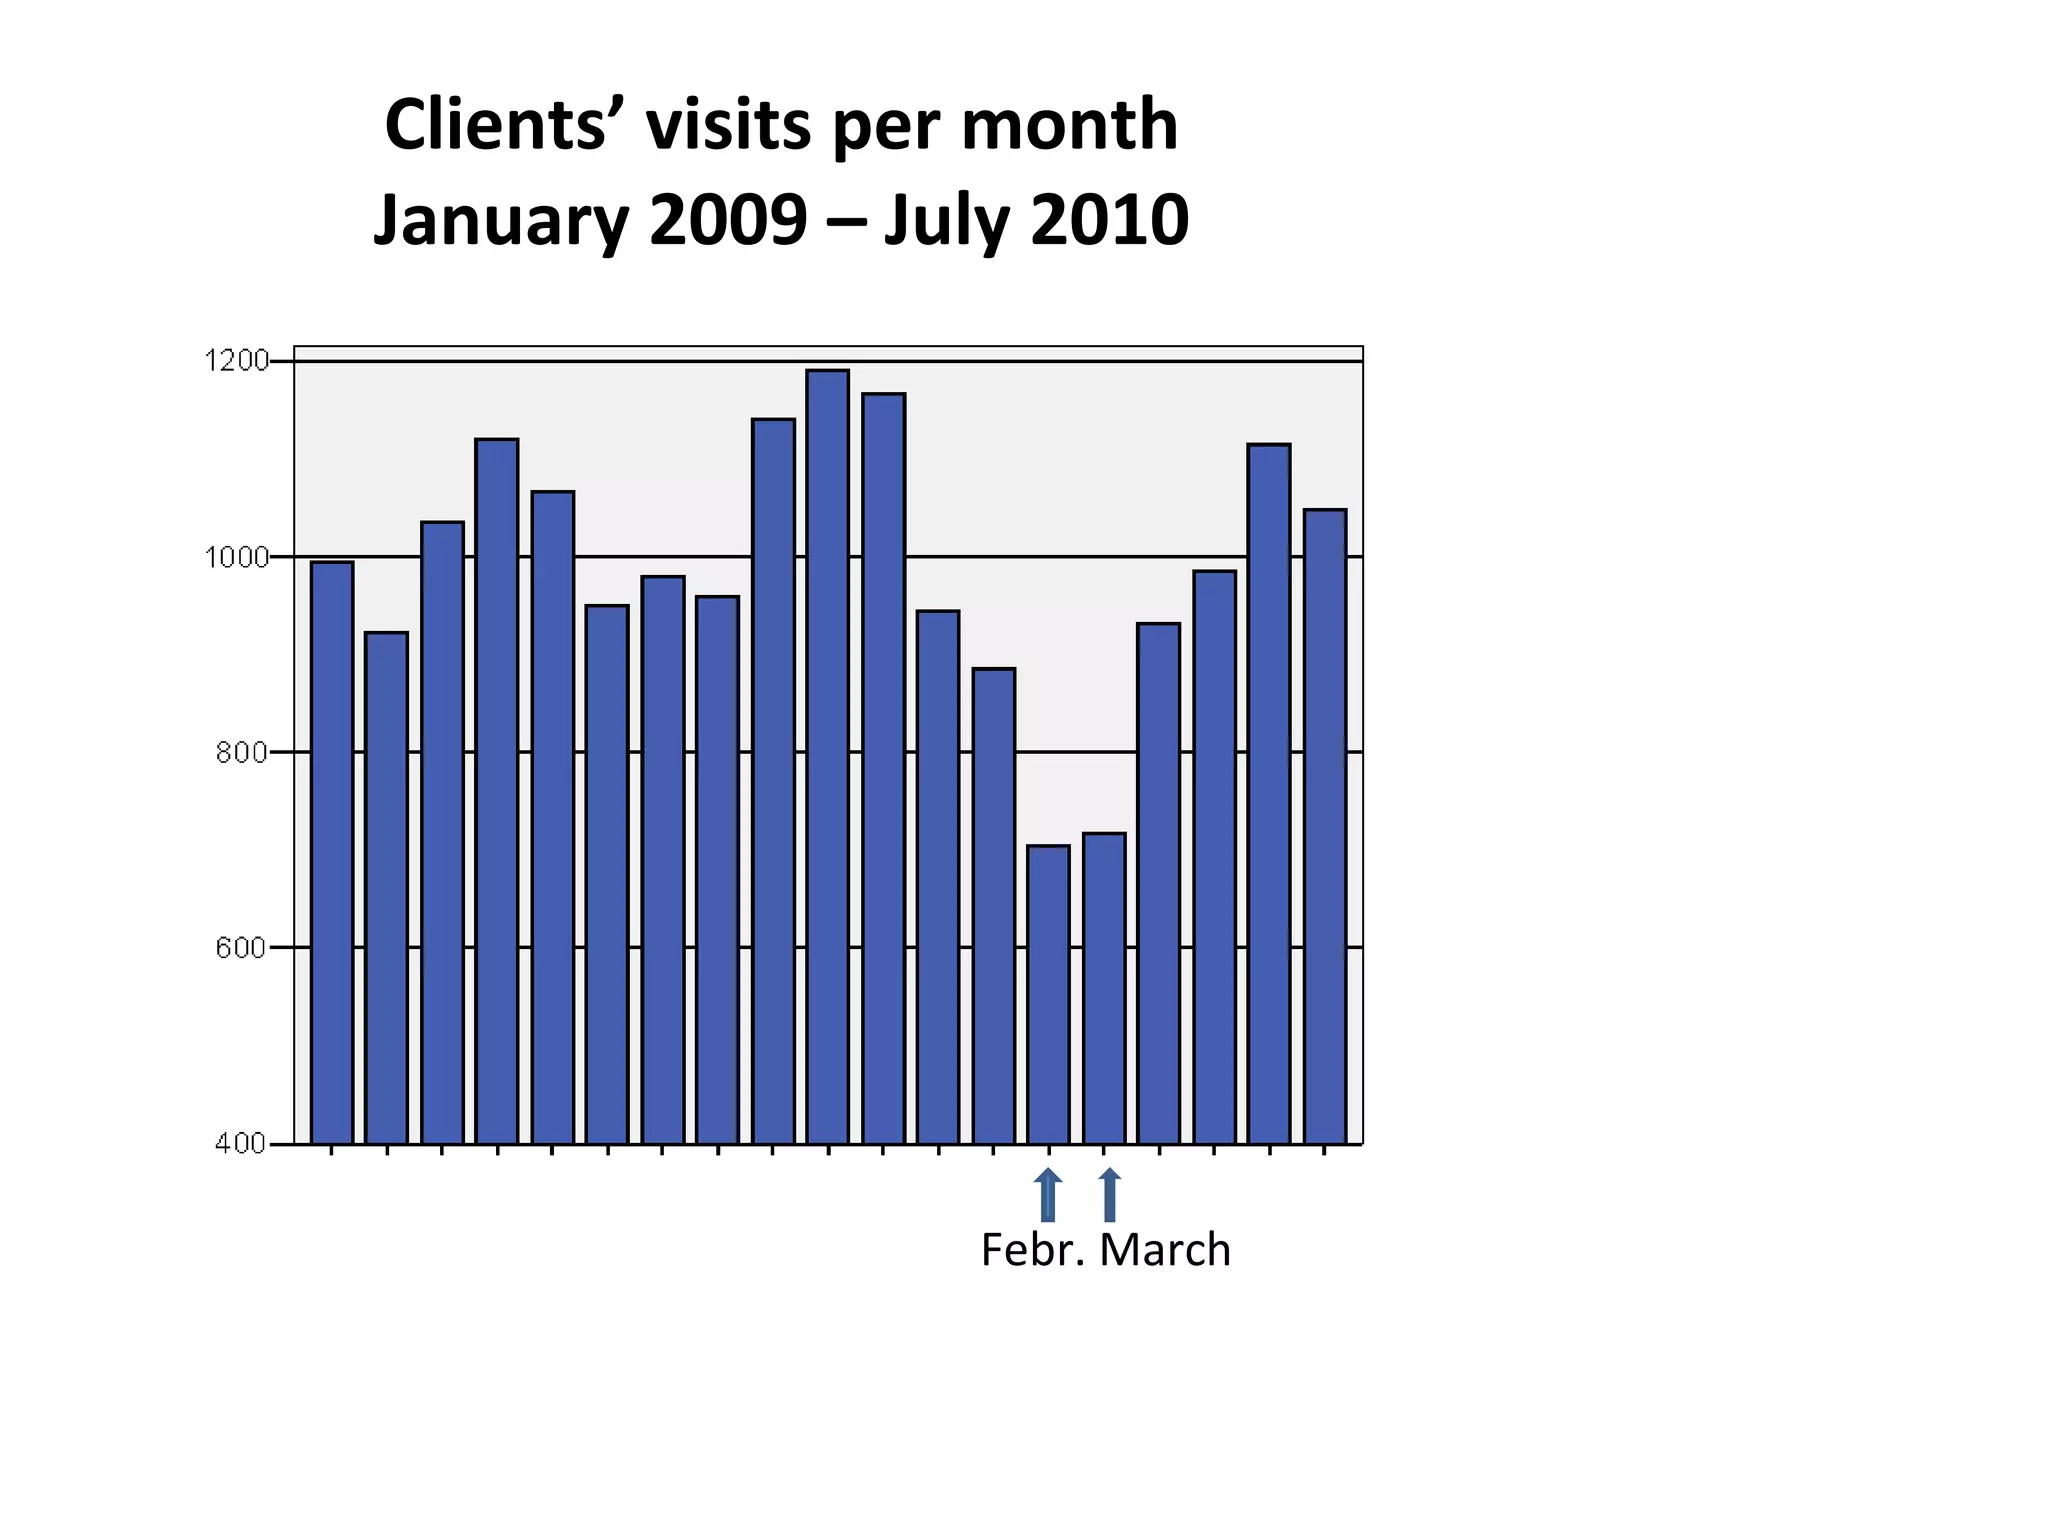
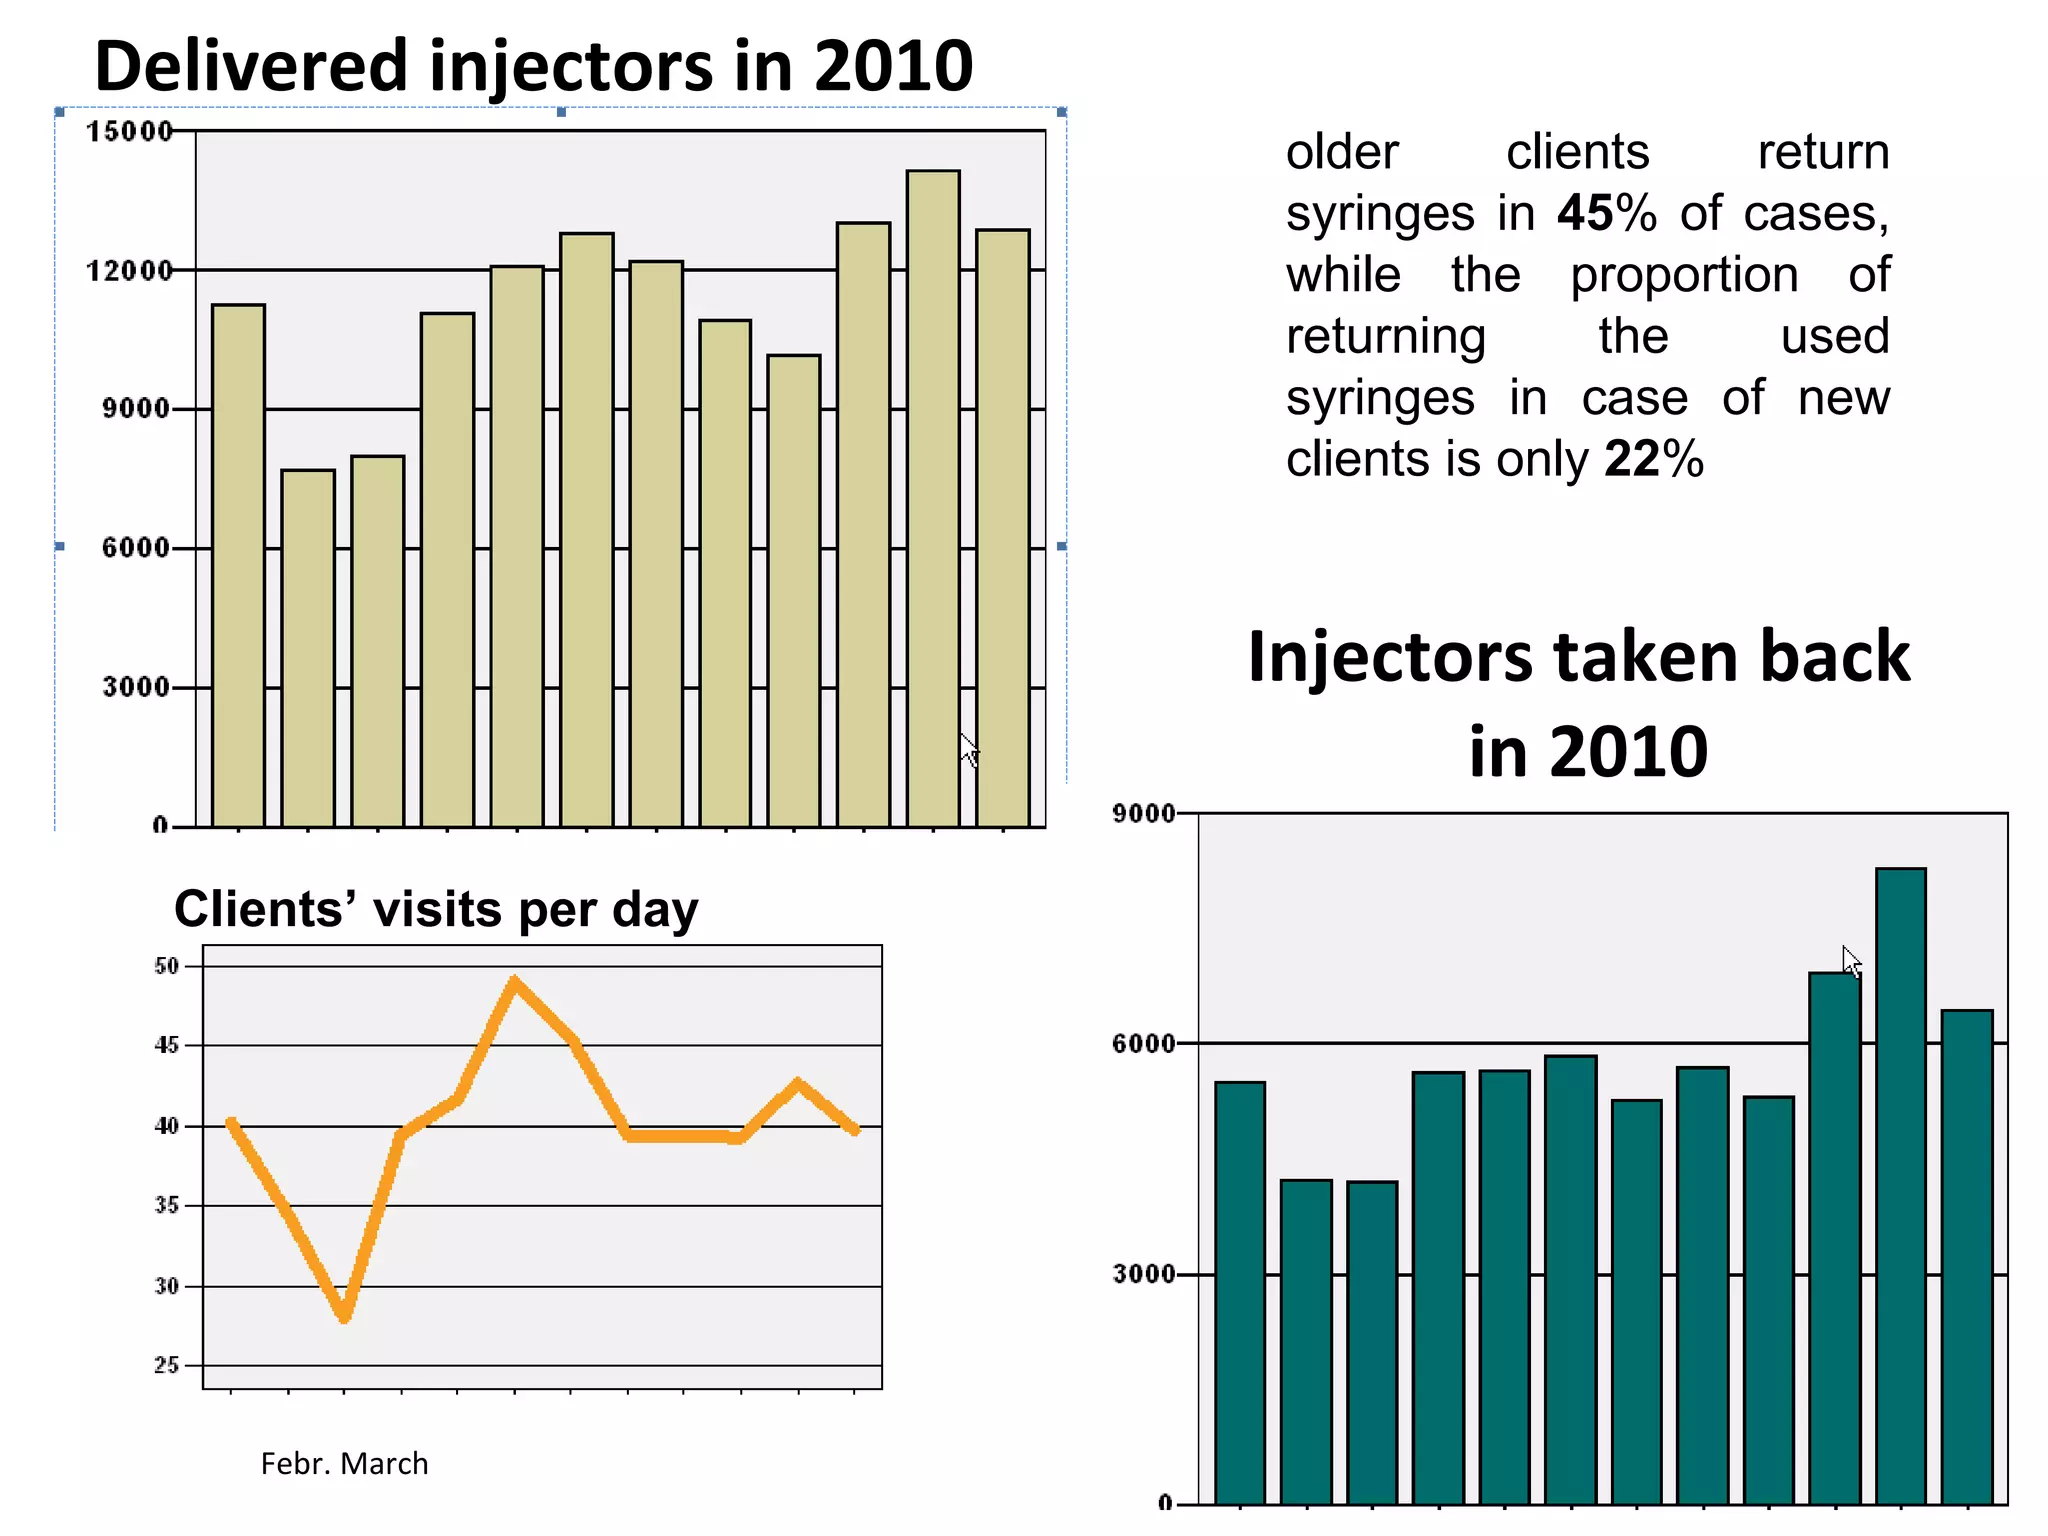
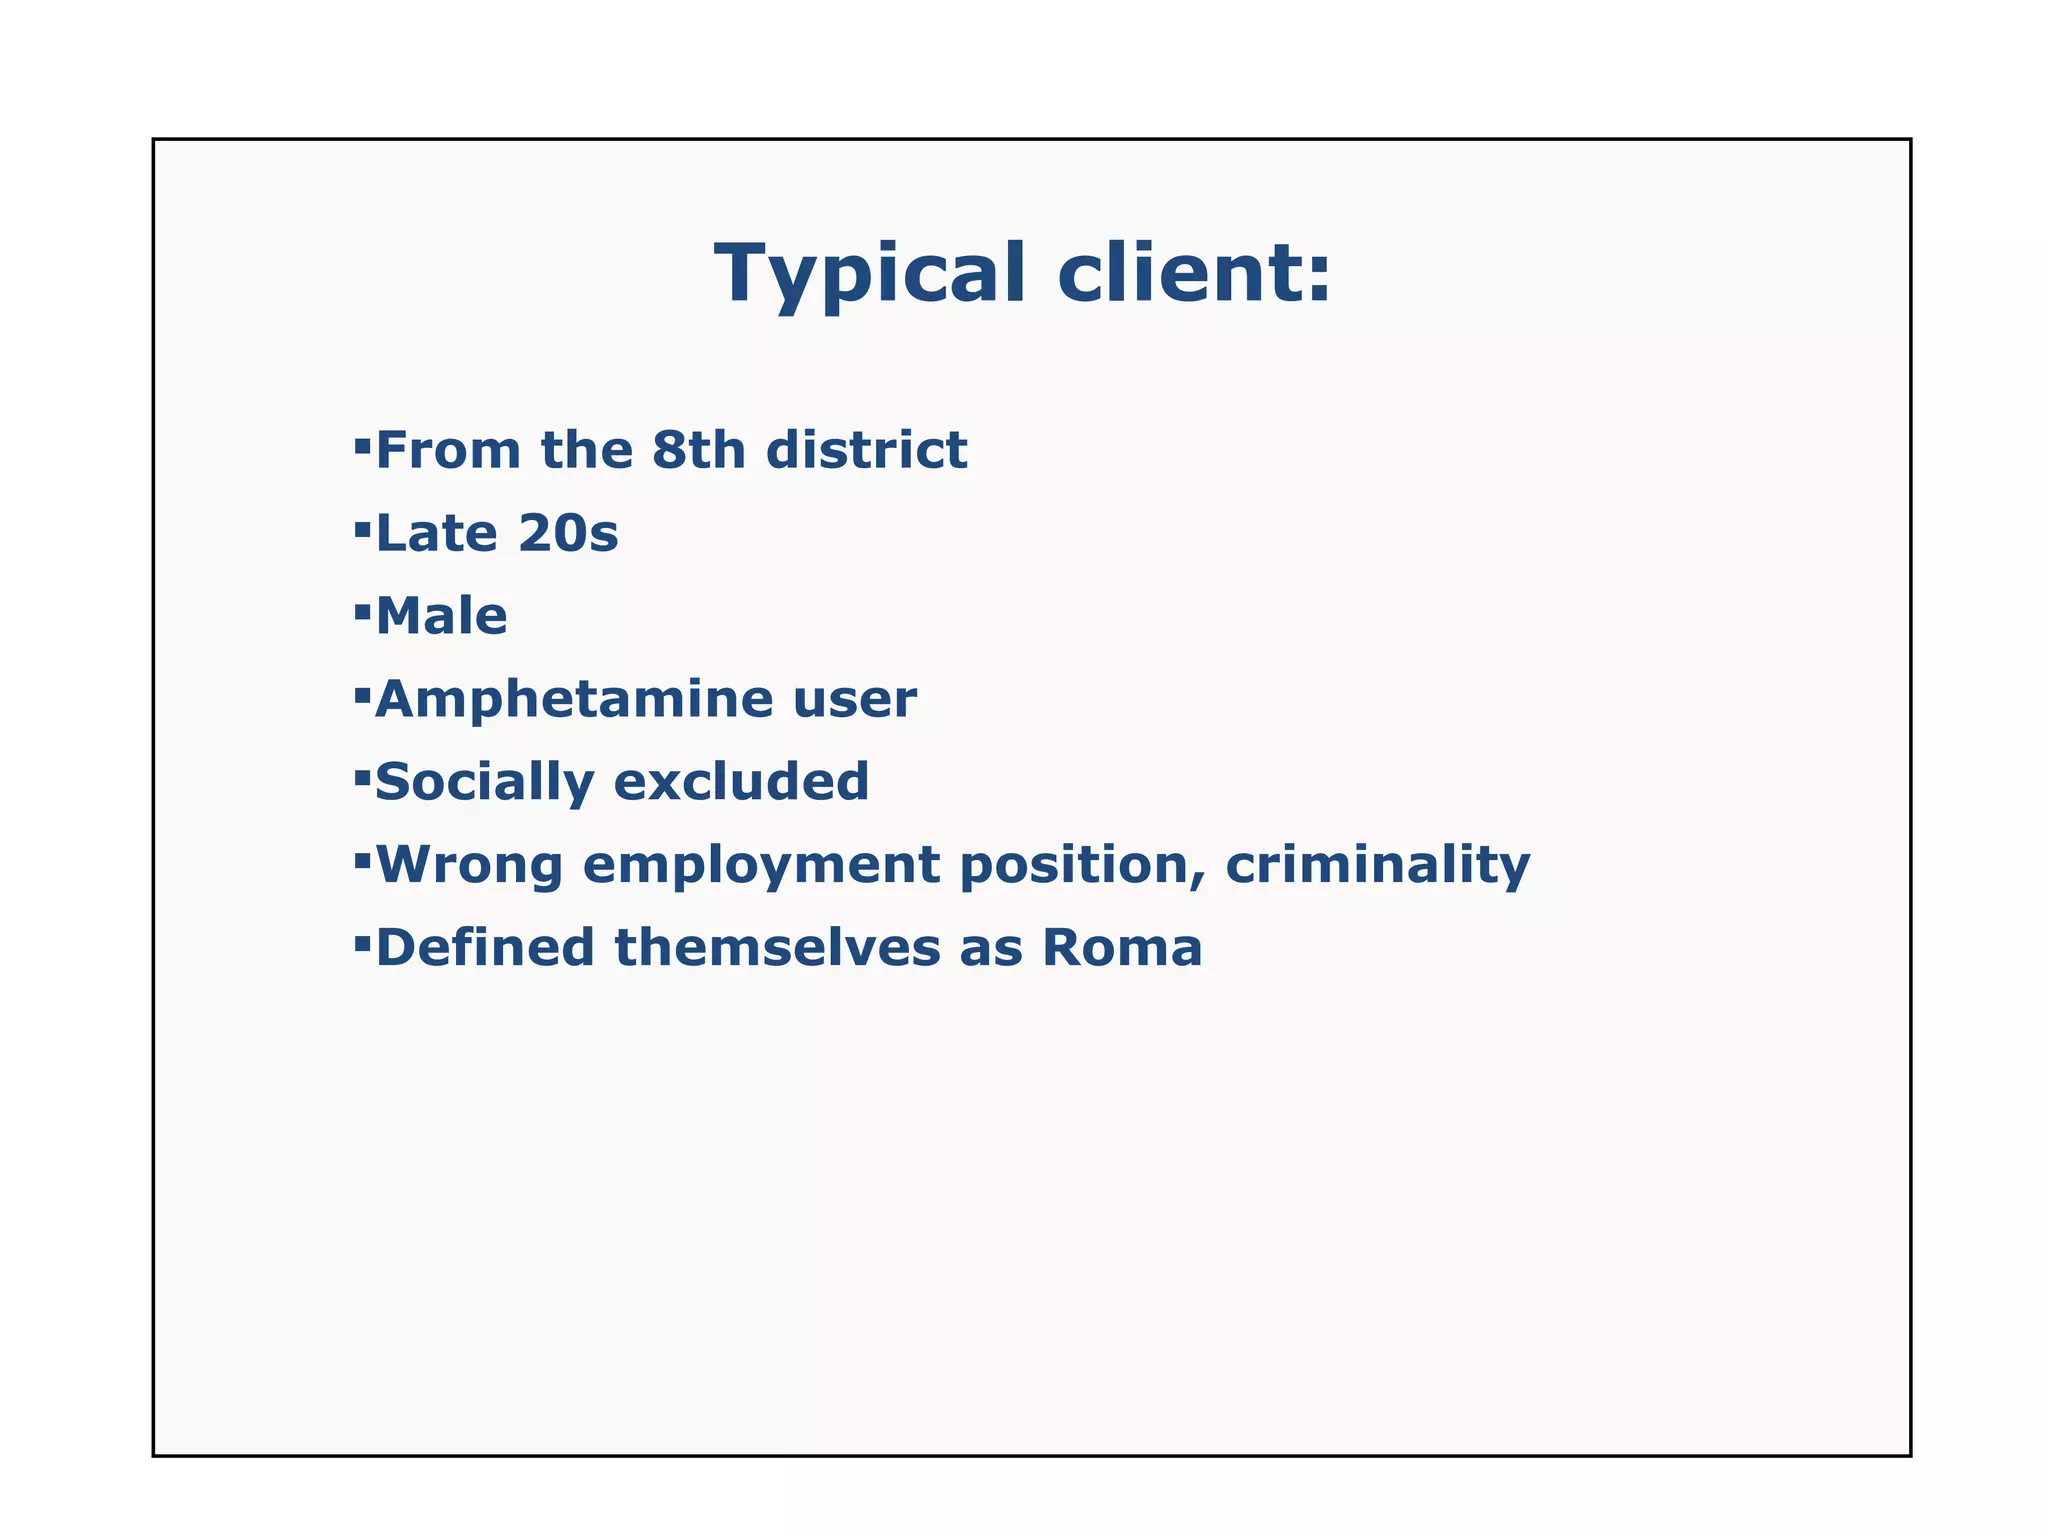
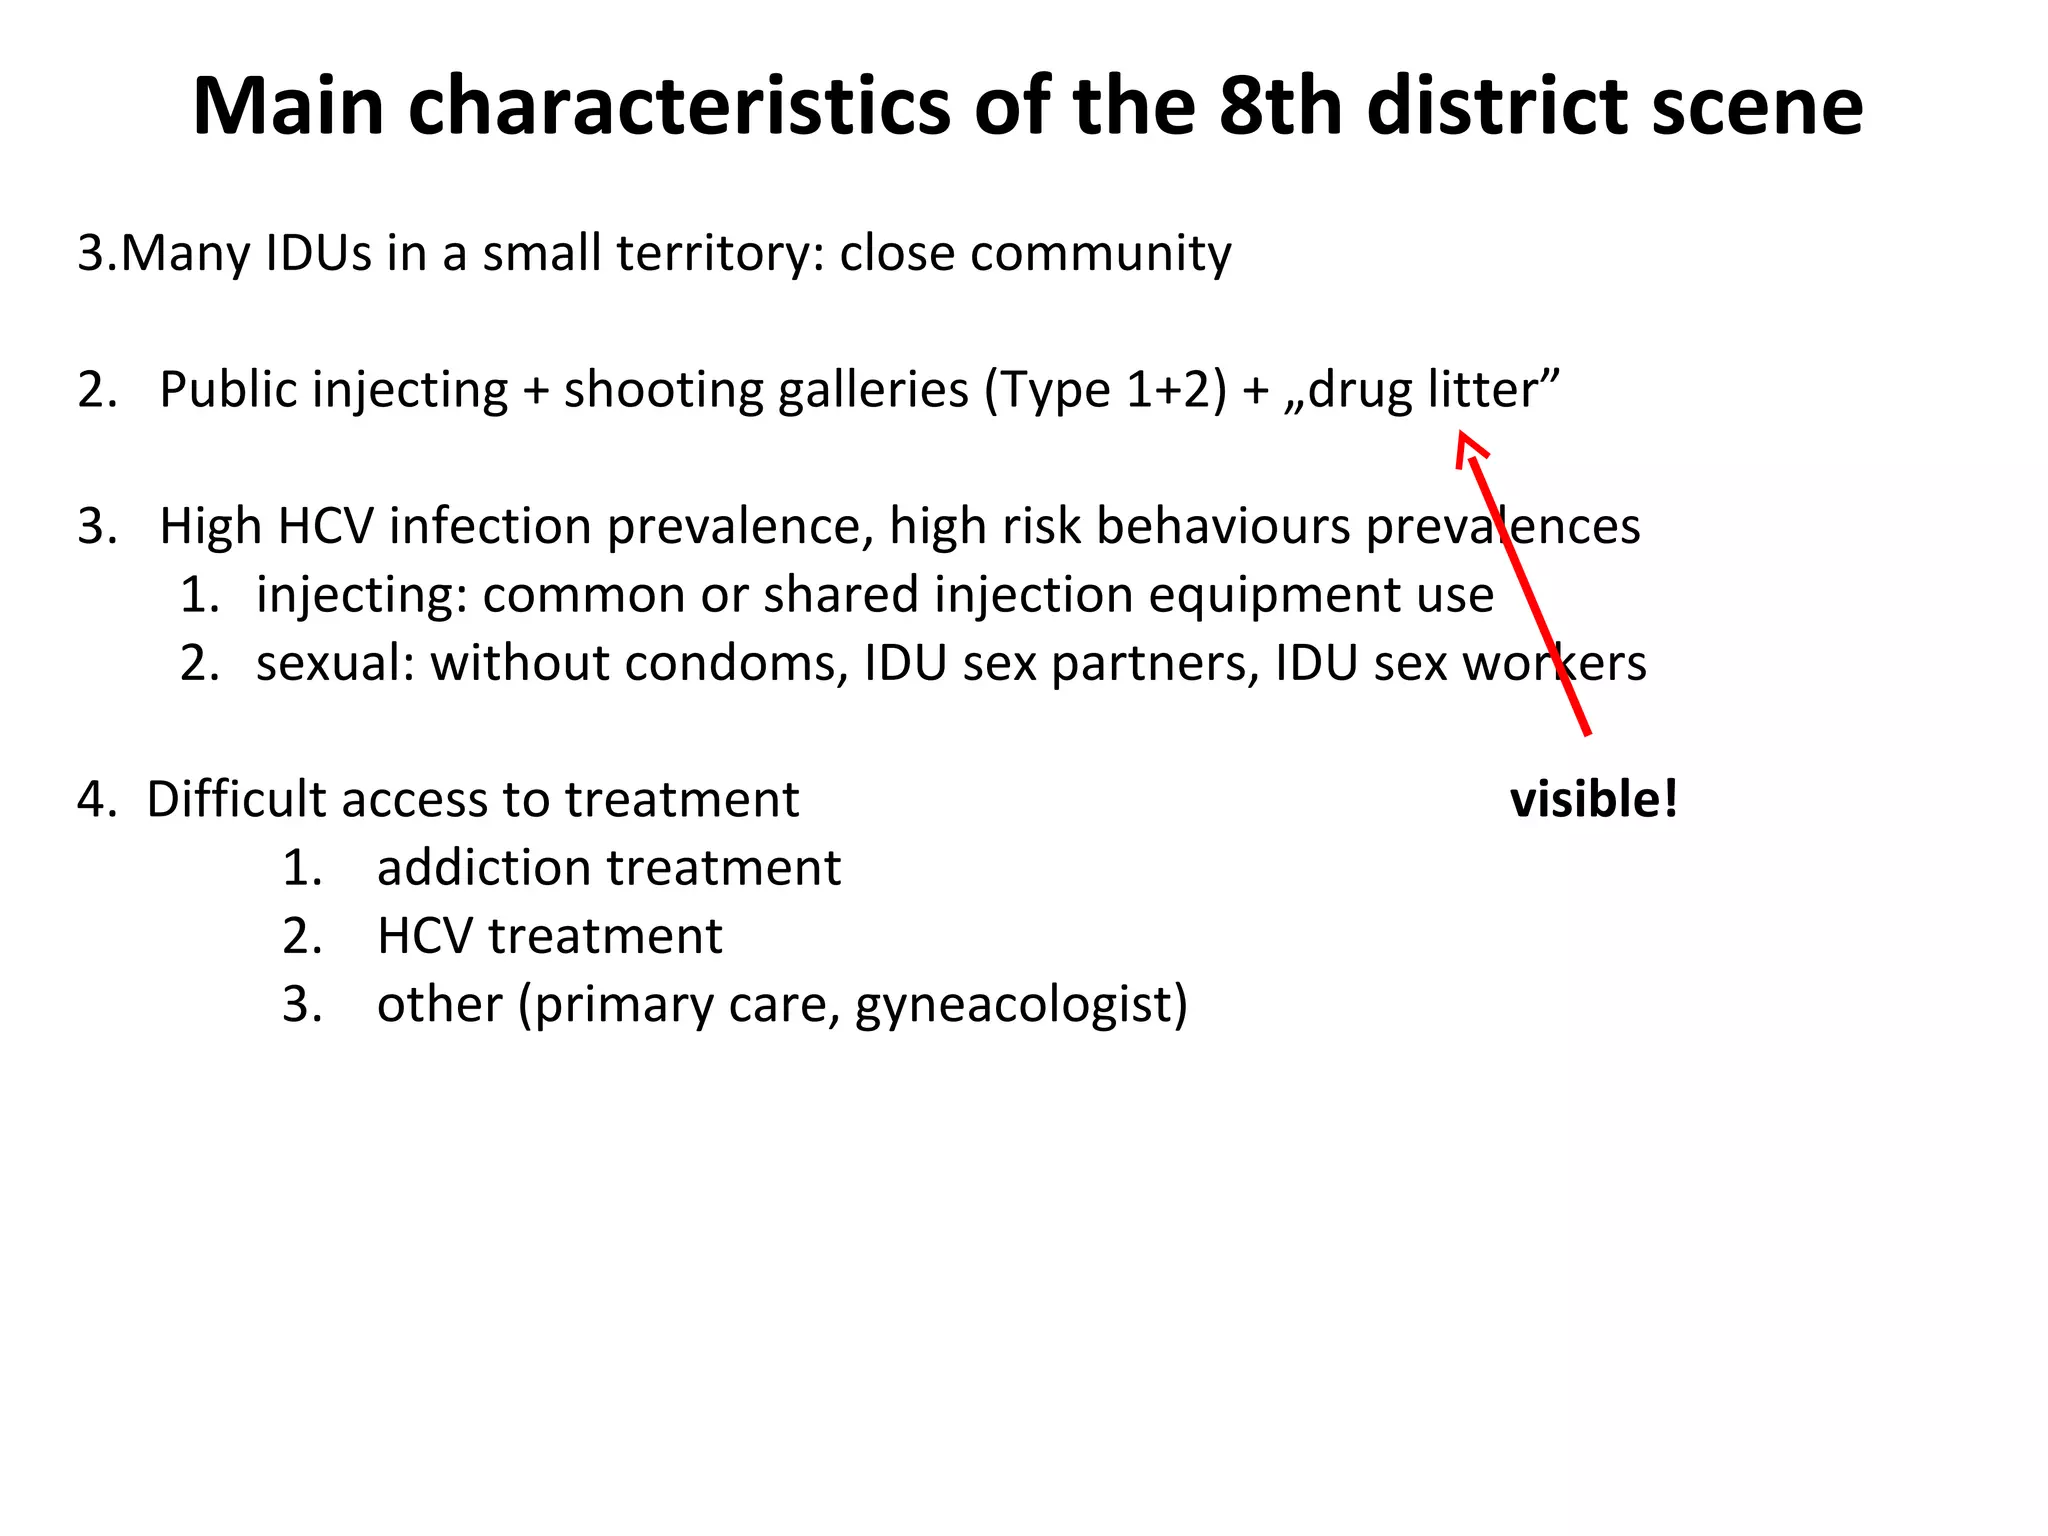
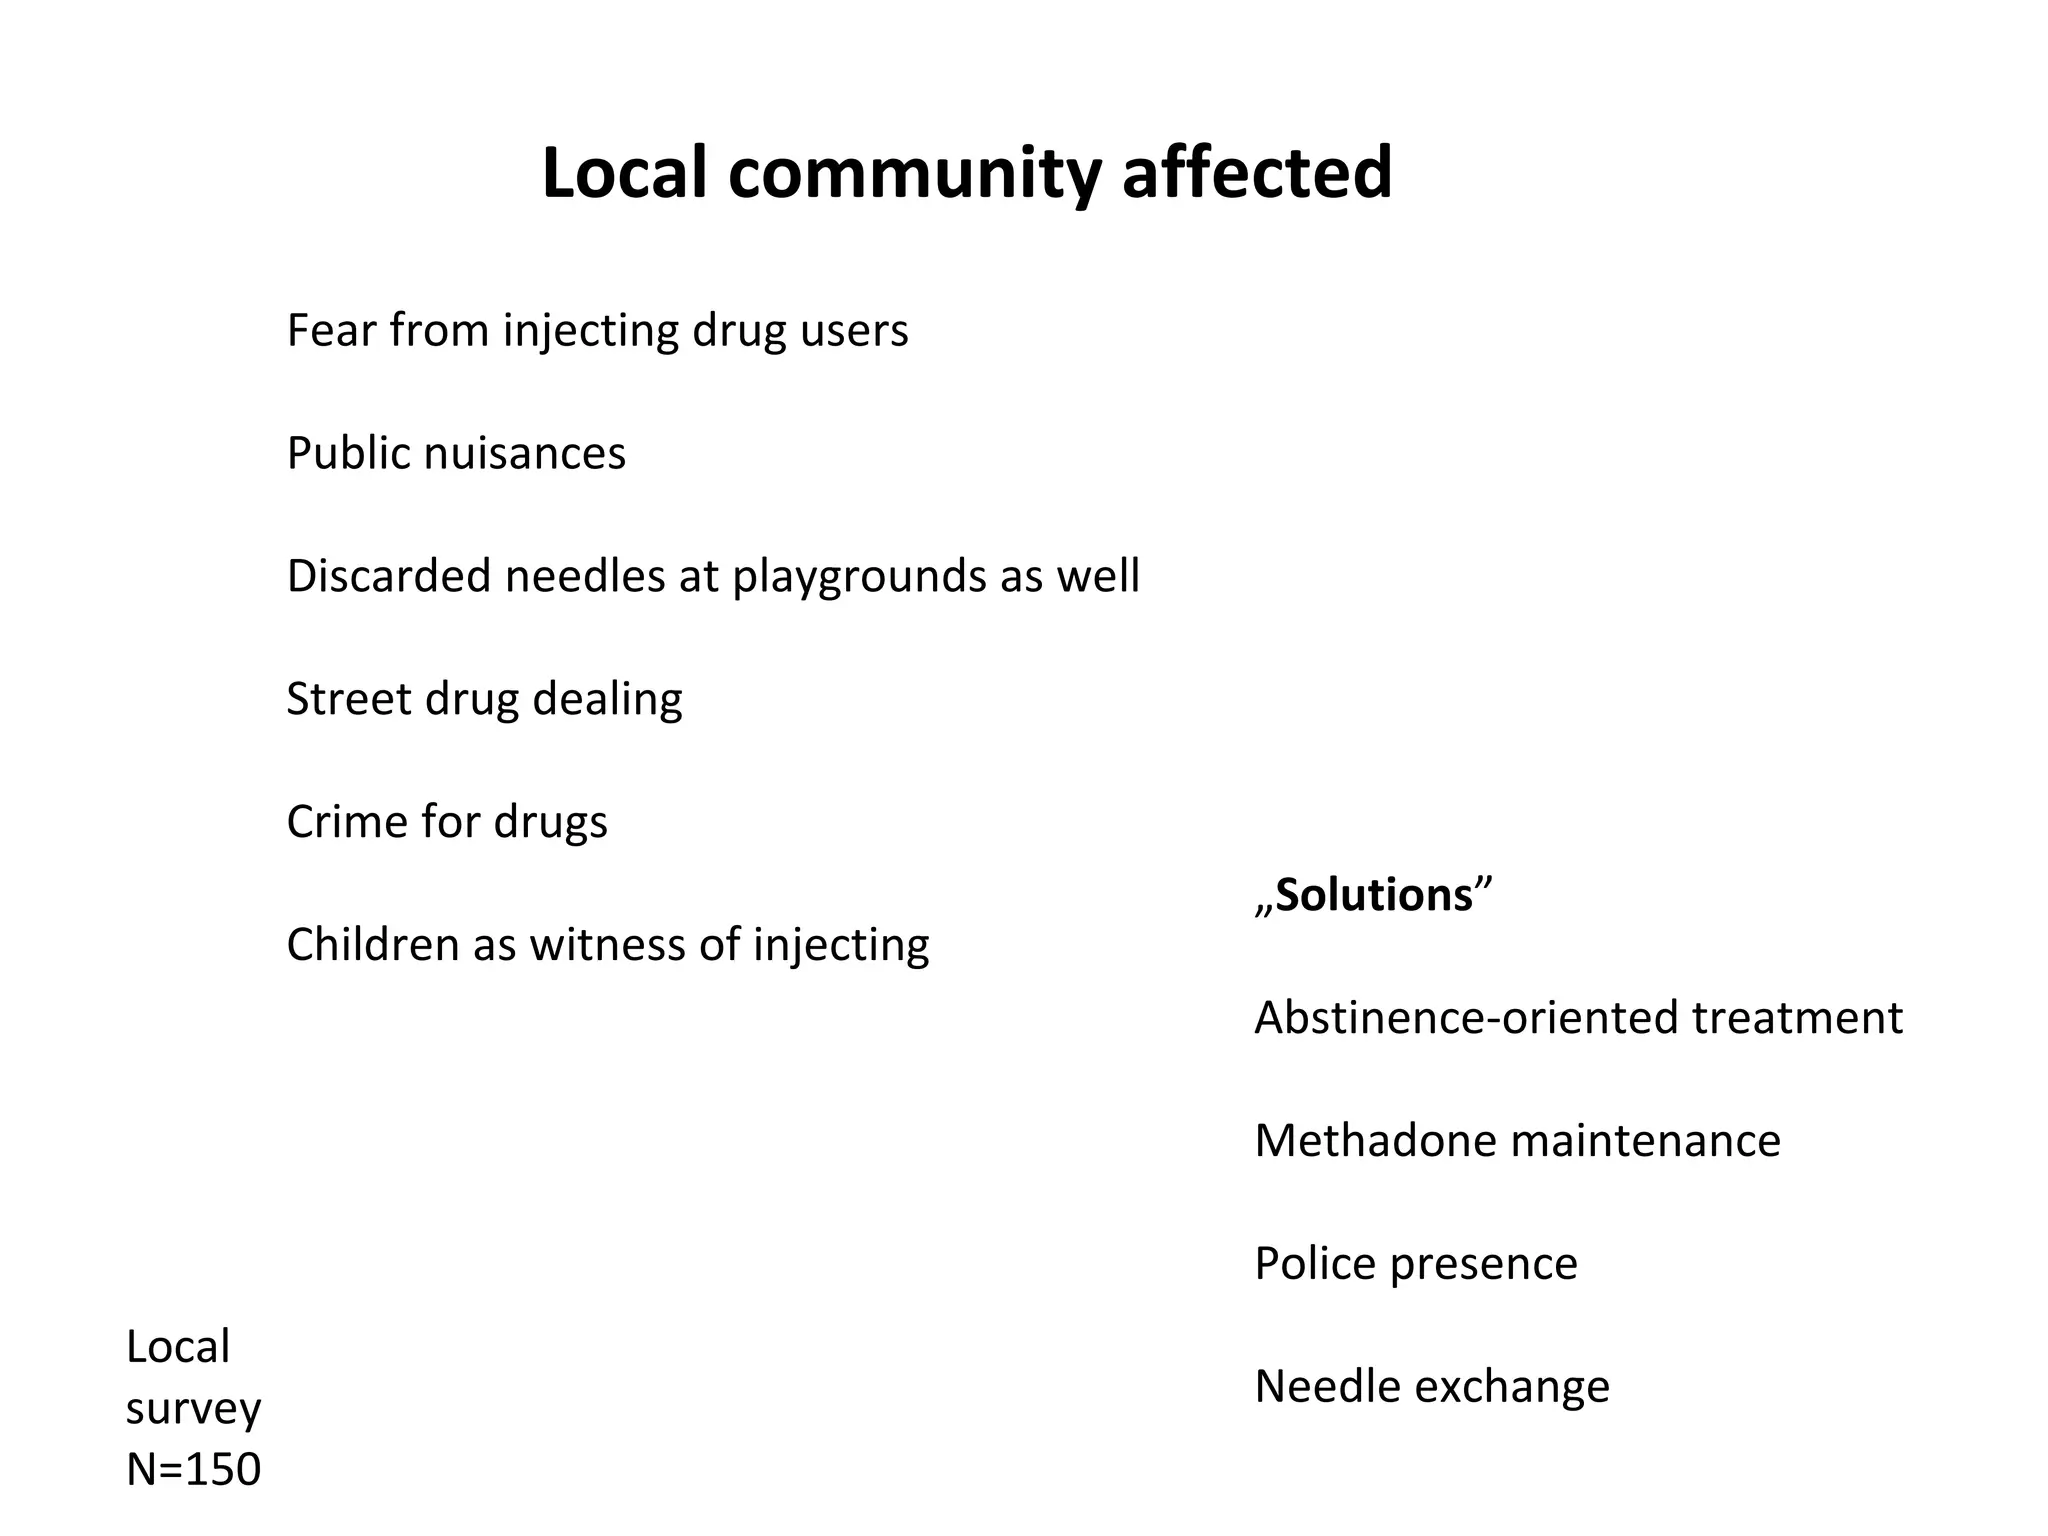
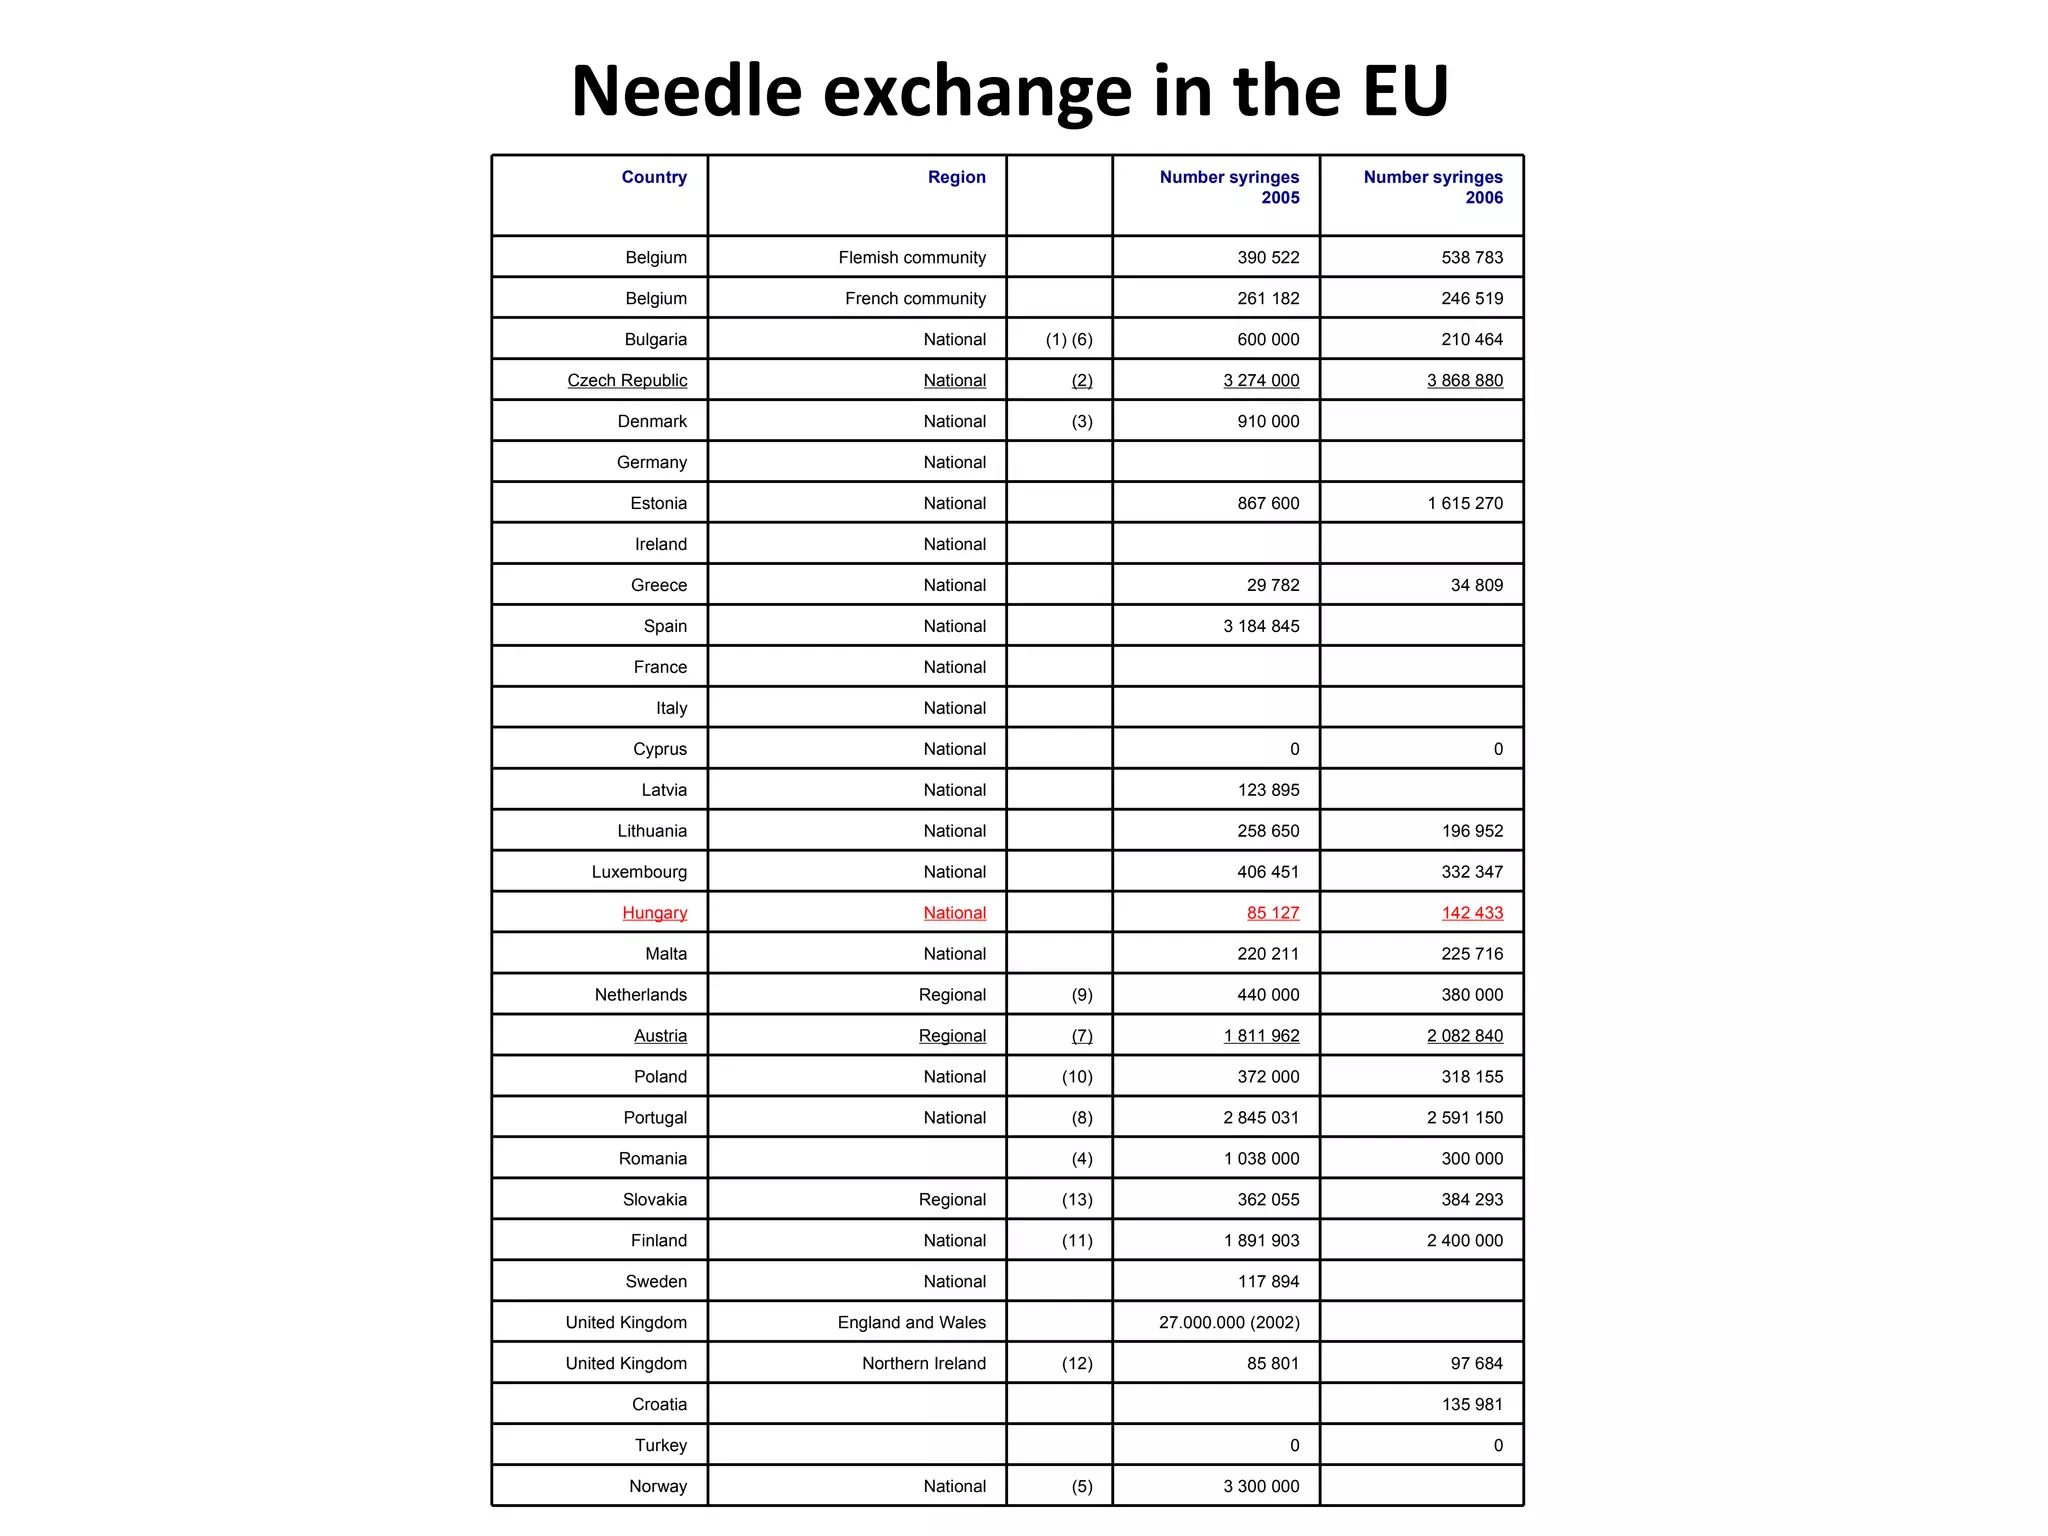
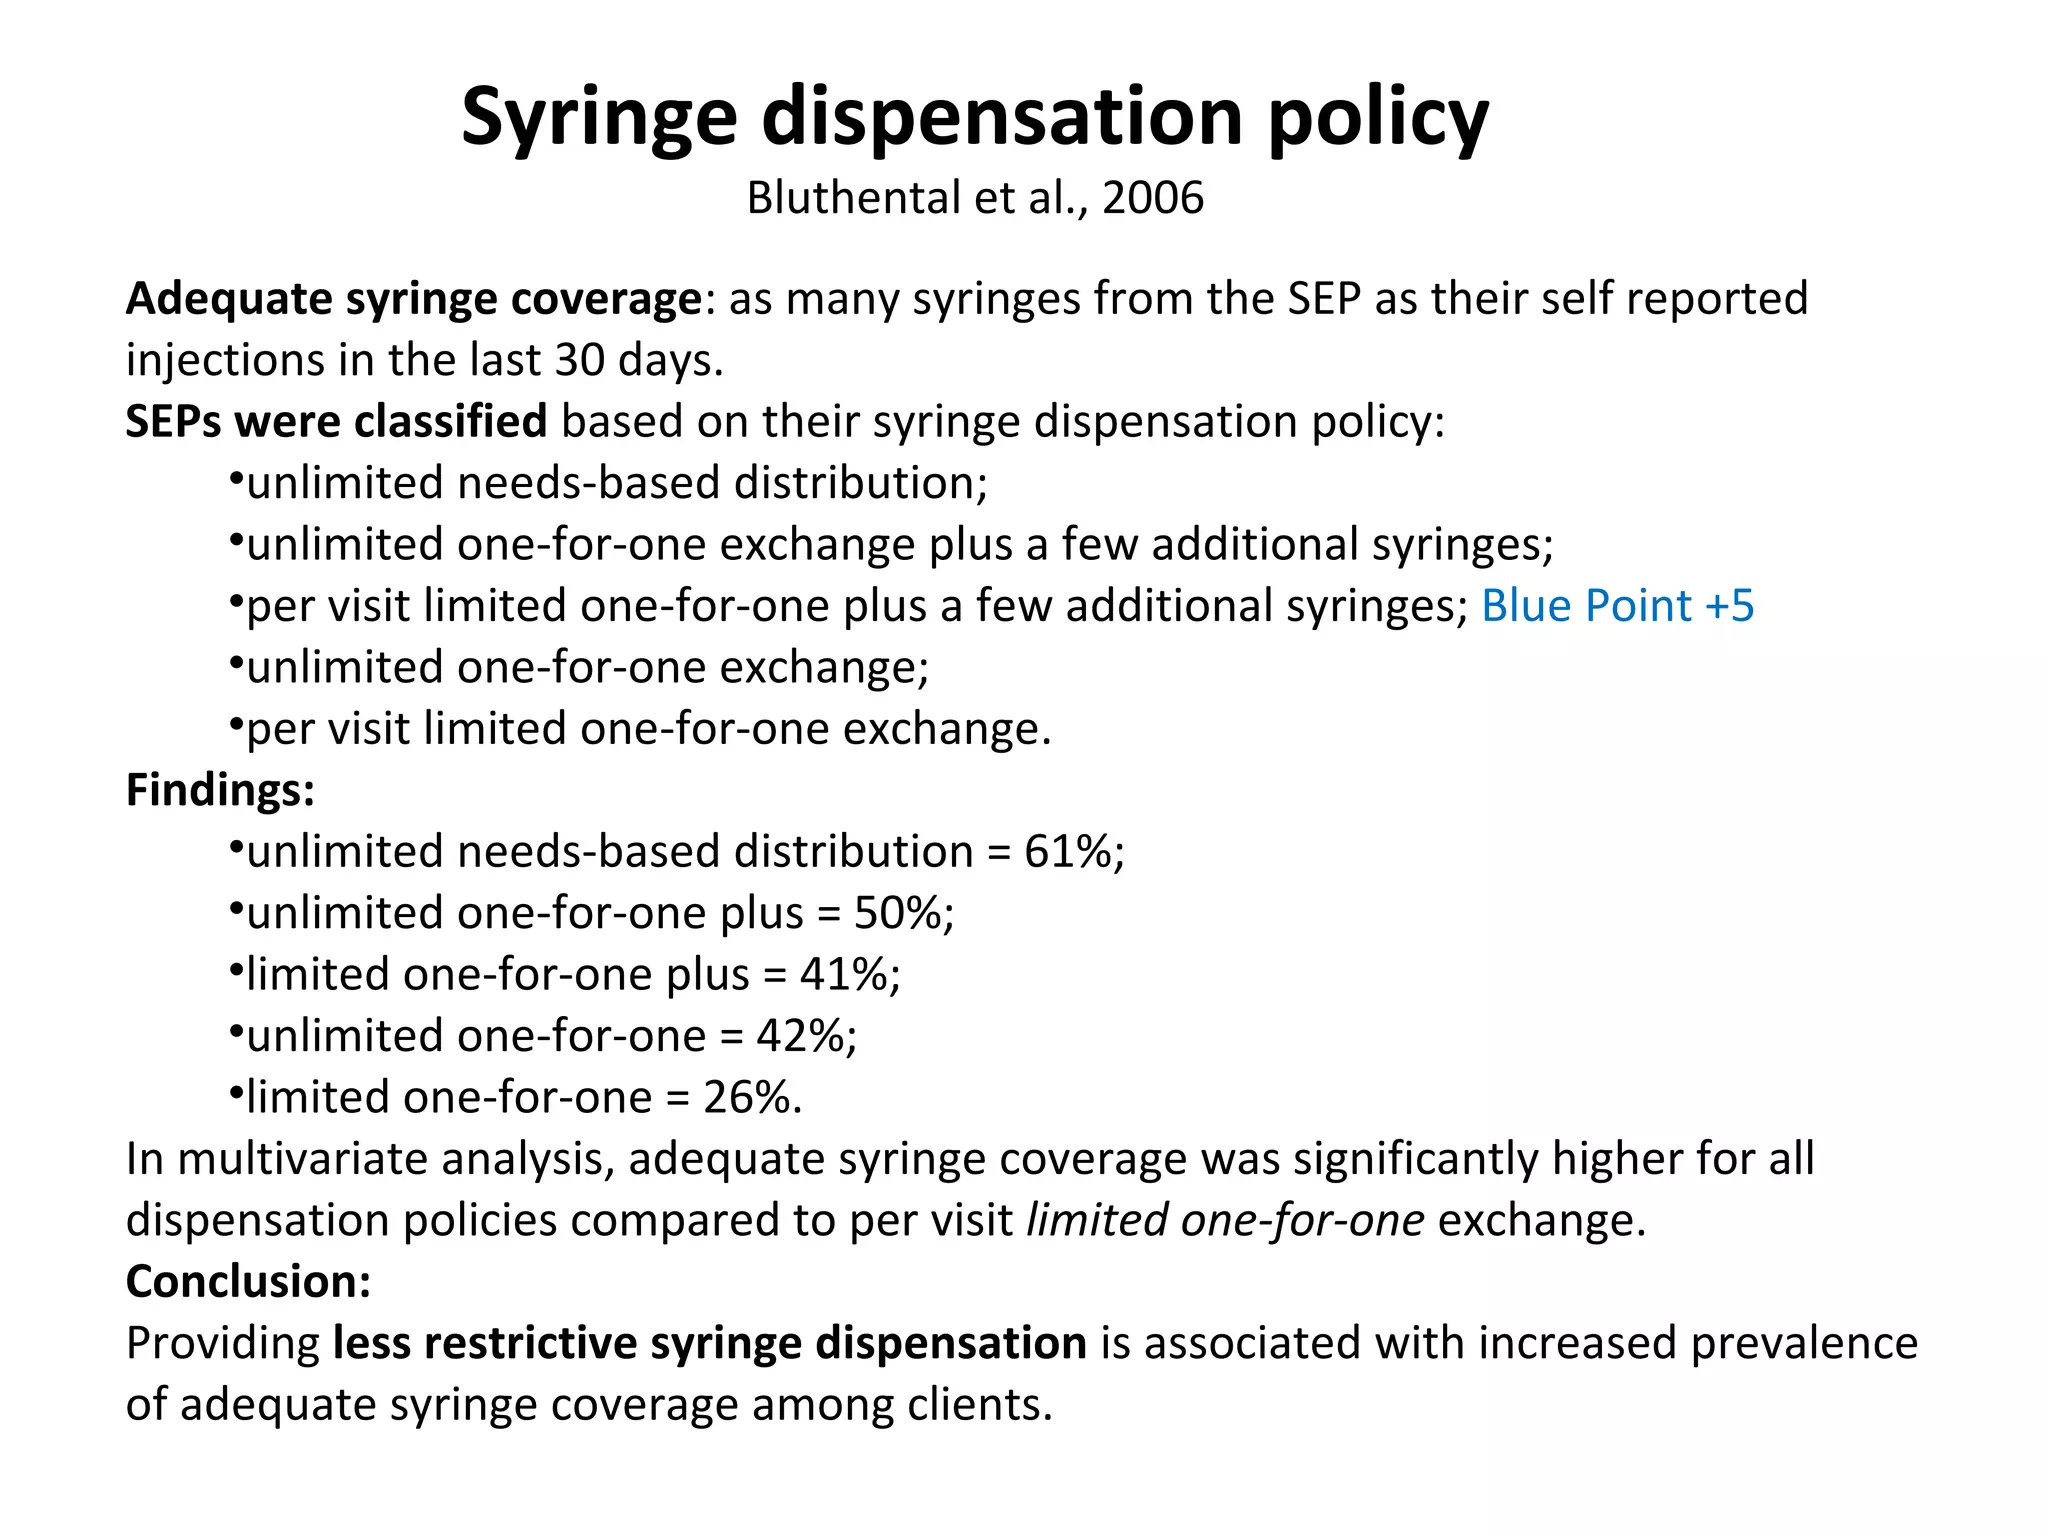
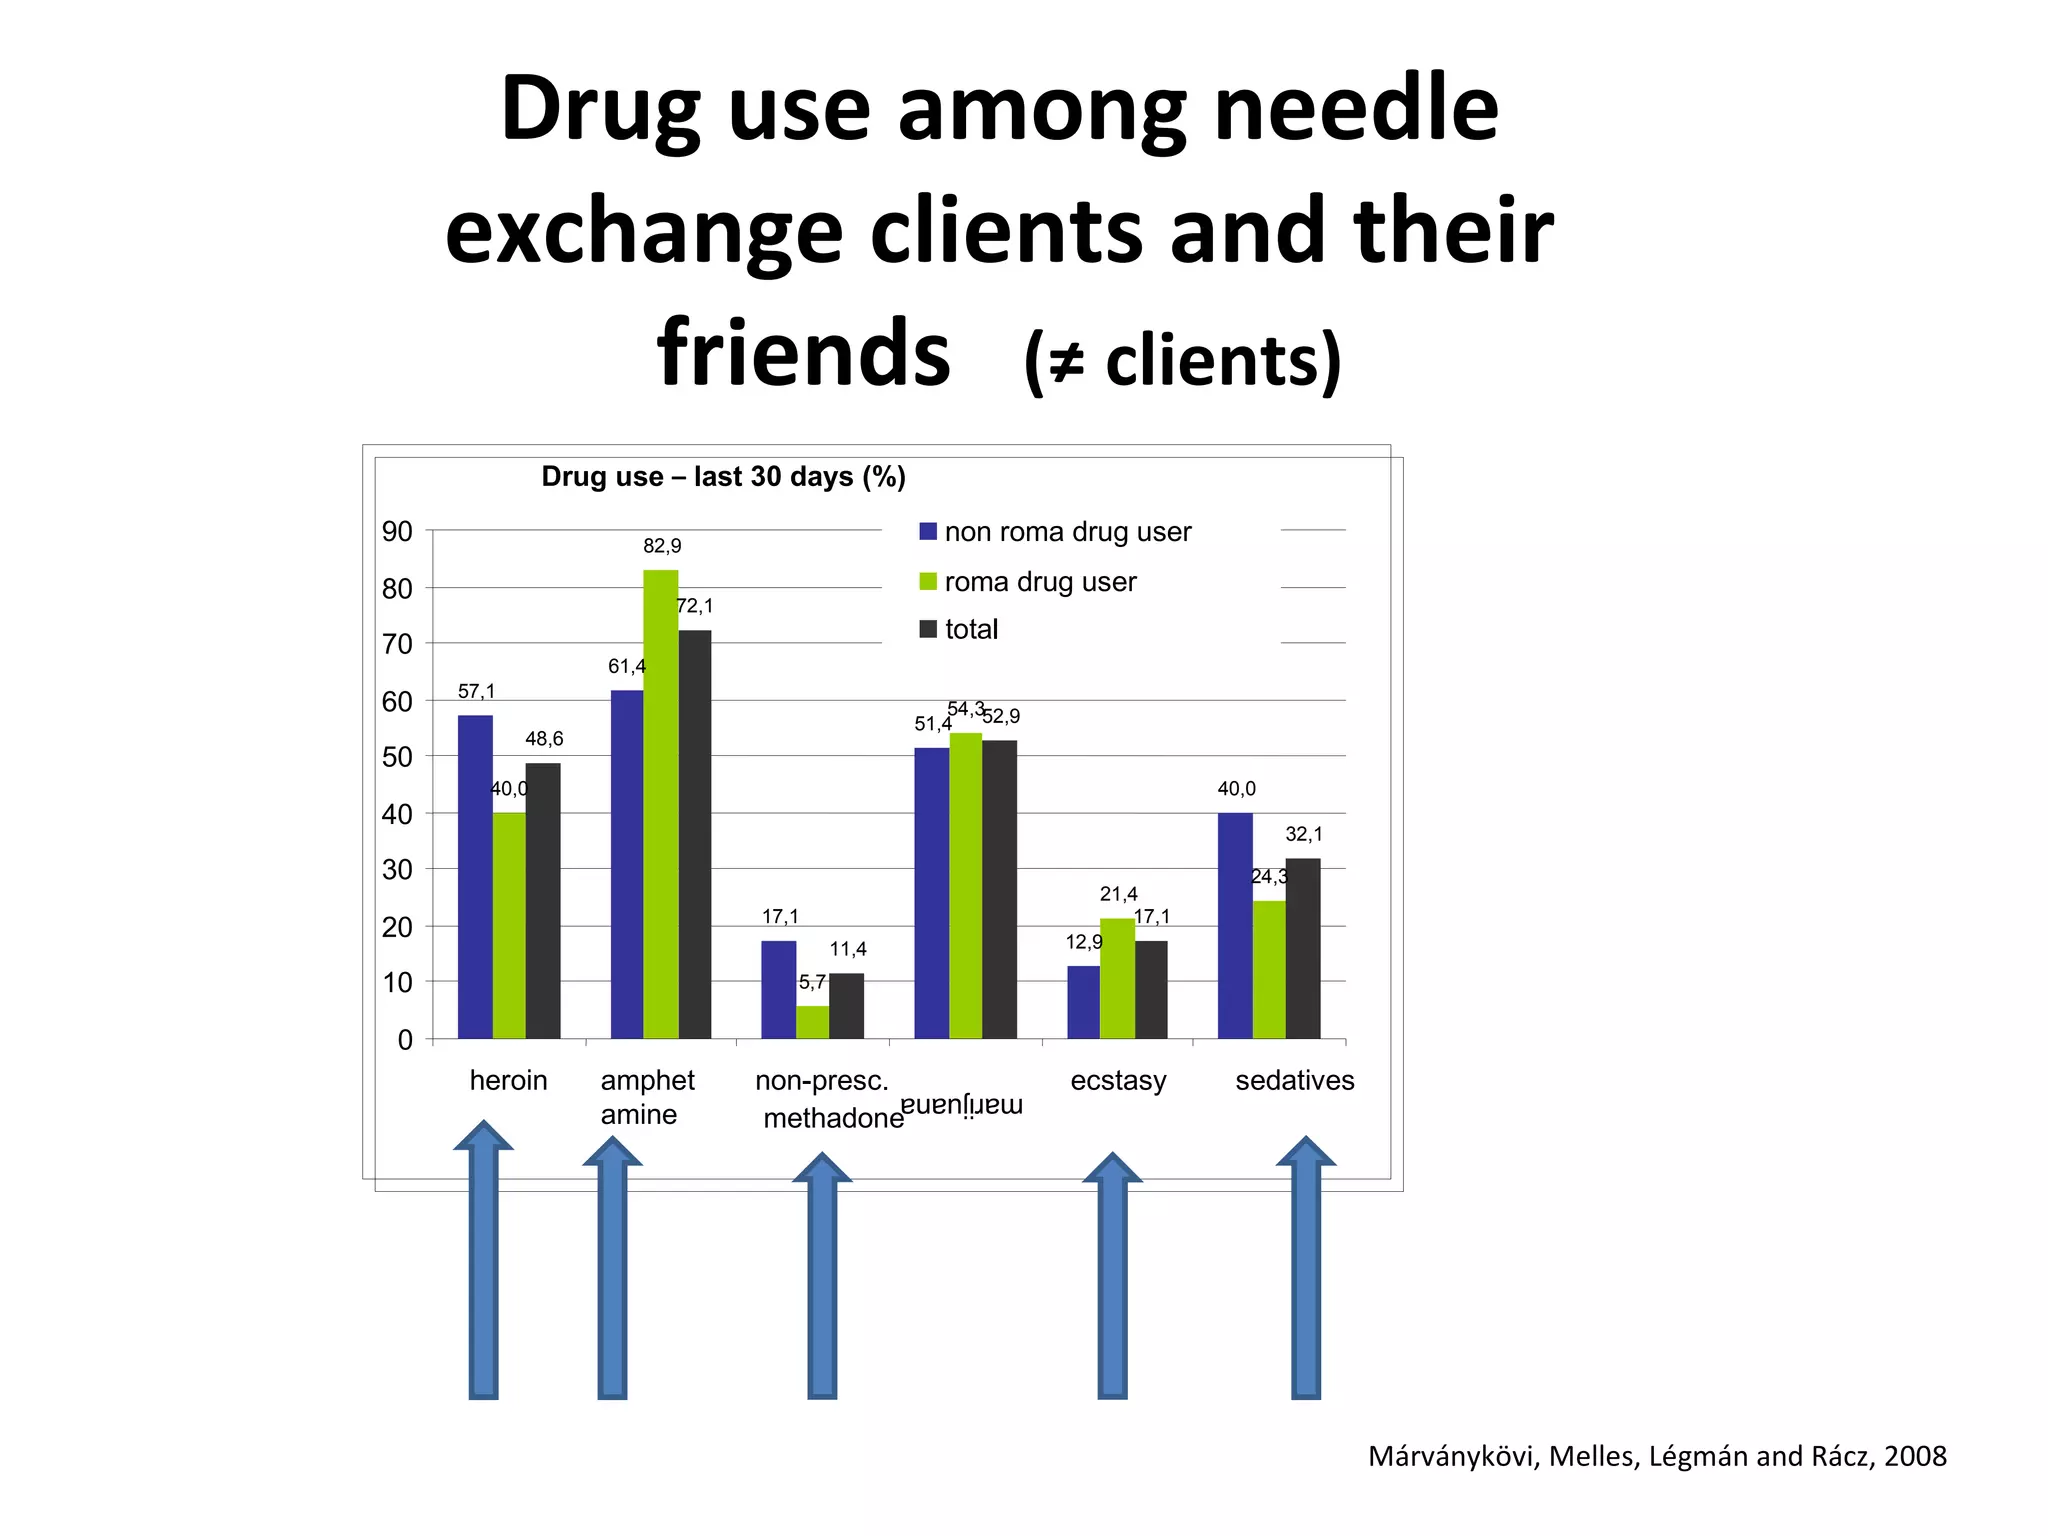
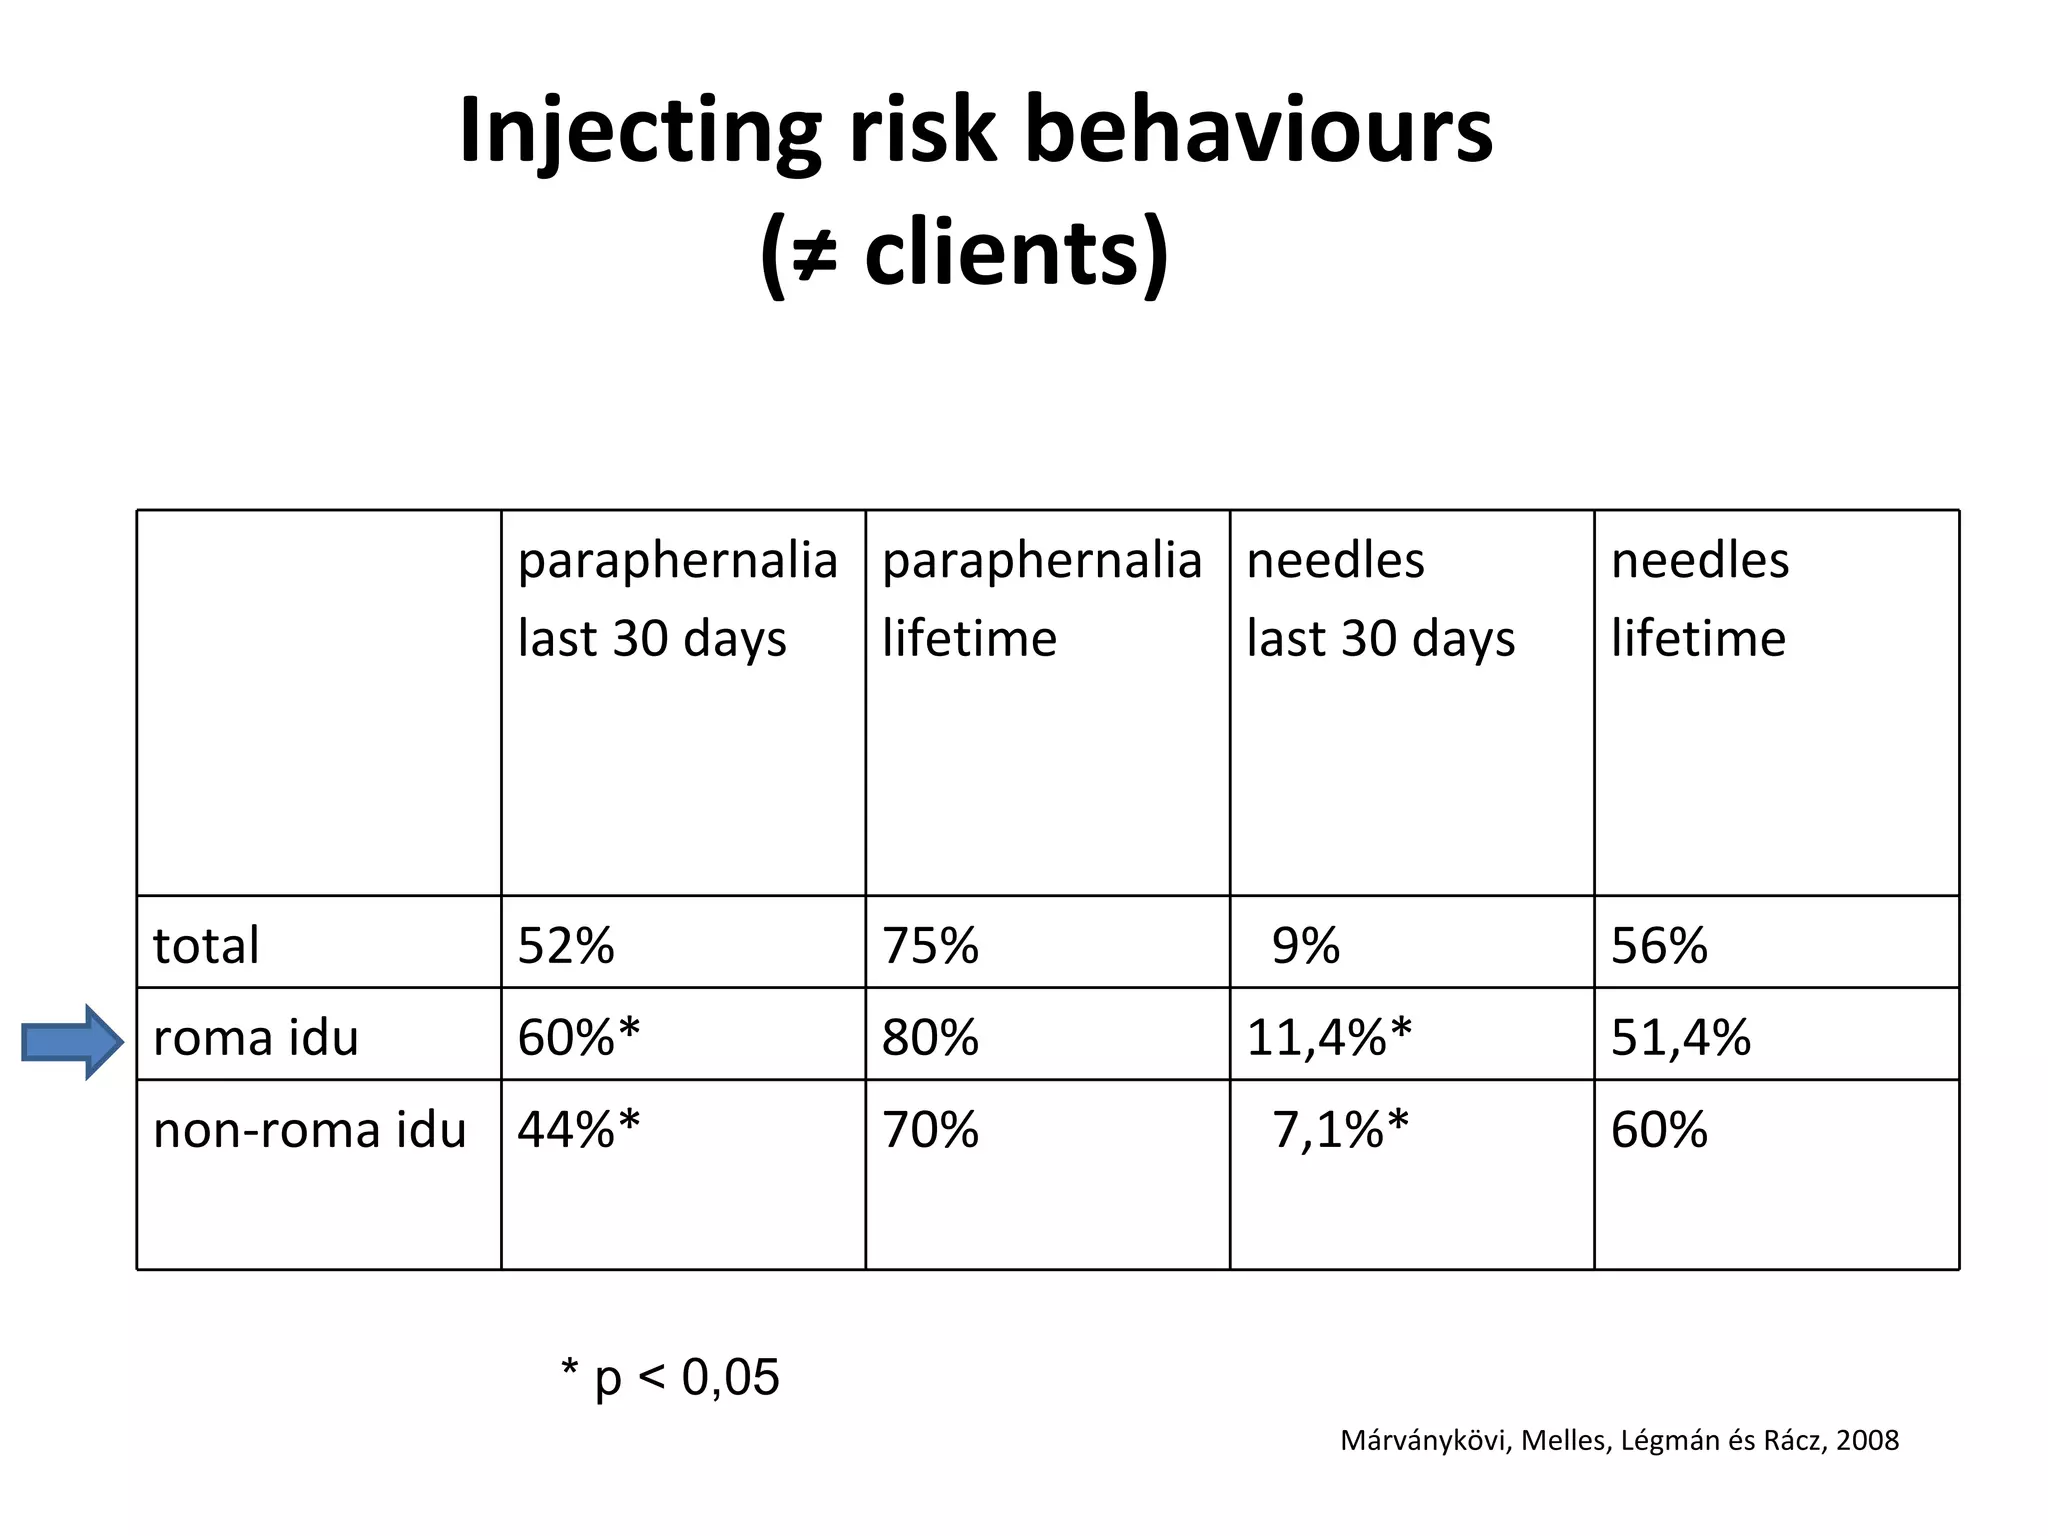
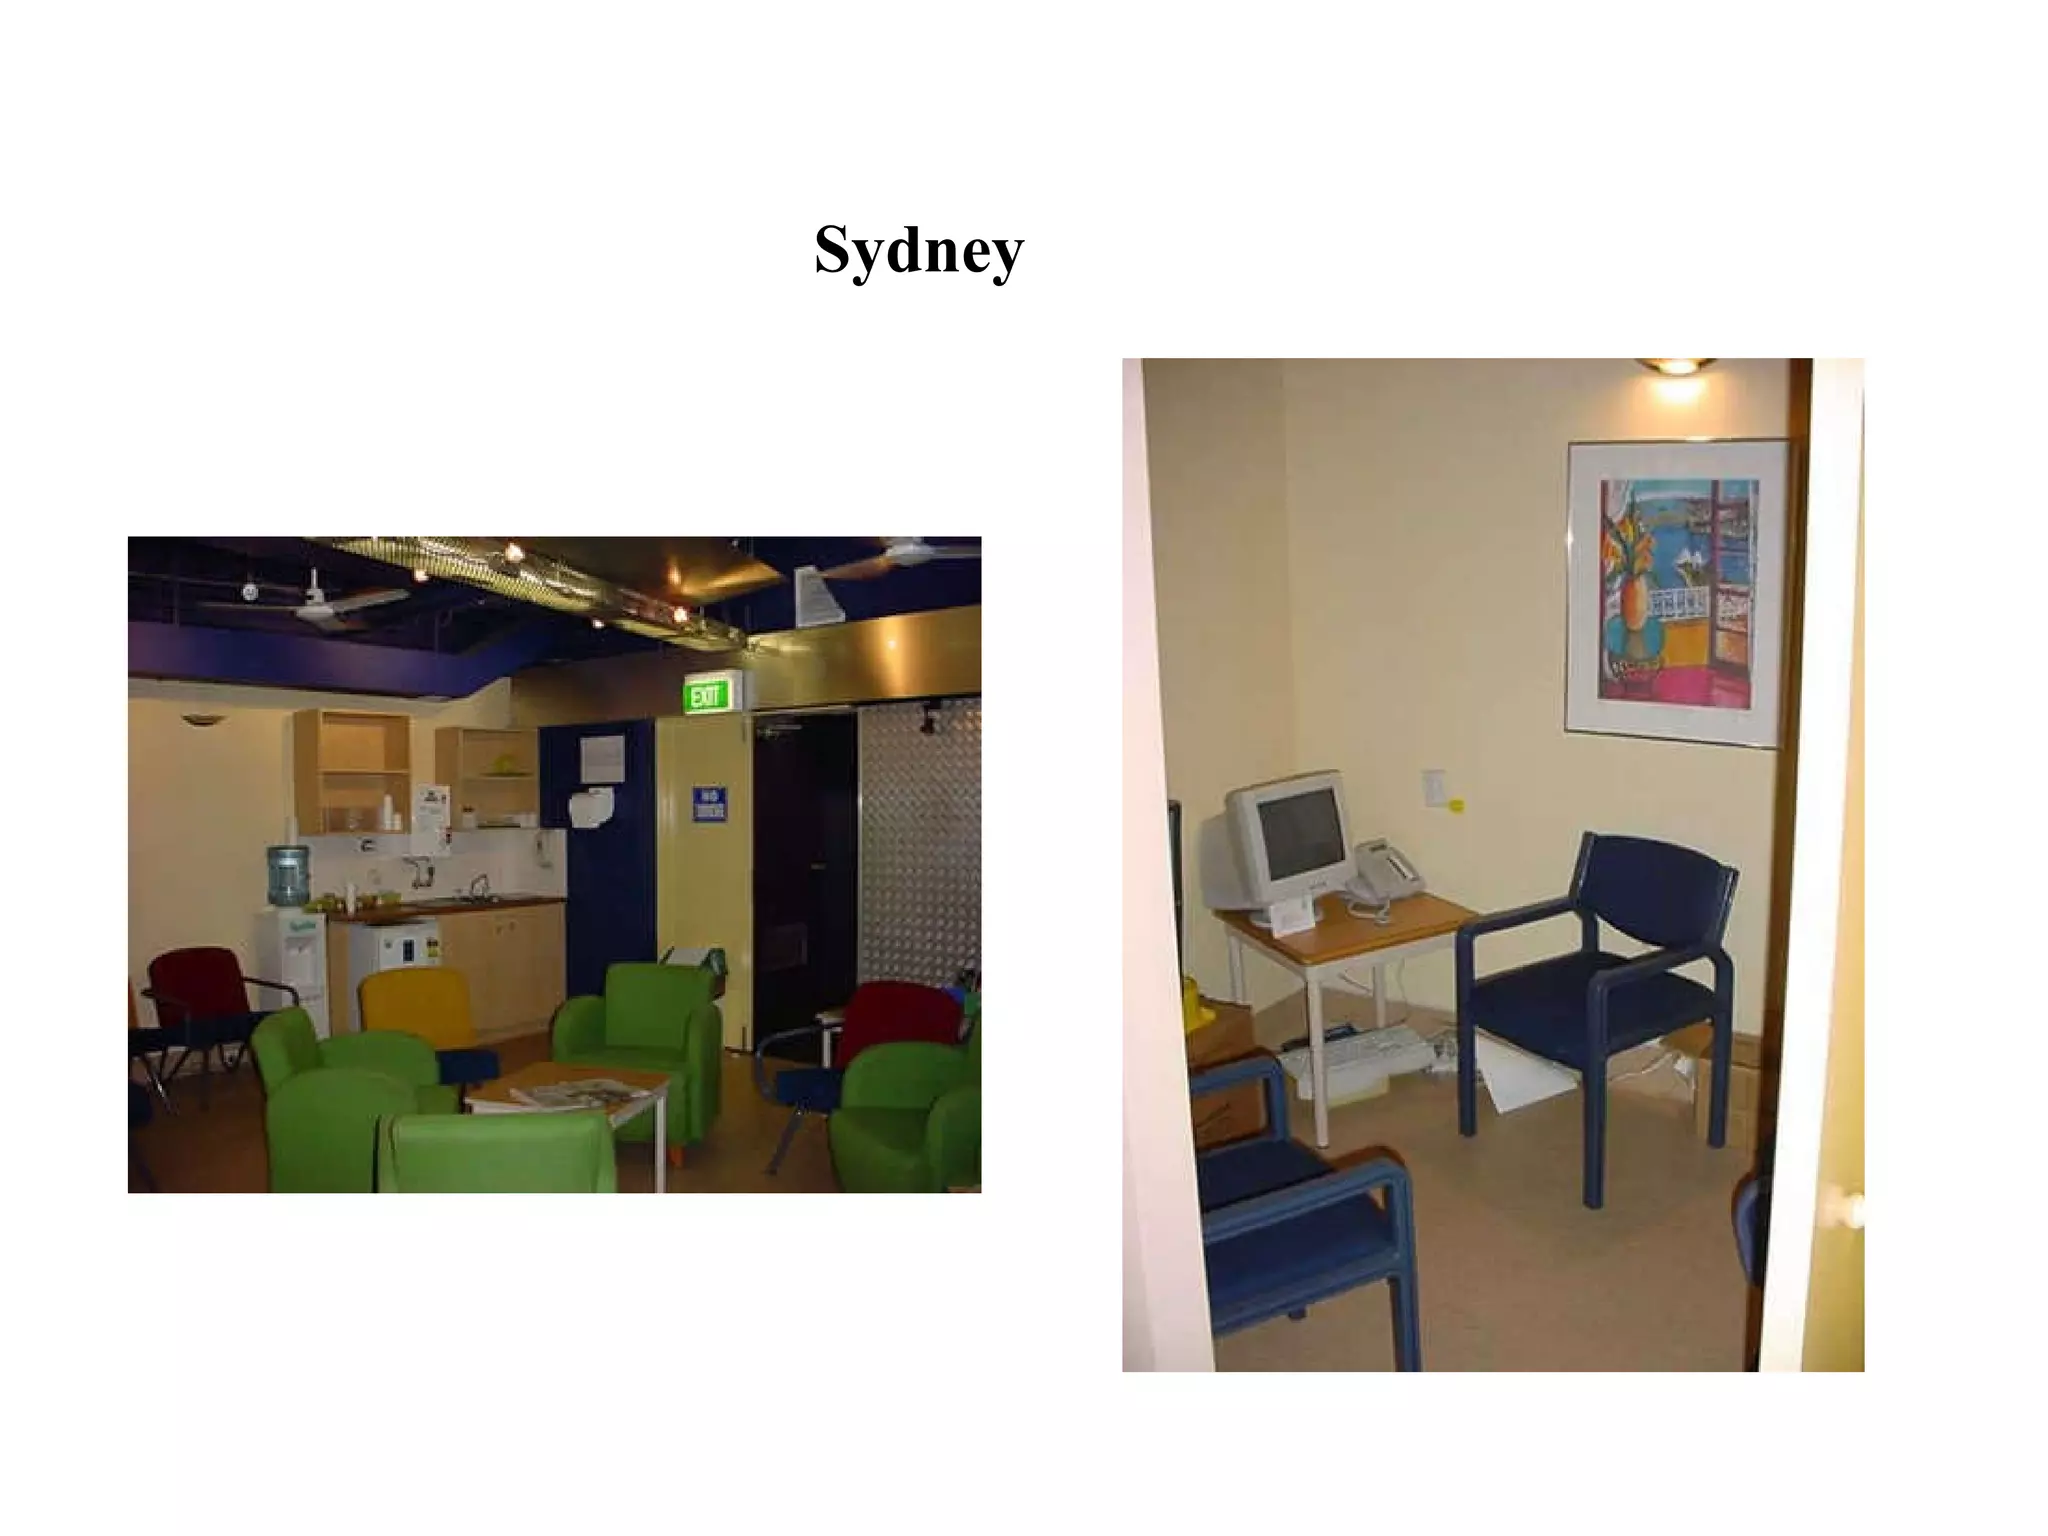
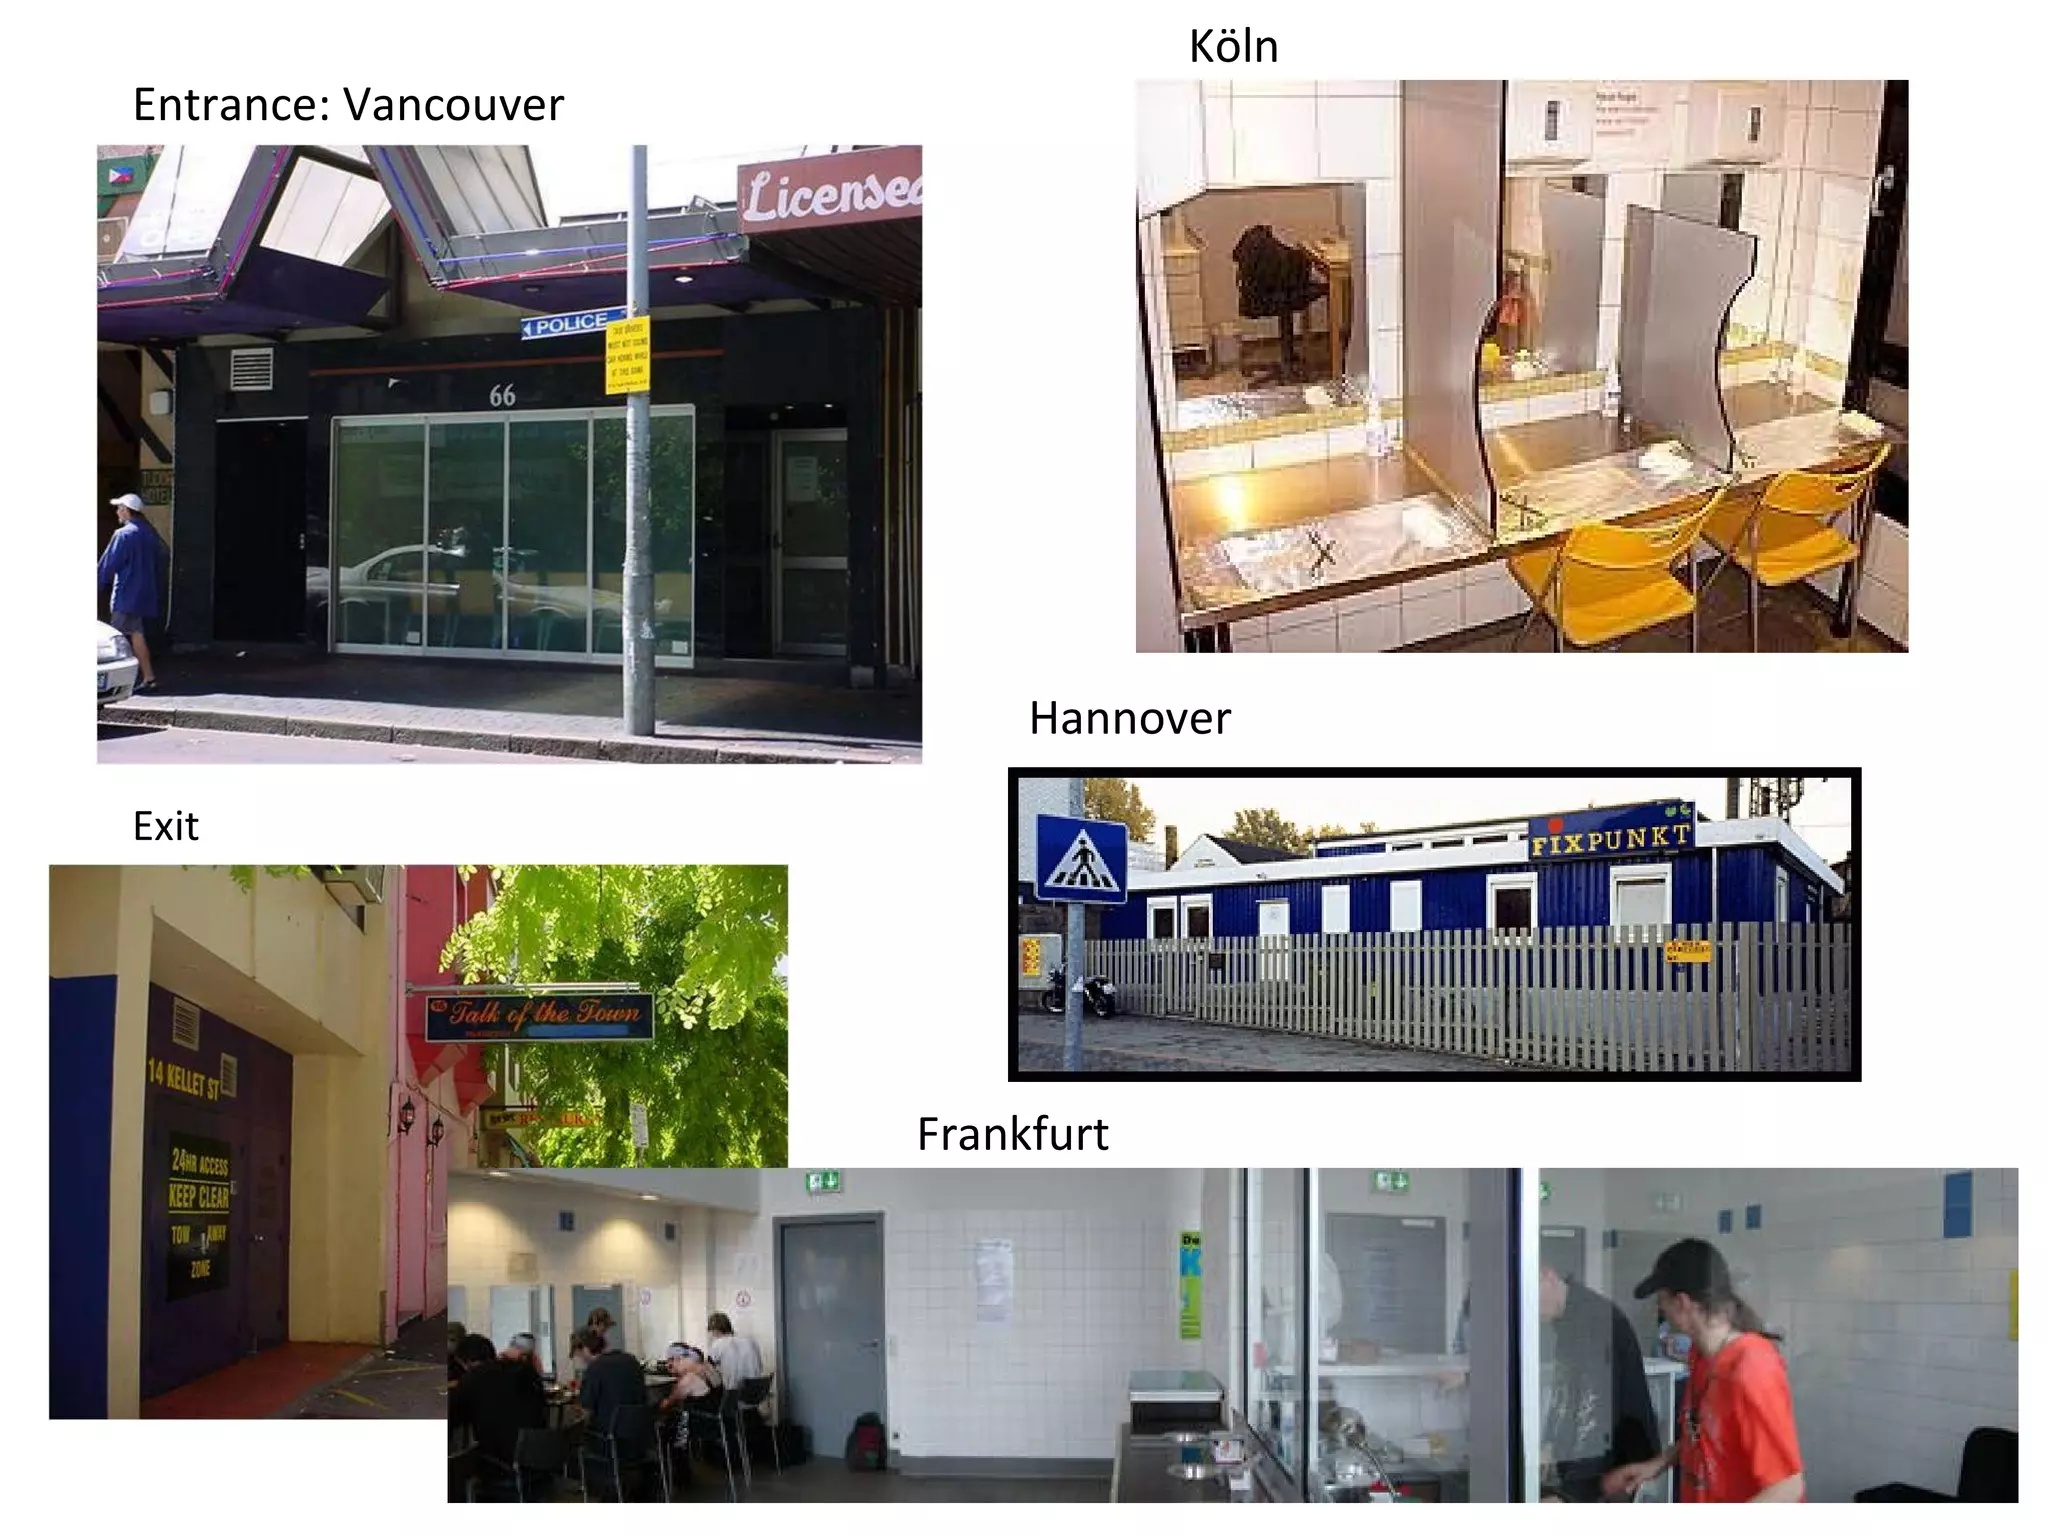
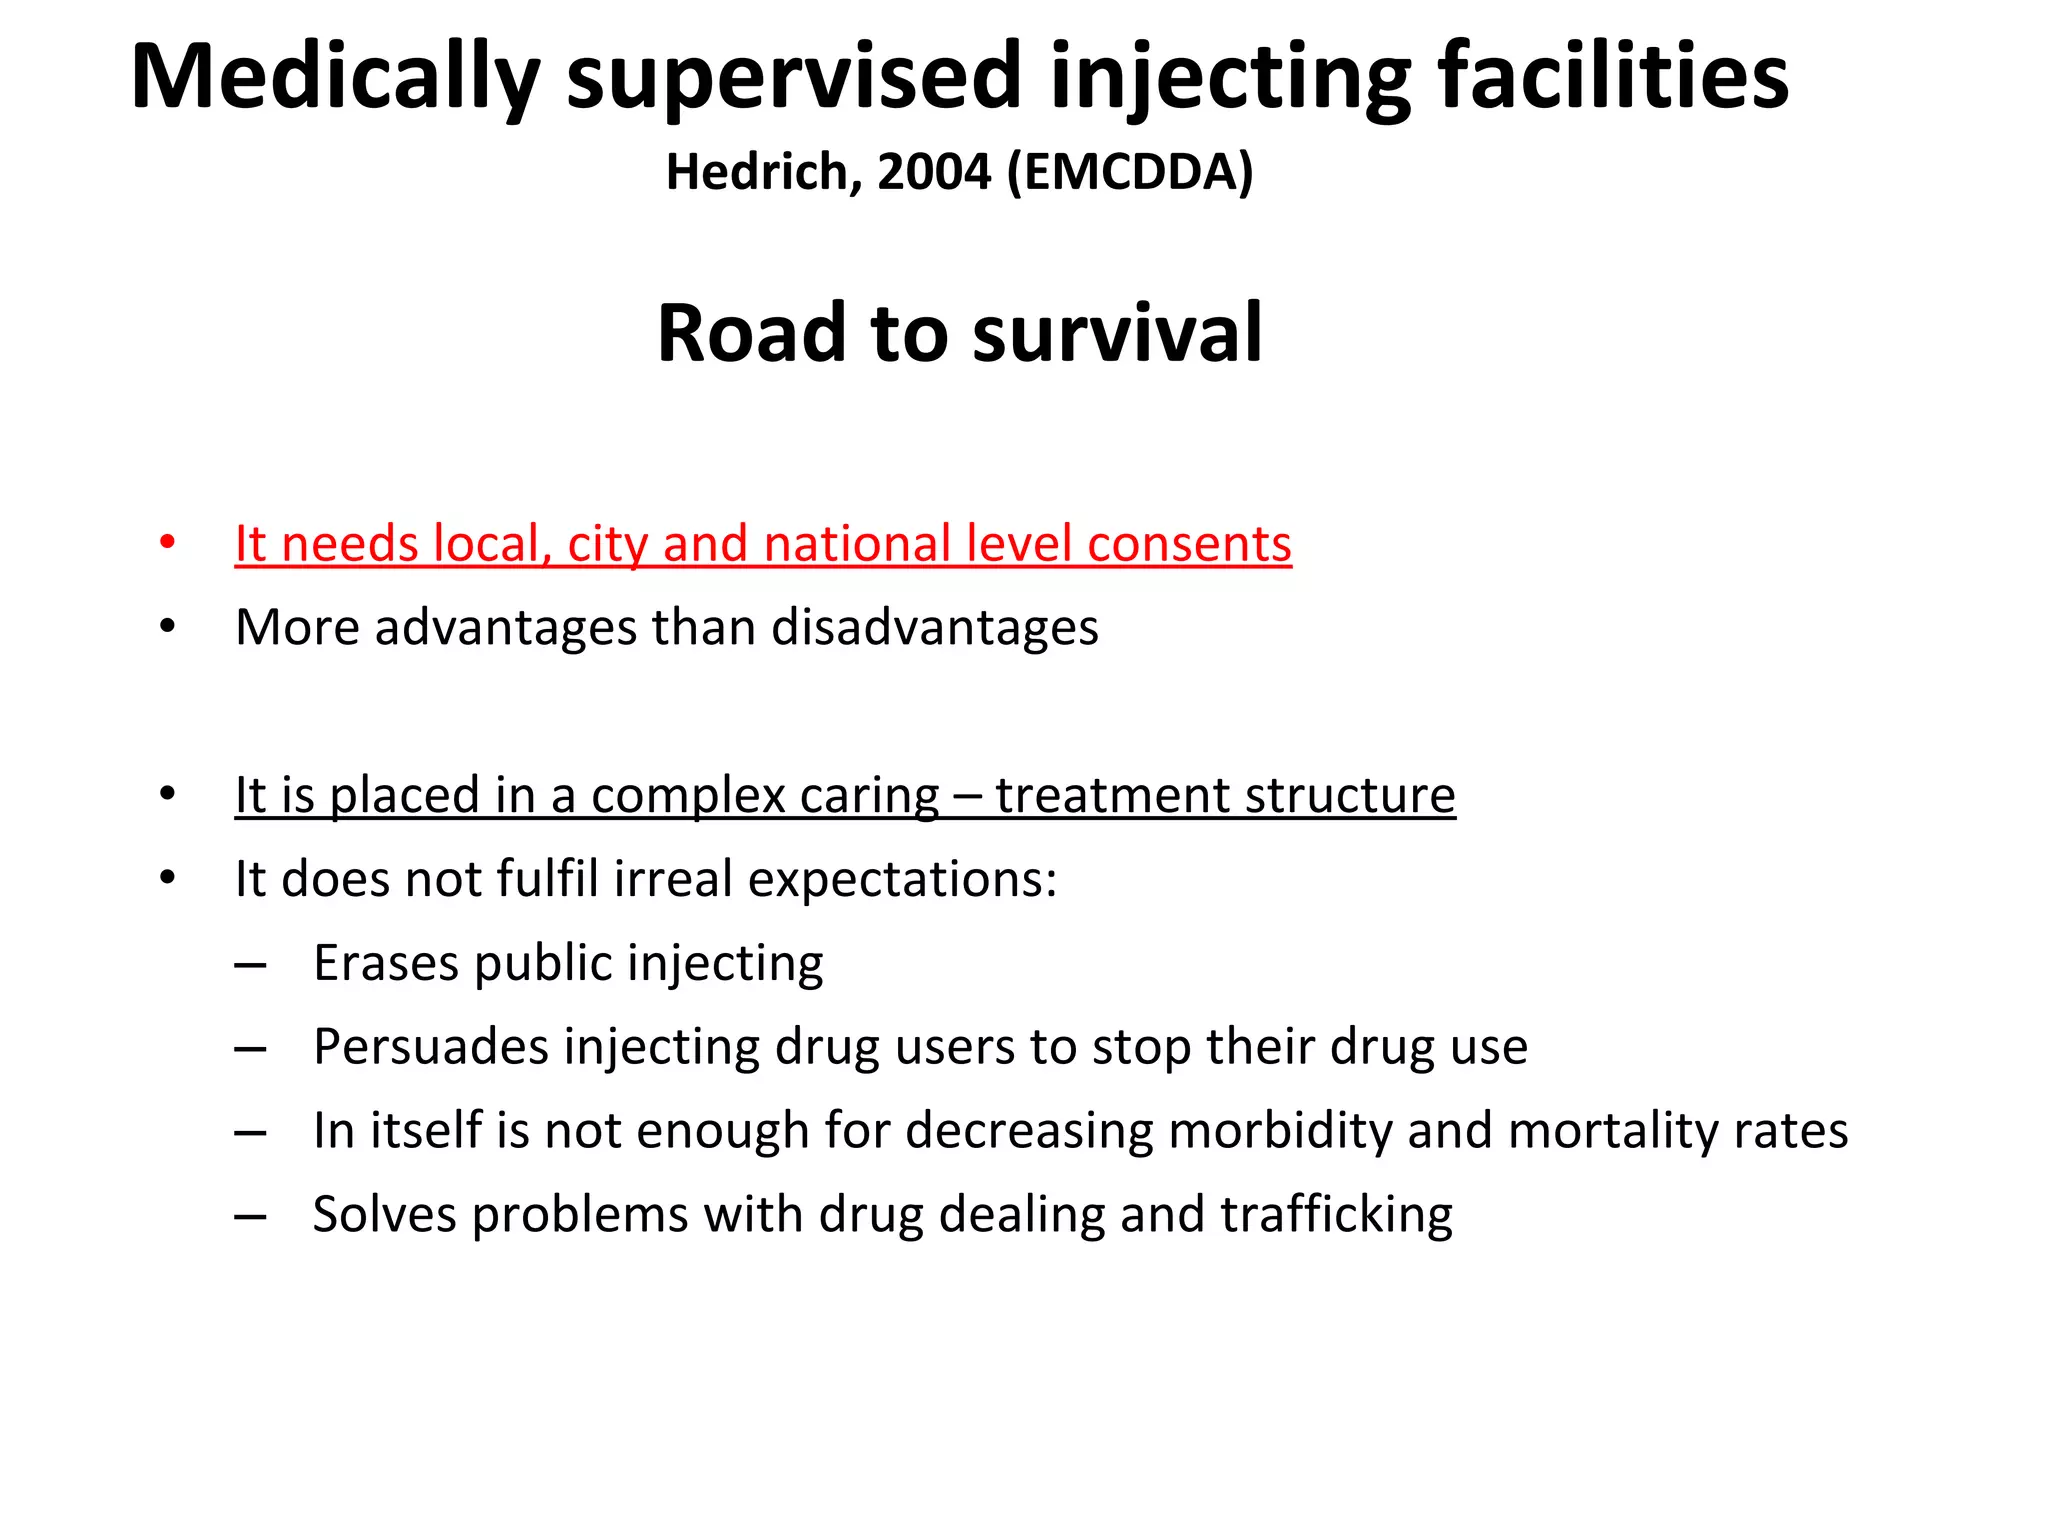
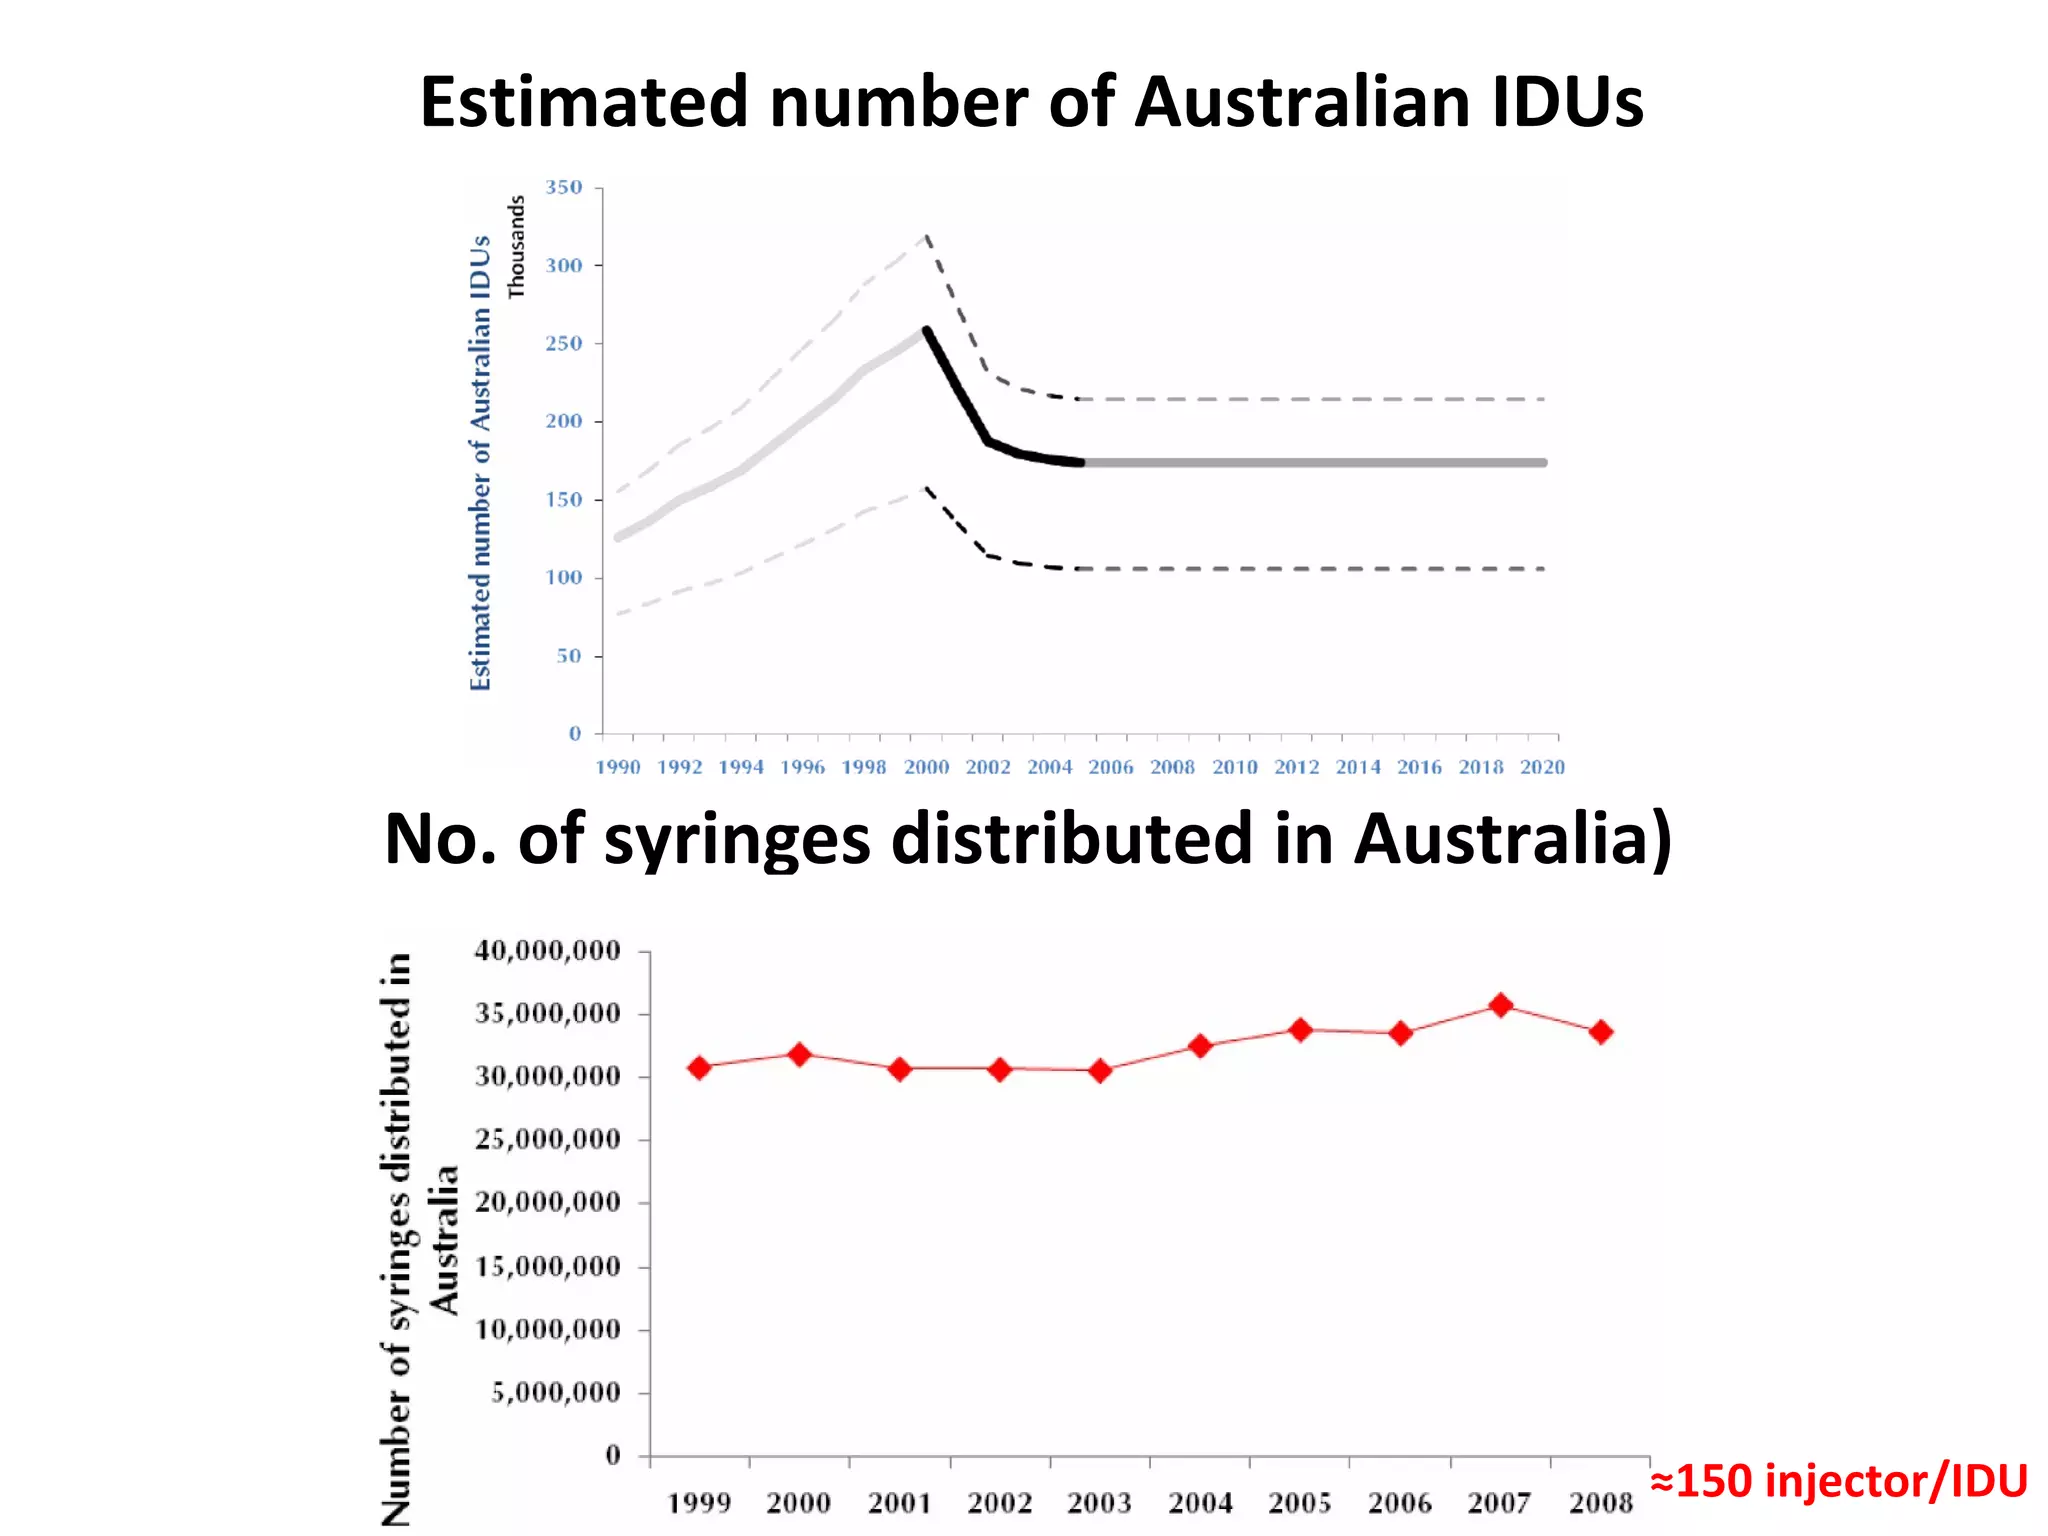
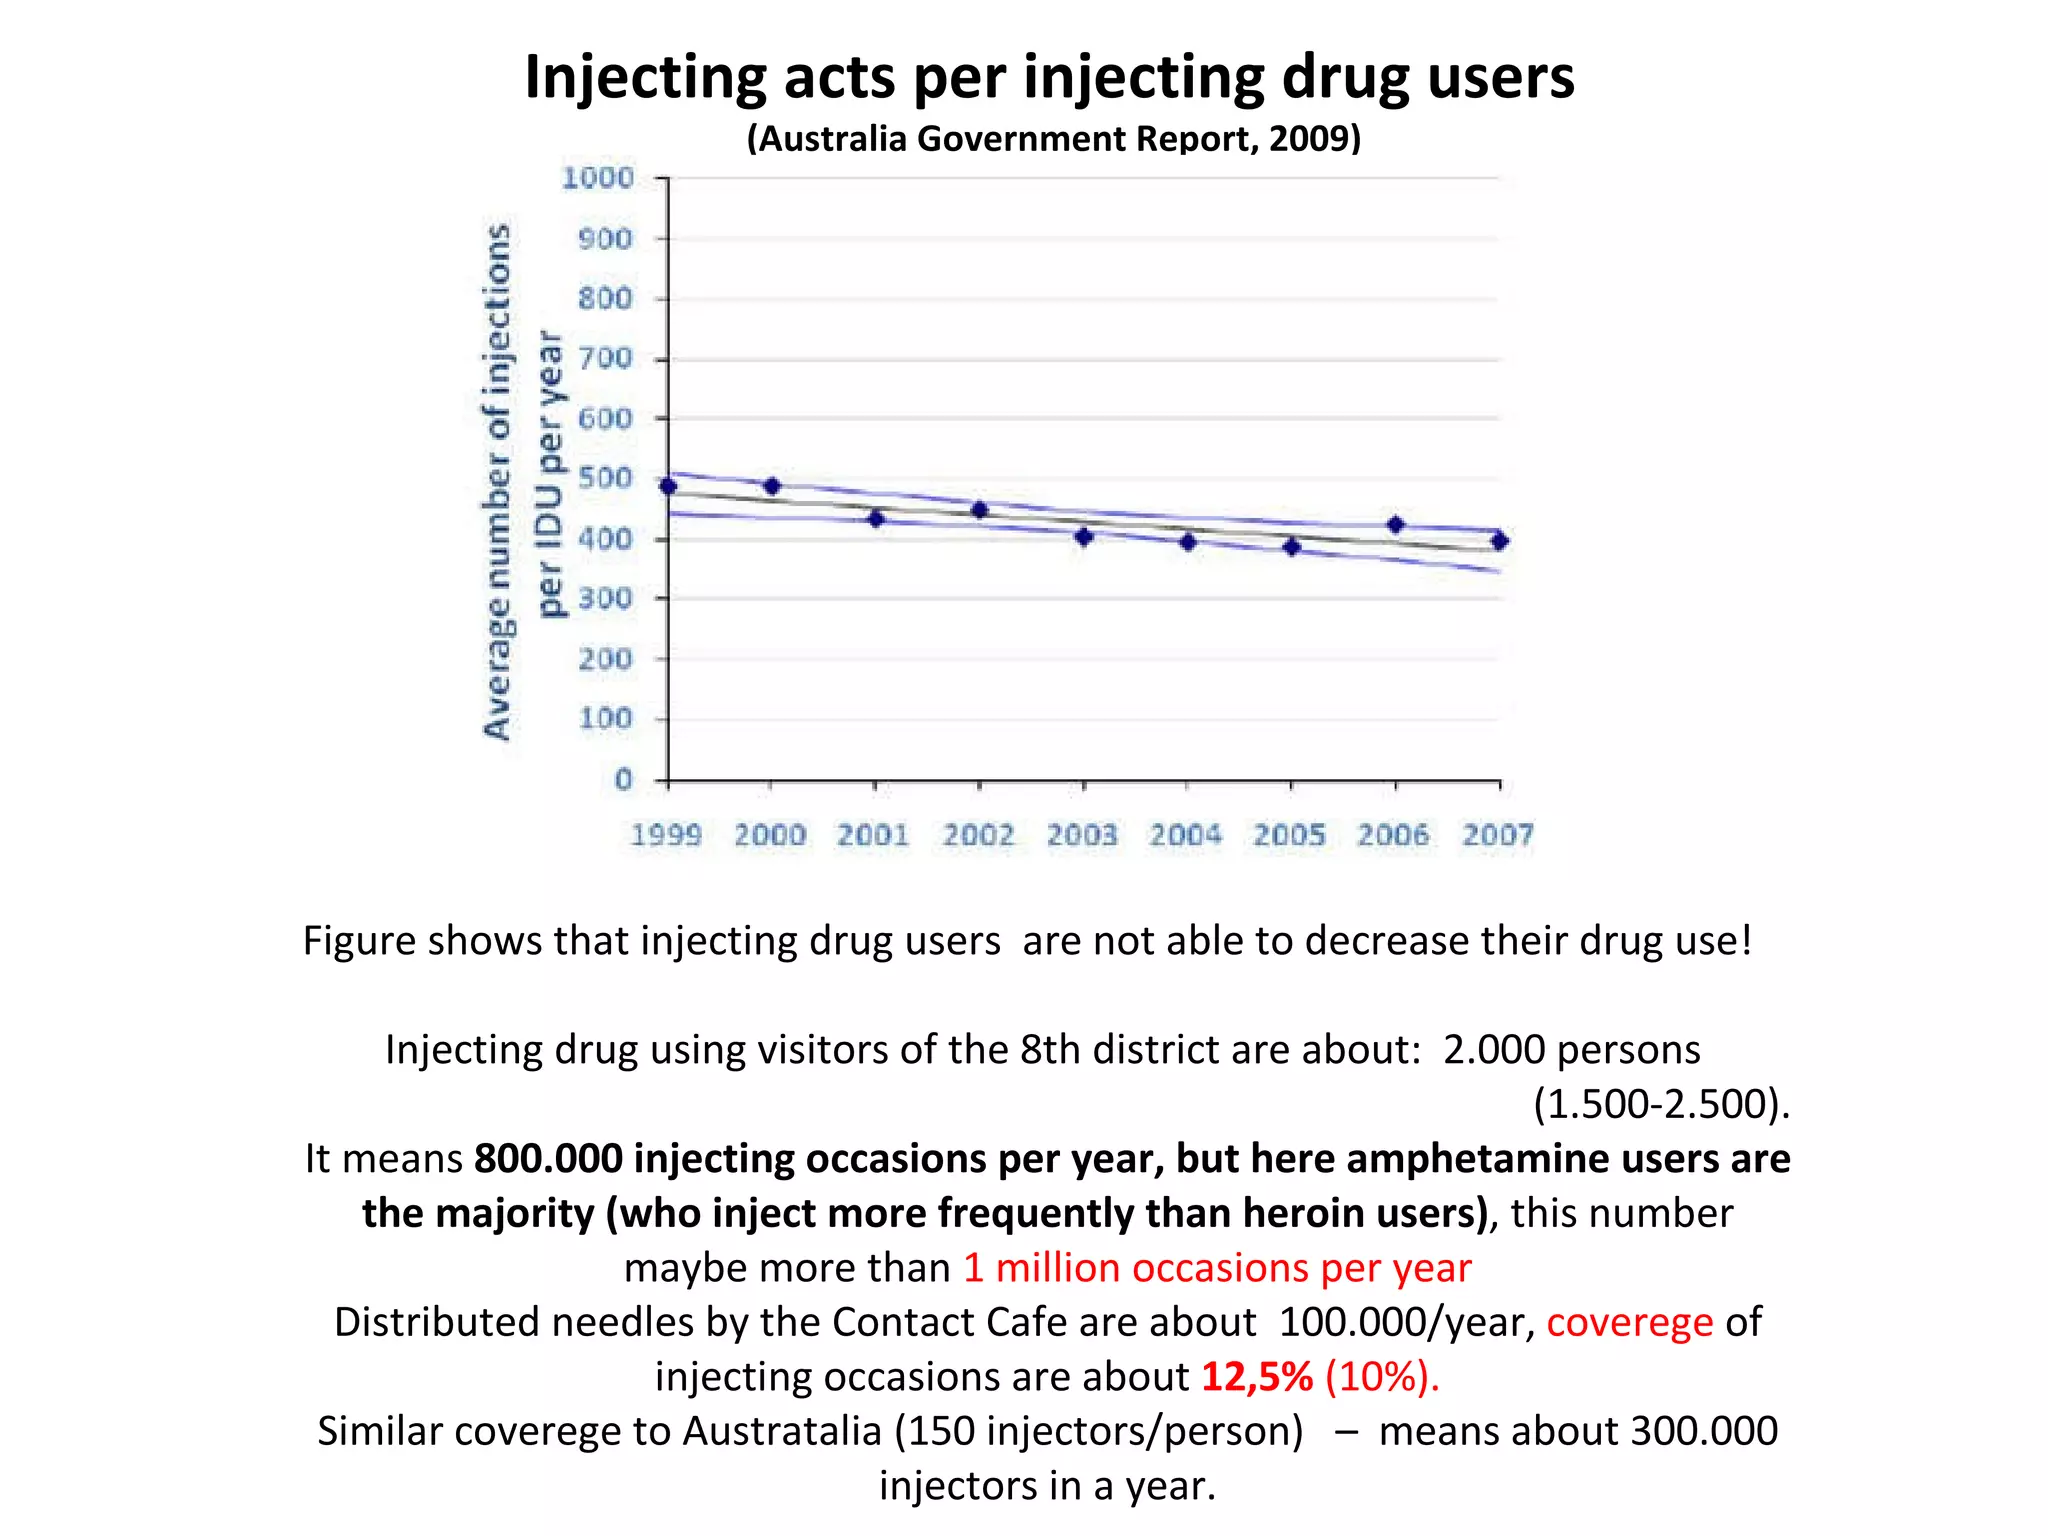
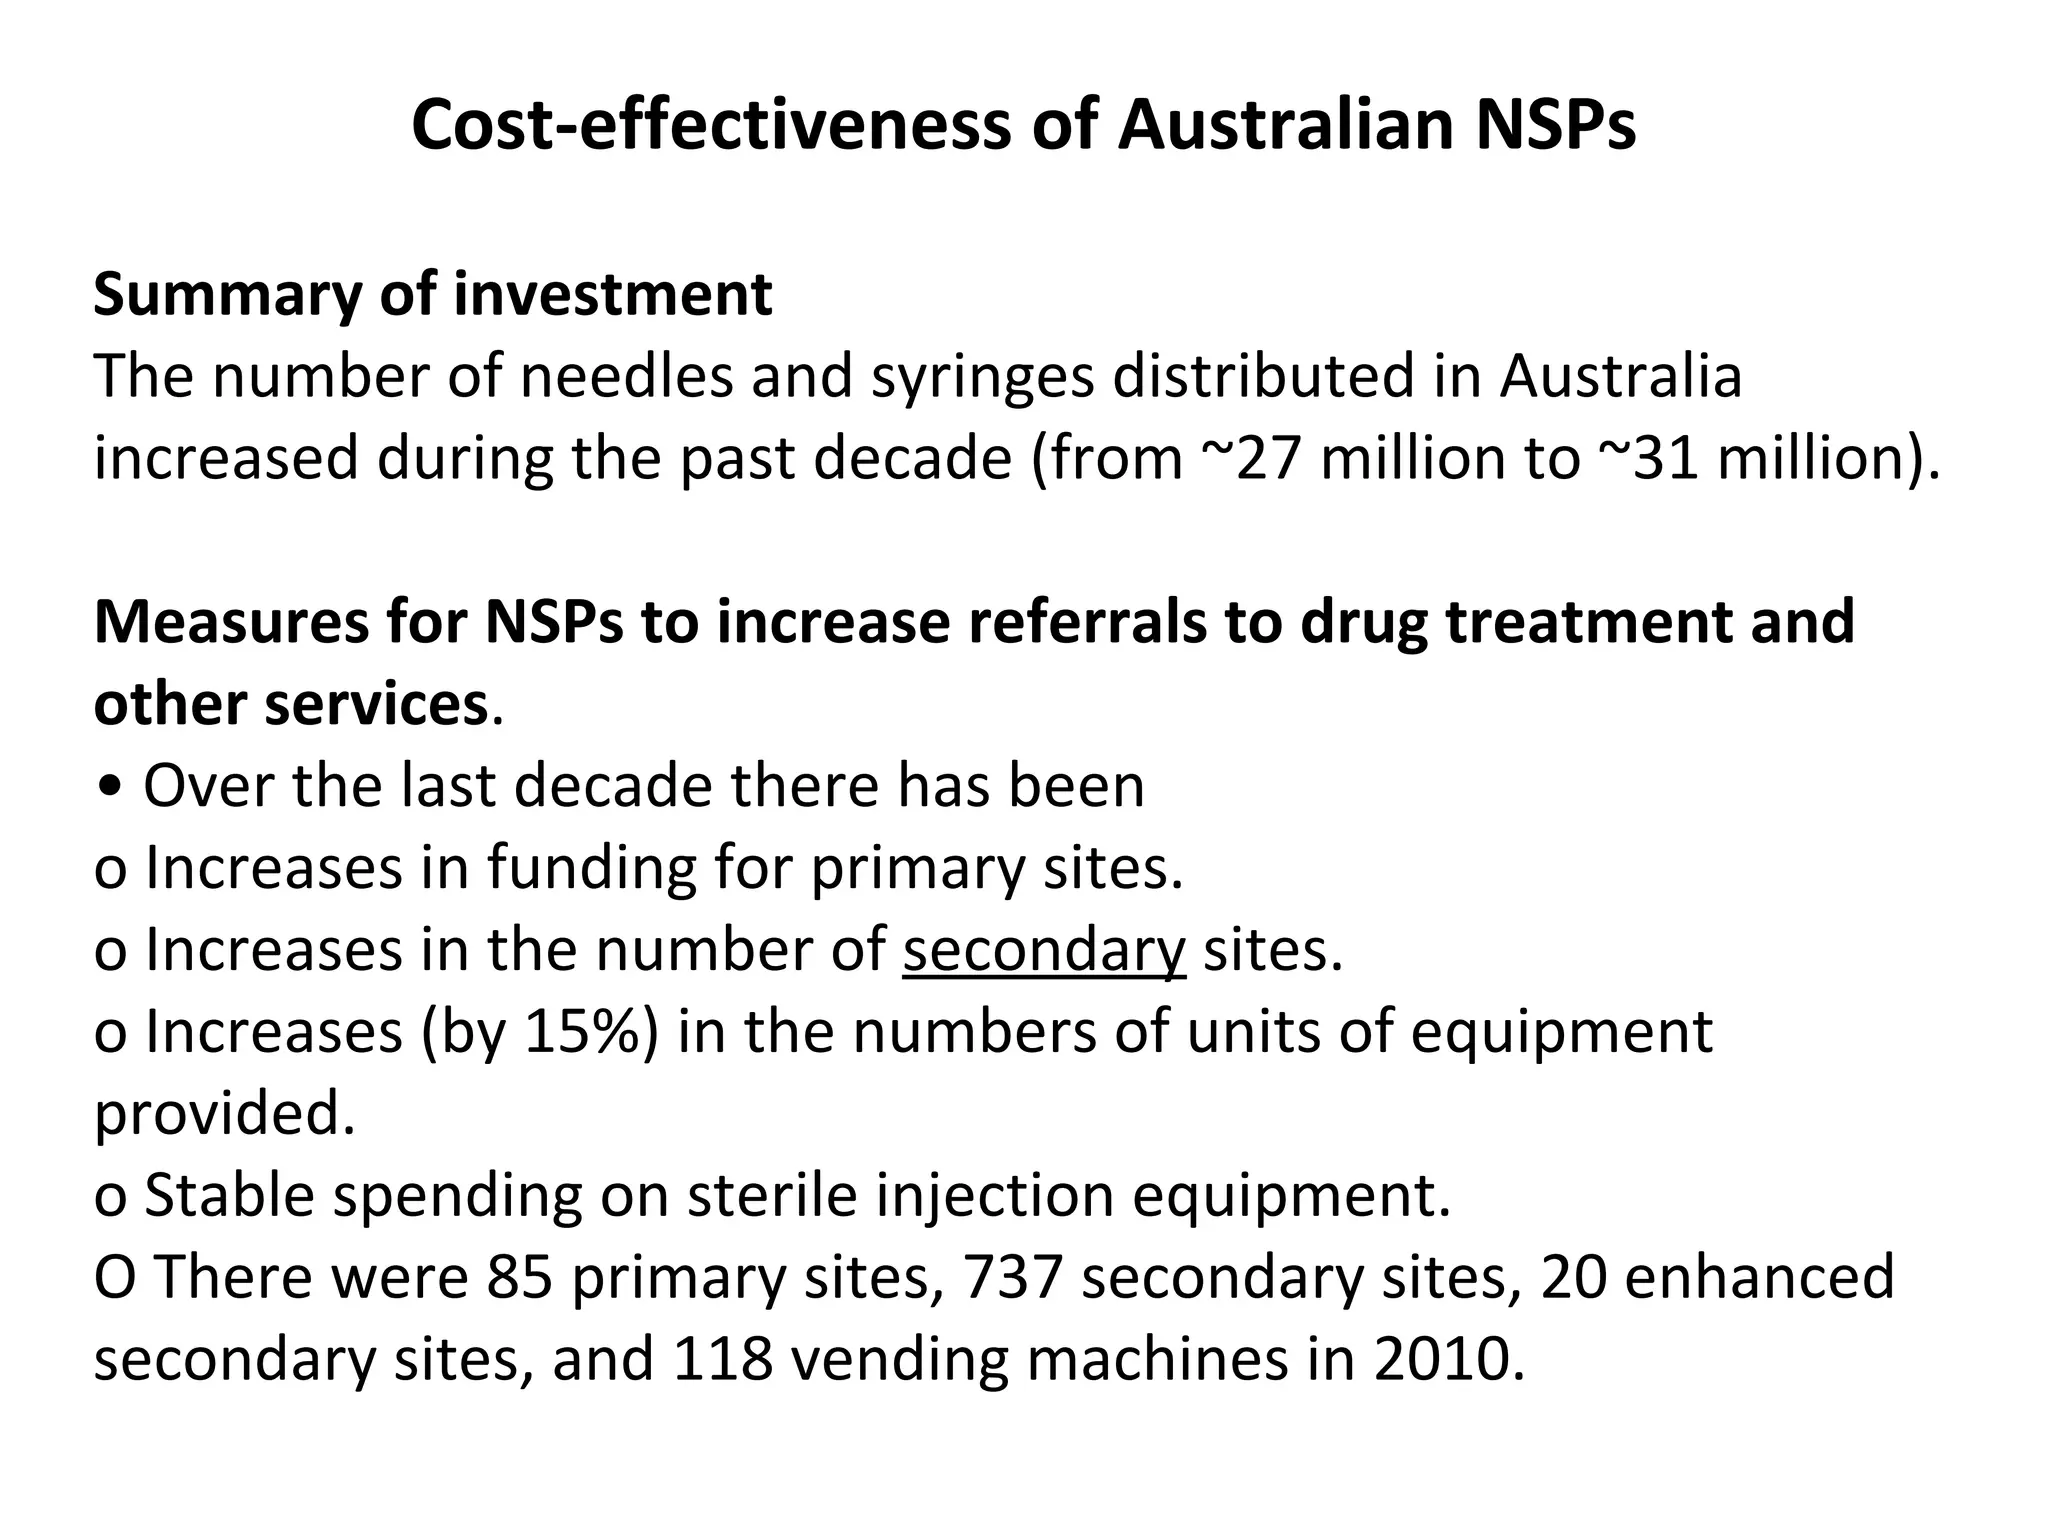
The document discusses the challenges and strategies related to public injecting drug use and harm reduction services in the 8th district of Budapest, highlighting increased risks for diseases such as HIV and HCV due to social issues. It emphasizes the need for outreach and low-threshold services to tackle public health concerns among injecting drug users and the complexities of police interventions that can impact harm reduction efforts. Furthermore, it provides data on needle exchange programs and the demographics of drug users in the area, indicating a high prevalence of addiction and socioeconomic difficulties.


![PresentationForUpload[1]](https://cdn.slidesharecdn.com/ss_thumbnails/83a12a90-3e10-4bb1-9bfe-7881fc7b103b-150422001059-conversion-gate02-thumbnail.jpg?width=640&height=640&fit=bounds)


![PreventionWorks![2008]](https://cdn.slidesharecdn.com/ss_thumbnails/ae6d23ec-e1ab-4afb-a545-1940a43dbbe5-150422001432-conversion-gate02-thumbnail.jpg?width=640&height=640&fit=bounds)
![Prevention_Works!2007-08[1]](https://cdn.slidesharecdn.com/ss_thumbnails/09aa9475-d545-49fd-b433-b79fa4cfd448-150422001549-conversion-gate01-thumbnail.jpg?width=640&height=640&fit=bounds)


