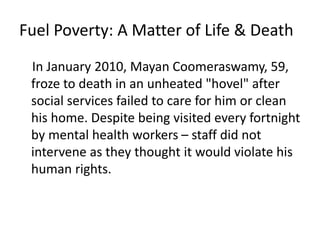
1) In 2003, an elderly British couple died after their gas was disconnected due to non-payment. The gas company did not inform social services of the vulnerable couple's situation.
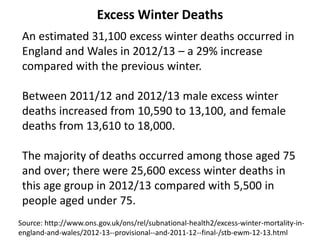
2) An estimated 31,100 excess winter deaths occurred in England and Wales in 2012/13, a 29% increase from the previous winter. The majority of deaths were among those aged 75 and over.
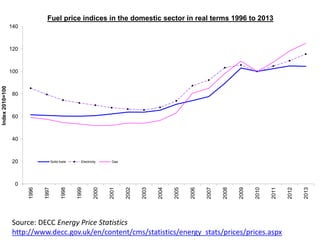
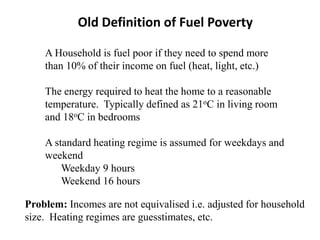
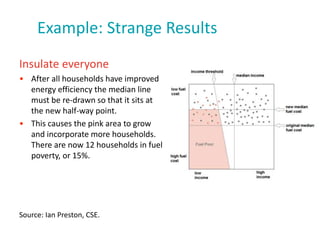
3) Fuel poverty is defined as needing to spend over 10% of income on fuel for an adequate level of warmth in the home. High fuel prices and low incomes contribute to rising levels of fuel poverty in the UK.