Protein Microarray For Disease Analysis Methods And Protocols 1st Edition Tanya Knickerbocker
Protein Microarray For Disease Analysis Methods And Protocols 1st Edition Tanya Knickerbocker
Protein Microarray For Disease Analysis Methods And Protocols 1st Edition Tanya Knickerbocker


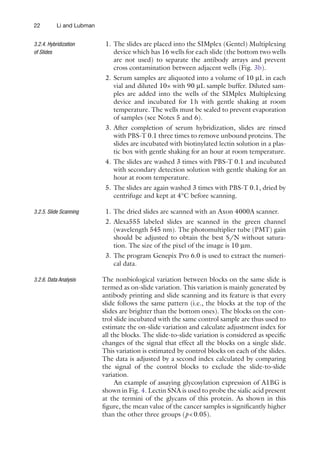
![7
Detecting and Quantifying Multiple Proteins
Cytokines acting on the same cell often exhibit
synergistic or
antagonistic effects (16), but IL-12, Ang, and VCAM-1 are, to a
first approximation, independent. We also found in this study that
molecular markers are not uniformly prognostic, but instead vary
in their value depending on a combination of clinical variables
(age, diastolic blood pressure, serum albumin, and method of vas-
cular access) (9). This may explain why previous reports aiming to
Outcome
Ang
EGF
Fet-A
ICAM
IL-12
IL-1α
IL-8
MIP-1β
RANTES
TNF-β
TNFR2
TNFR1
VCAM-1
VEGF
d
a
c
b
1.0
1.5
2.0
2.5
3.0
3.5
4.0
4.5
0.5 1.0 1.5 2.0 2.5 3.0 3.5 4.0
Ang
EGF
Fet-A
ICAM
IL-12
IL-1α
IL-8
MIP-1β
RANTES
TNFβ
TNFR2
TNFR1
VCAM-1
VEGF
Log
10
{
fluorescence
}
Log10 { [cytokine] (pg/mL) }
200 500 1000 2000
−4
−2
0
2
[Ang] (pg/ml)
log-odds
of
death
100 1000 10000
−2
0
2
[VCAM-1] (pg/ml)
log-odds
of
death
1 10 50
−2
−1
0
1
[IL-12] (pg/ml)
log-odds
of
death
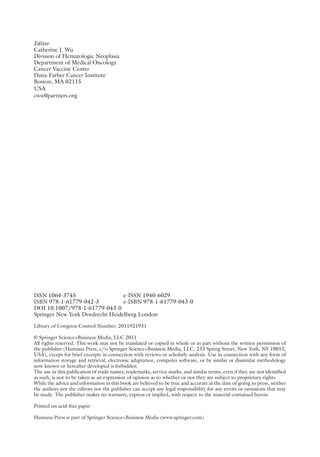
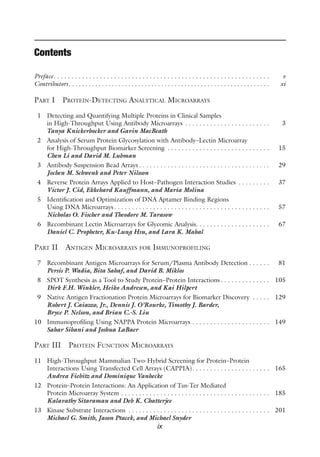
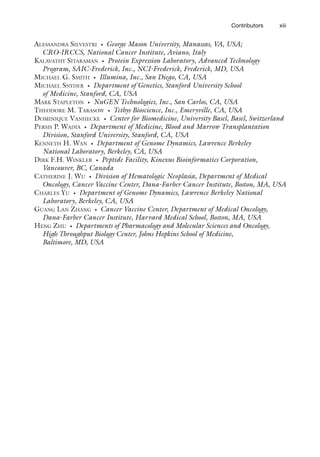
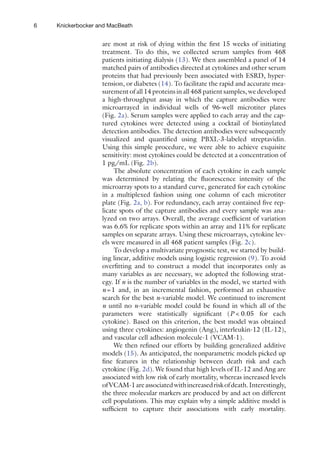
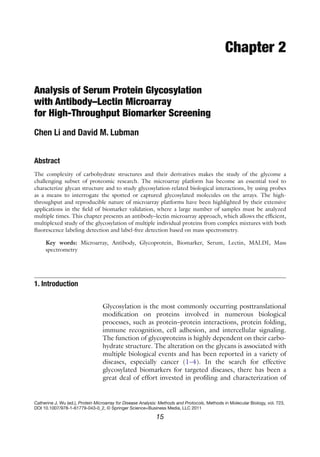
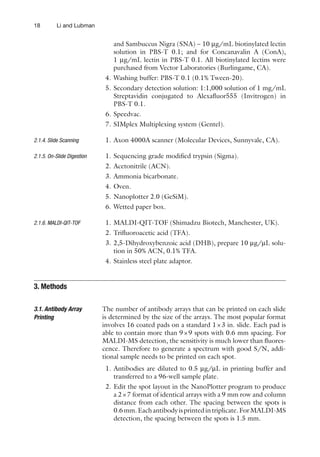
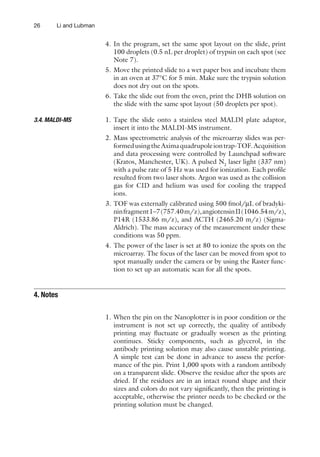
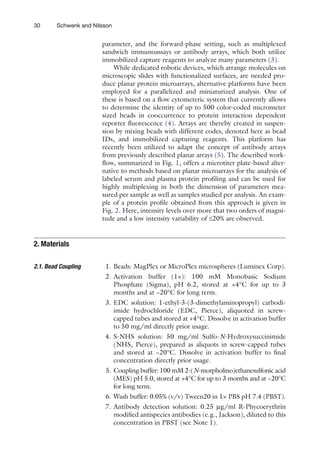
Fig. 2. Serum cytokine levels measured using antibody microarrays. (a) 14 anticytokine capture antibodies were spotted
in quintuplicate in each well of a 96-well microtiter plate. Serum samples were applied to each well in columns 1–11 and
twofold serial dilutions of a mixture of the 14 cognate cytokines were applied to the wells in column 12. (b) Standard
curves generated from the purified cytokines in column 12 of the microtiter plate. (c) Serum cytokine levels of 468
patients initiating hemodialysis. For visualization only, each cytokine was normalized relative to its mean over all the
samples and the patients were ordered according to the first principle component of the cytokine profiles. The outcome
of each patient is shown at the top (red died with 15 weeks of initiating dialysis; black survived more than 15 weeks).
(d) Model built using the cytokine levels that represent the best three-variable model.The solid red lines are the mean of
100 bootstrap samples and the dashed black lines show the variance.](https://image.slidesharecdn.com/1054127-250526164042-b625bca5/85/Protein-Microarray-For-Disease-Analysis-Methods-And-Protocols-1st-Edition-Tanya-Knickerbocker-26-320.jpg)


![32 Schwenk and Nilsson
2. Stop solution (4×): 4% paraformaldehyde (PFA) solution, to
store at +4°C. Dilute 1:4 in PBS prior to usage.
3. Detection solution: R-Phycoerythrin modified streptavidin
(Invitrogen) diluted to 0.5 mg/ml in PBST directly before
use and protected from light.
In the following, a method for antibody coupling is described, for
which magnetic and nonmagnetic beads can be utilized. The
main difference between these two bead types is the handling of
the beads during an exchange of surrounding liquid solution. For
coupling quantities not exceeding the amount of positions found
in bench top microcentrifuges, we suggest using microcentrifuge
tubes or tubes with filter inserts to pellet the beads via centrifuga-
tion, while magnetic beads can additionally be manipulated by
magnetic forces without centrifugation. For more than 24 cou-
plings in parallel, microtiter plate based protocols are preferred.
Hereby, proteins can be immobilized on nonmagnetic beads in
filter bottomed microtiter plates (Millipore) with a filter pore
sizes below bead diameter and vacuum devices (Millipore) accom-
modate these plates to remove liquid. For magnetic bead cou-
pling in plates, dedicated plate magnets are available (LifeSept,
Dexter Magnetic Technologies) to facilitate bead sedimentation
and fixation.
1. Prepare antibodies at the desired concentration (e.g., 3 mg or
a solution with antibody concentration of 30 mg/ml per
1×10⁶
beads) in coupling buffer (see Note 2).
3.
Methods
3.1.
Bead Coupling
1
10
100
1000
10000
MFI
[AU]
Antibodies
A
b
-
6
5
A
b
-
6
0
A
b
-
5
5
A
b
-
5
0
A
b
-
4
5
A
b
-
4
0
A
b
-
3
5
A
b
-
3
0
A
b
-
2
5
A
b
-
2
0
A
b
-
1
5
A
b
-
1
0
A
b
-
0
5
A
b
-
0
1
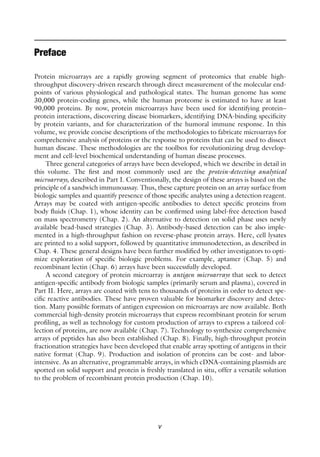
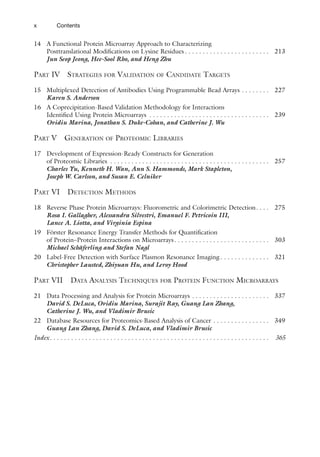
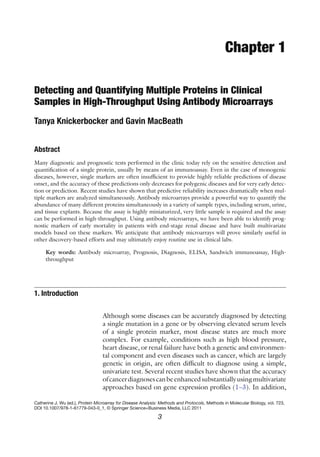
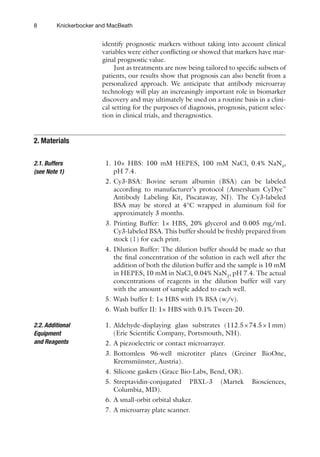
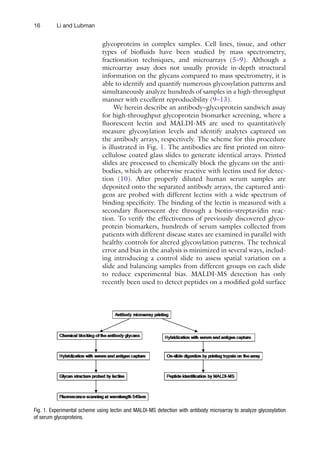
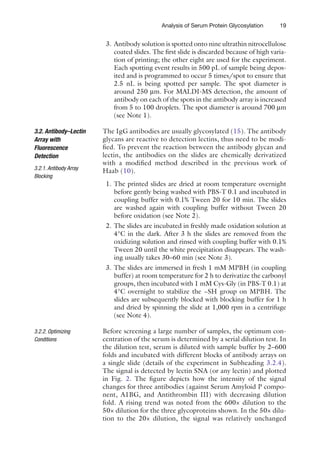
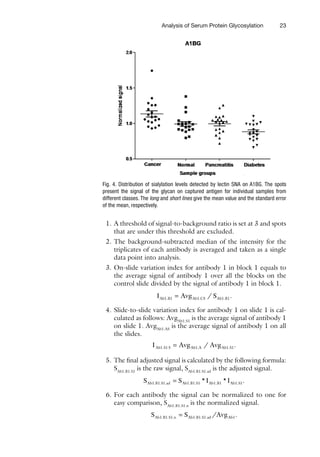
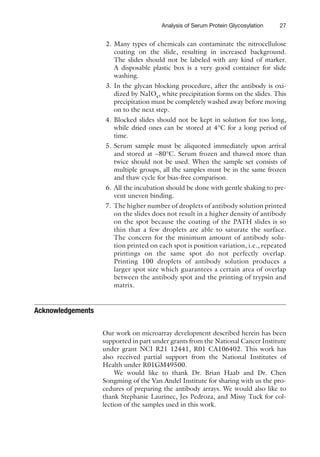
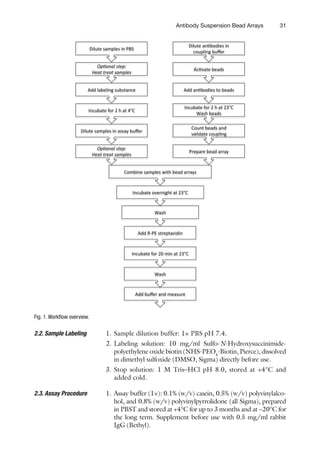
Fig. 2. Intensity profile of a plasma sample. A bead mixture composed of 68 antibodies was employed to determine
intensity levels for the targeted proteins in a plasma sample. Such profiles typically cover intensity range over more than
two orders of magnitude (50–20,000 AU). Standard deviations of £20% can be commonly obtained from replicates.](https://image.slidesharecdn.com/1054127-250526164042-b625bca5/85/Protein-Microarray-For-Disease-Analysis-Methods-And-Protocols-1st-Edition-Tanya-Knickerbocker-51-320.jpg)


![This ebook is for the use of anyone anywhere in the United
States and most other parts of the world at no cost and with
almost no restrictions whatsoever. You may copy it, give it away
or re-use it under the terms of the Project Gutenberg License
included with this ebook or online at www.gutenberg.org. If you
are not located in the United States, you will have to check the
laws of the country where you are located before using this
eBook.
Title: In the Days of Giants: A Book of Norse Tales
Author: Abbie Farwell Brown
Illustrator: E. Boyd Smith
Release date: January 8, 2014 [eBook #44622]
Most recently updated: October 23, 2024
Language: English
Credits: Produced by David Edwards, Charlie Howard, and the
Online
Distributed Proofreading Team at http://www.pgdp.net
(This
file was produced from images generously made
available
by The Internet Archive)
*** START OF THE PROJECT GUTENBERG EBOOK IN THE DAYS OF
GIANTS: A BOOK OF NORSE TALES ***](https://image.slidesharecdn.com/1054127-250526164042-b625bca5/85/Protein-Microarray-For-Disease-Analysis-Methods-And-Protocols-1st-Edition-Tanya-Knickerbocker-60-320.jpg)