Property Plant Equipment Examples as per International Accounting Standard 16 ans IND AS 16
•
3 likes•399 views

Property Plant Equipment (PPE) Examples as per International Accounting Standard(IAS) 16 ans IND AS 16

More Related Content
What's hot
What's hot (9)
Similar to Property Plant Equipment Examples as per International Accounting Standard 16 ans IND AS 16
Similar to Property Plant Equipment Examples as per International Accounting Standard 16 ans IND AS 16 (20)
Recently uploaded
Recently uploaded (20)
Property Plant Equipment Examples as per International Accounting Standard 16 ans IND AS 16
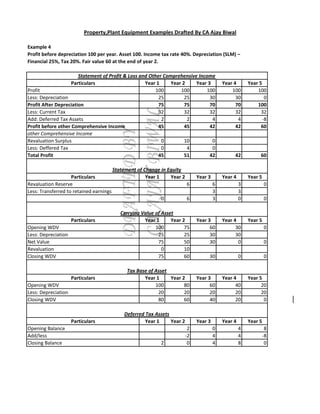
- 1. Example 4 Profit before depreciation 100 per year. Asset 100. Income tax rate 40%. Depreciation (SLM) – Financial 25%, Tax 20%. Fair value 60 at the end of year 2. Particulars Year 1 Year 2 Year 3 Year 4 Year 5 Profit 100 100 100 100 100 Less: Depreciation 25 25 30 30 0 Profit After Depreciation 75 75 70 70 100 Less: Current Tax 32 32 32 32 32 Add: Deferred Tax Assets 2 2 4 4 -8 Profit before other Comprehensive Income 45 45 42 42 60 other Comprehensive Income Revaluation Surplus 0 10 0 Less: Deffered Tax 0 4 0 Total Profit 45 51 42 42 60 Particulars Year 1 Year 2 Year 3 Year 4 Year 5 Revaluation Reserve 6 6 3 0 Less: Transferred to retained earnings 3 3 0 6 3 0 0 Particulars Year 1 Year 2 Year 3 Year 4 Year 5 Opening WDV 100 75 60 30 0 Less: Depreciation 25 25 30 30 Net Value 75 50 30 0 0 Revaluation 0 10 Closing WDV 75 60 30 0 0 Particulars Year 1 Year 2 Year 3 Year 4 Year 5 Opening WDV 100 80 60 40 20 Less: Depreciation 20 20 20 20 20 Closing WDV 80 60 40 20 0 Particulars Year 1 Year 2 Year 3 Year 4 Year 5 Opening Balance 2 0 4 8 Add/less -2 4 4 -8 Closing Balance 2 0 4 8 0 Property,Plant Equipment Examples Drafted By CA Ajay Biwal Statement of Profit & Loss and Other Comprehensive Income Statement of Change in Equity Carrying Value of Asset Tax Base of Asset Deferred Tax Assets
- 2. Example 5 Profit before depreciation 100 per year. Asset 100. Income tax rate 40%. Depreciation (SLM) – Financial 20%, Tax 20%. Fair value 100 at the end of year 1 when life is increased by 1 year. Particulars Year 1 Year 2 Year 3 Year 4 Year 5 Year 6 Profit 100 100 100 100 100 100 Less: Depreciation 20 20 20 20 20 20 Profit After Depreciation 80 80 80 80 80 80 Less: Current Tax 32 32 32 32 32 40 Add: Deferred Tax Assets 0 0 8 Profit before other Comprehensive Income 48 48 48 48 48 48 other Comprehensive Income Revaluation Surplus 20 0 0 Less: Deffered Tax 8 0 0 Total Profit 60 48 48 48 48 48 Particulars Year 1 Year 2 Year 3 Year 4 Year 5 Year 6 Revaluation Reserve 12 12 12 12 12 12 Less: Transferred to retained earnings 0 0 0 0 0 12 12 12 12 12 12 0 Particulars Year 1 Year 2 Year 3 Year 4 Year 5 Year 6 Opening WDV 100 100 80 60 40 20 Less: Depreciation 20 20 20 20 20 20 Net Value 80 80 60 40 20 0 Revaluation 20 Closing WDV 100 80 60 40 20 0 Particulars Year 1 Year 2 Year 3 Year 4 Year 5 Opening WDV 100 80 60 40 20 Less: Depreciation 20 20 20 20 20 Closing WDV 80 60 40 20 0 Particulars Year 1 Year 2 Year 3 Year 4 Year 5 Year 6 Opening Balance -8 -8 -8 -8 -8 Add/less 0 0 0 0 8 Closing Balance -8 -8 -8 -8 -8 0 Property,Plant Equipment Examples Drafted By CA Ajay Biwal Statement of Profit & Loss and Other Comprehensive Income Statement of Change in Equity Carrying Value of Asset Tax Base of Asset Deferred Tax Liability
- 3. Example 6 Profit before depreciation 100 per year. Asset 100. Income tax rate 40%. Depreciation (SLM) – Financial 20%, Tax 25%. Fair value 100 at the end of year 1 when life is increased by 1 year. Particulars Year 1 Year 2 Year 3 Year 4 Year 5 Year 6 Profit 100 100 100 100 100 100 Less: Depreciation 20 20 20 20 20 20 Profit After Depreciation 80 80 80 80 80 80 Less: Current Tax -30 -30 -30 -30 -40 -40 Add/Less: Deferred Tax Assets/ (Liability) -2 -2 -2 -2 8 8 Tax Expenses -32 -32 -32 -32 -32 -32 Profit before other Comprehensive Income 48 48 48 48 48 48 other Comprehensive Income Revaluation Surplus 20 0 0 Add/Less: Deferred Tax Assets/ (Liability) -8 0 0 Net Revaluation Surplus 12 0 0 0 0 0 Total Profit 60 48 48 48 48 48 Particulars Year 1 Year 2 Year 3 Year 4 Year 5 Year 6 Revaluation Reserve 12 12 12 12 12 12 Less: Transferred to retained earnings 0 0 0 0 0 12 12 12 12 12 12 0 Particulars Year 1 Year 2 Year 3 Year 4 Year 5 Year 6 Opening WDV 100 100 80 60 40 20 Less: Depreciation 20 20 20 20 20 20 Net Value 80 80 60 40 20 0 Revaluation 20 Closing WDV 100 80 60 40 20 0 Particulars Year 1 Year 2 Year 3 Year 4 Year 5 Opening WDV 100 75 50 25 0 Less: Depreciation 25 25 25 25 0 Closing WDV 75 50 25 0 0 Particulars Year 1 Year 2 Year 3 Year 4 Year 5 Year 6 Opening Balance -10 -12 -14 -16 -8 Add/less -2 -2 -2 8 8 Closing Balance -10 -12 -14 -16 -8 0 Property,Plant Equipment Examples Drafted By CA Ajay Biwal Statement of Profit & Loss and Other Comprehensive Income Statement of Change in Equity Carrying Value of Asset Tax Base of Asset Deferred Tax Liability
- 4. Example 7 Profit before depreciation 100 per year. Asset 100. Income tax rate 40%. Depreciation (SLM) – Financial 20%, Tax 25%. Fair value – 100 at the end of year 1; and 60 at the end of year 3. Particulars Year 1 Year 2 Year 3 Year 4 Year 5 Profit 100 100 100 100 100 Less: Depreciation 20 25 25 30 30 Profit After Depreciation 80 75 75 70 70 Less: Current Tax -30 -30 -30 -30 -40 Add/Less: Deferred Tax Assets/ (Liability) -2 0 0 2 12 Tax Expenses -32 -30 -30 -28 -28 Profit before other Comprehensive Income 48 45 45 42 42 other Comprehensive Income Revaluation Surplus 20 0 10 0 0 Add/Less: Deferred Tax Assets/ (Liability) -8 0 -4 0 0 Net Revaluation Surplus 12 0 6 0 0 Total Profit 60 45 51 42 42 Particulars Year 1 Year 2 Year 3 Year 4 Year 5 Revaluation Reserve: Opening Balance 0 12 9 12 6 Add: Creation 12 0 6 0 0 Less: Transferred to retained earnings 0 3 3 6 6 Revaluation Reserve: Closing Balance 12 9 12 6 0 Particulars Year 1 Year 2 Year 3 Year 4 Year 5 Opening WDV 100 100 75 60 30 Less: Depreciation 20 25 25 30 30 Net Value 80 75 50 30 0 Revaluation 20 10 Closing WDV 100 75 60 30 0 Particulars Year 1 Year 2 Year 3 Year 4 Year 5 Opening WDV 100 75 50 25 0 Less: Depreciation 25 25 25 25 0 Closing WDV 75 50 25 0 0 Particulars Year 1 Year 2 Year 3 Year 4 Year 5 Opening Balance -10 -10 -14 -12 Add/less -10 0 -4 2 12 Closing Balance -10 -10 -14 -12 0 - Through Carrying Value -2 -10 -10 -12 0 - Through Revaluation -8 0 -4 0 0 - - - - - Property,Plant Equipment Examples Drafted By CA Ajay Biwal Statement of Profit & Loss and Other Comprehensive Income Statement of Change in Equity Carrying Value of Asset Tax Base of Asset Deferred Tax Liability
- 5. Example 8 Profit before depreciation 100 per year. Asset 100. Income tax rate 40%. Depreciation – Financial – 20%, Tax 25%. Fair value 120 at the end of year 1. Life increased by 1 year at the end of year 3. Particulars Year 1 Year 2 Year 3 Year 4 Year 5 Year 6 Profit 100 100 100 100 100 100 Less: Depreciation 20 30 30 20 20 20 Profit After Depreciation 80 70 70 80 80 80 Less: Current Tax -30 -30 -30 -30 -40 -40 Add/Less: Deferred Tax Assets/ (Liability) -2 2 2 -2 8 8 Tax Expenses -32 -28 -28 -32 -32 -32 Profit before other Comprehensive Income 48 42 42 48 48 48 other Comprehensive Income Revaluation Surplus 40 0 0 0 0 0 Add/Less: Deferred Tax Assets/ (Liability) -16 0 0 0 0 0 Net Revaluation Surplus 24 0 0 0 0 0 Total Profit 72 42 42 48 48 48 Particulars Year 1 Year 2 Year 3 Year 4 Year 5 Year 6 Revaluation Reserve: Opening Balance 0 24 18 12 12 12 Add: Creation 24 0 0 0 0 0 Less: Transferred to retained earnings 0 6 6 0 0 12 Revaluation Reserve: Closing Balance 24 18 12 12 12 0 Particulars Year 1 Year 2 Year 3 Year 4 Year 5 Year 6 Opening WDV 100 120 90 60 40 20 Less: Depreciation 20 30 30 20 20 20 Net Value 80 90 60 40 20 0 Revaluation 40 0 Closing WDV 120 90 60 40 20 0 Particulars Year 1 Year 2 Year 3 Year 4 Year 5 Opening WDV 100 75 50 25 0 Less: Depreciation 25 25 25 25 0 Closing WDV 75 50 25 0 0 Particulars Year 1 Year 2 Year 3 Year 4 Year 5 Year 6 Opening Balance -18 -16 -14 -16 -8 Add/less -18 2 2 -2 8 8 Closing Balance -18 -16 -14 -16 -8 0 - Through Carrying Value -2 -16 -14 -16 -8 0 - Through Revaluation -16 0 0 0 0 0 Property,Plant Equipment Examples Drafted By CA Ajay Biwal Statement of Profit & Loss and Other Comprehensive Income Statement of Changes in Equity Carrying Value of Asset Tax Base of Asset Deferred Tax Liability
- 6. Example 9 Profit before depreciation 100 per year. Asset 100. Income tax rate 40%. Depreciation (SLM) – Financial 20%, Tax 25%. Fair value – 100 at the end of year 1; and 40 at the end of year 3. Particulars Year 1 Year 2 Year 3 Year 4 Year 5 Profit 100 100 100 100 100 Less: Depreciation 20 25 25 20 20 Profit After Depreciation 80 75 75 80 80 Less: Current Tax -30 -30 -30 -30 -40 Add/Less: Deferred Tax Assets/ (Liability) -2 0 0 -2 8 Tax Expenses -32 -30 -30 -32 -32 Profit before other Comprehensive Income 48 45 45 48 48 other Comprehensive Income Revaluation Surplus 20 0 -10 0 0 Add/Less: Deferred Tax Assets/ (Liability) -8 0 4 0 0 Net Revaluation Surplus 12 0 -6 0 0 Total Profit 60 45 39 48 48 Particulars Year 1 Year 2 Year 3 Year 4 Year 5 Revaluation Reserve: Opening Balance 0 12 9 0 0 Add: Creation 12 0 -6 0 0 Less: Transferred to retained earnings 0 3 3 0 0 Revaluation Reserve: Closing Balance 12 9 0 0 0 Particulars Year 1 Year 2 Year 3 Year 4 Year 5 Opening WDV 100 100 75 40 20 Less: Depreciation 20 25 25 20 20 Net Value 80 75 50 20 0 Revaluation 20 -10 Closing WDV 100 75 40 20 0 Particulars Year 1 Year 2 Year 3 Year 4 Year 5 Opening WDV 100 75 50 25 0 Less: Depreciation 25 25 25 25 0 Closing WDV 75 50 25 0 0 Particulars Year 1 Year 2 Year 3 Year 4 Year 5 Opening Balance -10 -10 -6 -8 Add/less -10 0 4 -2 8 Closing Balance -10 -10 -6 -8 0 - Through Carrying Value -2 -10 -10 -8 0 - Through Revaluation -8 0 4 0 0 - - - - - Property,Plant Equipment Examples Drafted By CA Ajay Biwal Statement of Profit & Loss and Other Comprehensive Income Statement of Changes in Equity Carrying Value of Asset Tax Base of Asset Deferred Tax Liability
- 7. Example 10 Profit before depreciation 100 per year. Asset 100. Income tax rate 40%. Depreciation (SLM) – Financial 20%, Tax 20%. Fair value – 100 at the end of year 1; and 40 at the end of year 3. Particulars Year 1 Year 2 Year 3 Year 4 Year 5 Profit 100 100 100 100 100 Less: Depreciation 20 25 25 20 20 Profit After Depreciation 80 75 75 80 80 Less: Current Tax -32 -32 -32 -32 -32 Add/Less: Deferred Tax Assets/ (Liability) 0 2 2 0 0 Tax Expenses -32 -30 -30 -32 -32 Profit before other Comprehensive Income 48 45 45 48 48 other Comprehensive Income Revaluation Surplus 20 0 -10 0 0 Add/Less: Deferred Tax Assets/ (Liability) -8 0 4 0 0 Net Revaluation Surplus 12 0 -6 0 0 Total Profit 60 45 39 48 48 Particulars Year 1 Year 2 Year 3 Year 4 Year 5 Revaluation Reserve: Opening Balance 0 12 9 0 0 Add: Creation 12 0 -6 0 0 Less: Transferred to retained earnings 0 3 3 0 0 Revaluation Reserve: Closing Balance 12 9 0 0 0 Particulars Year 1 Year 2 Year 3 Year 4 Year 5 Opening WDV 100 100 75 40 20 Less: Depreciation 20 25 25 20 20 Net Value 80 75 50 20 0 Revaluation 20 -10 Closing WDV 100 75 40 20 0 Particulars Year 1 Year 2 Year 3 Year 4 Year 5 Opening WDV 100 80 60 40 20 Less: Depreciation 20 20 20 20 20 Closing WDV 80 60 40 20 0 Particulars Year 1 Year 2 Year 3 Year 4 Year 5 Opening Balance -8 -6 0 0 Add/less -8 2 6 0 0 Closing Balance -8 -6 0 0 0 - Through Carrying Value 0 -6 -4 0 0 - Through Revaluation -8 0 4 0 0 - - - - - Property,Plant Equipment Examples Drafted By CA Ajay Biwal Statement of Profit & Loss and Other Comprehensive Income Statement of Changes in Equity Carrying Value of Asset Tax Base of Asset Deferred Tax Liability
- 8. Example 11 Profit before deprecation 100 per year. Asset 100. Income tax rate 40%. Depreciation (SLM) – Financial 25%, Tax 20%. Fair value – 90 at the end of year 1; and 20 at the end of year 3. Particulars Year 1 Year 2 Year 3 Year 4 Year 5 Profit 100 100 100 100 100 Less: Depreciation 25 30 30 20 0 Profit After Depreciation 75 70 70 80 100 Less: Current Tax -32 -32 -32 -32 -32 Add/Less: Deferred Tax Assets/ (Liability) 2 4 4 0 -8 Tax Expenses -30 -28 -28 -32 -40 Profit before other Comprehensive Income 45 42 42 48 60 other Comprehensive Income Revaluation Surplus 15 0 -10 0 0 Add/Less: Deferred Tax Assets/ (Liability) -6 0 4 0 0 Net Revaluation Surplus 9 0 -6 0 0 Total Profit 54 42 36 48 60 Particulars Year 1 Year 2 Year 3 Year 4 Year 5 Revaluation Reserve: Opening Balance 0 9 6 0 0 Add: Creation 9 0 -6 0 0 Less: Transferred to retained earnings 0 3 0 0 0 Revaluation Reserve: Closing Balance 9 6 0 0 0 Particulars Year 1 Year 2 Year 3 Year 4 Year 5 Opening WDV 100 90 60 20 0 Less: Depreciation 25 30 30 20 0 Net Value 75 60 30 0 0 Revaluation 15 -10 Closing WDV 90 60 20 0 0 Particulars Year 1 Year 2 Year 3 Year 4 Year 5 Opening WDV 100 80 60 40 20 Less: Depreciation 20 20 20 20 20 Closing WDV 80 60 40 20 0 Particulars Year 1 Year 2 Year 3 Year 4 Year 5 Opening Balance -4 0 8 8 Add/less -4 4 8 0 -8 Closing Balance -4 0 8 8 0 - Through Carrying Value 2 0 4 8 0 - Through Revaluation -6 0 4 0 0 Property,Plant Equipment Examples Drafted By CA Ajay Biwal Statement of Profit & Loss and Other Comprehensive Income Statement of Changes in Equity Carrying Value of Asset Tax Base of Asset Deferred Tax Liability
- 9. Example 12 Profit before depreciation 100 per year. Asset 100. Income tax rate 40%. Depreciation (SLM) – Financial 25%, Tax 20%. Fair value – 90 at the end of year 1; 20 at the end of year 3 when life is increased by 1 year. Particulars Year 1 Year 2 Year 3 Year 4 Year 5 Profit 100 100 100 100 100 Less: Depreciation 25 30 30 10 10 Profit After Depreciation 75 70 70 90 90 Less: Current Tax -32 -32 -32 -32 -32 Add/Less: Deferred Tax Assets/ (Liability) 2 4 4 -4 -4 Tax Expenses -30 -28 -28 -36 -36 Profit before other Comprehensive Income 45 42 42 54 54 other Comprehensive Income Revaluation Surplus 15 0 -10 0 0 Add/Less: Deferred Tax Assets/ (Liability) -6 0 4 0 0 Net Revaluation Surplus 9 0 -6 0 0 Total Profit 54 42 36 54 54 Particulars Year 1 Year 2 Year 3 Year 4 Year 5 Revaluation Reserve: Opening Balance 0 9 6 0 0 Add: Creation 9 0 -6 0 0 Less: Transferred to retained earnings 0 3 0 0 0 Revaluation Reserve: Closing Balance 9 6 0 0 0 Particulars Year 1 Year 2 Year 3 Year 4 Year 5 Opening WDV 100 90 60 20 10 Less: Depreciation 25 30 30 10 10 Net Value 75 60 30 10 0 Revaluation 15 -10 Closing WDV 90 60 20 10 0 Particulars Year 1 Year 2 Year 3 Year 4 Year 5 Opening WDV 100 80 60 40 20 Less: Depreciation 20 20 20 20 20 Closing WDV 80 60 40 20 0 Particulars Year 1 Year 2 Year 3 Year 4 Year 5 Opening Balance -4 0 8 4 Add/less -4 4 8 -4 -4 Closing Balance -4 0 8 4 0 - Through Carrying Value 2 0 4 4 0 - Through Revaluation -6 0 4 0 0 - - - - - Property,Plant Equipment Examples Drafted By CA Ajay Biwal Statement of Profit & Loss and Other Comprehensive Income Statement of Changes in Equity Carrying Value of Asset Tax Base of Asset Deferred Tax Liability