Download as PDF, PPTX
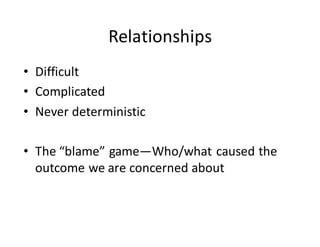
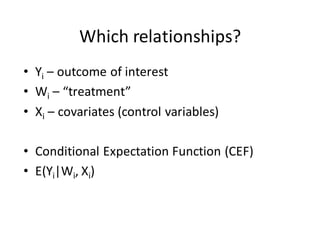
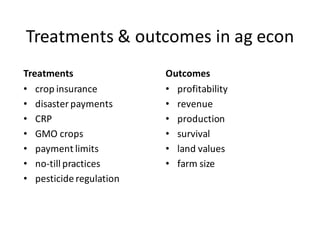
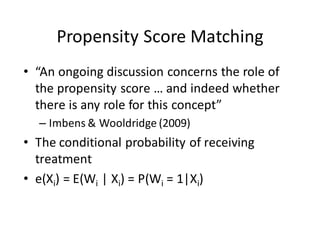
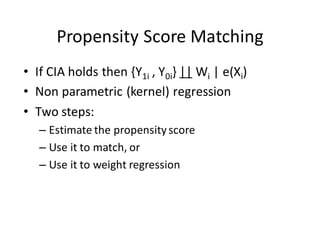
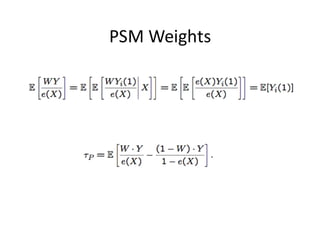

The document discusses the complexities of relationships in agricultural economics, focusing on the 'blame' game surrounding treatment outcomes, such as crop insurance and disaster payments. It emphasizes the importance of understanding causal effects and outlines statistical methods like propensity score matching and regression to assess treatment impacts. The text highlights the challenges of selection bias and the need for well-defined causal models to analyze population average treatment effects.


![[DSC Europe 25] Raul Cruz Bonilla - Harnessing GEN AI in Fashion, Luxury and ...](https://cdn.slidesharecdn.com/ss_thumbnails/me7nvup5thwqzwzblbvw-raul-cruz-harnessing-ai-en-luxury-260123083019-32ac5a43-thumbnail.jpg?width=640&height=640&fit=bounds)