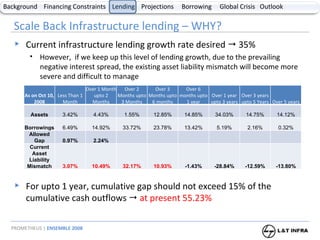
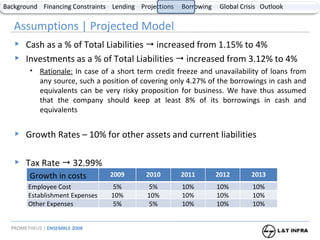
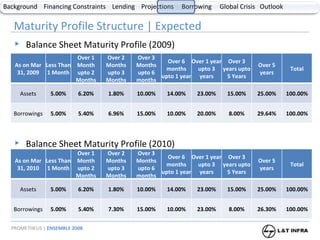
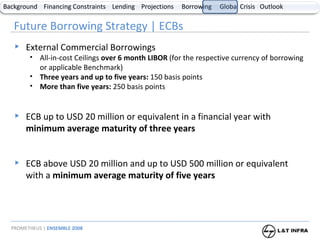
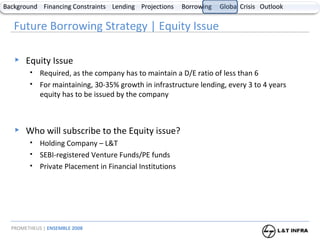
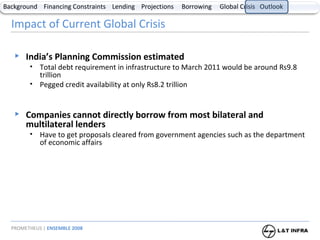
Treasury Management L&T Infrastructure Finance Limited UNNATRIX | MDI Gurgaon Anirban Ray  | pg07anirban_r@mdi.ac.in | 9971995412 Neha Goyal  | pg07neha_g@mdi.ac.in | 9911461348 Saurabh Mundra  | pg07saurabh_m@mdi.ac.in | 9811865818 Sumit Thawrani  | pg07sumit_t@mdi.ac.in |9313455285
Agenda Infrastructure Financing in India | Overview Constraints in Financing Of Infrastructure Treasury Management    Lending Issues and Analysis Financial Projections Treasury Management    Borrowing Issues and Analysis Impact of Current Global Crisis Future Outlook
Infrastructure Financing in India | Overview Largely characterized with inadequate flow of long-term funds Characteristics Tenor of available funds from the domestic market is typically 10 years or less with a 2–3 year re-set clause, effectively making such funding short-term leads to front-loading of tariffs during the initial years of the project cycle absence of long-term fixed rate financing, stability of cash flows are difficult to achieve Domestic Sources External Sources Equity •  Domestic developers (independently or in collaboration with international developers) •  International developers (independently or in collaboration with domestic developers) •  Public utilities (taking minority holdings) •  Equipment suppliers (in collaboration with domestic or international developers) •  Other institutional investors (likely to be limited) •  Dedicated infrastructure funds •  Other international equity investors •  Multilateral agencies Debt   •  Domestic commercial banks (3–5 year tenor) •  International commercial banks (7–10 year tenor) •  Domestic term lending institutions (7–10 year tenor) •  Export credit agencies (7–10 year tenor) •  Domestic bond markets (7–10 year tenor) •  International bond markets (10–30 year tenor) •  Specialized infrastructure financing institutions •  Multilateral agencies (over 20 year tenor) Source: Planning Commission, Government of India
Constraints in Financing Of Infrastructure Constraints on Infrastructure Financing Greatest level of operational, financial and market risk Shallow capital market 30% of the cost of infrastructure projects is financed through equity Equity Financing cumbersome primary issuance guidelines Inadequate credit information Inefficient clearing and settlement mechanisms  Poor and lengthy enforcement laws relating to default proceedings Inefficiencies arising from weaknesses in regulation Corporate Debt Market Higher risk-profile, FIs reluctant to finance infrastructure in early stages Constrains the participation of insurance companies and pension funds Insufficient knowledge and appraisal skills related to infrastructure projects Regulatory and institutional problems Interest rate caps on External Commercial Borrowing (ECBs) Lack of sufficiently large and varied pool of infrastructure projects Mezzanine financing Lack of a sufficiently deep forwards market Inability to hedge long term currency risk in a market Foreign Exchange Market
Issues with Current Treasury Management Strategy Current strategy    Borrow short-term, Lending long term Issues Assets very long term in nature Inverted yield curve is causing a negative interest spread on infrastructure projects
Asset Liability Management System | Guidelines Asset Liability Mismatches Main focus should be on the short-term mismatches viz., 1-30/31 days Mismatches (negative gap) during 1-30/31 days in normal course may not exceed 15% of the cash outflows in this time bucket This as per later amendments has been raised to 20%, in the first two buckets  (from the Statement of Structural Liquidity or the Maturity profile sheet) NBFCs to monitor their short-term liquidity on a dynamic basis over a time horizon spanning from 1 day to 6 months NBFCs may estimate their short-term liquidity profiles on the basis of business projections and other commitments for planning purposes ( as per ALM Annexure-II) (As per company circular DNBS (PD).CC.No.15 /02.01 / 2000-2001 released on June 27, 2001)
Scale Back Infrastructure lending – WHY? Current infrastructure lending growth rate desired    35% However,  if we keep up this level of lending growth, due to the prevailing negative interest spread, the existing asset liability mismatch will become more severe and difficult to manage For upto 1 year, cumulative gap should not exceed 15% of the cumulative cash outflows     at present 55.23% As on Oct 10, 2008 Less Than 1 Month Over 1 Month upto 2 Months Over 2 Months upto 3 Months Over 3 Months upto 6 months Over 6 months upto 1 year Over 1 year upto 3 years Over 3 years upto 5 Years Over 5 years Assets 3.42% 4.43% 1.55% 12.85% 14.85% 34.03% 14.75% 14.12% Borrowings 6.49% 14.92% 33.72% 23.78% 13.42% 5.19% 2.16% 0.32% Allowed Gap 0.97% 2.24% Current Asset Liability Mismatch 3.07% 10.49% 32.17% 10.93% -1.43% -28.84% -12.59% -13.80%
Scale Back Infrastructure lending – HOW MUCH? For year 1    scale down growth in infrastructure lending to 25% Reasons Due to the Credit crisis, we are seeing lower liquidity in the credit markets, which will cause the borrowing costs to increase in the short term The current asset liability mismatch is beyond the stipulated regulations laid down by RBI for NBFCs For year 2    scale down growth in infrastructure lending to 30% Reasons Due to steps taken by RBI to inject liquidity into the markets, we expect the situation to improve in the next fiscal year Interest rates are expected to decline
Assumptions | Projected Model Infrastructure Loan Growth Equity issue to be made if D/E ratio goes beyond 5 Composition of Loan Funds 30% 2010 35% 2011 35% 2012 35% 2013 2009 Infrastructure Loans Growth 25% 25% 75% 2010 25% 75% 2011 25% 75% 2012 2008 2009 2013 Secured Loans 76.19% 75% 75% Unsecured Loans 23.81% 25% 25% 5% 5% 5% 6% 6% Average RoI 10.25% 13% 2010 10% 13% 2011 10% 13% 2012 2009 2013 Average interest on Infrastructure Loans 13% 13% Average Cost of Loan Funds 10.25% 10%
Assumptions | Projected Model Cash as a % of Total Liabilities    increased from 1.15% to 4% Investments as a % of Total Liabilities    increased from 3.12% to 4% Rationale:  In case of a short term credit freeze and unavailability of loans from any source, such a position of covering only 4.27% of the borrowings in cash and equivalents can be very risky proposition for business. We have thus assumed that the company should keep at least 8% of its borrowings in cash and equivalents Growth Rates – 10% for other assets and current liabilities Tax Rate    32.99% 5% 10% 5% 2010 10% 10% 10% 2011 10% 10% 10% 2012 Growth in costs 2009 2013 Employee Cost 5% 10% Establishment Expenses 10% 10% Other Expenses 5% 10%
Key Financial Projections Balance Sheet Figures Income Statement Figures 36% 3.68 0 30% FY 2010 37% 4.41 0 32% FY 2011 39% 5.28 0 35% FY 2012 FY 2009 FY 2013 Growth in size of Balance Sheet 30% 35% Issue of Equity 0 300 mm Debt/Equity  3.05 3.49 Growth in Loan Funds 37% 25% 32% 32% 33% 32% FY 2011 29% 37% 38% 35% FY 2012 46% 5.28 31% 35% FY 2013 16% 35% 36% 28% FY 2010 Growth in Operating and Other Income Growth in Interest Expense Growth in Total Expenses Growth in Net Income
Maturity Profile Structure | Expected Balance Sheet Maturity Profile (2009) Balance Sheet Maturity Profile (2010) As on Mar 31, 2009 Less Than 1 Month Over 1 Month upto 2 Months Over 2 Months upto 3 Months Over 3 Months upto 6 months Over 6 months upto 1 year Over 1 year upto 3 years Over 3 years upto 5 Years Over 5 years Total Assets 5.00% 6.20% 1.80% 10.00% 14.00% 23.00% 15.00% 25.00% 100.00% Borrowings 5.00% 5.40% 6.96% 15.00% 10.00% 20.00% 8.00% 29.64% 100.00% As on Mar 31, 2010 Less Than 1 Month Over 1 Month upto 2 Months Over 2 Months upto 3 Months Over 3 Months upto 6 months Over 6 months upto 1 year Over 1 year upto 3 years Over 3 years upto 5 Years Over 5 years Total Assets 5.00% 6.20% 1.80% 10.00% 14.00% 23.00% 15.00% 25.00% 100.00% Borrowings 5.00% 5.40% 7.30% 15.00% 10.00% 23.00% 8.00% 26.30% 100.00%
Revisions | Sources of Funds Current Structure Proposed Borrowing Structure Equity 28.73% Banks 35.64% Mutual Funds 28.51% DFI and Long Term Non-Convertible Debenture 7.13% Equity 24.71% Banks 33.88% Mutual Funds 26.35% DFI and Long Term Non-Convertible Debenture 15.06%
Future Borrowing Strategy | Debt Issue Issue of Non-Convertible debenture @ 10.5% for 5 years and above  (current rate taken  www.indiabondwatch.com ) The issue has to be rated from 2 Credit Rating agencies Current Short-term Rating by ICRA     A1+  , Care    PR1+ Current Long-Term Rating by ICRA     LAA Who will subscribe to the debt issue? Considering current ratings, L&T Name associated, Rating of AA or above expected     Pension funds and Insurance companies Pension Funds and Insurance companies hold Debt securities till maturity, and are willing to invest in relatively longer term debt issues This will help the company to shift to a longer term borrowing maturity profile
Future Borrowing Strategy | ECBs External Commercial Borrowings All-in-cost Ceilings  over 6 month LIBOR  (for the respective currency of borrowing or applicable Benchmark) Three years and up to five years:  150 basis points More than five years:  250 basis points ECB up to USD 20 million or equivalent in a financial year with  minimum average maturity of three years ECB above USD 20 million and up to USD 500 million or equivalent with a  minimum average maturity of five years
Future Borrowing Strategy | Equity Issue Equity Issue Required, as the company has to maintain a D/E ratio of less than 6 For maintaining, 30-35% growth in infrastructure lending, every 3 to 4 years equity has to be issued by the company Who will subscribe to the Equity issue? Holding Company – L&T SEBI-registered Venture Funds/PE funds Private Placement in Financial Institutions
Impact of Current Global Crisis India’s Planning Commission estimated Total debt requirement in infrastructure to March 2011 would be around Rs9.8 trillion Pegged credit availability at only Rs8.2 trillion Companies cannot directly borrow from most bilateral and multilateral lenders Have to get proposals cleared from government agencies such as the department of economic affairs
Impact of Current Global Crisis Impact of crisis Rising inflation High prices of fuel & raw materials Global Credit Shortage & Exchange Rate Volatility- availability of Forex Funding Limited Rising Interest Rates lesser lending by banks (increase in NPAs) Inadequate credit availability Reliance on institutions such as the World Bank and the Asian Development Bank (ADB) will increase Cushioned against the global crisis to an extent Raise money from their member countries  Supplement them by raising money from bond markets
Outlook Huge need for investment- more than USD 450bn to flow into India’s infrastructure by 2012 Investment in infrastructure drives growth More need for Private Capital- increased Public private partnerships Thriving Business centers offer the greatest potential
The Way Forward Facilitating equity financing Improving exit policies to make it easier for investors to exit Better corporate governance Encouraging the use of mezzanine and takeout financing Removing interest rate caps on ECBs   could encourage foreign investors Developing corporate bond market Encouraging participation by FIs in infrastructure financing Stimulating Public Private Partnerships
Thank you

Prometheus Unnatrix Mdi Gurgaon

  • 1.
    Treasury Management L&TInfrastructure Finance Limited UNNATRIX | MDI Gurgaon Anirban Ray | pg07anirban_r@mdi.ac.in | 9971995412 Neha Goyal | pg07neha_g@mdi.ac.in | 9911461348 Saurabh Mundra | pg07saurabh_m@mdi.ac.in | 9811865818 Sumit Thawrani | pg07sumit_t@mdi.ac.in |9313455285
  • 2.
    Agenda Infrastructure Financingin India | Overview Constraints in Financing Of Infrastructure Treasury Management  Lending Issues and Analysis Financial Projections Treasury Management  Borrowing Issues and Analysis Impact of Current Global Crisis Future Outlook
  • 3.
    Infrastructure Financing inIndia | Overview Largely characterized with inadequate flow of long-term funds Characteristics Tenor of available funds from the domestic market is typically 10 years or less with a 2–3 year re-set clause, effectively making such funding short-term leads to front-loading of tariffs during the initial years of the project cycle absence of long-term fixed rate financing, stability of cash flows are difficult to achieve Domestic Sources External Sources Equity • Domestic developers (independently or in collaboration with international developers) • International developers (independently or in collaboration with domestic developers) • Public utilities (taking minority holdings) • Equipment suppliers (in collaboration with domestic or international developers) • Other institutional investors (likely to be limited) • Dedicated infrastructure funds • Other international equity investors • Multilateral agencies Debt   • Domestic commercial banks (3–5 year tenor) • International commercial banks (7–10 year tenor) • Domestic term lending institutions (7–10 year tenor) • Export credit agencies (7–10 year tenor) • Domestic bond markets (7–10 year tenor) • International bond markets (10–30 year tenor) • Specialized infrastructure financing institutions • Multilateral agencies (over 20 year tenor) Source: Planning Commission, Government of India
  • 4.
    Constraints in FinancingOf Infrastructure Constraints on Infrastructure Financing Greatest level of operational, financial and market risk Shallow capital market 30% of the cost of infrastructure projects is financed through equity Equity Financing cumbersome primary issuance guidelines Inadequate credit information Inefficient clearing and settlement mechanisms Poor and lengthy enforcement laws relating to default proceedings Inefficiencies arising from weaknesses in regulation Corporate Debt Market Higher risk-profile, FIs reluctant to finance infrastructure in early stages Constrains the participation of insurance companies and pension funds Insufficient knowledge and appraisal skills related to infrastructure projects Regulatory and institutional problems Interest rate caps on External Commercial Borrowing (ECBs) Lack of sufficiently large and varied pool of infrastructure projects Mezzanine financing Lack of a sufficiently deep forwards market Inability to hedge long term currency risk in a market Foreign Exchange Market
  • 5.
    Issues with CurrentTreasury Management Strategy Current strategy  Borrow short-term, Lending long term Issues Assets very long term in nature Inverted yield curve is causing a negative interest spread on infrastructure projects
  • 6.
    Asset Liability ManagementSystem | Guidelines Asset Liability Mismatches Main focus should be on the short-term mismatches viz., 1-30/31 days Mismatches (negative gap) during 1-30/31 days in normal course may not exceed 15% of the cash outflows in this time bucket This as per later amendments has been raised to 20%, in the first two buckets (from the Statement of Structural Liquidity or the Maturity profile sheet) NBFCs to monitor their short-term liquidity on a dynamic basis over a time horizon spanning from 1 day to 6 months NBFCs may estimate their short-term liquidity profiles on the basis of business projections and other commitments for planning purposes ( as per ALM Annexure-II) (As per company circular DNBS (PD).CC.No.15 /02.01 / 2000-2001 released on June 27, 2001)
  • 7.
    Scale Back Infrastructurelending – WHY? Current infrastructure lending growth rate desired  35% However, if we keep up this level of lending growth, due to the prevailing negative interest spread, the existing asset liability mismatch will become more severe and difficult to manage For upto 1 year, cumulative gap should not exceed 15% of the cumulative cash outflows  at present 55.23% As on Oct 10, 2008 Less Than 1 Month Over 1 Month upto 2 Months Over 2 Months upto 3 Months Over 3 Months upto 6 months Over 6 months upto 1 year Over 1 year upto 3 years Over 3 years upto 5 Years Over 5 years Assets 3.42% 4.43% 1.55% 12.85% 14.85% 34.03% 14.75% 14.12% Borrowings 6.49% 14.92% 33.72% 23.78% 13.42% 5.19% 2.16% 0.32% Allowed Gap 0.97% 2.24% Current Asset Liability Mismatch 3.07% 10.49% 32.17% 10.93% -1.43% -28.84% -12.59% -13.80%
  • 8.
    Scale Back Infrastructurelending – HOW MUCH? For year 1  scale down growth in infrastructure lending to 25% Reasons Due to the Credit crisis, we are seeing lower liquidity in the credit markets, which will cause the borrowing costs to increase in the short term The current asset liability mismatch is beyond the stipulated regulations laid down by RBI for NBFCs For year 2  scale down growth in infrastructure lending to 30% Reasons Due to steps taken by RBI to inject liquidity into the markets, we expect the situation to improve in the next fiscal year Interest rates are expected to decline
  • 9.
    Assumptions | ProjectedModel Infrastructure Loan Growth Equity issue to be made if D/E ratio goes beyond 5 Composition of Loan Funds 30% 2010 35% 2011 35% 2012 35% 2013 2009 Infrastructure Loans Growth 25% 25% 75% 2010 25% 75% 2011 25% 75% 2012 2008 2009 2013 Secured Loans 76.19% 75% 75% Unsecured Loans 23.81% 25% 25% 5% 5% 5% 6% 6% Average RoI 10.25% 13% 2010 10% 13% 2011 10% 13% 2012 2009 2013 Average interest on Infrastructure Loans 13% 13% Average Cost of Loan Funds 10.25% 10%
  • 10.
    Assumptions | ProjectedModel Cash as a % of Total Liabilities  increased from 1.15% to 4% Investments as a % of Total Liabilities  increased from 3.12% to 4% Rationale: In case of a short term credit freeze and unavailability of loans from any source, such a position of covering only 4.27% of the borrowings in cash and equivalents can be very risky proposition for business. We have thus assumed that the company should keep at least 8% of its borrowings in cash and equivalents Growth Rates – 10% for other assets and current liabilities Tax Rate  32.99% 5% 10% 5% 2010 10% 10% 10% 2011 10% 10% 10% 2012 Growth in costs 2009 2013 Employee Cost 5% 10% Establishment Expenses 10% 10% Other Expenses 5% 10%
  • 11.
    Key Financial ProjectionsBalance Sheet Figures Income Statement Figures 36% 3.68 0 30% FY 2010 37% 4.41 0 32% FY 2011 39% 5.28 0 35% FY 2012 FY 2009 FY 2013 Growth in size of Balance Sheet 30% 35% Issue of Equity 0 300 mm Debt/Equity 3.05 3.49 Growth in Loan Funds 37% 25% 32% 32% 33% 32% FY 2011 29% 37% 38% 35% FY 2012 46% 5.28 31% 35% FY 2013 16% 35% 36% 28% FY 2010 Growth in Operating and Other Income Growth in Interest Expense Growth in Total Expenses Growth in Net Income
  • 12.
    Maturity Profile Structure| Expected Balance Sheet Maturity Profile (2009) Balance Sheet Maturity Profile (2010) As on Mar 31, 2009 Less Than 1 Month Over 1 Month upto 2 Months Over 2 Months upto 3 Months Over 3 Months upto 6 months Over 6 months upto 1 year Over 1 year upto 3 years Over 3 years upto 5 Years Over 5 years Total Assets 5.00% 6.20% 1.80% 10.00% 14.00% 23.00% 15.00% 25.00% 100.00% Borrowings 5.00% 5.40% 6.96% 15.00% 10.00% 20.00% 8.00% 29.64% 100.00% As on Mar 31, 2010 Less Than 1 Month Over 1 Month upto 2 Months Over 2 Months upto 3 Months Over 3 Months upto 6 months Over 6 months upto 1 year Over 1 year upto 3 years Over 3 years upto 5 Years Over 5 years Total Assets 5.00% 6.20% 1.80% 10.00% 14.00% 23.00% 15.00% 25.00% 100.00% Borrowings 5.00% 5.40% 7.30% 15.00% 10.00% 23.00% 8.00% 26.30% 100.00%
  • 13.
    Revisions | Sourcesof Funds Current Structure Proposed Borrowing Structure Equity 28.73% Banks 35.64% Mutual Funds 28.51% DFI and Long Term Non-Convertible Debenture 7.13% Equity 24.71% Banks 33.88% Mutual Funds 26.35% DFI and Long Term Non-Convertible Debenture 15.06%
  • 14.
    Future Borrowing Strategy| Debt Issue Issue of Non-Convertible debenture @ 10.5% for 5 years and above (current rate taken www.indiabondwatch.com ) The issue has to be rated from 2 Credit Rating agencies Current Short-term Rating by ICRA  A1+ , Care  PR1+ Current Long-Term Rating by ICRA  LAA Who will subscribe to the debt issue? Considering current ratings, L&T Name associated, Rating of AA or above expected  Pension funds and Insurance companies Pension Funds and Insurance companies hold Debt securities till maturity, and are willing to invest in relatively longer term debt issues This will help the company to shift to a longer term borrowing maturity profile
  • 15.
    Future Borrowing Strategy| ECBs External Commercial Borrowings All-in-cost Ceilings over 6 month LIBOR (for the respective currency of borrowing or applicable Benchmark) Three years and up to five years: 150 basis points More than five years: 250 basis points ECB up to USD 20 million or equivalent in a financial year with minimum average maturity of three years ECB above USD 20 million and up to USD 500 million or equivalent with a minimum average maturity of five years
  • 16.
    Future Borrowing Strategy| Equity Issue Equity Issue Required, as the company has to maintain a D/E ratio of less than 6 For maintaining, 30-35% growth in infrastructure lending, every 3 to 4 years equity has to be issued by the company Who will subscribe to the Equity issue? Holding Company – L&T SEBI-registered Venture Funds/PE funds Private Placement in Financial Institutions
  • 17.
    Impact of CurrentGlobal Crisis India’s Planning Commission estimated Total debt requirement in infrastructure to March 2011 would be around Rs9.8 trillion Pegged credit availability at only Rs8.2 trillion Companies cannot directly borrow from most bilateral and multilateral lenders Have to get proposals cleared from government agencies such as the department of economic affairs
  • 18.
    Impact of CurrentGlobal Crisis Impact of crisis Rising inflation High prices of fuel & raw materials Global Credit Shortage & Exchange Rate Volatility- availability of Forex Funding Limited Rising Interest Rates lesser lending by banks (increase in NPAs) Inadequate credit availability Reliance on institutions such as the World Bank and the Asian Development Bank (ADB) will increase Cushioned against the global crisis to an extent Raise money from their member countries Supplement them by raising money from bond markets
  • 19.
    Outlook Huge needfor investment- more than USD 450bn to flow into India’s infrastructure by 2012 Investment in infrastructure drives growth More need for Private Capital- increased Public private partnerships Thriving Business centers offer the greatest potential
  • 20.
    The Way ForwardFacilitating equity financing Improving exit policies to make it easier for investors to exit Better corporate governance Encouraging the use of mezzanine and takeout financing Removing interest rate caps on ECBs could encourage foreign investors Developing corporate bond market Encouraging participation by FIs in infrastructure financing Stimulating Public Private Partnerships
  • 21.