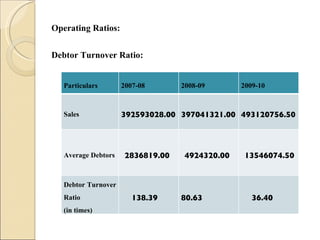
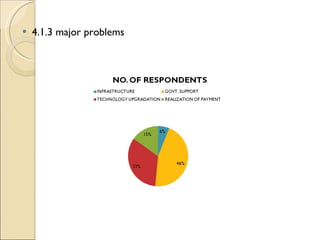
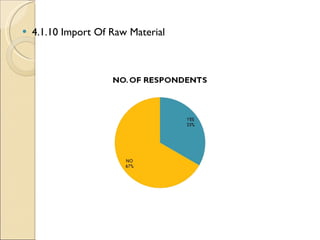
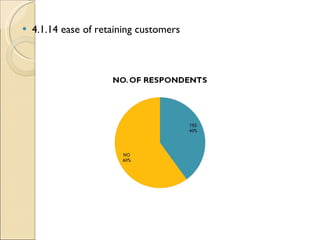
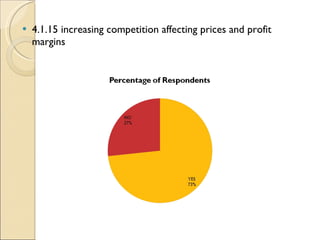
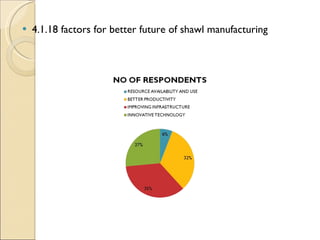
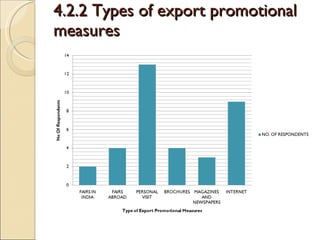
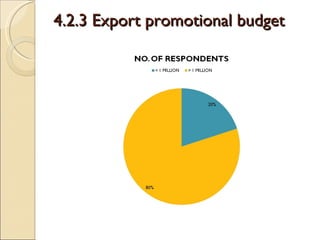
Summer Training  Project  On “ SERVING THE BEST IN THE WORLD” “ A Case  of Ludhiana Shawl Manufacturers” Under Guidance Of Mr. Rajpreet Chhatwal Presented By  Savisca Singh  94972238279
 
Origin of shawls in the world can be traced back more than 700 years The art of weaving in the Kashmir valley, was introduced in mid 14th century. Indian shawl industry depends upon imported wool.
CURRENT SCENARIO Total no. of persons employed, including persons associated 27 lakh Total Production Rs. 8,500 Crore Total Investment Rs. 20,000 Crore Total Imports Rs. 1,100.75 Crore Total Exports Rs.  4,419.54 Crore
 
MAJOR PLAYERS IN LUDHIANA Oswal woollen mills Shingora International. Veer Textile Mills. Sharman Shawls. Vohra Shawls. Prince Textile Mills. Naresh Textile Mills
SHARMAN SHAWLS
Established in the year 1984, Sharman shawls pvt.  Ltd., is a remarkable manufacturer, supplier and exporter of Textile Yarns and Fabrics . Their product line reaches out to the clients spread across Argentina, Central America, Portugal, South Africa, Mexico, Spain, Jordan, Italy etc. They  manufacture  yarns and fabrics from highly efficient machines, imported from Germany and Italy. They keep upgrading these machines, so as to touch new standards of innovation and quality.
MISSION The company’s spirit of enterprise and dedication to quality symbolize their corporate culture where  commitment leads to achievements. The mission of the company is of continual improvement and sustained growth and of a family of workers who are given the best benefits and working environment . 
VISION Improving market reach out, particularly in the export markets through better networking with the market related BDS to facilitate this process. This would be required to be clubbed with skilling of labor through industry matched linkages with local institutions to induce quality production and cost efficiencies through better inventory control.
 
Strengths Good technological base High quality standards at affordable price Company’s culture and philosophy Commitment for growth Large variety Weaknesses Lesser degree of professionalism. Small size companies lack economies of scale. Low investment in research and development. Labour shortage
Opportunities Market is expanding day by day, so the opportunity is there to expand the business. Removal of international trade barriers. Threats Introduction of better products by rivals/ competitors. Less prices charged by the competitors. Marketing will be the most problematic area where improvements are called for. Continuous quality improvement will be the need of the hour.
FINANCIAL ANALYSIS
Liquidity Ratios: Current Ratio: Particulars 2007-08 2008-09 2009-10 Current Assets 154751200.09 143441742.87 165560678.33 Current Liabilities 46270458.17 44575153.33 46203459.82 Current Ratio 3.34 3.22 3.58
Quick Ratio: Particulars 2007-08 2008-09 2009-10 Quick Assets 36840682.21 23197151.63 36669025.81 Current Liabilities 46270458.17 44575153.33 46203459.82 Quick Ratio 0.80 0.52 0.79
Absolute Liquid Ratio: Particulars 2007-08 2008-09 2009-10 Absolute Liquid Assets 34003863.21 16185330.13 16588698.31 Current Liabilities 46270458.17 44575153.33 46203459.82 Absolute liquid Ratio 0.73 0.36 0.36
Operating Ratios: Debtor Turnover Ratio: Particulars 2007-08 2008-09 2009-10 Sales 392593028.00 397041321.00 493120756.50 Average Debtors 2836819.00 4924320.00 13546074.50 Debtor Turnover Ratio (in times) 138.39 80.63 36.40
Creditor Turnover Ratio: Particulars 2007-08 2008-09 2009-10 Purchases 238601768.36 224483660.39 302094979.77 Average Creditors 27168283.10 30096428.00 30888335.00 Creditor Turnover Ratio (in times) 8.78 7.46 9.78
Profitability Ratios: Gross Profit Ratio: Particulars 2007-08 2008-09 2009-10 Gross Profit 141394469.63 139544330.92 155583523.34 Sales 392593028.00 397041321.00 493120756.50 Gross Profit Ratio (%) 36.02 35.15 31.55
Net Profit Ratio: Particulars 2007-08 2008-09 2009-10 Net Profit 29682796.53 45010843.28 48323156.13 Sales 392593028.00 397041321.00 493120756.50 Net Profit Ratio (%) 7.56 11.34 9.80
 
SALES
Trend of net Profit
INTRODUCTION TO PROJECT
TITLE SERVING THE BEST IN THE WORLD A case of Ludhiana shawl manufacturers
Objectives of the Study To study marketing arrangements being adopted by shawl manufacturers. To find out the problems prevailing in shawl industry  of Ludhiana . To identify the impact of various factors on shawl business of Ludhiana .
 
Research design :  Descriptive research design  Data Collection Primary Data Using Questionnaires Secondary Data From Internet, Newspapers, Journals.
Sampling Design: Universe : All Textile Manufacturers and Exporters Population : All manufacturers and exporters in Ludhiana Sampling Unit : Any shawl manufacturer and exporter of Ludhiana Sample size:   30 for shawl manufacturers 15 for shawl exporters
 
4.1.1 Product manufactured
4.1.2 Annual production
4.1.3 major problems
4.1.4 improvement of physical infrastructure
4.1.5 satisfaction level towards VAT refund policies   Mean=0.16 0.16 |----------------|---------------|-|--------------|----------------| -2  -1  0  1  2
4.1.6 Subsidy Expected Control in fluctuating prices of raw material Lower the cost of transportation Improve infrastructure facilities
4.1.7 Procedure To Avail Loan Mean=2.77 2.77 |----------------|-----------|----|---------------|----------------| 1  2  3  4  5
4.1.8 Satisfaction Towards Interest Rate On Loans Mean=0.06 0.6 |----------------|---------------|-|--------------|----------------| -2  -1  0  1  2
4.1.9 Factors As Hindrance In Growth
4.1.10 Import Of Raw Material
4.1.11 Countries from which raw material is imported
4.1.12 risks attached in payments
4.1.13 measures to fight competition
4.1.14 ease of retaining customers
4.1.15 increasing competition affecting prices and profit margins
4.1.16 member of shawl club
4.1.17 help by shawl club
4.1.18 factors for better future of shawl manufacturing
4.1.19 means of promotion
4.2.1 Follow promotional measures
4.2.2 Types of export promotional measures
4.2.3 Export promotional budget
4.2.4 Branding Of Product
4.2.5 Share Of Total Production Out Of Total Production
4.2.6 Export Performance
4.2.7 Factors affecting export of products
4.2.8 Satisfaction Level With Export Incentives For Exporters Mean=0.13 0.13 |----------|----------|---|--------|-----------| -2  -1  0  1  2
4.2.9  Problems In Exporting
 
The exporters face many problems in their daily business which they feel to some extent even affect  their business. That most of the exporters have to search for international markets by visiting their personally that they do not have advance technology for their promotions. The government that should provide the major aid to the exporters is the biggest hurdle or the factor affecting their business. Poor infrastructure of the city especially the power cuts and no airport facilities are the other major problems. Shortage of labor and rigid labor laws are also affecting the business. Major import of raw wool is from Australia.
 
Export formalities should be made simple and exporters should be made aware of the procedures and provided assistance by the government. Government shall also work on improving the image of brand India by ensuring quality of manufactured goods and also make manufacturers aware of different quality standards followed by various countries. Facilitating organizations should step forward to guide and help exporters. Internet as channel for internationalization should be promoted. Online databases need to be marketed and international companies must be made aware of there use.
The documentation process, which has been found cumbersome by many exporters, should be simplified so as to reduce the time, though the government has tried to initiate this with the aligned documentation system (ADS). The process still needs further simplification so as to reduce unnecessary paper work. The excise and custom authorities should be made more effective and efficient. More R&D and infrastructural facilities should be developed. The government should provide easy credit facilities to exporters at reasonable rates of interest. The interest rates in most of the developed countries are far less compared to those prevalent in India. This makes the final product expensive and hence less competitive in the international markets.
THANK YOU

Projectppts

  • 1.
    Summer Training Project On “ SERVING THE BEST IN THE WORLD” “ A Case of Ludhiana Shawl Manufacturers” Under Guidance Of Mr. Rajpreet Chhatwal Presented By Savisca Singh 94972238279
  • 2.
  • 3.
    Origin of shawlsin the world can be traced back more than 700 years The art of weaving in the Kashmir valley, was introduced in mid 14th century. Indian shawl industry depends upon imported wool.
  • 4.
    CURRENT SCENARIO Totalno. of persons employed, including persons associated 27 lakh Total Production Rs. 8,500 Crore Total Investment Rs. 20,000 Crore Total Imports Rs. 1,100.75 Crore Total Exports Rs. 4,419.54 Crore
  • 5.
  • 6.
    MAJOR PLAYERS INLUDHIANA Oswal woollen mills Shingora International. Veer Textile Mills. Sharman Shawls. Vohra Shawls. Prince Textile Mills. Naresh Textile Mills
  • 7.
  • 8.
    Established in theyear 1984, Sharman shawls pvt. Ltd., is a remarkable manufacturer, supplier and exporter of Textile Yarns and Fabrics . Their product line reaches out to the clients spread across Argentina, Central America, Portugal, South Africa, Mexico, Spain, Jordan, Italy etc. They manufacture yarns and fabrics from highly efficient machines, imported from Germany and Italy. They keep upgrading these machines, so as to touch new standards of innovation and quality.
  • 9.
    MISSION The company’sspirit of enterprise and dedication to quality symbolize their corporate culture where commitment leads to achievements. The mission of the company is of continual improvement and sustained growth and of a family of workers who are given the best benefits and working environment . 
  • 10.
    VISION Improving marketreach out, particularly in the export markets through better networking with the market related BDS to facilitate this process. This would be required to be clubbed with skilling of labor through industry matched linkages with local institutions to induce quality production and cost efficiencies through better inventory control.
  • 11.
  • 12.
    Strengths Good technologicalbase High quality standards at affordable price Company’s culture and philosophy Commitment for growth Large variety Weaknesses Lesser degree of professionalism. Small size companies lack economies of scale. Low investment in research and development. Labour shortage
  • 13.
    Opportunities Market isexpanding day by day, so the opportunity is there to expand the business. Removal of international trade barriers. Threats Introduction of better products by rivals/ competitors. Less prices charged by the competitors. Marketing will be the most problematic area where improvements are called for. Continuous quality improvement will be the need of the hour.
  • 14.
  • 15.
    Liquidity Ratios: CurrentRatio: Particulars 2007-08 2008-09 2009-10 Current Assets 154751200.09 143441742.87 165560678.33 Current Liabilities 46270458.17 44575153.33 46203459.82 Current Ratio 3.34 3.22 3.58
  • 16.
    Quick Ratio: Particulars2007-08 2008-09 2009-10 Quick Assets 36840682.21 23197151.63 36669025.81 Current Liabilities 46270458.17 44575153.33 46203459.82 Quick Ratio 0.80 0.52 0.79
  • 17.
    Absolute Liquid Ratio:Particulars 2007-08 2008-09 2009-10 Absolute Liquid Assets 34003863.21 16185330.13 16588698.31 Current Liabilities 46270458.17 44575153.33 46203459.82 Absolute liquid Ratio 0.73 0.36 0.36
  • 18.
    Operating Ratios: DebtorTurnover Ratio: Particulars 2007-08 2008-09 2009-10 Sales 392593028.00 397041321.00 493120756.50 Average Debtors 2836819.00 4924320.00 13546074.50 Debtor Turnover Ratio (in times) 138.39 80.63 36.40
  • 19.
    Creditor Turnover Ratio:Particulars 2007-08 2008-09 2009-10 Purchases 238601768.36 224483660.39 302094979.77 Average Creditors 27168283.10 30096428.00 30888335.00 Creditor Turnover Ratio (in times) 8.78 7.46 9.78
  • 20.
    Profitability Ratios: GrossProfit Ratio: Particulars 2007-08 2008-09 2009-10 Gross Profit 141394469.63 139544330.92 155583523.34 Sales 392593028.00 397041321.00 493120756.50 Gross Profit Ratio (%) 36.02 35.15 31.55
  • 21.
    Net Profit Ratio:Particulars 2007-08 2008-09 2009-10 Net Profit 29682796.53 45010843.28 48323156.13 Sales 392593028.00 397041321.00 493120756.50 Net Profit Ratio (%) 7.56 11.34 9.80
  • 22.
  • 23.
  • 24.
  • 25.
  • 26.
    TITLE SERVING THEBEST IN THE WORLD A case of Ludhiana shawl manufacturers
  • 27.
    Objectives of theStudy To study marketing arrangements being adopted by shawl manufacturers. To find out the problems prevailing in shawl industry of Ludhiana . To identify the impact of various factors on shawl business of Ludhiana .
  • 28.
  • 29.
    Research design : Descriptive research design Data Collection Primary Data Using Questionnaires Secondary Data From Internet, Newspapers, Journals.
  • 30.
    Sampling Design: Universe: All Textile Manufacturers and Exporters Population : All manufacturers and exporters in Ludhiana Sampling Unit : Any shawl manufacturer and exporter of Ludhiana Sample size: 30 for shawl manufacturers 15 for shawl exporters
  • 31.
  • 32.
  • 33.
  • 34.
  • 35.
    4.1.4 improvement ofphysical infrastructure
  • 36.
    4.1.5 satisfaction leveltowards VAT refund policies   Mean=0.16 0.16 |----------------|---------------|-|--------------|----------------| -2 -1 0 1 2
  • 37.
    4.1.6 Subsidy ExpectedControl in fluctuating prices of raw material Lower the cost of transportation Improve infrastructure facilities
  • 38.
    4.1.7 Procedure ToAvail Loan Mean=2.77 2.77 |----------------|-----------|----|---------------|----------------| 1 2 3 4 5
  • 39.
    4.1.8 Satisfaction TowardsInterest Rate On Loans Mean=0.06 0.6 |----------------|---------------|-|--------------|----------------| -2 -1 0 1 2
  • 40.
    4.1.9 Factors AsHindrance In Growth
  • 41.
    4.1.10 Import OfRaw Material
  • 42.
    4.1.11 Countries fromwhich raw material is imported
  • 43.
  • 44.
    4.1.13 measures tofight competition
  • 45.
    4.1.14 ease ofretaining customers
  • 46.
    4.1.15 increasing competitionaffecting prices and profit margins
  • 47.
    4.1.16 member ofshawl club
  • 48.
    4.1.17 help byshawl club
  • 49.
    4.1.18 factors forbetter future of shawl manufacturing
  • 50.
    4.1.19 means ofpromotion
  • 51.
  • 52.
    4.2.2 Types ofexport promotional measures
  • 53.
  • 54.
  • 55.
    4.2.5 Share OfTotal Production Out Of Total Production
  • 56.
  • 57.
    4.2.7 Factors affectingexport of products
  • 58.
    4.2.8 Satisfaction LevelWith Export Incentives For Exporters Mean=0.13 0.13 |----------|----------|---|--------|-----------| -2 -1 0 1 2
  • 59.
    4.2.9 ProblemsIn Exporting
  • 60.
  • 61.
    The exporters facemany problems in their daily business which they feel to some extent even affect their business. That most of the exporters have to search for international markets by visiting their personally that they do not have advance technology for their promotions. The government that should provide the major aid to the exporters is the biggest hurdle or the factor affecting their business. Poor infrastructure of the city especially the power cuts and no airport facilities are the other major problems. Shortage of labor and rigid labor laws are also affecting the business. Major import of raw wool is from Australia.
  • 62.
  • 63.
    Export formalities shouldbe made simple and exporters should be made aware of the procedures and provided assistance by the government. Government shall also work on improving the image of brand India by ensuring quality of manufactured goods and also make manufacturers aware of different quality standards followed by various countries. Facilitating organizations should step forward to guide and help exporters. Internet as channel for internationalization should be promoted. Online databases need to be marketed and international companies must be made aware of there use.
  • 64.
    The documentation process,which has been found cumbersome by many exporters, should be simplified so as to reduce the time, though the government has tried to initiate this with the aligned documentation system (ADS). The process still needs further simplification so as to reduce unnecessary paper work. The excise and custom authorities should be made more effective and efficient. More R&D and infrastructural facilities should be developed. The government should provide easy credit facilities to exporters at reasonable rates of interest. The interest rates in most of the developed countries are far less compared to those prevalent in India. This makes the final product expensive and hence less competitive in the international markets.
  • 65.