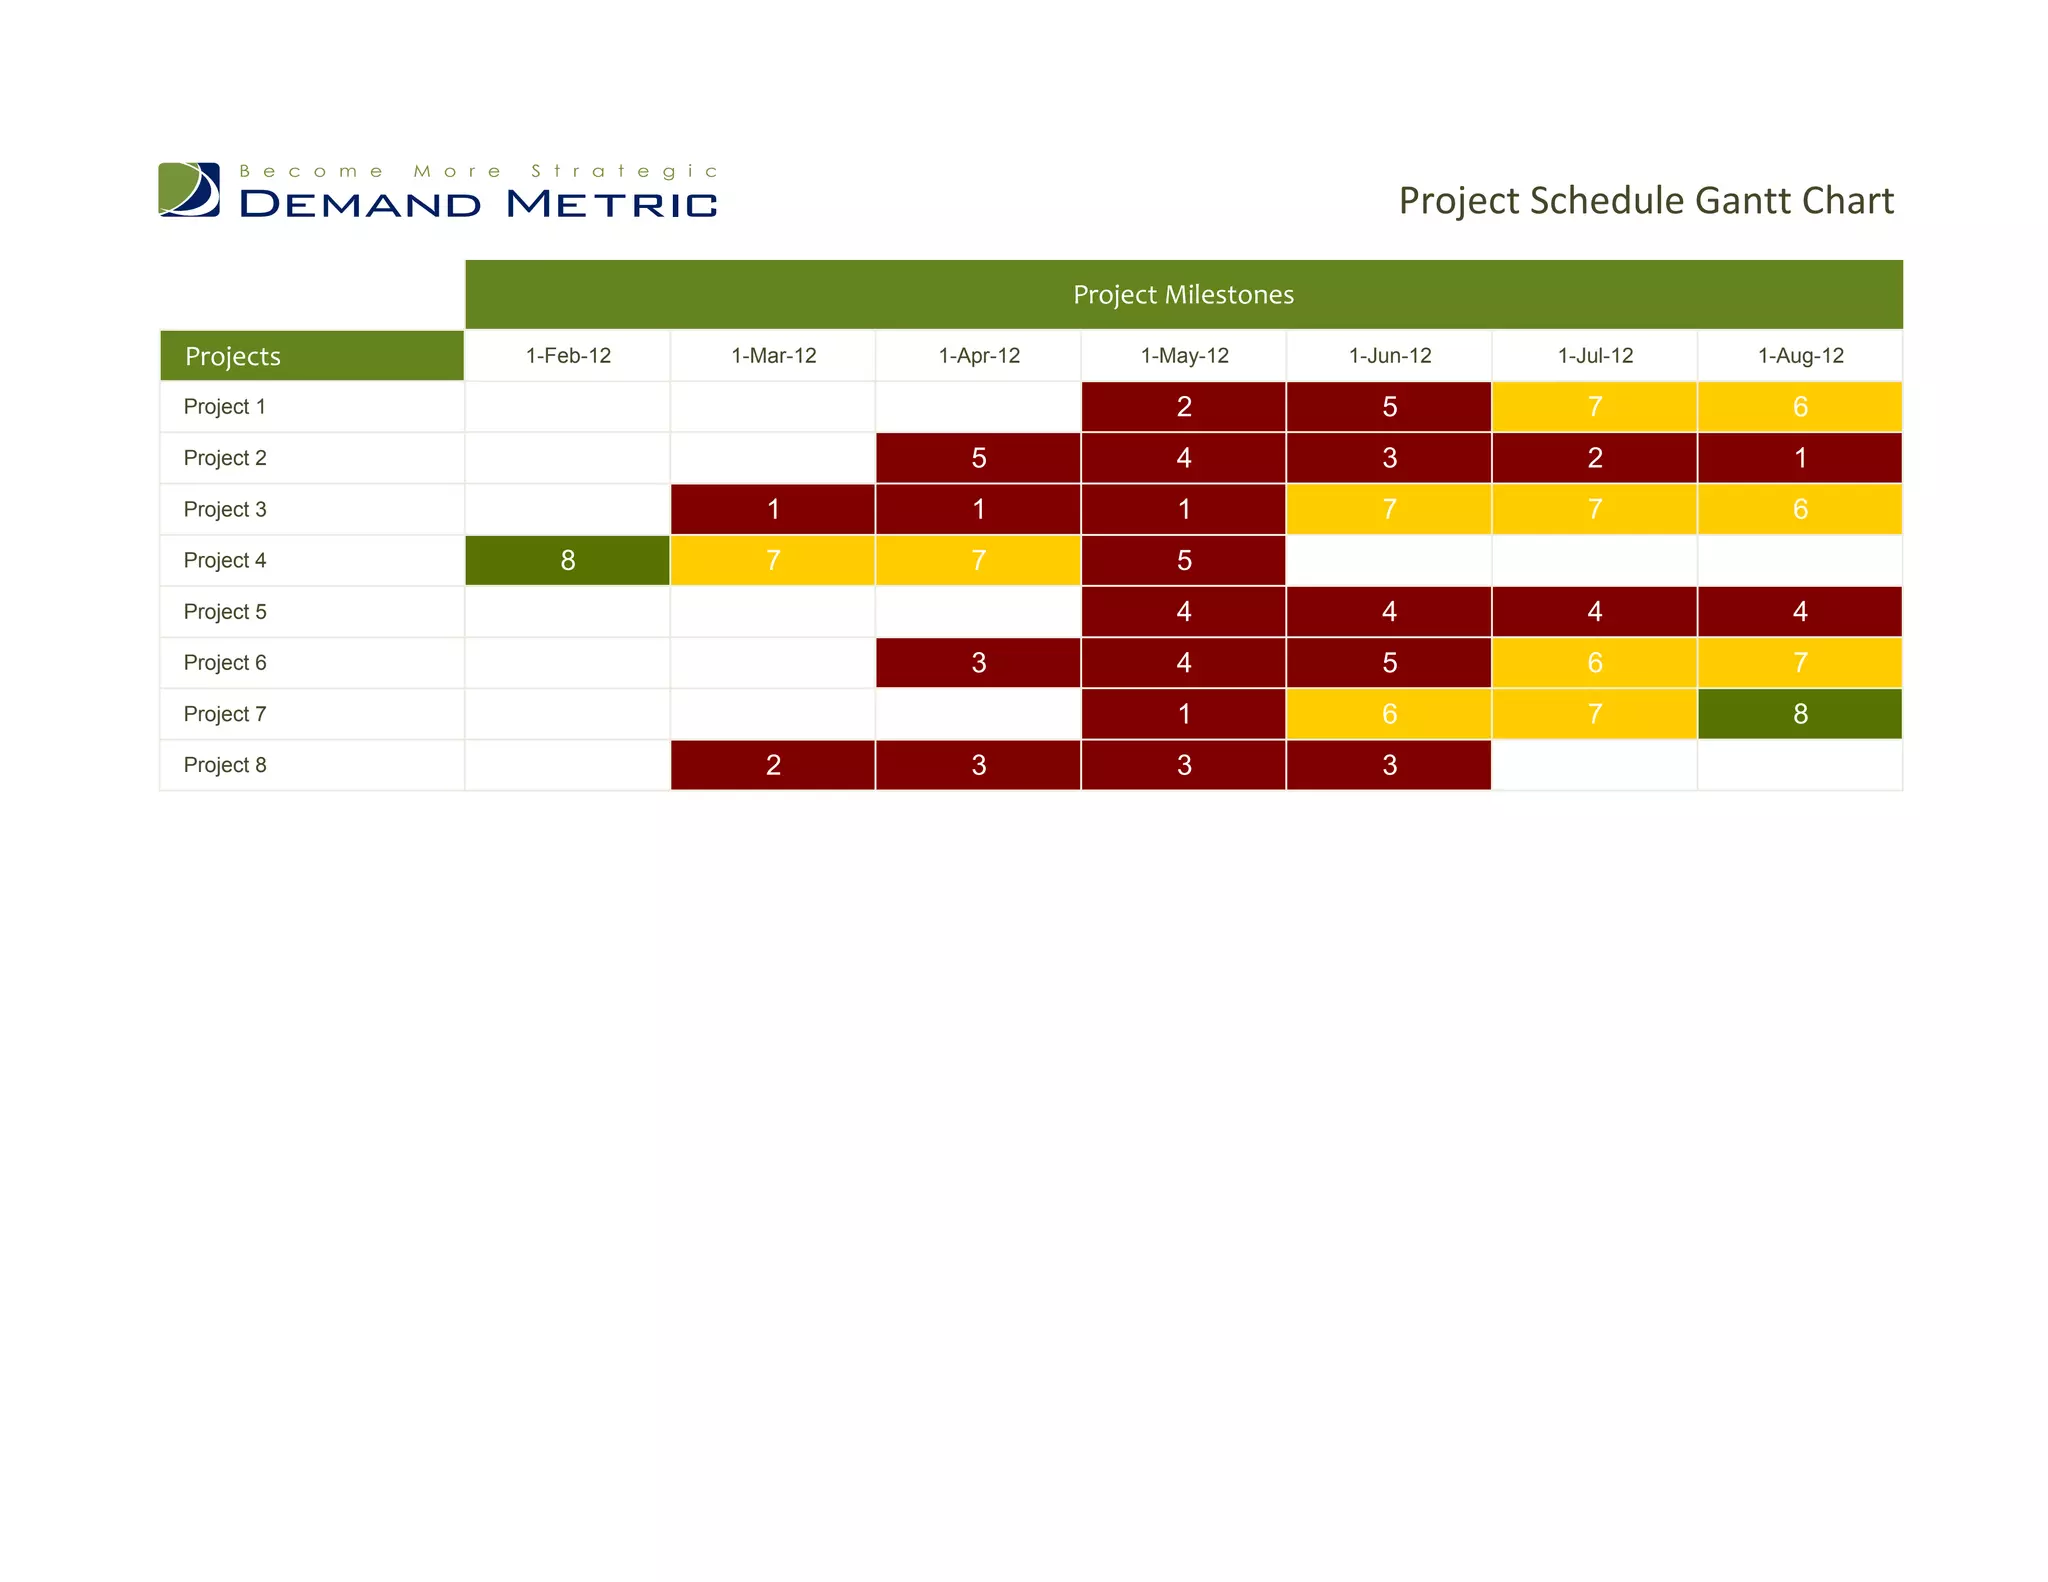
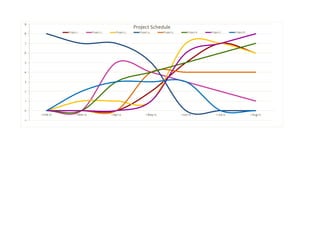

The document shows a Gantt chart projecting the progress of 8 projects from February to August 2012. Project 4 starts with the most progress in February at 8, while most other projects begin with no progress. By May, Project 3 and 6 show the most progress at 7. The chart tracks each project's scheduled progress over the 8 month period.


