Download to read offline

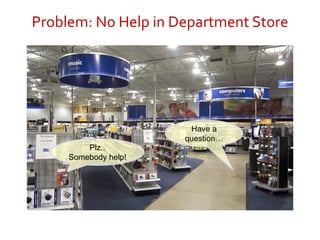
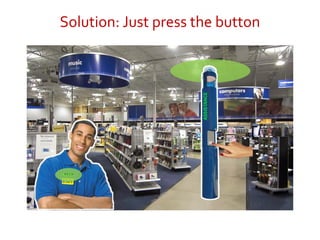
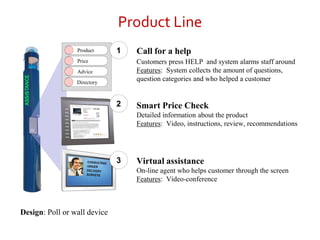
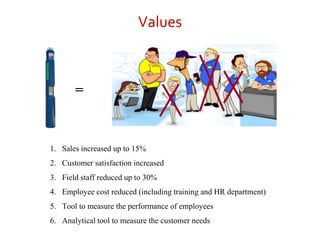
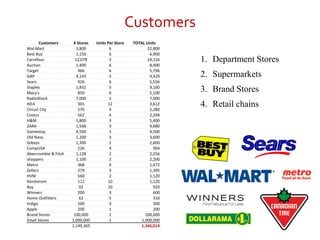
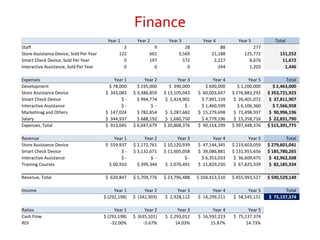

The document proposes a digital store assistant system that provides customers help and information through various interactive options. It presents the business model and financial projections, estimating the system could generate over $75 million in profit over 5 years while reducing employee costs and increasing customer satisfaction for major retailers. The system is aimed at large department stores, supermarkets, and brand stores with the potential to impact over 1.3 million retail locations worldwide.


