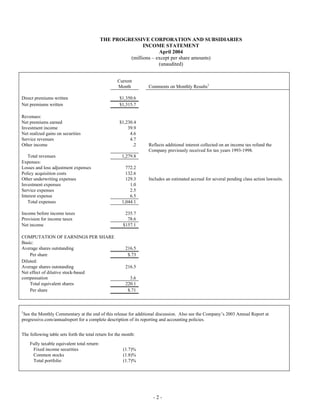
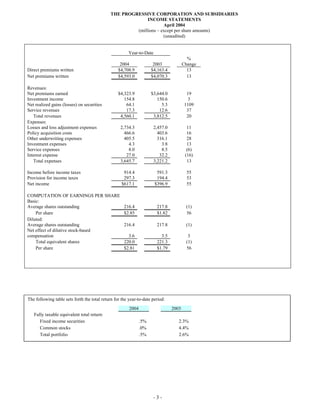
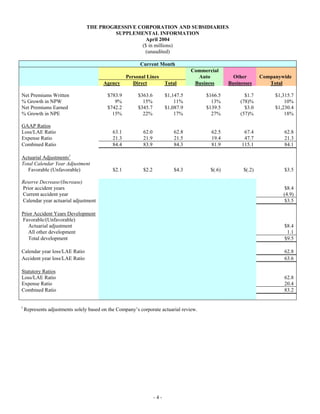
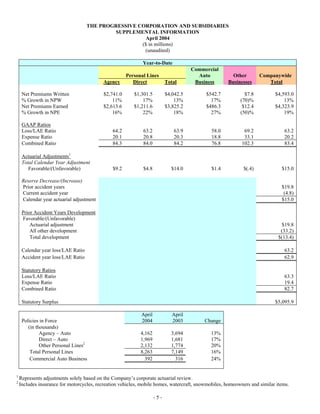
The Progressive Corporation reported financial results for April 2004, with the following key highlights:
- Net premiums written increased 10% to $1.315 billion compared to April 2003.
- Net income increased 49% to $157.1 million compared to April 2003.
- The combined ratio improved 4.2 percentage points to 84.1% from 88.3% in April 2003.
- Personal lines policies in force grew 16% year-over-year and commercial auto policies grew 24%.
The Progressive Corporation reported financial results for May 2004, with net premiums written up 16% and net income up 14% compared to May 2003. Key highlights included strong growth across personal and commercial lines of business, a combined ratio of 86.6%, and continued profitability in all but three personal lines markets. Policies in force also grew 15% year-over-year. Progressive continued to experience catastrophe losses which contributed to a higher loss ratio for the month.
- The Progressive Corporation reported financial results for March 2004 including a 14% increase in net premiums written, an 18% increase in net premiums earned, and a 66% increase in net income compared to March 2003.
- Net income was $152.6 million, or earnings of $0.69 per share, compared to $91.8 million, or $0.42 per share in the previous year.
- The combined ratio was 82.8%, a 0.9 point improvement from the prior year.
The Progressive Corporation reported its October 2004 results. Net premiums written increased 9% to $1.279.8 million compared to October 2003. Net income decreased 4% to $140.2 million while the combined ratio increased 2.3 percentage points to 87.0%. Progressive continues to respond to claims from hurricanes in August and September, with losses representing 1.5 percentage points of the loss ratio for the month. On October 22, Progressive repurchased 16.9 million shares for $1.5 billion through a Dutch auction tender offer.
The Progressive Corporation announced financial results for December 2004 and the fourth quarter of 2004. For December, net premiums written increased 32% to $1.135.5 million and net income increased 59% to $179.5 million. For the quarter, net premiums written rose 15% to $3.352.3 million and net income grew 16% to $413.5 million. The company also announced it would hold a conference call on March 3, 2005 to discuss its annual report.
- The Progressive Corporation reported financial results for January 2004, including a 16% increase in net premiums written, a 21% increase in net premiums earned, and a 47% increase in net income compared to January 2003.
- Progressive saw growth in both its Personal Lines and Commercial Auto businesses, with personal auto policies in force up 18% and commercial auto policies up 26% compared to the previous year.
- The company had favorable loss development and a combined ratio of 83.0%, contributing to strong profitability in the month.
The Progressive Corporation reported its financial results for July 2004. Net premiums written increased 7% to $1.298 billion compared to July 2003. Net income grew 18% to $168.1 million, while earnings per share rose 19% to $0.77. The combined ratio improved 3.3 percentage points to 82.6. Personal lines net premiums written grew 6% and commercial auto rose 19%. Progressive continued to experience strong profitability with only two unprofitable markets.
The Progressive Corporation reported its November 2004 results, including a 7% increase in net premiums written and an 8% increase in net premiums earned compared to November 2003. Net income decreased 6% to $93.8 million while the combined ratio increased 2.9 percentage points to 89.6%. Personal lines policies in force grew 11% year-over-year while commercial auto policies increased 15%. Growth is slowing across most markets and businesses. Investment income was impacted by $3.8 million in special stock dividends while realized losses included $6 million in common stock impairments.
The Progressive Corporation reported financial results for March 2005. Net premiums written increased 5% to $1.127 billion compared to March 2004. Net income decreased 11% to $135.2 million compared to the prior year. Earnings per share fell 3% to $0.67. The combined ratio was 84.8, an increase of 2 percentage points from the prior year. Policies in force grew 12% year-over-year for personal lines and 14% for commercial auto.
The Progressive Corporation reported financial results for January 2005. Net premiums written increased 13% to $1.296 billion compared to January 2004. Net income decreased 8% to $149.8 million while earnings per share remained the same at $0.74. The combined ratio increased 2 points to 85.0 due to higher losses and loss adjustment expenses. Policies in force grew 12% for personal lines and 15% for commercial auto business compared to January 2004.
1) The Progressive Corporation reported financial results for April 2006, including a 4% increase in net premiums written and earned compared to April 2005. Net income increased 8% to $159.6 million.
2) Progressive offers personal and commercial auto insurance throughout the US. It experienced $26.1 million in losses from April storms, accounting for 1.9 combined ratio points.
3) For the year-to-date period ending April 2006, net premiums written and earned increased 3-4% compared to the same period in 2005, while net income grew 6% to $596.2 million.
- The Progressive Corporation reported financial results for February 2004, with net premiums written up 12% and net income up 63% compared to February 2003.
- Net income was $145.1 million or $0.66 per share, with a combined ratio of 83.7%.
- Personal Lines policies in force grew 16% year-over-year while Commercial Auto policies grew 25%. Premium growth rates declined as expected but remained strong.
The Progressive Corporation hosted its 2005 Investor Relations Meeting on May 26th. The meeting included presentations and a question and answer session, lasting approximately three hours. Information from the meeting was made available on the company's website. Progressive also reported its April 2005 results, with net premiums written up 9% and net income down 6% compared to April 2004. The company will continue to offer auto insurance to personal and commercial drivers throughout the US.
The Progressive Corporation held a conference call on August 10, 2004 at 9:00am eastern time to address questions from shareholders regarding its quarterly report and Form 10-Q filing with the SEC. Progressive reported positive financial results for June 2004, with an 8% increase in net premiums written, 40% increase in net income, and 3.8 point decrease in combined ratio compared to June 2003. Progressive also saw increases in policies in force and net premiums written of 14% and 12%, respectively, for the first quarter of 2004 compared to the same period in 2003.
The Progressive Corporation reported its July 2005 results, including:
- Net premiums written increased 8% to $1.403 billion compared to July 2004.
- Net income decreased 14% to $143.9 million compared to July 2004.
- The combined ratio, a measure of profitability, increased 4.3 percentage points to 86.9% compared to July 2004.
- Total policies in force increased 11% to 9.42 million compared to July 2004, driven by growth in personal and commercial auto insurance policies.
The Progressive Corporation held a conference call to discuss its quarterly financial results. For the second quarter of 2005, the Company's net written premiums increased 7% to $3.594 billion and net income increased 2% to $394.3 million compared to the same period in 2004. The combined ratio, a measure of profitability, improved slightly to 86.1% from 85.4% the prior year. The Company also reported that its conference call to discuss third quarter results is scheduled for August 9, 2005.
This document provides an overview and summary of The Progressive Corporation's 2006 Report on Loss Reserving Practices. The report examines Progressive's loss reserving process and how it affects their financial results. It includes sections on their financial objectives, how reserve development affects financial reporting, the different types of reserves, how reserves are estimated by segment, and recent process enhancements. The goal is to help stakeholders understand Progressive's loss reserving methodology and ensure reserves are adequate while developing with minimal variation over time.
The Progressive Corporation reported financial results for the second quarter of 2006, with net premiums written growing 2% over the same period in 2005. While profits remained strong, with an underwriting margin of 14.1%, growth was lower than expected. Progressive saw the greatest growth challenges in their Drive brand within the independent agency channel. They are also seeing a shift to more customers researching and initiating quotes online rather than by phone. Commercial auto grew policies by 9% in the quarter. Progressive aims to balance further profitability and growth by enhancing their brands and marketing to attract more customers in all channels.
This document is a quarterly report filed with the SEC by Health Net, Inc. for the quarter ended March 31, 2006. It includes financial statements such as the consolidated statements of operations and balance sheets, as well as notes to the financial statements. Some key details include:
- Revenues for the quarter were $3.2 billion, up from $2.9 billion in the same quarter the previous year.
- Net income for the quarter was $76.6 million, up from $21.3 million in the same quarter the previous year.
- As of March 31, 2006, Health Net had $870.2 million in cash and cash equivalents and $1.4 billion in investments.
This annual report summarizes Amgen's performance in 2000 and outlines goals for the future. Key points include:
- Amgen achieved strong financial results in 2000 and aims to more than double revenues and products on the market in the next five years.
- Goals for the future include launching new products like ARANESP beginning in 2001, expanding R&D capabilities and the product pipeline, and strengthening the organization.
- Four new products could launch in the next 18 months - ARANESP, anakinra, abarelix-depot, and SD/01. R&D spending will increase to nearly $1 billion in 2001 to support pipeline growth.
The document appears to be the 2007 annual report for The Progressive Corporation. It discusses Progressive as being the third largest auto insurance group in the US and largest seller of motorcycle and personal watercraft policies. Progressive is committed to becoming consumers' #1 choice for auto insurance by offering competitive rates and products throughout consumers' lifetimes, as well as superior customer service and claims processing. The annual report's theme for that year is "strategy."
TRW Automotive reported third quarter 2004 financial results with sales of $2.7 billion, an 8% increase over the prior year. Net earnings were $13 million compared to a net loss of $34 million in the prior year. For the first nine months of 2004, sales were $8.8 billion and net earnings were $91 million. TRW revised its full-year 2004 guidance to reflect third quarter results and an expected $115 million fourth quarter charge related to purchasing a subordinated note, with projected sales of $11.8 billion and diluted EPS between $0.08-$0.13.
- The Progressive Corporation reported financial results for March 2004, including a 66% increase in net income compared to March 2003. Net written premiums increased 14% and net earned premiums increased 18%.
- The combined ratio was 82.8%, an improvement of 0.9 percentage points from March 2003. However, unfavorable reserve development from prior accident years increased the loss ratio and combined ratio.
- Policies in force grew 16% for personal lines and 25% for commercial auto business compared to March 2003, driven by strong renewals. Most of Progressive's markets remained profitable in March and for the year to date.
The Progressive Corporation reported its October 2004 results. Progressive's net written premiums increased 9% to $1,279.8 million compared to October 2003. However, net income decreased 4% to $140.2 million due to a 2.3 point increase in the combined ratio to 87.0%. Catastrophic losses from hurricanes added $19.2 million or 1.5 points to the loss ratio for the month. Progressive also repurchased shares during October through a Dutch auction tender offer.
The Progressive Corporation reported financial results for May 2004, with net premiums written up 16% and net income up 14% compared to May 2003. Key highlights included strong growth across personal and commercial lines of business, a combined ratio of 86.6%, and policies in force up 15% for personal lines. Progressive continued to experience profitable growth across most markets.
The Progressive Corporation reported its financial results for July 2004. Net premiums written increased 7% to $1.298 billion compared to July 2003. Net income grew 18% to $168.1 million, while earnings per share rose 19% to $0.77. The combined ratio improved 3.3 percentage points to 82.6. Personal lines net premiums written grew 6% and commercial auto rose 19%. Progressive continued to experience strong profitability with only two unprofitable markets.
- The Progressive Corporation reported financial results for January 2004, including a 16% increase in net premiums written, a 21% increase in net premiums earned, and a 47% increase in net income compared to January 2003.
- Progressive saw growth in both its Personal Lines and Commercial Auto businesses, with personal auto policies in force up 18% and commercial auto policies up 26% compared to the previous year.
- The company had favorable loss development and a combined ratio of 83.0%, reflecting profitable underwriting results for the month.
The Progressive Corporation hosted its 2005 Investor Relations Meeting on May 26th. The meeting included presentations and a question and answer session, lasting approximately three hours. Information from the meeting was made available on the company's website. Progressive also reported its April 2005 results, including a 9% increase in net premiums written compared to April 2004. Net income decreased 6% compared to the same period last year. The combined ratio for April 2005 was 85.3, a 1.2 point increase over April 2004.
The Progressive Corporation reported its November 2004 results:
- Net premiums written increased 7% to $937 million compared to November 2003.
- Net income decreased 6% to $93.8 million compared to November 2003.
- The combined ratio was 89.6%, 2.9 percentage points higher than November 2003.
- For the year-to-date period, net income increased 29% to $1.469 billion compared to the same period in 2003, driven by an 11% increase in direct premiums written and higher investment income.
The Progressive Corporation reported financial results for July 2005:
- Net premiums written increased 8% to $1,403.2 million compared to July 2004.
- Net income decreased 14% to $143.9 million compared to July 2004.
- The combined ratio was 86.9%, 4.3 percentage points higher than July 2004.
- Progressive offers auto insurance to personal and commercial drivers throughout the US.
The Progressive Corporation held a conference call on August 10, 2004 at 9:00am eastern time to address questions from shareholders regarding its quarterly report and Form 10-Q filing with the SEC. Progressive reported positive financial results for June 2004 and the quarter, with net premiums written up 8% and 11% respectively, and net income up 40% and 35% respectively compared to the same periods in 2003. Progressive also saw a 3.8 and 3.4 point improvement in its combined ratio for the month and quarter.
- The Progressive Corporation reported financial results for February 2004, with net premiums written up 12% and net income up 63% compared to February 2003. The combined ratio also improved by 6.1 percentage points.
- Premium growth remained strong, with personal lines policies up 16% and commercial auto policies up 25% year-over-year. Most markets continued experiencing double-digit growth in net written premiums.
- Favorable loss development and ongoing low accident frequency contributed to the improved combined ratio and profitability. Investments continued generating strong returns.
- The Progressive Corporation reported its April 2007 results, with net premiums written down 4% from April 2006 to $1.437 billion and net income down 14% to $136.7 million.
- The combined ratio was 88.8%, up 2.9 percentage points from April 2006, driven by an increase in bodily injury severity.
- Total personal auto policies in force grew 1% to over 7 million while total commercial auto policies grew 6% to over 522,000.
The Progressive Corporation reported financial results for March 2005. Net premiums written increased 5% to $1.127 billion compared to March 2004. Net income decreased 11% to $135.2 million compared to the prior year. Earnings per share fell 3% to $0.67. The combined ratio was 84.8, a deterioration of 2 points from the prior year. Policies in force grew 12% year-over-year for personal lines and 14% for commercial auto.
The Progressive Corporation reported financial results for January 2005. Net premiums written increased 13% to $1.296 billion compared to January 2004. Net income decreased 8% to $149.8 million while earnings per share remained the same at $0.74. The combined ratio increased 2 points to 85.0 due to higher losses and loss adjustment expenses. Policies in force grew 12% for personal lines and 15% for commercial auto business compared to January 2004.
The Progressive Corporation reported financial results for September 2004 and year-to-date. For September, net income increased 28% to $120.5 million compared to the same period last year. Net premiums earned grew 11% to $1.013 billion. The combined ratio was 88.1. For the year-to-date period, net income increased 38% to $1.235 billion, while net premiums earned grew 16% to $9.605 billion. The company also reported total investment returns and provided additional details on expenses and earnings per share.
The Progressive Corporation reported financial results for September 2004, with the following key highlights:
1) Net premiums written increased 10% to $1.002 billion compared to September 2003, and net income increased 28% to $120.5 million.
2) For the quarter, net premiums earned increased 12% to $3.277 billion and net income increased 22% to $388.9 million.
3) The combined ratio for September was 88.1%, a 0.2 point improvement from September 2003.
- The Progressive Corporation reported financial results for April 2006, with net income of $159.6 million, up 8% from April 2005. Net written premiums were $1.489.8 million, up 4% from the previous year. The combined ratio was 85.9 compared to 85.3 in April 2005.
- Total revenues for the year-to-date period ending April 2006 were $5.086.6 billion, up 5% from the same period in 2005. Net income for the year-to-date was $596.2 million, a 6% increase. The combined ratio for the year-to-date was 85.4.
- Progressive offers auto insurance to personal and commercial
The Progressive Corporation reported its April 2008 results. Net premiums written decreased 2% to $1.4 billion. Net income decreased 20% to $108.9 million. The combined ratio increased 2.9 points to 91.7%. Policies in force increased for personal auto and special lines but decreased for commercial auto. Progressive provides auto insurance through both independent agencies and direct channels.
The Progressive Corporation reported its April 2008 results. Net premiums written decreased 2% to $1.4 billion. Net income decreased 20% to $108.9 million. The combined ratio increased 2.9 points to 91.7%. Policies in force increased for personal auto and special lines but decreased for commercial auto. Progressive provides auto insurance through independent agencies and direct channels.
The Progressive Corporation reported its November 2005 results. Net premiums written increased 5% to $986.3 million compared to November 2004. Net income decreased 11% to $83.3 million compared to the prior year. The combined ratio was 89.9%, a 0.3 point increase from November 2004. Progressive incurred losses of $4.2 million from Hurricane Wilma and $3 million from Hurricane Katrina in November, bringing its total losses from the storms to $76.6 million and $188.6 million, respectively.
This document provides supplementary financial information for The Chubb Corporation for the quarter ending March 31, 2005. It includes:
- Consolidated balance sheet highlights showing total invested assets of $31.9 billion.
- Summaries of invested assets by corporate and property/casualty segments.
- Investment income after taxes for corporate and property/casualty segments.
- Property/casualty insurance group statutory surplus of $8.25 billion.
- Changes in net unpaid losses for various lines of business.
- Worldwide underwriting results by line of business, showing a total statutory underwriting income of $134.4 million.
The document provides supplementary investor information from The Chubb Corporation as of June 30, 2005. It includes:
- Consolidated balance sheet highlights showing total invested assets of $32.9 billion including fixed maturities and equity securities.
- Summaries of invested assets for Chubb's Corporate and Property & Casualty segments totaling over $31 billion.
- Investment income after taxes for the second quarter and first half of 2005, with Property & Casualty investment income of $261 million and $513 million respectively.
- Property & Casualty underwriting results for the second quarter and first half of 2005, including a $4.3 billion statutory policyholders' surplus for the P
Supplementary Investor Information Y13880_Edgar_992_0333_finance18
The document provides supplementary investor information for The Chubb Corporation for the third quarter of 2005, including:
1) Consolidated balance sheet highlights and summaries of invested assets for both corporate and property/casualty segments.
2) Property/casualty underwriting results for the first nine months of 2005, showing a statutory underwriting income of $293.6 million.
3) Details of changes in net unpaid losses and the estimated impact of catastrophes including Hurricane Katrina of $511 million pre-tax cost.
The document provides supplementary investor information for The Chubb Corporation as of December 31, 2005. It includes a consolidated balance sheet, details on share repurchase activity, summaries of invested assets and investment income for both corporate and property & casualty segments. It also provides property & casualty underwriting results for 2005 and 2004, including net premiums written and earned, losses incurred and expenses by line of business.
This document provides supplementary financial information for The Chubb Corporation as of March 31, 2006. It includes consolidated balance sheet highlights, share repurchase activity, summaries of invested assets for corporate and property & casualty segments, investment income after taxes, statutory policyholders' surplus, changes in net unpaid losses, and underwriting results for personal, commercial, and specialty insurance lines of business. Key metrics such as loss ratios, expense ratios, and combined ratios are also presented.
This document provides supplementary investor information from The Chubb Corporation for the period ending June 30, 2006. It includes consolidated balance sheet highlights, share repurchase activity, summaries of invested assets, investment income after taxes, statutory policyholders' surplus, changes in net unpaid losses, and underwriting results by line of business for year-to-date and quarterly periods. Key metrics such as loss ratios, expense ratios, and combined ratios are presented.
The document provides financial information for The Chubb Corporation as of September 30, 2006. It includes highlights of consolidated balance sheet items, share repurchase activity, summaries of invested assets and investment income for both corporate and property/casualty segments. Details are also given on property/casualty underwriting results for various lines of business on a year-to-date and quarterly basis, including ratios and comparisons to prior periods. Key terms are defined at the end.
This document provides supplementary investor information from The Chubb Corporation for the period ending December 31, 2006. It includes highlights of consolidated balance sheet items, summaries of invested assets, investment income after taxes, statutory policyholders' surplus, changes in unpaid losses, and worldwide property and casualty underwriting results for 2006 and 2005. Specifically, total invested assets increased to $37.7 billion in 2006 from $34.6 billion in 2005. Net income after taxes from investments was $1.2 billion for property and casualty in 2006. Statutory policyholders' surplus grew to $11.3 billion in 2006 from $8.9 billion in 2005.
This document provides a summary of financial information for The Chubb Corporation as of March 31, 2007. Some key highlights include:
- Total invested assets were $38.7 billion as of March 31, 2007, with fixed maturities making up the majority.
- Statutory policyholders' surplus for Chubb's property and casualty insurance group was estimated at $11.95 billion as of March 31, 2007, with a ratio of statutory net premiums written to surplus of 1.00 to 1.
- For the three months ended March 31, 2007, Chubb's worldwide property and casualty underwriting results showed a total underwriting income of $202 million for personal insurance and $144 million
This document provides supplementary investor information from The Chubb Corporation for the period ending June 30, 2007. It includes highlights of Chubb's consolidated balance sheet, share repurchase activity, summaries of invested assets for Corporate and Property & Casualty segments, and investment income after taxes. Key metrics provided are total invested assets of $39.5 billion, shareholders' equity of $13.8 billion, and year-to-date Property & Casualty investment income of $360 million.
This document provides supplementary investor information for The Chubb Corporation, including consolidated balance sheet highlights, share repurchase activity, summaries of invested assets, investment income after taxes, statutory policyholders' surplus, changes in net unpaid losses, and underwriting results for both the nine months and quarters ended September 30, 2007 and 2006. Key figures include total invested assets of $40.5 billion, shareholders' equity of $14.2 billion, and worldwide property and casualty underwriting income of $543 million for the nine months ended September 30, 2007.
This document provides supplementary financial information for The Chubb Corporation as of December 31, 2007. It includes highlights of consolidated balance sheets, share repurchase activity, summaries of invested assets, investment income after taxes for corporate and property/casualty divisions, statutory policyholder surplus, changes in unpaid losses, and underwriting results by line of business for 2007 and 2006.
This document provides financial information about Chubb Corporation's property and casualty underwriting results for 2007 and 2006. It summarizes key metrics like net premiums written, losses incurred, expenses incurred, underwriting income, and combined loss/expense ratios for different business lines including personal, commercial, and specialty insurance. It also notes that beginning in 2008, foreign currency fluctuations will be accounted for differently in the reporting of losses paid and outstanding losses. Overall underwriting income increased from $1.886 billion to $2.064 billion from 2006 to 2007.
The document provides supplementary financial information for Chubb Corporation as of March 31, 2008. Key highlights include:
- Total invested assets were $40.1 billion, with fixed maturities making up the majority.
- Statutory policyholders' surplus for property and casualty insurance was estimated at $13.3 billion, with a ratio of net premiums written to surplus of 0.9 to 1.
- For the three months ended March 31, 2008, worldwide underwriting resulted in a total profit of $138 million for commercial lines and $164 million for personal lines. Loss and expense ratios remained high but stable.
The document is a report from The Chubb Corporation detailing changes to how losses are presented in their property and casualty underwriting results. Specifically, beginning in Q3 2008, foreign currency fluctuations will impact "net losses paid" and "increase (decrease) in outstanding losses" differently than before. The report provides definitions, ratios, and quarterly underwriting results for Q1 2008 and 2007 to reflect these presentation modifications. Incurred losses remain unchanged.
This document provides supplementary investor information from The Chubb Corporation, including:
- Consolidated balance sheet highlights and share repurchase activity as of June 30, 2008.
- Summaries of invested assets for Corporate and Property & Casualty segments.
- Investment income after taxes for Corporate and Property & Casualty segments for the second quarter and first six months of 2008 versus 2007.
- Property & Casualty statutory policyholders' surplus, change in net unpaid losses, and underwriting results by line of business for the first half of 2008 versus the same period in 2007.
This document from Chubb Corporation reports modifications to the presentation of losses incurred in property and casualty underwriting results for the six months ended June 30, 2008 and 2007. Specifically, it notes that beginning in Q3 2008, foreign currency fluctuations will be reflected differently in "net losses paid" and "increase (decrease) in outstanding losses", though incurred losses remain unchanged. It provides definitions of key terms like underwriting income/loss and combined loss/expense ratio used to evaluate underwriting performance. The document then presents detailed underwriting results by line of business and geographic region.
This document provides supplementary investor information from The Chubb Corporation for the quarter ending September 30, 2008. It includes a consolidated balance sheet, share repurchase activity, summaries of invested assets for corporate and property & casualty divisions, and investment income and underwriting results. Beginning in Q3 2008, foreign currency fluctuations will impact property & casualty loss reporting differently than in the past.
This document provides supplementary financial information for The Chubb Corporation as of December 31, 2008. It includes highlights of the consolidated balance sheet, share repurchase activity, summaries of invested assets for the Corporate and Property and Casualty segments, and investment income. It also contains information on statutory policyholders' surplus, changes in unpaid losses, and underwriting results for year-to-date and quarterly periods for the Property and Casualty Insurance Group. Key terms are defined at the end.
How to Invest in Cryptocurrency for Beginners: A Complete GuideDaniel
Cryptocurrency is digital money that operates independently of a central authority, utilizing cryptography for security. Unlike traditional currencies issued by governments (fiat currencies), cryptocurrencies are decentralized and typically operate on a technology called blockchain. Each cryptocurrency transaction is recorded on a public ledger, ensuring transparency and security.
Cryptocurrencies can be used for various purposes, including online purchases, investment opportunities, and as a means of transferring value globally without the need for intermediaries like banks.
Fabular Frames and the Four Ratio ProblemMajid Iqbal
Digital, interactive art showing the struggle of a society in providing for its present population while also saving planetary resources for future generations. Spread across several frames, the art is actually the rendering of real and speculative data. The stereographic projections change shape in response to prompts and provocations. Visitors interact with the model through speculative statements about how to increase savings across communities, regions, ecosystems and environments. Their fabulations combined with random noise, i.e. factors beyond control, have a dramatic effect on the societal transition. Things get better. Things get worse. The aim is to give visitors a new grasp and feel of the ongoing struggles in democracies around the world.
Stunning art in the small multiples format brings out the spatiotemporal nature of societal transitions, against backdrop issues such as energy, housing, waste, farmland and forest. In each frame we see hopeful and frightful interplays between spending and saving. Problems emerge when one of the two parts of the existential anaglyph rapidly shrinks like Arctic ice, as factors cross thresholds. Ecological wealth and intergenerational equity areFour at stake. Not enough spending could mean economic stress, social unrest and political conflict. Not enough saving and there will be climate breakdown and ‘bankruptcy’. So where does speculative design start and the gambling and betting end? Behind each fabular frame is a four ratio problem. Each ratio reflects the level of sacrifice and self-restraint a society is willing to accept, against promises of prosperity and freedom. Some values seem to stabilise a frame while others cause collapse. Get the ratios right and we can have it all. Get them wrong and things get more desperate.
Confirmation of Payee (CoP) is a vital security measure adopted by financial institutions and payment service providers. Its core purpose is to confirm that the recipient’s name matches the information provided by the sender during a banking transaction, ensuring that funds are transferred to the correct payment account.
Confirmation of Payee was built to tackle the increasing numbers of APP Fraud and in the landscape of UK banking, the spectre of APP fraud looms large. In 2022, over £1.2 billion was stolen by fraudsters through authorised and unauthorised fraud, equivalent to more than £2,300 every minute. This statistic emphasises the urgent need for robust security measures like CoP. While over £1.2 billion was stolen through fraud in 2022, there was an eight per cent reduction compared to 2021 which highlights the positive outcomes obtained from the implementation of Confirmation of Payee. The number of fraud cases across the UK also decreased by four per cent to nearly three million cases during the same period; latest statistics from UK Finance.
In essence, Confirmation of Payee plays a pivotal role in digital banking, guaranteeing the flawless execution of banking transactions. It stands as a guardian against fraud and misallocation, demonstrating the commitment of financial institutions to safeguard their clients’ assets. The next time you engage in a banking transaction, remember the invaluable role of CoP in ensuring the security of your financial interests.
For more details, you can visit https://technoxander.com.
Budgeting as a Control Tool in Government Accounting in Nigeria
Being a Paper Presented at the Nigerian Maritime Administration and Safety Agency (NIMASA) Budget Office Staff at Sojourner Hotel, GRA, Ikeja Lagos on Saturday 8th June, 2024.
Dr. Alyce Su Cover Story - China's Investment Leadermsthrill
In World Expo 2010 Shanghai – the most visited Expo in the World History
https://www.britannica.com/event/Expo-Shanghai-2010
China’s official organizer of the Expo, CCPIT (China Council for the Promotion of International Trade https://en.ccpit.org/) has chosen Dr. Alyce Su as the Cover Person with Cover Story, in the Expo’s official magazine distributed throughout the Expo, showcasing China’s New Generation of Leaders to the World.
Monthly Market Risk Update: June 2024 [SlideShare]Commonwealth
Markets rallied in May, with all three major U.S. equity indices up for the month, said Sam Millette, director of fixed income, in his latest Market Risk Update.
For more market updates, subscribe to The Independent Market Observer at https://blog.commonwealth.com/independent-market-observer.
Explore the world of investments with an in-depth comparison of the stock market and real estate. Understand their fundamentals, risks, returns, and diversification strategies to make informed financial decisions that align with your goals.
Navigating Your Financial Future: Comprehensive Planning with Mike Baumannmikebaumannfinancial
Learn how financial planner Mike Baumann helps individuals and families articulate their financial aspirations and develop tailored plans. This presentation delves into budgeting, investment strategies, retirement planning, tax optimization, and the importance of ongoing plan adjustments.
“Amidst Tempered Optimism” Main economic trends in May 2024 based on the results of the New Monthly Enterprises Survey, #NRES
On 12 June 2024 the Institute for Economic Research and Policy Consulting (IER) held an online event “Economic Trends from a Business Perspective (May 2024)”.
During the event, the results of the 25-th monthly survey of business executives “Ukrainian Business during the war”, which was conducted in May 2024, were presented.
The field stage of the 25-th wave lasted from May 20 to May 31, 2024. In May, 532 companies were surveyed.
The enterprise managers compared the work results in May 2024 with April, assessed the indicators at the time of the survey (May 2024), and gave forecasts for the next two, three, or six months, depending on the question. In certain issues (where indicated), the work results were compared with the pre-war period (before February 24, 2022).
✅ More survey results in the presentation.
✅ Video presentation: https://youtu.be/4ZvsSKd1MzE
Economic trends from a business point of view (May 2024)
progressive mreport-04/04
1. NEWS
RELEASE
The Progressive Corporation Company Contact:
6300 Wilson Mills Road Thomas A. King
Mayfield Village, Ohio 44143 (440) 395-2260
http://www.progressive.com
FOR IMMEDIATE RELEASE
MAYFIELD VILLAGE, OHIO -- May 13, 2004 -- The Progressive Corporation today reported the following results for April 2004:
($ in millions, except per share amounts) April April
2004 2003 Change
Net premiums written $1,315.7 $1,191.0 10%
Net premiums earned 1,230.4 1,045.7 18%
Net income 157.1 105.4 49%
Per share .71 .48 50%
Combined ratio 84.1 88.3 4.2 pts.
See the “Income Statement” for further information.
Progressive’s Personal Lines business units write insurance for private passenger automobiles and recreation vehicles.
Progressive’s Commercial Auto business unit writes primary liability, physical damage and other auto-related insurance for
automobiles and trucks owned by small businesses. The Company’s other businesses principally include writing directors’ and
officers’ liability insurance and managing the wind down of the Company’s lender’s collateral protection program. See
“Supplemental Information” for the month and year-to-date results.
-1-
2. THE PROGRESSIVE CORPORATION AND SUBSIDIARIES
INCOME STATEMENT
April 2004
(millions – except per share amounts)
(unaudited)
Current
Comments on Monthly Results1
Month
Direct premiums written $1,350.6
Net premiums written $1,315.7
Revenues:
Net premiums earned $1,230.4
Investment income 39.9
Net realized gains on securities 4.6
Service revenues 4.7
Other income .2 Reflects additional interest collected on an income tax refund the
Company previously received for tax years 1993-1998.
Total revenues 1,279.8
Expenses:
Losses and loss adjustment expenses 772.2
132.6
Policy acquisition costs
Other underwriting expenses 129.3 Includes an estimated accrual for several pending class action lawsuits.
Investment expenses 1.0
Service expenses 2.5
Interest expense 6.5
Total expenses 1,044.1
Income before income taxes 235.7
Provision for income taxes 78.6
Net income $157.1
COMPUTATION OF EARNINGS PER SHARE
Basic:
Average shares outstanding 216.5
Per share $.73
Diluted:
Average shares outstanding 216.5
Net effect of dilutive stock-based
compensation 3.6
Total equivalent shares 220.1
Per share $.71
1
See the Monthly Commentary at the end of this release for additional discussion. Also see the Company’s 2003 Annual Report at
progressive.com/annualreport for a complete description of its reporting and accounting policies.
The following table sets forth the total return for the month:
Fully taxable equivalent total return:
Fixed income securities (1.7)%
Common stocks (1.8)%
Total portfolio (1.7)%
-2-
3. THE PROGRESSIVE CORPORATION AND SUBSIDIARIES
INCOME STATEMENTS
April 2004
(millions – except per share amounts)
(unaudited)
Year-to-Date
%
2004 2003 Change
Direct premiums written $4,708.9 $4,163.4 13
Net premiums written $4,593.0 $4,070.3 13
Revenues:
Net premiums earned $4,323.9 $3,644.0 19
Investment income 154.8 150.6 3
Net realized gains (losses) on securities 64.1 5.3 1109
Service revenues 17.3 12.6 37
Total revenues 4,560.1 3,812.5 20
Expenses:
Losses and loss adjustment expenses 2,734.3 2,457.0 11
Policy acquisition costs 466.6 403.6 16
Other underwriting expenses 405.5 316.1 28
Investment expenses 4.3 3.8 13
Service expenses 8.0 8.5 (6)
Interest expense 27.0 32.2 (16)
Total expenses 3,645.7 3,221.2 13
Income before income taxes 914.4 591.3 55
Provision for income taxes 297.3 194.4 53
Net income $617.1 $396.9 55
COMPUTATION OF EARNINGS PER SHARE
Basic:
Average shares outstanding 216.4 217.8 (1)
Per share $2.85 $1.82 56
Diluted:
Average shares outstanding 216.4 217.8 (1)
Net effect of dilutive stock-based
compensation 3.6 3.5 3
Total equivalent shares 220.0 221.3 (1)
Per share $2.81 $1.79 56
The following table sets forth the total return for the year-to-date period:
2004 2003
Fully taxable equivalent total return:
Fixed income securities .5% 2.3%
Common stocks .0% 4.4%
Total portfolio .5% 2.6%
-3-
4. THE PROGRESSIVE CORPORATION AND SUBSIDIARIES
SUPPLEMENTAL INFORMATION
April 2004
($ in millions)
(unaudited)
Current Month
Commercial
Personal Lines Auto Other Companywide
Agency Direct Total Business Businesses Total
Net Premiums Written $783.9 $363.6 $1,147.5 $166.5 $1.7 $1,315.7
% Growth in NPW 9% 15% 11% 13% (78)% 10%
Net Premiums Earned $742.2 $345.7 $1,087.9 $139.5 $3.0 $1,230.4
% Growth in NPE 15% 22% 17% 27% (57)% 18%
GAAP Ratios
Loss/LAE Ratio 63.1 62.0 62.8 62.5 67.4 62.8
Expense Ratio 21.3 21.9 21.5 19.4 47.7 21.3
Combined Ratio 84.4 83.9 84.3 81.9 115.1 84.1
Actuarial Adjustments1
Total Calendar Year Adjustment
Favorable (Unfavorable) $2.1 $2.2 $4.3 $(.6) $(.2) $3.5
Reserve Decrease/(Increase)
Prior accident years $8.4
Current accident year (4.9)
Calendar year actuarial adjustment $3.5
Prior Accident Years Development
Favorable/(Unfavorable)
Actuarial adjustment $8.4
All other development 1.1
Total development $9.5
Calendar year loss/LAE Ratio 62.8
Accident year loss/LAE Ratio 63.6
Statutory Ratios
Loss/LAE Ratio 62.8
Expense Ratio 20.4
Combined Ratio 83.2
1
Represents adjustments solely based on the Company’s corporate actuarial review.
-4-
5. THE PROGRESSIVE CORPORATION AND SUBSIDIARIES
SUPPLEMENTAL INFORMATION
April 2004
($ in millions)
(unaudited)
Year-to-Date
Commercial
Personal Lines Auto Other Companywide
Agency Direct Total Business Businesses Total
Net Premiums Written $2,741.0 $1,301.5 $4,042.5 $542.7 $7.8 $4,593.0
% Growth in NPW 11% 17% 13% 17% (70)% 13%
Net Premiums Earned $2,613.6 $1,211.6 $3,825.2 $486.3 $12.4 $4,323.9
% Growth in NPE 16% 22% 18% 27% (50)% 19%
GAAP Ratios
Loss/LAE Ratio 64.2 63.2 63.9 58.0 69.2 63.2
Expense Ratio 20.1 20.8 20.3 18.8 33.1 20.2
Combined Ratio 84.3 84.0 84.2 76.8 102.3 83.4
Actuarial Adjustments1
Total Calendar Year Adjustment
Favorable/(Unfavorable) $9.2 $4.8 $14.0 $1.4 $(.4) $15.0
Reserve Decrease/(Increase)
Prior accident years $19.8
Current accident year (4.8)
Calendar year actuarial adjustment $15.0
Prior Accident Years Development
Favorable/(Unfavorable)
Actuarial adjustment $19.8
All other development (33.2)
Total development $(13.4)
Calendar year loss/LAE Ratio 63.2
Accident year loss/LAE Ratio 62.9
Statutory Ratios
Loss/LAE Ratio 63.3
Expense Ratio 19.4
Combined Ratio 82.7
Statutory Surplus $5,095.9
April April
Policies in Force 2004 2003 Change
(in thousands)
Agency – Auto 4,162 3,694 13%
Direct – Auto 1,969 1,681 17%
Other Personal Lines2 2,132 1,774 20%
Total Personal Lines 8,263 7,149 16%
Commercial Auto Business 392 316 24%
1
Represents adjustments solely based on the Company’s corporate actuarial review.
2
Includes insurance for motorcycles, recreation vehicles, mobile homes, watercraft, snowmobiles, homeowners and similar items.
-5-
6. THE PROGRESSIVE CORPORATION AND SUBSIDIARIES
BALANCE SHEET AND OTHER INFORMATION
(millions– except per share amounts)
(unaudited)
April
2004
CONDENSED GAAP BALANCE SHEET:1
Investments -
Available-for-sale:
Fixed maturities, at market (amortized cost: $9,074.0) $9,144.1
Equity securities, at market:
Preferred stocks (cost: $820.6) 829.1
Common equities (cost: $1,598.1) 1,964.2
Short-term investments, at amortized cost (market: $2,168.3) 2,168.3
Total investments2 14,105.7
Net premiums receivable 2,311.6
Deferred acquisition costs 444.1
Other assets 1,227.9
Total assets $18,089.3
Unearned premiums $4,173.1
Loss and loss adjustment expense reserves 4,775.3
Other liabilities2 2,343.7
Debt 1,289.9
Shareholders’ equity 5,507.3
Total liabilities and shareholders’ equity $18,089.3
Common Shares outstanding 217.4
Shares repurchased – April .3
Average cost per share $88.57
Book value per share $25.33
Return on average shareholders’ equity 29.6%
Net unrealized pre-tax gains on investments $444.7
Debt to total capital ratio 19.0%
1
Pursuant to SFAS 113, “Accounting and Reporting for Reinsurance of Short-Duration and Long-
Duration Contracts,” loss and loss adjustment expense reserves are stated gross of reinsurance
recoverables on unpaid losses of $243.1 million.
2
Amounts include net unsettled security acquisitions of $1,054.1 million.
-6-
7. Monthly Commentary
♦
April continued the trend the Company has been seeing with exceptional profitability and slowing written premium
growth. Only one market in which the Company writes Personal Lines business was unprofitable for the month
(primarily due to a catastrophe loss); for the year-to-date period, all Personal Lines markets were profitable.
♦
Favorable reserve development decreased the combined ratio .8 points for April; year-to-date there was
unfavorable development of .3 points.
♦
Policies in force growth remained strong, supported by strong renewals. In Personal Lines, 13 markets have year-
to-date net premiums written growth of 20% or greater; these markets represent 23% of the total Personal Lines
premiums. Thirteen states (36% of total Personal Lines) grew less than 10%.
♦
In general, the Company saw modest increases in retention measures for the month in most of the Agency and
Direct auto tiers.
♦
The expense ratio of 21.3 for the month was higher than both year-to-date 2004 and April 2003, largely driven by
one-time items, but also reflecting increased media spending and employee medical benefits costs.
♦ At April month-end, the net unrealized gains in the investment portfolio were $444.7 million, a decrease of $198.7
million from year-end 2003. The pretax recurring investment book yield of the portfolio was 3.8% for both the
month and year-to-date. In the fixed-income portfolio, the duration was 2.9 years and the weighted average credit
quality was AA.
The Progressive group of insurance companies ranks third in the nation for auto insurance based on premiums written,
offering its products by phone at 1-800-PROGRESSIVE, online at progressive.com and through more than 30,000
independent agencies and insurance brokers. The Common Shares of The Progressive Corporation, the holding
company, are publicly traded at NYSE:PGR.
Safe Harbor Statement under the Private Securities Litigation Reform Act of 1995: Statements in this release that are not
historical fact are forward-looking statements that are subject to certain risks and uncertainties that could cause actual events and
results to differ materially from those discussed herein. These risks and uncertainties include, without limitation, uncertainties
related to estimates, assumptions and projections generally; inflation and changes in economic conditions (including changes in
interest rates and financial markets); the accuracy and adequacy of the Company’s pricing and loss reserving methodologies;
pricing competition and other initiatives by competitors; the Company’s ability to obtain regulatory approval for requested rate
changes and the timing thereof; the effectiveness of the Company’s advertising campaigns; legislative and regulatory
developments; the outcome of litigation pending or that may be filed against the Company; weather conditions (including the
severity and frequency of storms, hurricanes, snowfalls, hail and winter conditions); changes in driving patterns and loss trends;
acts of war and terrorist activities; court decisions and trends in litigation and health care and auto repair costs; and other
matters described from time to time by the Company in releases and publications, and in periodic reports and other documents
filed with the United States Securities and Exchange Commission. In addition, investors should be aware that generally accepted
accounting principles prescribe when a company may reserve for particular risks, including litigation exposures. Accordingly,
results for a given reporting period could be significantly affected if and when a reserve is established for a major contingency.
Reported results, therefore, may appear to be volatile in certain accounting periods.
-7-