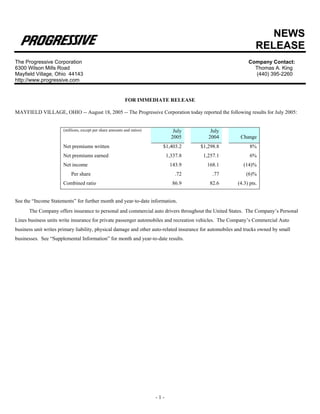
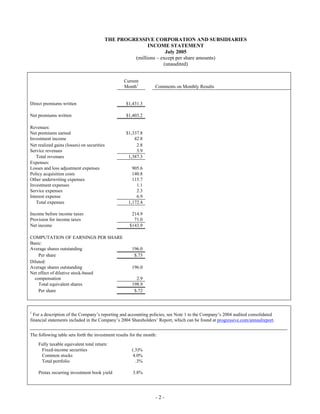
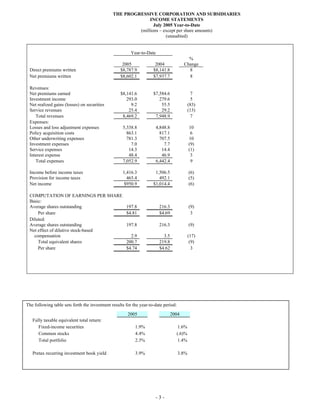
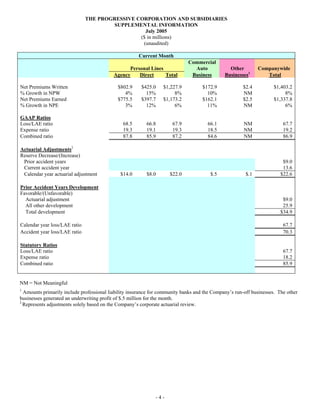
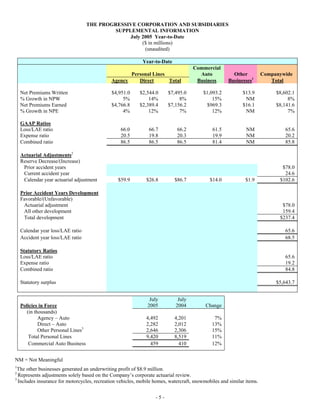
The Progressive Corporation reported its July 2005 results, including:
- Net premiums written increased 8% to $1.403 billion compared to July 2004.
- Net income decreased 14% to $143.9 million compared to July 2004.
- The combined ratio, a measure of profitability, increased 4.3 percentage points to 86.9% compared to July 2004.
- Total policies in force increased 11% to 9.42 million compared to July 2004, driven by growth in personal and commercial auto insurance policies.
The Progressive Corporation reported its results for May 2005. Net premiums written increased 2% compared to May 2004. Net income increased 16% to $126.1 million, while earnings per share increased 27% to $0.63. The combined ratio improved 0.8 percentage points to 85.8%. Personal lines policies in force grew 11% year-over-year.
The Progressive Corporation reported financial results for February 2005, with net premiums written up 12% and net income down 12% compared to February 2004. Progressive saw growth in both its Personal and Commercial Auto business lines. The combined ratio was 85.2%, an increase of 1.5 percentage points from the prior year. Policies in force increased 12% overall, with growth across all business segments.
The Progressive Corporation reported its April 2008 results. Net premiums written decreased 2% to $1.4 billion. Net income decreased 20% to $108.9 million. The combined ratio increased 2.9 points to 91.7%. Policies in force increased for personal auto and special lines but decreased for commercial auto. Progressive provides auto insurance through independent agencies and direct channels.
The Progressive Corporation reported financial results for May 2004, with net premiums written up 16% and net income up 14% compared to May 2003. Key highlights included strong growth across personal and commercial lines of business, a combined ratio of 86.6%, and continued profitability in all but three personal lines markets. Policies in force also grew 15% year-over-year. Progressive continued to experience catastrophe losses which contributed to a higher loss ratio for the month.
The Progressive Corporation reported its October 2004 results. Net premiums written increased 9% to $1.279.8 million compared to October 2003. Net income decreased 4% to $140.2 million while the combined ratio increased 2.3 percentage points to 87.0%. Progressive continues to respond to claims from hurricanes in August and September, with losses representing 1.5 percentage points of the loss ratio for the month. On October 22, Progressive repurchased 16.9 million shares for $1.5 billion through a Dutch auction tender offer.
The Progressive Corporation reported financial results for March 2005. Net premiums written increased 5% to $1.127 billion compared to March 2004. Net income decreased 11% to $135.2 million compared to the prior year. Earnings per share fell 3% to $0.67. The combined ratio was 84.8, an increase of 2 percentage points from the prior year. Policies in force grew 12% year-over-year for personal lines and 14% for commercial auto.
The Progressive Corporation reported its financial results for July 2004. Net premiums written increased 7% to $1.298 billion compared to July 2003. Net income grew 18% to $168.1 million, while earnings per share rose 19% to $0.77. The combined ratio improved 3.3 percentage points to 82.6. Personal lines net premiums written grew 6% and commercial auto rose 19%. Progressive continued to experience strong profitability with only two unprofitable markets.
- The Progressive Corporation reported its April 2007 results, with net premiums written down 4% from April 2006 to $1.437 billion and net income down 14% to $136.7 million.
- The combined ratio was 88.8%, up 2.9 percentage points from April 2006, driven by an increase in bodily injury severity.
- Total personal auto policies in force grew 1% to over 7 million while total commercial auto policies grew 6% to over 522,000.
The Progressive Corporation held a conference call to discuss its quarterly financial results. For the second quarter of 2005, the Company's net written premiums increased 7% to $3.594 billion and net income increased 2% to $394.3 million compared to the same period in 2004. The combined ratio, a measure of profitability, improved slightly to 86.1% from 85.4% the prior year. The Company also reported that its conference call to discuss third quarter results is scheduled for August 9, 2005.
1) The Progressive Corporation reported its October 2006 results including net premiums written of $1,315.8 million, down 1% from October 2005, and net income of $130.1 million, up 73% from the previous year.
2) Progressive's combined ratio was 89.1 for October 2006, an improvement of 5.1 percentage points from 94.2 in October 2005.
3) Progressive offers auto insurance to personal and commercial drivers throughout the United States, writing policies for private passenger vehicles, recreational vehicles, and automobiles and trucks owned by small businesses.
The Progressive Corporation reported its November 2005 results. Net premiums written increased 5% to $986.3 million compared to November 2004. Net income decreased 11% to $83.3 million compared to the prior year. The combined ratio was 89.9%, a 0.3 point increase from November 2004. Progressive incurred losses of $4.2 million from Hurricane Wilma and $3 million from Hurricane Katrina in November, bringing its total losses from the storms to $76.6 million and $188.6 million, respectively.
- The Progressive Corporation reported financial results for February 2004, with net premiums written up 12% and net income up 63% compared to February 2003.
- Net income was $145.1 million or $0.66 per share, with a combined ratio of 83.7%.
- Personal Lines policies in force grew 16% year-over-year while Commercial Auto policies grew 25%. Premium growth rates declined as expected but remained strong.
Progressive reported its results for March 2007. Net income decreased 16% to $131.1 million compared to March 2006. The combined ratio increased 4.9 points to 88.2. For the quarter, net income decreased 17% to $363.5 million and the combined ratio increased 4.3 points to 89.5. Progressive saw unfavorable development from prior accident years, primarily related to larger losses emerging from prior years in commercial auto.
The Progressive Corporation reported financial results for April 2004, with the following key highlights:
- Net premiums written increased 10% to $1.315 billion compared to April 2003.
- Net income increased 49% to $157.1 million compared to April 2003.
- The combined ratio improved 4.2 percentage points to 84.1% from 88.3% in April 2003.
- Personal lines policies in force grew 16% year-over-year and commercial auto policies grew 24%.
This document provides an overview and summary of The Progressive Corporation's 2006 Report on Loss Reserving Practices. The report examines Progressive's loss reserving process and how it affects their financial results. It includes sections on their financial objectives, how reserve development affects financial reporting, the different types of reserves, how reserves are estimated by segment, and recent process enhancements. The goal is to help stakeholders understand Progressive's loss reserving methodology and ensure reserves are adequate while developing with minimal variation over time.
The Progressive Corporation reported financial results for the second quarter of 2006, with net premiums written growing 2% over the same period in 2005. While profits remained strong, with an underwriting margin of 14.1%, growth was lower than expected. Progressive saw the greatest growth challenges in their Drive brand within the independent agency channel. They are also seeing a shift to more customers researching and initiating quotes online rather than by phone. Commercial auto grew policies by 9% in the quarter. Progressive aims to balance further profitability and growth by enhancing their brands and marketing to attract more customers in all channels.
This annual report summarizes Amgen's performance in 2000 and outlines goals for the future. Key points include:
- Amgen achieved strong financial results in 2000 and aims to more than double revenues and products on the market in the next five years.
- Goals for the future include launching new products like ARANESP beginning in 2001, expanding R&D capabilities and the product pipeline, and strengthening the organization.
- Four new products could launch in the next 18 months - ARANESP, anakinra, abarelix-depot, and SD/01. R&D spending will increase to nearly $1 billion in 2001 to support pipeline growth.
This document is a quarterly report filed with the SEC by Health Net, Inc. for the quarter ended March 31, 2006. It includes financial statements such as the consolidated statements of operations and balance sheets, as well as notes to the financial statements. Some key details include:
- Revenues for the quarter were $3.2 billion, up from $2.9 billion in the same quarter the previous year.
- Net income for the quarter was $76.6 million, up from $21.3 million in the same quarter the previous year.
- As of March 31, 2006, Health Net had $870.2 million in cash and cash equivalents and $1.4 billion in investments.
The document appears to be the 2007 annual report for The Progressive Corporation. It discusses Progressive as being the third largest auto insurance group in the US and largest seller of motorcycle and personal watercraft policies. Progressive is committed to becoming consumers' #1 choice for auto insurance by offering competitive rates and products throughout consumers' lifetimes, as well as superior customer service and claims processing. The annual report's theme for that year is "strategy."
TRW Automotive reported third quarter 2004 financial results with sales of $2.7 billion, an 8% increase over the prior year. Net earnings were $13 million compared to a net loss of $34 million in the prior year. For the first nine months of 2004, sales were $8.8 billion and net earnings were $91 million. TRW revised its full-year 2004 guidance to reflect third quarter results and an expected $115 million fourth quarter charge related to purchasing a subordinated note, with projected sales of $11.8 billion and diluted EPS between $0.08-$0.13.
The Progressive Corporation reported its results for May 2005. Net premiums written increased 2% compared to May 2004. Net income increased 16% to $126.1 million, while earnings per share increased 27% to $0.63. The combined ratio improved 0.8 percentage points to 85.8%. Personal lines policies in force grew 11% year-over-year.
- The Progressive Corporation reported financial results for February 2005, with net premiums written up 12% and net income down 12% compared to February 2004.
- Personal lines policies in force grew 12% year over year while commercial auto policies in force rose 14%.
- The combined ratio was 85.2% for February 2005, an increase of 1.5 percentage points from February 2004, driven partly by lower favorable reserve development on prior accident years.
The Progressive Corporation reported its November 2005 results. Net premiums written increased 5% to $986.3 million compared to November 2004. Net income decreased 11% to $83.3 million compared to the prior year. The combined ratio was 89.9%, a 0.3 point increase from November 2004. Progressive incurred losses of $4.2 million from Hurricane Wilma and $3 million from Hurricane Katrina in November, bringing its total losses from the storms to $76.6 million and $188.6 million, respectively.
The Progressive Corporation reported its financial results for July 2004. Net premiums written increased 7% to $1.298 billion compared to July 2003. Net income grew 18% to $168.1 million, while earnings per share rose 19% to $0.77. The combined ratio improved 3.3 percentage points to 82.6. Personal lines net premiums written grew 6% and commercial auto rose 19%. Progressive continued to experience strong profitability with only two unprofitable markets.
The Progressive Corporation hosted its 2005 Investor Relations Meeting on May 26th. The meeting included presentations and a question and answer session, lasting approximately three hours. Information from the meeting was made available on the company's website. Progressive also reported its April 2005 results, with net premiums written up 9% and net income down 6% compared to April 2004. The company will continue to offer auto insurance to personal and commercial drivers throughout the US.
The Progressive Corporation hosted its 2005 Investor Relations Meeting on May 26th. The meeting included presentations and a question and answer session, lasting approximately three hours. Information from the meeting was made available on the company's website. Progressive also reported its April 2005 results, including a 9% increase in net premiums written compared to April 2004. Net income decreased 6% compared to the same period last year. The combined ratio for April 2005 was 85.3, a 1.2 point increase over April 2004.
The Progressive Corporation held a conference call to discuss its quarterly financial results. For the second quarter of 2005, the Company's net written premiums increased 7% to $3.594 billion and net income increased 2% to $394.3 million compared to the same period in 2004. The combined ratio, a measure of profitability, improved slightly to 86.1% from 85.4% the prior year. The Company also reported that its conference call to discuss third quarter results is scheduled for August 9, 2005.
The Progressive Corporation reported its October 2005 results. Net premiums written increased 4% to $1.328 billion compared to October 2004. Net income decreased 46% to $75.4 million compared to the same period last year. The combined ratio was 94.2, a deterioration of 7.2 points from October 2004, due to $84.4 million in losses from Hurricanes Wilma and Katrina. Progressive provides auto insurance to personal and commercial drivers throughout the US.
The Progressive Corporation reported its October 2005 results. Net premiums written increased 4% to $1.328 billion compared to October 2004. Net income decreased 46% to $75.4 million compared to the same period last year. The combined ratio was 94.2, a deterioration of 7.2 points from October 2004, due to $84.4 million in losses from Hurricanes Wilma and Katrina. Progressive also provided supplemental information on premiums written and earned, loss ratios, expense ratios, and policies in force by business segment.
The Progressive Corporation reported financial results for March 2005. Net premiums written increased 5% to $1.127 billion compared to March 2004. Net income decreased 11% to $135.2 million compared to the prior year. Earnings per share fell 3% to $0.67. The combined ratio was 84.8, a deterioration of 2 points from the prior year. Policies in force grew 12% year-over-year for personal lines and 14% for commercial auto.
The Progressive Corporation held a conference call to discuss its quarterly financial results. For the second quarter of 2005, the Company's net written premiums increased 7% to $3.594 billion and net income increased 2% to $394.3 million compared to the same period in 2004. The combined ratio, a measure of profitability, improved slightly to 86.1% from 85.4% the prior year. The Company also reported that its conference call to discuss third quarter results is scheduled for August 9, 2005.
1) The Progressive Corporation reported its October 2006 results including net premiums written of $1,315.8 million, down 1% from October 2005, and net income of $130.1 million, up 73% from the previous year.
2) Progressive's combined ratio was 89.1 for October 2006, an improvement of 5.1 percentage points from 94.2 in October 2005.
3) Progressive offers auto insurance to personal and commercial drivers throughout the United States, writing policies for private passenger vehicles, recreational vehicles, and automobiles and trucks owned by small businesses.
The Progressive Corporation reported its November 2005 results. Net premiums written increased 5% to $986.3 million compared to November 2004. Net income decreased 11% to $83.3 million compared to the prior year. The combined ratio was 89.9%, a 0.3 point increase from November 2004. Progressive incurred losses of $4.2 million from Hurricane Wilma and $3 million from Hurricane Katrina in November, bringing its total losses from the storms to $76.6 million and $188.6 million, respectively.
- The Progressive Corporation reported financial results for February 2004, with net premiums written up 12% and net income up 63% compared to February 2003.
- Net income was $145.1 million or $0.66 per share, with a combined ratio of 83.7%.
- Personal Lines policies in force grew 16% year-over-year while Commercial Auto policies grew 25%. Premium growth rates declined as expected but remained strong.
Progressive reported its results for March 2007. Net income decreased 16% to $131.1 million compared to March 2006. The combined ratio increased 4.9 points to 88.2. For the quarter, net income decreased 17% to $363.5 million and the combined ratio increased 4.3 points to 89.5. Progressive saw unfavorable development from prior accident years, primarily related to larger losses emerging from prior years in commercial auto.
The Progressive Corporation reported financial results for April 2004, with the following key highlights:
- Net premiums written increased 10% to $1.315 billion compared to April 2003.
- Net income increased 49% to $157.1 million compared to April 2003.
- The combined ratio improved 4.2 percentage points to 84.1% from 88.3% in April 2003.
- Personal lines policies in force grew 16% year-over-year and commercial auto policies grew 24%.
This document provides an overview and summary of The Progressive Corporation's 2006 Report on Loss Reserving Practices. The report examines Progressive's loss reserving process and how it affects their financial results. It includes sections on their financial objectives, how reserve development affects financial reporting, the different types of reserves, how reserves are estimated by segment, and recent process enhancements. The goal is to help stakeholders understand Progressive's loss reserving methodology and ensure reserves are adequate while developing with minimal variation over time.
The Progressive Corporation reported financial results for the second quarter of 2006, with net premiums written growing 2% over the same period in 2005. While profits remained strong, with an underwriting margin of 14.1%, growth was lower than expected. Progressive saw the greatest growth challenges in their Drive brand within the independent agency channel. They are also seeing a shift to more customers researching and initiating quotes online rather than by phone. Commercial auto grew policies by 9% in the quarter. Progressive aims to balance further profitability and growth by enhancing their brands and marketing to attract more customers in all channels.
This annual report summarizes Amgen's performance in 2000 and outlines goals for the future. Key points include:
- Amgen achieved strong financial results in 2000 and aims to more than double revenues and products on the market in the next five years.
- Goals for the future include launching new products like ARANESP beginning in 2001, expanding R&D capabilities and the product pipeline, and strengthening the organization.
- Four new products could launch in the next 18 months - ARANESP, anakinra, abarelix-depot, and SD/01. R&D spending will increase to nearly $1 billion in 2001 to support pipeline growth.
This document is a quarterly report filed with the SEC by Health Net, Inc. for the quarter ended March 31, 2006. It includes financial statements such as the consolidated statements of operations and balance sheets, as well as notes to the financial statements. Some key details include:
- Revenues for the quarter were $3.2 billion, up from $2.9 billion in the same quarter the previous year.
- Net income for the quarter was $76.6 million, up from $21.3 million in the same quarter the previous year.
- As of March 31, 2006, Health Net had $870.2 million in cash and cash equivalents and $1.4 billion in investments.
The document appears to be the 2007 annual report for The Progressive Corporation. It discusses Progressive as being the third largest auto insurance group in the US and largest seller of motorcycle and personal watercraft policies. Progressive is committed to becoming consumers' #1 choice for auto insurance by offering competitive rates and products throughout consumers' lifetimes, as well as superior customer service and claims processing. The annual report's theme for that year is "strategy."
TRW Automotive reported third quarter 2004 financial results with sales of $2.7 billion, an 8% increase over the prior year. Net earnings were $13 million compared to a net loss of $34 million in the prior year. For the first nine months of 2004, sales were $8.8 billion and net earnings were $91 million. TRW revised its full-year 2004 guidance to reflect third quarter results and an expected $115 million fourth quarter charge related to purchasing a subordinated note, with projected sales of $11.8 billion and diluted EPS between $0.08-$0.13.
The Progressive Corporation reported its results for May 2005. Net premiums written increased 2% compared to May 2004. Net income increased 16% to $126.1 million, while earnings per share increased 27% to $0.63. The combined ratio improved 0.8 percentage points to 85.8%. Personal lines policies in force grew 11% year-over-year.
- The Progressive Corporation reported financial results for February 2005, with net premiums written up 12% and net income down 12% compared to February 2004.
- Personal lines policies in force grew 12% year over year while commercial auto policies in force rose 14%.
- The combined ratio was 85.2% for February 2005, an increase of 1.5 percentage points from February 2004, driven partly by lower favorable reserve development on prior accident years.
The Progressive Corporation reported its November 2005 results. Net premiums written increased 5% to $986.3 million compared to November 2004. Net income decreased 11% to $83.3 million compared to the prior year. The combined ratio was 89.9%, a 0.3 point increase from November 2004. Progressive incurred losses of $4.2 million from Hurricane Wilma and $3 million from Hurricane Katrina in November, bringing its total losses from the storms to $76.6 million and $188.6 million, respectively.
The Progressive Corporation reported its financial results for July 2004. Net premiums written increased 7% to $1.298 billion compared to July 2003. Net income grew 18% to $168.1 million, while earnings per share rose 19% to $0.77. The combined ratio improved 3.3 percentage points to 82.6. Personal lines net premiums written grew 6% and commercial auto rose 19%. Progressive continued to experience strong profitability with only two unprofitable markets.
The Progressive Corporation hosted its 2005 Investor Relations Meeting on May 26th. The meeting included presentations and a question and answer session, lasting approximately three hours. Information from the meeting was made available on the company's website. Progressive also reported its April 2005 results, with net premiums written up 9% and net income down 6% compared to April 2004. The company will continue to offer auto insurance to personal and commercial drivers throughout the US.
The Progressive Corporation hosted its 2005 Investor Relations Meeting on May 26th. The meeting included presentations and a question and answer session, lasting approximately three hours. Information from the meeting was made available on the company's website. Progressive also reported its April 2005 results, including a 9% increase in net premiums written compared to April 2004. Net income decreased 6% compared to the same period last year. The combined ratio for April 2005 was 85.3, a 1.2 point increase over April 2004.
The Progressive Corporation held a conference call to discuss its quarterly financial results. For the second quarter of 2005, the Company's net written premiums increased 7% to $3.594 billion and net income increased 2% to $394.3 million compared to the same period in 2004. The combined ratio, a measure of profitability, improved slightly to 86.1% from 85.4% the prior year. The Company also reported that its conference call to discuss third quarter results is scheduled for August 9, 2005.
The Progressive Corporation reported its October 2005 results. Net premiums written increased 4% to $1.328 billion compared to October 2004. Net income decreased 46% to $75.4 million compared to the same period last year. The combined ratio was 94.2, a deterioration of 7.2 points from October 2004, due to $84.4 million in losses from Hurricanes Wilma and Katrina. Progressive provides auto insurance to personal and commercial drivers throughout the US.
The Progressive Corporation reported its October 2005 results. Net premiums written increased 4% to $1.328 billion compared to October 2004. Net income decreased 46% to $75.4 million compared to the same period last year. The combined ratio was 94.2, a deterioration of 7.2 points from October 2004, due to $84.4 million in losses from Hurricanes Wilma and Katrina. Progressive also provided supplemental information on premiums written and earned, loss ratios, expense ratios, and policies in force by business segment.
The Progressive Corporation reported financial results for March 2005. Net premiums written increased 5% to $1.127 billion compared to March 2004. Net income decreased 11% to $135.2 million compared to the prior year. Earnings per share fell 3% to $0.67. The combined ratio was 84.8, a deterioration of 2 points from the prior year. Policies in force grew 12% year-over-year for personal lines and 14% for commercial auto.
- The Progressive Corporation reported financial results for March 2004 including a 14% increase in net premiums written, an 18% increase in net premiums earned, and a 66% increase in net income compared to March 2003.
- Net income was $152.6 million, or earnings of $0.69 per share, compared to $91.8 million, or $0.42 per share in the previous year.
- The combined ratio was 82.8%, a 0.9 point improvement from the prior year.
- The Progressive Corporation reported financial results for March 2004, including a 66% increase in net income compared to March 2003. Net written premiums increased 14% and net earned premiums increased 18%.
- The combined ratio was 82.8%, an improvement of 0.9 percentage points from March 2003. However, unfavorable reserve development from prior accident years increased the loss ratio and combined ratio.
- Policies in force grew 16% for personal lines and 25% for commercial auto business compared to March 2003, driven by strong renewals. Most of Progressive's markets remained profitable in March and for the year to date.
The Progressive Corporation reported financial results for September 2004 and year-to-date. For September, net income increased 28% to $120.5 million compared to the same period last year. Net premiums earned grew 11% to $1.013 billion. The combined ratio was 88.1. For the year-to-date period, net income increased 38% to $1.235 billion, while net premiums earned grew 16% to $9.605 billion. The company also reported total investment returns and provided additional details on expenses and earnings per share.
The Progressive Corporation reported financial results for September 2004, with the following key highlights:
1) Net premiums written increased 10% to $1.002 billion compared to September 2003, and net income increased 28% to $120.5 million.
2) For the quarter, net premiums earned increased 12% to $3.277 billion and net income increased 22% to $388.9 million.
3) The combined ratio for September was 88.1%, a 0.2 point improvement from September 2003.
The Progressive Corporation reported its July 2006 results:
- Net premiums written increased 2% to $1.427 billion and net income increased 3% to $148.8 million compared to July 2005.
- The combined ratio improved slightly to 86.6% from 86.9% in July 2005.
- Progressive also announced a joint marketing agreement with Homesite Insurance to offer homeowners insurance to eligible auto insurance customers in a three-state test program by the end of 2006.
The Progressive Corporation reported its July 2006 results, including:
- Net premiums written increased 2% to $1.427 billion and net income increased 3% to $148.8 million compared to July 2005.
- Earnings per share increased 6% to $0.19.
- The combined ratio improved slightly to 86.6% from 86.9% in July 2005.
- Progressive also announced a joint marketing agreement with Homesite Insurance to offer homeowners insurance to eligible auto insurance customers in a three-state test program by the end of 2006.
The Progressive Corporation reported its August 2005 results. Net premiums earned increased 6% compared to August 2004. However, net income decreased 43% from the previous year to $56.8 million due to higher losses and loss adjustment expenses, which included $119.5 million in costs related to Hurricane Katrina. The combined ratio also increased by 7.1 percentage points to 96.3%. Progressive offers auto insurance to personal and commercial customers throughout the United States.
The Progressive Corporation reported financial results for August 2005. Net premiums earned increased 6% year-over-year to $1.069 billion. However, net income decreased 43% to $56.8 million due to a 7.1 point increase in the combined ratio to 96.3, driven by $119.5 million in losses from Hurricane Katrina. The company also reported results for the year to date, with net premiums earned up 7% to $9.211 billion and net income down 10% to $1.007 billion. Policies in force grew 10% year-over-year for personal lines and 12% for commercial auto.
- The Progressive Corporation reported its April 2007 results, with net premiums written down 4% from April 2006 to $1.437 billion and net income down 14% to $136.7 million.
- The combined ratio was 88.8%, up 2.9 percentage points from April 2006, driven by an increase in bodily injury severity.
- Total personal auto policies in force grew 1% to over 7 million while total commercial auto policies grew 6% to over 522,000.
The Progressive Corporation reported financial results for February 2007, with the following key details:
- Net income was $94.7 million, down 25% from February 2006. Earnings per share were $0.13, down 21%.
- Net written premiums decreased 1% to $1,194.5 million.
- The combined ratio was 92.8%, up 6.5 percentage points from the prior year, driven by unfavorable development of prior accident year losses.
- Total policies in force increased 3% to over 9.85 million personal lines policies and 508,000 commercial auto policies.
This document provides supplementary financial information for The Chubb Corporation for the quarter ending March 31, 2005. It includes:
- Consolidated balance sheet highlights showing total invested assets of $31.9 billion.
- Summaries of invested assets by corporate and property/casualty segments.
- Investment income after taxes for corporate and property/casualty segments.
- Property/casualty insurance group statutory surplus of $8.25 billion.
- Changes in net unpaid losses for various lines of business.
- Worldwide underwriting results by line of business, showing a total statutory underwriting income of $134.4 million.
The document provides supplementary investor information from The Chubb Corporation as of June 30, 2005. It includes:
- Consolidated balance sheet highlights showing total invested assets of $32.9 billion including fixed maturities and equity securities.
- Summaries of invested assets for Chubb's Corporate and Property & Casualty segments totaling over $31 billion.
- Investment income after taxes for the second quarter and first half of 2005, with Property & Casualty investment income of $261 million and $513 million respectively.
- Property & Casualty underwriting results for the second quarter and first half of 2005, including a $4.3 billion statutory policyholders' surplus for the P
Supplementary Investor Information Y13880_Edgar_992_0333_finance18
The document provides supplementary investor information for The Chubb Corporation for the third quarter of 2005, including:
1) Consolidated balance sheet highlights and summaries of invested assets for both corporate and property/casualty segments.
2) Property/casualty underwriting results for the first nine months of 2005, showing a statutory underwriting income of $293.6 million.
3) Details of changes in net unpaid losses and the estimated impact of catastrophes including Hurricane Katrina of $511 million pre-tax cost.
The document provides supplementary investor information for The Chubb Corporation as of December 31, 2005. It includes a consolidated balance sheet, details on share repurchase activity, summaries of invested assets and investment income for both corporate and property & casualty segments. It also provides property & casualty underwriting results for 2005 and 2004, including net premiums written and earned, losses incurred and expenses by line of business.
This document provides supplementary financial information for The Chubb Corporation as of March 31, 2006. It includes consolidated balance sheet highlights, share repurchase activity, summaries of invested assets for corporate and property & casualty segments, investment income after taxes, statutory policyholders' surplus, changes in net unpaid losses, and underwriting results for personal, commercial, and specialty insurance lines of business. Key metrics such as loss ratios, expense ratios, and combined ratios are also presented.
This document provides supplementary investor information from The Chubb Corporation for the period ending June 30, 2006. It includes consolidated balance sheet highlights, share repurchase activity, summaries of invested assets, investment income after taxes, statutory policyholders' surplus, changes in net unpaid losses, and underwriting results by line of business for year-to-date and quarterly periods. Key metrics such as loss ratios, expense ratios, and combined ratios are presented.
The document provides financial information for The Chubb Corporation as of September 30, 2006. It includes highlights of consolidated balance sheet items, share repurchase activity, summaries of invested assets and investment income for both corporate and property/casualty segments. Details are also given on property/casualty underwriting results for various lines of business on a year-to-date and quarterly basis, including ratios and comparisons to prior periods. Key terms are defined at the end.
This document provides supplementary investor information from The Chubb Corporation for the period ending December 31, 2006. It includes highlights of consolidated balance sheet items, summaries of invested assets, investment income after taxes, statutory policyholders' surplus, changes in unpaid losses, and worldwide property and casualty underwriting results for 2006 and 2005. Specifically, total invested assets increased to $37.7 billion in 2006 from $34.6 billion in 2005. Net income after taxes from investments was $1.2 billion for property and casualty in 2006. Statutory policyholders' surplus grew to $11.3 billion in 2006 from $8.9 billion in 2005.
This document provides a summary of financial information for The Chubb Corporation as of March 31, 2007. Some key highlights include:
- Total invested assets were $38.7 billion as of March 31, 2007, with fixed maturities making up the majority.
- Statutory policyholders' surplus for Chubb's property and casualty insurance group was estimated at $11.95 billion as of March 31, 2007, with a ratio of statutory net premiums written to surplus of 1.00 to 1.
- For the three months ended March 31, 2007, Chubb's worldwide property and casualty underwriting results showed a total underwriting income of $202 million for personal insurance and $144 million
This document provides supplementary investor information from The Chubb Corporation for the period ending June 30, 2007. It includes highlights of Chubb's consolidated balance sheet, share repurchase activity, summaries of invested assets for Corporate and Property & Casualty segments, and investment income after taxes. Key metrics provided are total invested assets of $39.5 billion, shareholders' equity of $13.8 billion, and year-to-date Property & Casualty investment income of $360 million.
This document provides supplementary investor information for The Chubb Corporation, including consolidated balance sheet highlights, share repurchase activity, summaries of invested assets, investment income after taxes, statutory policyholders' surplus, changes in net unpaid losses, and underwriting results for both the nine months and quarters ended September 30, 2007 and 2006. Key figures include total invested assets of $40.5 billion, shareholders' equity of $14.2 billion, and worldwide property and casualty underwriting income of $543 million for the nine months ended September 30, 2007.
This document provides supplementary financial information for The Chubb Corporation as of December 31, 2007. It includes highlights of consolidated balance sheets, share repurchase activity, summaries of invested assets, investment income after taxes for corporate and property/casualty divisions, statutory policyholder surplus, changes in unpaid losses, and underwriting results by line of business for 2007 and 2006.
This document provides financial information about Chubb Corporation's property and casualty underwriting results for 2007 and 2006. It summarizes key metrics like net premiums written, losses incurred, expenses incurred, underwriting income, and combined loss/expense ratios for different business lines including personal, commercial, and specialty insurance. It also notes that beginning in 2008, foreign currency fluctuations will be accounted for differently in the reporting of losses paid and outstanding losses. Overall underwriting income increased from $1.886 billion to $2.064 billion from 2006 to 2007.
The document provides supplementary financial information for Chubb Corporation as of March 31, 2008. Key highlights include:
- Total invested assets were $40.1 billion, with fixed maturities making up the majority.
- Statutory policyholders' surplus for property and casualty insurance was estimated at $13.3 billion, with a ratio of net premiums written to surplus of 0.9 to 1.
- For the three months ended March 31, 2008, worldwide underwriting resulted in a total profit of $138 million for commercial lines and $164 million for personal lines. Loss and expense ratios remained high but stable.
The document is a report from The Chubb Corporation detailing changes to how losses are presented in their property and casualty underwriting results. Specifically, beginning in Q3 2008, foreign currency fluctuations will impact "net losses paid" and "increase (decrease) in outstanding losses" differently than before. The report provides definitions, ratios, and quarterly underwriting results for Q1 2008 and 2007 to reflect these presentation modifications. Incurred losses remain unchanged.
This document provides supplementary investor information from The Chubb Corporation, including:
- Consolidated balance sheet highlights and share repurchase activity as of June 30, 2008.
- Summaries of invested assets for Corporate and Property & Casualty segments.
- Investment income after taxes for Corporate and Property & Casualty segments for the second quarter and first six months of 2008 versus 2007.
- Property & Casualty statutory policyholders' surplus, change in net unpaid losses, and underwriting results by line of business for the first half of 2008 versus the same period in 2007.
This document from Chubb Corporation reports modifications to the presentation of losses incurred in property and casualty underwriting results for the six months ended June 30, 2008 and 2007. Specifically, it notes that beginning in Q3 2008, foreign currency fluctuations will be reflected differently in "net losses paid" and "increase (decrease) in outstanding losses", though incurred losses remain unchanged. It provides definitions of key terms like underwriting income/loss and combined loss/expense ratio used to evaluate underwriting performance. The document then presents detailed underwriting results by line of business and geographic region.
This document provides supplementary investor information from The Chubb Corporation for the quarter ending September 30, 2008. It includes a consolidated balance sheet, share repurchase activity, summaries of invested assets for corporate and property & casualty divisions, and investment income and underwriting results. Beginning in Q3 2008, foreign currency fluctuations will impact property & casualty loss reporting differently than in the past.
This document provides supplementary financial information for The Chubb Corporation as of December 31, 2008. It includes highlights of the consolidated balance sheet, share repurchase activity, summaries of invested assets for the Corporate and Property and Casualty segments, and investment income. It also contains information on statutory policyholders' surplus, changes in unpaid losses, and underwriting results for year-to-date and quarterly periods for the Property and Casualty Insurance Group. Key terms are defined at the end.
The Rise and Fall of Ponzi Schemes in America.pptxDiana Rose
Ponzi schemes, a notorious form of financial fraud, have plagued America’s investment landscape for decades. Named after Charles Ponzi, who orchestrated one of the most infamous schemes in the early 20th century, these fraudulent operations promise high returns with little or no risk, only to collapse and leave investors with significant losses. This article explores the nature of Ponzi schemes, notable cases in American history, their impact on victims, and measures to prevent falling prey to such scams.
Understanding Ponzi Schemes
A Ponzi scheme is an investment scam where returns are paid to earlier investors using the capital from newer investors, rather than from legitimate profit earned. The scheme relies on a constant influx of new investments to continue paying the promised returns. Eventually, when the flow of new money slows down or stops, the scheme collapses, leaving the majority of investors with substantial financial losses.
Historical Context: Charles Ponzi and His Legacy
Charles Ponzi is the namesake of this deceptive practice. In the 1920s, Ponzi promised investors in Boston a 50% return within 45 days or 100% return in 90 days through arbitrage of international reply coupons. Initially, he paid returns as promised, not from profits, but from the investments of new participants. When his scheme unraveled, it resulted in losses exceeding $20 million (equivalent to about $270 million today).
Notable American Ponzi Schemes
1. Bernie Madoff: Perhaps the most notorious Ponzi scheme in recent history, Bernie Madoff’s fraud involved $65 billion. Madoff, a well-respected figure in the financial industry, promised steady, high returns through a secretive investment strategy. His scheme lasted for decades before collapsing in 2008, devastating thousands of investors, including individuals, charities, and institutional clients.
2. Allen Stanford: Through his company, Stanford Financial Group, Allen Stanford orchestrated a $7 billion Ponzi scheme, luring investors with fraudulent certificates of deposit issued by his offshore bank. Stanford promised high returns and lavish lifestyle benefits to his investors, which ultimately led to a 110-year prison sentence for the financier in 2012.
3. Tom Petters: In a scheme that lasted more than a decade, Tom Petters ran a $3.65 billion Ponzi scheme, using his company, Petters Group Worldwide. He claimed to buy and sell consumer electronics, but in reality, he used new investments to pay off old debts and fund his extravagant lifestyle. Petters was convicted in 2009 and sentenced to 50 years in prison.
4. Eric Dalius and Saivian: Eric Dalius, a prominent figure behind Saivian, a cashback program promising high returns, is under scrutiny for allegedly orchestrating a Ponzi scheme. Saivian enticed investors with promises of up to 20% cash back on everyday purchases. However, investigations suggest that the returns were paid using new investments rather than legitimate profits. The collapse of Saivian l
Dr. Alyce Su Cover Story - China's Investment Leadermsthrill
In World Expo 2010 Shanghai – the most visited Expo in the World History
https://www.britannica.com/event/Expo-Shanghai-2010
China’s official organizer of the Expo, CCPIT (China Council for the Promotion of International Trade https://en.ccpit.org/) has chosen Dr. Alyce Su as the Cover Person with Cover Story, in the Expo’s official magazine distributed throughout the Expo, showcasing China’s New Generation of Leaders to the World.
A toxic combination of 15 years of low growth, and four decades of high inequality, has left Britain poorer and falling behind its peers. Productivity growth is weak and public investment is low, while wages today are no higher than they were before the financial crisis. Britain needs a new economic strategy to lift itself out of stagnation.
Scotland is in many ways a microcosm of this challenge. It has become a hub for creative industries, is home to several world-class universities and a thriving community of businesses – strengths that need to be harness and leveraged. But it also has high levels of deprivation, with homelessness reaching a record high and nearly half a million people living in very deep poverty last year. Scotland won’t be truly thriving unless it finds ways to ensure that all its inhabitants benefit from growth and investment. This is the central challenge facing policy makers both in Holyrood and Westminster.
What should a new national economic strategy for Scotland include? What would the pursuit of stronger economic growth mean for local, national and UK-wide policy makers? How will economic change affect the jobs we do, the places we live and the businesses we work for? And what are the prospects for cities like Glasgow, and nations like Scotland, in rising to these challenges?
Mutual Fund Taxation – How Mutual Funds Are Taxeddhvikdiva
Divadhvik explains Mutual Fund Taxation clearly: Equity funds held over a year are taxed at 10% for gains over ₹1 lakh, while short-term gains are taxed at 15%. Debt funds held over three years are taxed at 20% post-indexation. Short-term gains are taxed as per your income slab.
In a tight labour market, job-seekers gain bargaining power and leverage it into greater job quality—at least, that’s the conventional wisdom.
Michael, LMIC Economist, presented findings that reveal a weakened relationship between labour market tightness and job quality indicators following the pandemic. Labour market tightness coincided with growth in real wages for only a portion of workers: those in low-wage jobs requiring little education. Several factors—including labour market composition, worker and employer behaviour, and labour market practices—have contributed to the absence of worker benefits. These will be investigated further in future work.
Vicinity Jobs’ data includes more than three million 2023 OJPs and thousands of skills. Most skills appear in less than 0.02% of job postings, so most postings rely on a small subset of commonly used terms, like teamwork.
Laura Adkins-Hackett, Economist, LMIC, and Sukriti Trehan, Data Scientist, LMIC, presented their research exploring trends in the skills listed in OJPs to develop a deeper understanding of in-demand skills. This research project uses pointwise mutual information and other methods to extract more information about common skills from the relationships between skills, occupations and regions.
Discover the Future of Dogecoin with Our Comprehensive Guidance36 Crypto
Learn in-depth about Dogecoin's trajectory and stay informed with 36crypto's essential and up-to-date information about the crypto space.
Our presentation delves into Dogecoin's potential future, exploring whether it's destined to skyrocket to the moon or face a downward spiral. In addition, it highlights invaluable insights. Don't miss out on this opportunity to enhance your crypto understanding!
https://36crypto.com/the-future-of-dogecoin-how-high-can-this-cryptocurrency-reach/
Falcon stands out as a top-tier P2P Invoice Discounting platform in India, bridging esteemed blue-chip companies and eager investors. Our goal is to transform the investment landscape in India by establishing a comprehensive destination for borrowers and investors with diverse profiles and needs, all while minimizing risk. What sets Falcon apart is the elimination of intermediaries such as commercial banks and depository institutions, allowing investors to enjoy higher yields.
TEST BANK Principles of cost accounting 17th edition edward j vanderbeck mari...Donc Test
TEST BANK Principles of cost accounting 17th edition edward j vanderbeck maria r mitchell.docx
Economic Risk Factor Update: June 2024 [SlideShare]Commonwealth
May’s reports showed signs of continued economic growth, said Sam Millette, director, fixed income, in his latest Economic Risk Factor Update.
For more market updates, subscribe to The Independent Market Observer at https://blog.commonwealth.com/independent-market-observer.
Governor Olli Rehn: Inflation down and recovery supported by interest rate cu...
progressive mreport-07/05
1. NEWS
RELEASE
The Progressive Corporation Company Contact:
6300 Wilson Mills Road Thomas A. King
Mayfield Village, Ohio 44143 (440) 395-2260
http://www.progressive.com
FOR IMMEDIATE RELEASE
MAYFIELD VILLAGE, OHIO -- August 18, 2005 -- The Progressive Corporation today reported the following results for July 2005:
(millions, except per share amounts and ratios) July July
2005 2004 Change
Net premiums written $1,403.2 $1,298.8 8%
Net premiums earned 1,337.8 1,257.1 6%
Net income 143.9 168.1 (14)%
Per share .72 .77 (6)%
Combined ratio 86.9 82.6 (4.3) pts.
See the “Income Statements” for further month and year-to-date information.
The Company offers insurance to personal and commercial auto drivers throughout the United States. The Company’s Personal
Lines business units write insurance for private passenger automobiles and recreation vehicles. The Company’s Commercial Auto
business unit writes primary liability, physical damage and other auto-related insurance for automobiles and trucks owned by small
businesses. See “Supplemental Information” for month and year-to-date results.
-1-
2. THE PROGRESSIVE CORPORATION AND SUBSIDIARIES
INCOME STATEMENT
July 2005
(millions – except per share amounts)
(unaudited)
Current
Month1 Comments on Monthly Results
Direct premiums written $1,431.3
Net premiums written $1,403.2
Revenues:
Net premiums earned $1,337.8
Investment income 42.8
Net realized gains (losses) on securities 2.8
Service revenues 3.9
Total revenues 1,387.3
Expenses:
Losses and loss adjustment expenses 905.6
140.8
Policy acquisition costs
Other underwriting expenses 115.7
Investment expenses 1.1
Service expenses 2.3
Interest expense 6.9
Total expenses 1,172.4
Income before income taxes 214.9
Provision for income taxes 71.0
Net income $143.9
COMPUTATION OF EARNINGS PER SHARE
Basic:
Average shares outstanding 196.0
Per share $.73
Diluted:
Average shares outstanding 196.0
Net effect of dilutive stock-based
compensation 2.9
Total equivalent shares 198.9
Per share $.72
1
For a description of the Company’s reporting and accounting policies, see Note 1 to the Company’s 2004 audited consolidated
financial statements included in the Company’s 2004 Shareholders’ Report, which can be found at progressive.com/annualreport.
__________________________________________________________________________________
The following table sets forth the investment results for the month:
Fully taxable equivalent total return:
Fixed-income securities (.3)%
Common stocks 4.0%
Total portfolio .3%
Pretax recurring investment book yield 3.8%
-2-
3. THE PROGRESSIVE CORPORATION AND SUBSIDIARIES
INCOME STATEMENTS
July 2005 Year-to-Date
(millions – except per share amounts)
(unaudited)
Year-to-Date
%
2005 2004 Change
Direct premiums written $8,787.9 $8,141.8 8
Net premiums written $8,602.1 $7,937.7 8
Revenues:
Net premiums earned $8,141.6 $7,584.6 7
Investment income 293.0 279.6 5
Net realized gains (losses) on securities 9.2 55.5 (83)
Service revenues 25.4 29.2 (13)
Total revenues 8,469.2 7,948.9 7
Expenses:
Losses and loss adjustment expenses 5,338.8 4,848.8 10
Policy acquisition costs 863.1 817.1 6
Other underwriting expenses 781.3 707.5 10
Investment expenses 7.0 7.7 (9)
Service expenses 14.3 14.4 (1)
Interest expense 48.4 46.9 3
Total expenses 7,052.9 6,442.4 9
Income before income taxes 1,416.3 1,506.5 (6)
Provision for income taxes 465.4 492.1 (5)
Net income $950.9 $1,014.4 (6)
COMPUTATION OF EARNINGS PER SHARE
Basic:
Average shares outstanding 197.8 216.3 (9)
Per share $4.81 $4.69 3
Diluted:
Average shares outstanding 197.8 216.3 (9)
Net effect of dilutive stock-based
compensation 2.9 3.5 (17)
Total equivalent shares 200.7 219.8 (9)
Per share $4.74 $4.62 3
The following table sets forth the investment results for the year-to-date period:
2005 2004
Fully taxable equivalent total return:
Fixed-income securities 1.9% 1.6%
Common stocks 4.4% (.6)%
Total portfolio 2.3% 1.4%
Pretax recurring investment book yield 3.9% 3.8%
-3-
4. THE PROGRESSIVE CORPORATION AND SUBSIDIARIES
SUPPLEMENTAL INFORMATION
July 2005
($ in millions)
(unaudited)
Current Month
Commercial
Personal Lines Auto Other Companywide
Businesses1
Agency Direct Total Business Total
Net Premiums Written $802.9 $425.0 $1,227.9 $172.9 $2.4 $1,403.2
% Growth in NPW 4% 15% 8% 10% NM 8%
Net Premiums Earned $775.5 $397.7 $1,173.2 $162.1 $2.5 $1,337.8
% Growth in NPE 3% 12% 6% 11% NM 6%
GAAP Ratios
Loss/LAE ratio 68.5 66.8 67.9 66.1 NM 67.7
Expense ratio 19.3 19.1 19.3 18.5 NM 19.2
Combined ratio 87.8 85.9 87.2 84.6 NM 86.9
Actuarial Adjustments2
Reserve Decrease/(Increase)
Prior accident years $9.0
Current accident year 13.6
Calendar year actuarial adjustment $14.0 $8.0 $22.0 $.5 $.1 $22.6
Prior Accident Years Development
Favorable/(Unfavorable)
Actuarial adjustment $9.0
All other development 25.9
Total development $34.9
Calendar year loss/LAE ratio 67.7
Accident year loss/LAE ratio 70.3
Statutory Ratios
Loss/LAE ratio 67.7
Expense ratio 18.2
Combined ratio 85.9
NM = Not Meaningful
1
Amounts primarily include professional liability insurance for community banks and the Company’s run-off businesses. The other
businesses generated an underwriting profit of $.5 million for the month.
2
Represents adjustments solely based on the Company’s corporate actuarial review.
-4-
5. THE PROGRESSIVE CORPORATION AND SUBSIDIARIES
SUPPLEMENTAL INFORMATION
July 2005 Year-to-Date
($ in millions)
(unaudited)
Year-to-Date
Commercial
Personal Lines Auto Other Companywide
Businesses1
Agency Direct Total Business Total
Net Premiums Written $4,951.0 $2,544.0 $7,495.0 $1,093.2 $13.9 $8,602.1
% Growth in NPW 5% 14% 8% 15% NM 8%
Net Premiums Earned $4,766.8 $2,389.4 $7,156.2 $969.3 $16.1 $8,141.6
% Growth in NPE 4% 12% 7% 12% NM 7%
GAAP Ratios
Loss/LAE ratio 66.0 66.7 66.2 61.5 NM 65.6
Expense ratio 20.5 19.8 20.3 19.9 NM 20.2
Combined ratio 86.5 86.5 86.5 81.4 NM 85.8
Actuarial Adjustments2
Reserve Decrease/(Increase)
Prior accident years $78.0
Current accident year 24.6
Calendar year actuarial adjustment $59.9 $26.8 $86.7 $14.0 $1.9 $102.6
Prior Accident Years Development
Favorable/(Unfavorable)
Actuarial adjustment $78.0
All other development 159.4
Total development $237.4
Calendar year loss/LAE ratio 65.6
Accident year loss/LAE ratio 68.5
Statutory Ratios
Loss/LAE ratio 65.6
Expense ratio 19.2
Combined ratio 84.8
Statutory surplus $5,643.7
July July
2005 2004 Change
Policies in Force
(in thousands)
Agency – Auto 4,492 4,201 7%
Direct – Auto 2,282 2,012 13%
Other Personal Lines3 2,646 2,306 15%
Total Personal Lines 9,420 8,519 11%
Commercial Auto Business 459 410 12%
NM = Not Meaningful
1
The other businesses generated an underwriting profit of $8.9 million.
2
Represents adjustments solely based on the Company’s corporate actuarial review.
3
Includes insurance for motorcycles, recreation vehicles, mobile homes, watercraft, snowmobiles and similar items.
-5-
6. THE PROGRESSIVE CORPORATION AND SUBSIDIARIES
BALANCE SHEET AND OTHER INFORMATION
(millions– except per share amounts)
(unaudited)
July
2005
CONDENSED GAAP BALANCE SHEET:1
Investments - Available-for-sale, at market:
Fixed maturities (amortized cost: $9,869.0) $9,858.7
Equity securities:
Preferred stocks (cost: $1,182.1) 1,185.4
Common equities (cost: $1,401.2) 2,008.1
Short-term investments (amortized cost: $2,400.7) 2,401.3
Total investments2 15,453.5
Net premiums receivable 2,585.2
Deferred acquisition costs 475.3
Other assets 1,462.0
Total assets $19,976.0
Unearned premiums $4,567.2
Loss and loss adjustment expense reserves 5,572.8
Other liabilities2 2,872.2
Debt 1,284.7
Shareholders’ equity 5,679.1
Total liabilities and shareholders’ equity $19,976.0
Common Shares outstanding 197.2
Shares repurchased – July .6
Average cost per share $98.72
Book value per share $28.80
Trailing 12-month return on average shareholders’ equity 29.2%
Net unrealized pre-tax gains on investments $600.5
Increase (decrease) from June 2005 $(12.7)
Increase (decrease) from December 2004 $(68.9)
Debt to total capital ratio 18.4%
Fixed-income portfolio duration 2.8 years
Weighted average credit quality AA+
1
Pursuant to SFAS 113, “Accounting and Reporting for Reinsurance of Short-Duration and Long-
Duration Contracts,” loss and loss adjustment expense reserves are stated gross of reinsurance
recoverables on unpaid losses of $338.2 million.
2
Amounts include net unsettled security acquisitions, including repurchase commitments, of $1,330.6
million.
-6-
7. Monthly Commentary
• The Company has no additional commentary regarding July results.
The Progressive Group of Insurance Companies, in business since 1937, ranks third in the nation for auto insurance based on
premiums written and provides drivers with competitive rates and 24/7, in-person and online service. The companies that
offer insurance directly (by phone at 1-800-PROGRESSIVE and online at progressivedirect.com) market their products and
services under the Progressive DirectSM brand, while the companies that offer insurance through more than 30,000
independent insurance agencies market their products and services under the Drive® Insurance from Progressive brand. The
Common Shares of The Progressive Corporation, the Mayfield Village, Ohio-based holding company, are publicly traded at
NYSE:PGR. More information can be found at progressive.com, including a guide to interpreting the monthly reporting
package.
Safe Harbor Statement under the Private Securities Litigation Reform Act of 1995: Statements in this release that are not historical
fact are forward-looking statements that are subject to certain risks and uncertainties that could cause actual events and results to
differ materially from those discussed herein. These risks and uncertainties include, without limitation, uncertainties related to
estimates, assumptions and projections generally; inflation and changes in economic conditions (including changes in interest rates
and financial markets); the accuracy and adequacy of the Company’s pricing and loss reserving methodologies; pricing competition
and other initiatives by competitors; the Company’s ability to obtain regulatory approval for requested rate changes and the timing
thereof; the effectiveness of the Company’s advertising campaigns; legislative and regulatory developments; disputes relating to
intellectual property rights; the outcome of litigation pending or that may be filed against the Company; weather conditions
(including the severity and frequency of storms, hurricanes, snowfalls, hail and winter conditions); changes in driving patterns and
loss trends; acts of war and terrorist activities; the Company’s ability to maintain the uninterrupted operation of its facilities, systems
(including information technology systems) and business functions; court decisions and trends in litigation and health care and auto
repair costs; and other matters described from time to time by the Company in releases and publications, and in periodic reports and
other documents filed with the United States Securities and Exchange Commission. In addition, investors should be aware that
generally accepted accounting principles prescribe when a company may reserve for particular risks, including litigation exposures.
Accordingly, results for a given reporting period could be significantly affected if and when a reserve is established for one or more
contingencies. Reported results, therefore, may appear to be volatile in certain accounting periods.
-7-