Mary Riley, Caesar's Entertainment - "Personalizing the Loyalty Experience"Chicago AMA
Mary Riley, VP Caesar's Entertainment talks about "Personalizing the Loyalty Experience" – How Technology, Innovation and Personalizing Rewards has advanced Harrah’s Total Rewards to an Industry Standard at Jan 20th AMA Chicago event held at Spertus Institute.
Will Lytle argues that current loyalty models that reward players based on time spent and revenues generated are ineffective and have diminishing returns. Instead, companies should implement agile CRM systems to proactively develop high value players through personalized, ROI-driven campaigns identified through ongoing data mining and testing. This allows companies to scale efforts by empowering frontline teams to address player needs in real-time and continuously improve processes based on results.
Major retailers are partnering with companies to promote their brands through incentive and loyalty programs. These companies share commissions with shoppers by routing purchases through their sites, splitting the payout between the company and consumer. The document discusses the top 3 cash back programs - Lyoness, Kickitback, and FatWallet - comparing their pros and cons such as available merchants, online/in-store shopping options, and whether they offer referral payouts. Cash back programs are becoming more popular as they allow customers to earn rewards for regular purchases.
Caesars Entertainment presentation for Chicago AMA CRM EventChicago AMA
This document discusses how Big Data is fueling entertainment experiences through Caesars Entertainment's Total Rewards loyalty program. It describes how Total Rewards allows Caesars to understand customer preferences and value. Through analyzing gaming, travel, web browsing and other data, Caesars can take a holistic view of the customer experience and engage in more intelligent pricing, predictive modeling and real-time marketing. These Big Data capabilities help Caesars earn more than its fair market share and deliver significant benefits to participating outlets and businesses. In the end, Total Rewards has become a leader in loyalty programs by using Big Data to increase customer loyalty.
This document is BB&T Corporation's 2005 annual report. It provides financial highlights for 2005, noting that net income increased 6.1% to $1.654 billion and diluted earnings per share grew 7.1% to $3.00. Operating earnings rose 7.2% to $1.674 billion. Cash basis operating earnings, which exclude intangible assets and purchase accounting adjustments, increased 7.1% to $1.763 billion. The report discusses BB&T's strong loan, deposit and balance sheet growth in 2005 and notes the bank hired additional revenue producers and implemented strategies to boost organic account growth.
BB&T reported 2008 net income of $1.5 billion and earnings per common share of $2.71. For the fourth quarter of 2008, net income totaled $305 million and net income available to common shareholders totaled $284 million, or $.51 per diluted common share. For the full year 2008, BB&T's net income available to common shareholders was $1.50 billion compared to $1.73 billion earned in 2007, a decrease of 13.6%.
- BB&T Corporation reported lower operating earnings for the fourth quarter of 2008 compared to the same period in 2007. Operating earnings available to common shareholders decreased 41.4% to $243 million.
- Net interest income increased 14.2% to $1,132 million due to higher interest income, but this was more than offset by a large increase in the provision for credit losses of $344 million.
- Returns and profitability ratios declined from the prior year, with the return on average common equity decreasing to 7.26% and the efficiency ratio worsening to 51.9%.
This document is a proxy statement from Carolina Power & Light Company (CP&L) informing shareholders about the upcoming annual shareholder meeting on May 14, 2008. The meeting will address the election of two Class I directors and the ratification of Deloitte & Touche LLP as the company's independent registered public accounting firm. Shareholders are encouraged to vote by proxy card or telephone in order to have their votes counted if they do not attend the meeting in person.
This document is a proxy statement from Progress Energy, Inc. inviting shareholders to attend the company's 2008 Annual Meeting of Shareholders on May 14, 2008. The matters to be voted on include the election of directors, ratification of the selection of the independent registered public accounting firm, and a shareholder proposal regarding executive compensation. Shareholders are urged to vote by proxy card, telephone, or online in order to have their votes counted if they do not attend the meeting in person.
The document summarizes Bill Johnson's presentation at the Morgan Stanley Global Electricity & Energy Conference on April 3, 2008. The presentation outlines Progress Energy's strategy to secure its energy future through operational excellence, growth prospects like rate base expansion, and maintaining constructive regulation. It highlights Progress Energy's two regulated utilities with strong growth prospects and discusses key strategic issues like US climate change policy and needed new baseload capacity like the proposed Levy County nuclear project.
Bill Johnson, Chairman, CEO, and President of Progress Energy, presented at the company's annual shareholder meeting. He discussed Progress Energy's history of over 100 years in business, highlights from 2007 including financial and operational achievements as well as sustainability recognition, strategic focus on its two electric utility subsidiaries serving North Carolina and Florida. Johnson also outlined Progress Energy's balanced strategy to address issues like climate change, demand growth, and costs while maintaining reliability and affordability. He discussed governance practices and executive compensation policies.
Progress Energy reported first quarter 2008 results. Earnings were lower than expected due to milder than normal weather and lower customer growth and usage, particularly in Florida. The company reaffirmed its 2008 earnings guidance. Several regulatory filings and projects remained on track. Key nuclear, natural gas, and transmission projects were progressing to increase capacity and meet renewable energy goals. While economic conditions had softened retail demand, cost management and additional wholesale contracts were expected to offset impacts.
The document summarizes Progress Energy's Q2 2008 earnings call. It discusses the company reaffirming its 2008 ongoing earnings guidance of $3.05 per share despite challenges in Florida. It also provides updates on recent court rulings impacting emissions regulations, the Levy County nuclear project, and major capital expenditure projects. Progress Energy's CFO discusses the company's quarterly and year-to-date financial performance and steps taken to offset weakness in Florida retail markets through increased wholesale contracts.
Bill Johnson, CEO of Progress Energy, outlined the company's strategy to secure its energy future at a Lehman Brothers energy conference. Progress Energy operates as two high-performing electric utilities serving North Carolina and Florida. The company is focused on achieving annual EPS growth of 4-5% through rate base expansion and pursuing a balanced solution to meet energy needs and address climate change, while maintaining excellent operational and financial performance. A key part of this strategy is the proposed Levy Nuclear Project, a two-unit nuclear plant in Florida that would help reduce costs and carbon emissions.
This document summarizes a presentation given by Mark Mulhern, Senior Vice President and CFO of Progress Energy, at a Power & Gas Leaders Conference on September 24, 2008. The presentation discusses Progress Energy's strategy of securing its energy future through significant rate base growth, nuclear expansion projects, and maintaining a supportive regulatory environment. It provides an overview of Progress Energy's utilities in North Carolina and Florida, outlines major capital investment projects, and reviews the company's financial position and objectives to achieve steady earnings growth.
The document summarizes Progress Energy's Q3 2008 earnings call. It discusses ongoing earnings of $306M for Q3 2008, regulatory updates in the Carolinas and Florida, energy efficiency and alternative energy programs, and $7-8B in capital expenditures through 2013 for major generation projects. Cost controls have kept year-to-date O&M expenses flat compared to 2007 despite 2.5% reported growth. Customer growth has been positive but milder weather reduced retail usage. Guidance of $2.95-3.05 for 2008 ongoing earnings is maintained based on a trailing 12-month EPS of $2.91. Liquidity remains strong with $1.9B in available credit facilities and cash.
Progress Energy held a financial conference in Phoenix, Arizona on November 10-11, 2008. The conference focused on providing an overview of the company including its growth strategy and regulatory updates. Progress Energy is the largest regulated electric utility in the US with significant projected rate base growth through 2010 driven by investments in its regulated operations in North Carolina and Florida. Regulatory proceedings in both states approved various cost recovery filings which will support continued investment and earnings growth.
This document is a presentation by Bill Johnson, Chairman and CEO of Progress Energy, given at the EEI Financial Conference in Phoenix, AZ on November 11, 2008. The presentation provides an overview of Progress Energy, including its strategic focus on achieving long-term annual EPS growth of 4-5%, pursuing a balanced solution to secure the energy future, and sustaining financial strength during nuclear construction. It also discusses Progress Energy's regulated utilities, major capital projects, regulatory updates, and long-term financial objectives.
The document is a transcript from Progress Energy's 4Q 2008 earnings call. It discusses Progress Energy's financial results for 4Q and full year 2008, highlights achievements that position the company well for 2009, and reviews major capital projects and regulatory initiatives. Progress Energy affirmed its 2009 ongoing earnings guidance of $2.95 to $3.15 per share. The call also provided updates on Florida rate filings and the Levy Nuclear Project.
- Progress Energy reported financial results for the second quarter and first half of 2001. Total operating revenues increased $1.4 billion for the first half compared to the same period in 2000 due to the acquisition of Florida Power Corporation.
- Net income increased $73 million to $266 million for the first half, with earnings per share rising from $1.26 to $1.33. Earnings were positively impacted by the addition of Florida Power Corporation but faced higher interest charges and goodwill amortization from the acquisition.
- Operating revenues and energy sales increased across electric, natural gas, and diversified business segments. However, net income faced pressures from weather-related declines in electricity usage, higher operation and maintenance
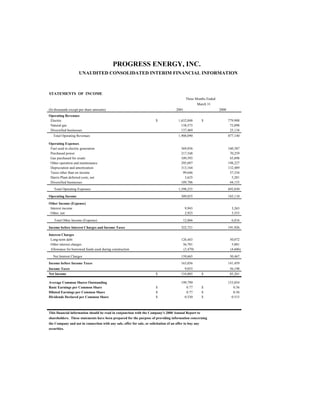
This document provides unaudited consolidated interim financial information for Progress Energy, Inc. for the third quarter and first nine months of 2001 compared to the same periods in 2000. Some key highlights include:
- Revenues increased significantly from acquisitions completed in late 2000, including the addition of Florida Power Corporation.
- Operating income increased driven by customer growth, favorable weather, and acquisitions, partially offset by higher fuel and purchased power costs.
- Net income increased due to the addition of Florida Power Corporation and other acquisitions, partially offset by higher interest charges and goodwill amortization.
- Earnings per share increased to $1.77 and $3.12 for the quarter
Progress Energy reported earnings of $2.65 per share for 2001, meeting expectations. Earnings were positively impacted by its non-regulated businesses which offset the effects of mild weather and an industrial slowdown. It also received tax rulings for four synthetic fuel plants and reaffirmed its 2002 guidance of $3.90 to $4.10 per share.
progress energy 1Q 02 earnings releaseFinal_allfinance25
Progress Energy reported first quarter earnings per share of $0.62, and $0.77 excluding one-time items. A rate settlement in Florida contributed $0.10 per share in retroactive revenue. Progress Energy reaffirmed its 2002 EPS guidance of $3.90 to $4.10. Several factors including mild weather, economic conditions, and debt issuance impacted the year-over-year EPS difference of $0.11.
progress energy 2Q 02earnings release Finalfinance25
Progress Energy reported second quarter 2002 earnings per share of $0.56, or $0.83 excluding non-operating items. This was in line with guidance. Key highlights included reaching long-term rate agreements in Florida and North Carolina that stabilize rates through 2005 and 2007 respectively. For 2002, the company expects ongoing earnings between $3.90-$4.00 per share, within previous guidance despite industrial slowdowns impacting some regions.
progress energy 3Q 02.earnings.release.andfinancialsfinance25
- Progress Energy reported ongoing quarterly earnings of $1.53 per share and GAAP earnings of $0.71 per share. It expects 2002 ongoing earnings to be within its target range of $3.90 to $4.00 per share.
- It announced an agreement to sell NCNG to Piedmont Natural Gas for $425 million, which will be used to pay down debt.
- For 2003, it expects 3% earnings growth over 2002 through cost management, sales growth at its electric utilities, and additional revenues from its non-regulated business.
BB&T reported 2008 net income of $1.5 billion and earnings per common share of $2.71. For the fourth quarter of 2008, net income totaled $305 million and net income available to common shareholders totaled $284 million, or $.51 per diluted common share. For the full year 2008, BB&T's net income available to common shareholders was $1.50 billion compared to $1.73 billion earned in 2007, a decrease of 13.6%.
- BB&T Corporation reported lower operating earnings for the fourth quarter of 2008 compared to the same period in 2007. Operating earnings available to common shareholders decreased 41.4% to $243 million.
- Net interest income increased 14.2% to $1,132 million due to higher interest income, but this was more than offset by a large increase in the provision for credit losses of $344 million.
- Returns and profitability ratios declined from the prior year, with the return on average common equity decreasing to 7.26% and the efficiency ratio worsening to 51.9%.
This document is a proxy statement from Carolina Power & Light Company (CP&L) informing shareholders about the upcoming annual shareholder meeting on May 14, 2008. The meeting will address the election of two Class I directors and the ratification of Deloitte & Touche LLP as the company's independent registered public accounting firm. Shareholders are encouraged to vote by proxy card or telephone in order to have their votes counted if they do not attend the meeting in person.
This document is a proxy statement from Progress Energy, Inc. inviting shareholders to attend the company's 2008 Annual Meeting of Shareholders on May 14, 2008. The matters to be voted on include the election of directors, ratification of the selection of the independent registered public accounting firm, and a shareholder proposal regarding executive compensation. Shareholders are urged to vote by proxy card, telephone, or online in order to have their votes counted if they do not attend the meeting in person.
The document summarizes Bill Johnson's presentation at the Morgan Stanley Global Electricity & Energy Conference on April 3, 2008. The presentation outlines Progress Energy's strategy to secure its energy future through operational excellence, growth prospects like rate base expansion, and maintaining constructive regulation. It highlights Progress Energy's two regulated utilities with strong growth prospects and discusses key strategic issues like US climate change policy and needed new baseload capacity like the proposed Levy County nuclear project.
Bill Johnson, Chairman, CEO, and President of Progress Energy, presented at the company's annual shareholder meeting. He discussed Progress Energy's history of over 100 years in business, highlights from 2007 including financial and operational achievements as well as sustainability recognition, strategic focus on its two electric utility subsidiaries serving North Carolina and Florida. Johnson also outlined Progress Energy's balanced strategy to address issues like climate change, demand growth, and costs while maintaining reliability and affordability. He discussed governance practices and executive compensation policies.
Progress Energy reported first quarter 2008 results. Earnings were lower than expected due to milder than normal weather and lower customer growth and usage, particularly in Florida. The company reaffirmed its 2008 earnings guidance. Several regulatory filings and projects remained on track. Key nuclear, natural gas, and transmission projects were progressing to increase capacity and meet renewable energy goals. While economic conditions had softened retail demand, cost management and additional wholesale contracts were expected to offset impacts.
The document summarizes Progress Energy's Q2 2008 earnings call. It discusses the company reaffirming its 2008 ongoing earnings guidance of $3.05 per share despite challenges in Florida. It also provides updates on recent court rulings impacting emissions regulations, the Levy County nuclear project, and major capital expenditure projects. Progress Energy's CFO discusses the company's quarterly and year-to-date financial performance and steps taken to offset weakness in Florida retail markets through increased wholesale contracts.
Bill Johnson, CEO of Progress Energy, outlined the company's strategy to secure its energy future at a Lehman Brothers energy conference. Progress Energy operates as two high-performing electric utilities serving North Carolina and Florida. The company is focused on achieving annual EPS growth of 4-5% through rate base expansion and pursuing a balanced solution to meet energy needs and address climate change, while maintaining excellent operational and financial performance. A key part of this strategy is the proposed Levy Nuclear Project, a two-unit nuclear plant in Florida that would help reduce costs and carbon emissions.
This document summarizes a presentation given by Mark Mulhern, Senior Vice President and CFO of Progress Energy, at a Power & Gas Leaders Conference on September 24, 2008. The presentation discusses Progress Energy's strategy of securing its energy future through significant rate base growth, nuclear expansion projects, and maintaining a supportive regulatory environment. It provides an overview of Progress Energy's utilities in North Carolina and Florida, outlines major capital investment projects, and reviews the company's financial position and objectives to achieve steady earnings growth.
The document summarizes Progress Energy's Q3 2008 earnings call. It discusses ongoing earnings of $306M for Q3 2008, regulatory updates in the Carolinas and Florida, energy efficiency and alternative energy programs, and $7-8B in capital expenditures through 2013 for major generation projects. Cost controls have kept year-to-date O&M expenses flat compared to 2007 despite 2.5% reported growth. Customer growth has been positive but milder weather reduced retail usage. Guidance of $2.95-3.05 for 2008 ongoing earnings is maintained based on a trailing 12-month EPS of $2.91. Liquidity remains strong with $1.9B in available credit facilities and cash.
Progress Energy held a financial conference in Phoenix, Arizona on November 10-11, 2008. The conference focused on providing an overview of the company including its growth strategy and regulatory updates. Progress Energy is the largest regulated electric utility in the US with significant projected rate base growth through 2010 driven by investments in its regulated operations in North Carolina and Florida. Regulatory proceedings in both states approved various cost recovery filings which will support continued investment and earnings growth.
This document is a presentation by Bill Johnson, Chairman and CEO of Progress Energy, given at the EEI Financial Conference in Phoenix, AZ on November 11, 2008. The presentation provides an overview of Progress Energy, including its strategic focus on achieving long-term annual EPS growth of 4-5%, pursuing a balanced solution to secure the energy future, and sustaining financial strength during nuclear construction. It also discusses Progress Energy's regulated utilities, major capital projects, regulatory updates, and long-term financial objectives.
The document is a transcript from Progress Energy's 4Q 2008 earnings call. It discusses Progress Energy's financial results for 4Q and full year 2008, highlights achievements that position the company well for 2009, and reviews major capital projects and regulatory initiatives. Progress Energy affirmed its 2009 ongoing earnings guidance of $2.95 to $3.15 per share. The call also provided updates on Florida rate filings and the Levy Nuclear Project.
- Progress Energy reported financial results for the second quarter and first half of 2001. Total operating revenues increased $1.4 billion for the first half compared to the same period in 2000 due to the acquisition of Florida Power Corporation.
- Net income increased $73 million to $266 million for the first half, with earnings per share rising from $1.26 to $1.33. Earnings were positively impacted by the addition of Florida Power Corporation but faced higher interest charges and goodwill amortization from the acquisition.
- Operating revenues and energy sales increased across electric, natural gas, and diversified business segments. However, net income faced pressures from weather-related declines in electricity usage, higher operation and maintenance
This document provides unaudited consolidated interim financial information for Progress Energy, Inc. for the third quarter and first nine months of 2001 compared to the same periods in 2000. Some key highlights include:
- Revenues increased significantly from acquisitions completed in late 2000, including the addition of Florida Power Corporation.
- Operating income increased driven by customer growth, favorable weather, and acquisitions, partially offset by higher fuel and purchased power costs.
- Net income increased due to the addition of Florida Power Corporation and other acquisitions, partially offset by higher interest charges and goodwill amortization.
- Earnings per share increased to $1.77 and $3.12 for the quarter
Progress Energy reported earnings of $2.65 per share for 2001, meeting expectations. Earnings were positively impacted by its non-regulated businesses which offset the effects of mild weather and an industrial slowdown. It also received tax rulings for four synthetic fuel plants and reaffirmed its 2002 guidance of $3.90 to $4.10 per share.
progress energy 1Q 02 earnings releaseFinal_allfinance25
Progress Energy reported first quarter earnings per share of $0.62, and $0.77 excluding one-time items. A rate settlement in Florida contributed $0.10 per share in retroactive revenue. Progress Energy reaffirmed its 2002 EPS guidance of $3.90 to $4.10. Several factors including mild weather, economic conditions, and debt issuance impacted the year-over-year EPS difference of $0.11.
progress energy 2Q 02earnings release Finalfinance25
Progress Energy reported second quarter 2002 earnings per share of $0.56, or $0.83 excluding non-operating items. This was in line with guidance. Key highlights included reaching long-term rate agreements in Florida and North Carolina that stabilize rates through 2005 and 2007 respectively. For 2002, the company expects ongoing earnings between $3.90-$4.00 per share, within previous guidance despite industrial slowdowns impacting some regions.
progress energy 3Q 02.earnings.release.andfinancialsfinance25
- Progress Energy reported ongoing quarterly earnings of $1.53 per share and GAAP earnings of $0.71 per share. It expects 2002 ongoing earnings to be within its target range of $3.90 to $4.00 per share.
- It announced an agreement to sell NCNG to Piedmont Natural Gas for $425 million, which will be used to pay down debt.
- For 2003, it expects 3% earnings growth over 2002 through cost management, sales growth at its electric utilities, and additional revenues from its non-regulated business.
Confirmation of Payee (CoP) is a vital security measure adopted by financial institutions and payment service providers. Its core purpose is to confirm that the recipient’s name matches the information provided by the sender during a banking transaction, ensuring that funds are transferred to the correct payment account.
Confirmation of Payee was built to tackle the increasing numbers of APP Fraud and in the landscape of UK banking, the spectre of APP fraud looms large. In 2022, over £1.2 billion was stolen by fraudsters through authorised and unauthorised fraud, equivalent to more than £2,300 every minute. This statistic emphasises the urgent need for robust security measures like CoP. While over £1.2 billion was stolen through fraud in 2022, there was an eight per cent reduction compared to 2021 which highlights the positive outcomes obtained from the implementation of Confirmation of Payee. The number of fraud cases across the UK also decreased by four per cent to nearly three million cases during the same period; latest statistics from UK Finance.
In essence, Confirmation of Payee plays a pivotal role in digital banking, guaranteeing the flawless execution of banking transactions. It stands as a guardian against fraud and misallocation, demonstrating the commitment of financial institutions to safeguard their clients’ assets. The next time you engage in a banking transaction, remember the invaluable role of CoP in ensuring the security of your financial interests.
For more details, you can visit https://technoxander.com.
South Dakota State University degree offer diploma Transcriptynfqplhm
办理美国SDSU毕业证书制作南达科他州立大学假文凭定制Q微168899991做SDSU留信网教留服认证海牙认证改SDSU成绩单GPA做SDSU假学位证假文凭高仿毕业证GRE代考如何申请南达科他州立大学South Dakota State University degree offer diploma Transcript
The Rise and Fall of Ponzi Schemes in America.pptxDiana Rose
Ponzi schemes, a notorious form of financial fraud, have plagued America’s investment landscape for decades. Named after Charles Ponzi, who orchestrated one of the most infamous schemes in the early 20th century, these fraudulent operations promise high returns with little or no risk, only to collapse and leave investors with significant losses. This article explores the nature of Ponzi schemes, notable cases in American history, their impact on victims, and measures to prevent falling prey to such scams.
Understanding Ponzi Schemes
A Ponzi scheme is an investment scam where returns are paid to earlier investors using the capital from newer investors, rather than from legitimate profit earned. The scheme relies on a constant influx of new investments to continue paying the promised returns. Eventually, when the flow of new money slows down or stops, the scheme collapses, leaving the majority of investors with substantial financial losses.
Historical Context: Charles Ponzi and His Legacy
Charles Ponzi is the namesake of this deceptive practice. In the 1920s, Ponzi promised investors in Boston a 50% return within 45 days or 100% return in 90 days through arbitrage of international reply coupons. Initially, he paid returns as promised, not from profits, but from the investments of new participants. When his scheme unraveled, it resulted in losses exceeding $20 million (equivalent to about $270 million today).
Notable American Ponzi Schemes
1. Bernie Madoff: Perhaps the most notorious Ponzi scheme in recent history, Bernie Madoff’s fraud involved $65 billion. Madoff, a well-respected figure in the financial industry, promised steady, high returns through a secretive investment strategy. His scheme lasted for decades before collapsing in 2008, devastating thousands of investors, including individuals, charities, and institutional clients.
2. Allen Stanford: Through his company, Stanford Financial Group, Allen Stanford orchestrated a $7 billion Ponzi scheme, luring investors with fraudulent certificates of deposit issued by his offshore bank. Stanford promised high returns and lavish lifestyle benefits to his investors, which ultimately led to a 110-year prison sentence for the financier in 2012.
3. Tom Petters: In a scheme that lasted more than a decade, Tom Petters ran a $3.65 billion Ponzi scheme, using his company, Petters Group Worldwide. He claimed to buy and sell consumer electronics, but in reality, he used new investments to pay off old debts and fund his extravagant lifestyle. Petters was convicted in 2009 and sentenced to 50 years in prison.
4. Eric Dalius and Saivian: Eric Dalius, a prominent figure behind Saivian, a cashback program promising high returns, is under scrutiny for allegedly orchestrating a Ponzi scheme. Saivian enticed investors with promises of up to 20% cash back on everyday purchases. However, investigations suggest that the returns were paid using new investments rather than legitimate profits. The collapse of Saivian l
Falcon stands out as a top-tier P2P Invoice Discounting platform in India, bridging esteemed blue-chip companies and eager investors. Our goal is to transform the investment landscape in India by establishing a comprehensive destination for borrowers and investors with diverse profiles and needs, all while minimizing risk. What sets Falcon apart is the elimination of intermediaries such as commercial banks and depository institutions, allowing investors to enjoy higher yields.
Budgeting as a Control Tool in Government Accounting in Nigeria
Being a Paper Presented at the Nigerian Maritime Administration and Safety Agency (NIMASA) Budget Office Staff at Sojourner Hotel, GRA, Ikeja Lagos on Saturday 8th June, 2024.
Explore the world of investments with an in-depth comparison of the stock market and real estate. Understand their fundamentals, risks, returns, and diversification strategies to make informed financial decisions that align with your goals.
An accounting information system (AIS) refers to tools and systems designed for the collection and display of accounting information so accountants and executives can make informed decisions.
1. PROGRESS ENERGY, INC.
UNAUDITED CONSOLIDATED INTERIM FINANCIAL INFORMATION
STATEMENTS OF INCOME
Three Months Ended
March 31
(In thousands except per share amounts) 2001 2000
Operating Revenues
Electric $ 1,632,048 $ 779,908
Natural gas 138,573 72,098
Diversified businesses 137,469 25,134
Total Operating Revenues 1,908,090 877,140
Operating Expenses
Fuel used in electric generation 369,856 160,387
Purchased power 217,548 70,259
Gas purchased for resale 109,593 43,898
Other operation and maintenance 295,097 198,227
Depreciation and amortization 313,164 132,489
Taxes other than on income 99,646 37,334
Harris Plant deferred costs, net 3,625 5,281
Diversified businesses 189,706 44,155
Total Operating Expenses 1,598,235 692,030
Operating Income 309,855 185,110
Other Income (Expense)
Interest income 9,943 3,263
Other, net 2,923 3,553
Total Other Income (Expense) 12,866 6,816
Income before Interest Charges and Income Taxes 322,721 191,926
Interest Charges
Long-term debt 126,443 50,072
Other interest charges 36,701 5,001
Allowance for borrowed funds used during construction (3,479) (4,606)
Net Interest Charges 159,665 50,467
Income before Income Taxes 163,056 141,459
Income Taxes 9,053 56,198
Net Income $ 154,003 $ 85,261
Average Common Shares Outstanding 199,799 153,054
Basic Earnings per Common Share $ 0.77 $ 0.56
Diluted Earnings per Common Share $ 0.77 $ 0.56
Dividends Declared per Common Share $ 0.530 $ 0.515
This financial information should be read in conjunction with the Company's 2000 Annual Report to
shareholders. These statements have been prepared for the purpose of providing information concerning
the Company and not in connection with any sale, offer for sale, or solicitation of an offer to buy any
securities.
2. Progress Energy, Inc.
BALANCE SHEETS March 31 December 31
(In thousands) 2001 2000
ASSETS
Utility Plant
Electric utility plant in service $ 18,205,786 $ 18,124,036
Gas utility plant in service 382,936 378,464
Accumulated depreciation (9,551,807) (9,350,235)
Utility plant in service, net 9,036,915 9,152,265
Held for future use 16,302 16,302
Construction work in progress 1,186,617 1,043,439
Nuclear fuel, net of amortization 257,574 224,692
Total Utility Plant, Net 10,497,408 10,436,698
Current Assets
Cash and cash equivalents 83,293 101,296
Accounts receivable 652,057 925,911
Taxes receivable - -
Inventory 519,914 420,985
Deferred fuel cost 98,032 217,806
Prepayments 16,594 50,040
Assets Held for Sale, net 782,763 747,745
Other current assets 183,598 192,347
Total Current Assets 2,336,251 2,656,130
Deferred Debits and Other Assets
Income taxes recoverable through future rates 213,639 208,997
Harris Plant deferred costs 41,850 44,813
Unamortized debt expense 38,971 38,771
Nuclear decommissioning trust funds 813,072 811,998
Diversified business property, net 747,173 729,662
Miscellaneous other property and investments 602,163 510,935
Goodwill, net 3,605,862 3,652,429
Other assets and deferred debits 813,619 1,000,579
Total Deferred Debits and Other Assets 6,876,349 6,998,184
Total Assets $ 19,710,008 $ 20,091,012
CAPITALIZATION AND LIABILITIES
Capitalization
Common stock equity $ 5,446,342 $ 5,424,201
Preferred stock of subsidiary - redemption not required 92,831 92,831
Long-term debt, net 9,201,322 5,890,099
Total Capitalization 14,740,495 11,407,131
Current Liabilities
Current portion of long-term debt 202,000 184,037
Accounts payable 325,137 828,568
Taxes accrued 23,535 932
Interest accrued 120,276 121,433
Dividends declared 107,825 107,645
Short-term Obligations 868,315 3,972,674
Other current liabilities 482,911 447,370
Total Current Liabilities 2,129,999 5,662,659
Deferred Credits and Other Liabilities
Accumulated deferred income taxes 1,698,037 1,807,192
Accumulated deferred investment tax credits 242,301 261,255
Other liabilities and deferred credits 899,176 952,775
Total Deferred Credits and Other Liabilities 2,839,514 3,021,222
Total Capitalization and Liabilities $ 19,710,008 $ 20,091,012
SCHEDULES OF COMMON STOCK EQUITY
(In thousands)
Common stock (without par value, authorized 500,000,000, issued and outstanding $ 3,610,146 $ 3,608,902
206,082,949 and 206,089,047 shares, respectively)
Unearned ESOP common stock (119,759) (127,211)
Accumulated other comprehensive loss (34,991) -
Retained earnings 1,990,946 1,942,510
Total Common Stock Equity $ 5,446,342 $ 5,424,201
3. Progress Energy, Inc.
SUPPLEMENTAL DATA Three Months Ended
March 31
2000 (1)
2001
Operating Revenues (in thousands)
Electric
Retail $ 1,323,017 $ 634,667
Wholesale 264,433 129,691
Unbilled (61,878) -
Miscellaneous revenue 106,464 15,550
Total Electric 1,632,036 779,908
Natural gas 138,573 72,098
Diversified businesses 137,469 25,134
Total Operating Revenues $ 1,908,078 $ 877,140
Energy Sales
Electric (millions of kWh)
Retail
Residential 8,722 3,928
Commercial 5,274 2,556
Industrial 4,194 3,400
Other retail 962 341
Total Retail 19,152 10,225
Unbilled (1,168) (65)
Wholesale 4,779 3,708
Total Electric 22,763 13,868
Natural Gas (thousands of dt) 14,845 17,344
Energy Supply (millions of kWh)
Generated - steam 11,913 7,460
nuclear 7,138 5,664
hydro 53 176
combustion turbines 1,137 34
Purchased 3,674 1,032
Total Energy Supply (Company Share) 23,915 14,366
Detail of Income Taxes (in thousands)
Income tax expense (credit) - current $ 35,206 $ 89,837
deferred (19,182) (31,040)
investment tax credit (6,971) (2,599)
Total Income Tax Expense $ 9,053 $ 56,198
FINANCIAL STATISTICS
Ratio of earnings to fixed charges 2.73 3.85
Return on average common stock equity 13.20 % 11.31 %
Book value per common share $ 27.24 $ 22.38
Capitalization ratios
Common stock equity 36.95 % 47.55 %
Preferred stock of subsidiary- redemption not required 0.63 0.81
Long-term debt, net 62.42 51.64
Total 100.00 % 100.00 %
(1) Supplemental data does not include information related to Florida Progress for the three months ended
March 31, 2000.
4. Progress Energy, Inc.
Reported Earnings Variance Analysis
First Quarter 2001 vs. 2000
Florida Regulated Energy Other
(Per share) CP&L Power Natural Ventures Diversified Corporate Consolidated
(Electric) (Electric) Gas Business Unit Businesses
2000 earnings 0.56 - 0.06(E) (0.06)(E) 0.56
Weather - -
Customer growth and usage 0.04 0.04
Other margin 0.04 (0.01) 0.03
Addition of FPC operations 0.36(C) 0.14 (0.01) (0.11)(G) 0.38
O&M 0.09 (A) (0.01) 0.08
Interest charges (0.04) (0.18) (0.22)
Goodwill (0.10) (0.10)
Diversified businesses 0.07 0.06 0.13
Share dilution (0.14) (B) (0.14)(B)
Income taxes - other 0.05 0.05 (D)
Eliminations/other (0.04)(G) (0.04)
2001 earnings 0.60 (F) 0.36(F) 0.04 0.21 (0.01) (0.43) 0.77
Regulated Natural Gas includes NCNG and Eastern NCNG
Energy Ventures includes Electric Fuels, Progress Energy Ventures, and Monroe Power
Other Diversified Businesses includes SRS and Progress Telecom
Corporate includes eliminations, interest expense, goodwill and intra-period tax allocations
(A) .01 related to exclusion of NCNG, .04 related to Jan 2000 ice storm
(B) Related to issuance of 46.5 million common shares in connection with FPC acquisition in Dec 2000
(C) See Table 1
(D) Income statement line items are tax-effected at the statutory rate. Differences between the statutory and effective rates
are reflected in quot;Income taxes-otherquot;. The year-to-date variance primarily results from depreciation permanent differences.
(E) These companies were moved from a subsidiary of CP&L to Progress Energy in June 2000 with the holding company formation.
(F) Includes approximately .06 per share in CP&L and .04 per share in Florida Power related to energy marketing and trading.
(G) Includes intra-period tax allocation adjustment which will vary each quarter. These adjustments will reverse for the year 2001.
Table 1
Florida Power
Reported Earnings Variance Analysis
First Quarter 2001 vs. 2000
2000 earnings $ 0.64
Weather 0.04
Customer growth and usage 0.02
O&M 0.02
Share dilution (0.32)
Depreciation (0.01)
Other taxes (0.02)
Eliminations/other (0.01)
2001 earnings $ 0.36