Download as PDF, PPTX


![root@local:/# ab2 -n 50000 -c 500 http://lb.ours.tld/start
This is ApacheBench, Version 2.3 <$Revision: 655654 $>
Copyright 1996 Adam Twiss, Zeus Technology Ltd, http://
www.zeustech.net/
Licensed to The Apache Software Foundation, http://
www.apache.org/
...
Requests per second: A_LOT [#/sec] (mean)
Time per request: REALLY_FAST [ms] (mean)
Time per request: EVEN_FASTER [ms] (mean, across all
concurrent requests)
We first run Apache-Bench. Everything looked pretty good.](https://image.slidesharecdn.com/profilingforgrown-ups-121123022358-phpapp02/85/Profiling-for-Grown-Ups-17-320.jpg)


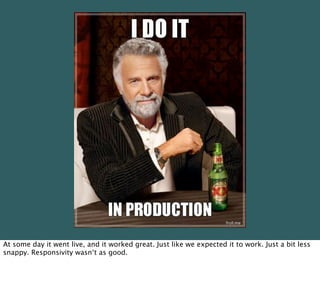

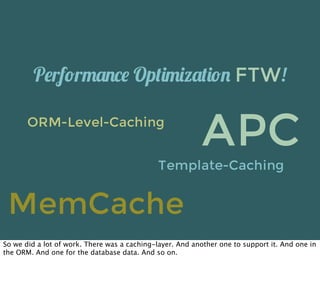


The document discusses two significant experiences related to performance and scaling challenges in software projects using different technologies. The first story details the unexpected performance issues encountered before a live event on a video-on-demand platform, while the second describes a cloud project that faced similar slow response times despite initial positive results. The speaker emphasizes the importance of effective profiling, proper load testing, and ensuring adequate resources to maintain application performance under varying user conditions.