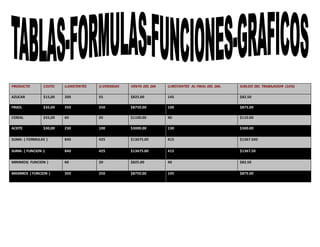
The document contains sales data for four products - sugar, beans, cereal, and oil - over the course of a day. It includes the starting and ending inventory levels, units sold, sales totals, and the 10% commission amount for each product. Charts and graphs are provided to visualize the cost of each product, starting inventory levels, units sold, sales amounts, and ending inventory levels.