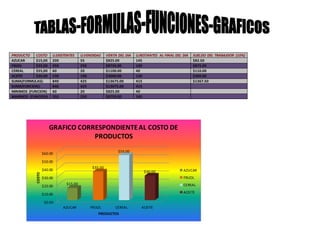
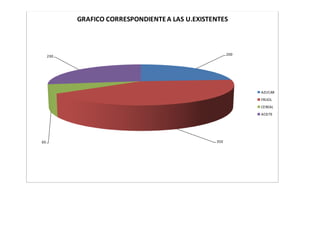
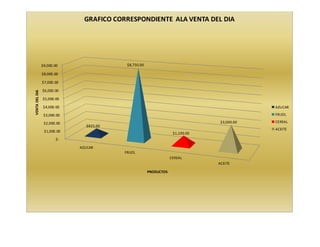
The document contains data on the cost, existing units, units sold, day sales, remaining units, and worker salary (10% of sales) for four products: sugar, beans, cereal, and oil. It also includes six graphs showing the corresponding data for cost, existing units, units sold, day sales, remaining units, and worker salary.


![Lecci%c3%b3n+v..[1]](https://cdn.slidesharecdn.com/ss_thumbnails/leccic3b3nv-1-100807102258-phpapp02-thumbnail.jpg?width=640&height=640&fit=bounds)


