The document examines Toyota's organizational culture and its implications on crisis management, particularly in light of a recall crisis involving unintended acceleration issues. While Toyota's culture is criticized for arrogance and insularity, investigations suggest that driver error rather than Toyota's culture or technology may be the root cause of the accidents. The case study aims to address the relationship between organizational culture and ethics, consumer trust, and organizational structures, while proposing solutions and reflecting on the assignment's impact on leadership development.

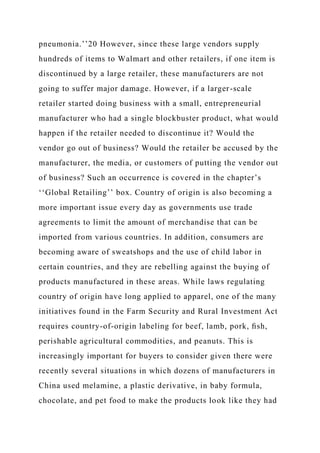
![assumes that the percentage fluctuations in monthly stock from
average stock should be half as great as the percentage
fluctuations in monthly sales from average sales.
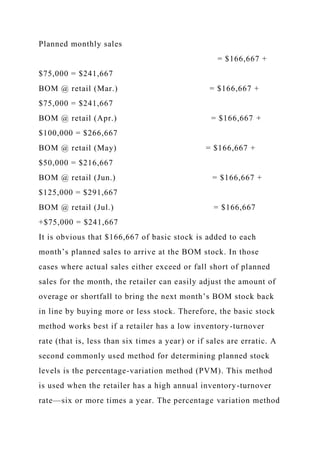
BOM stock =Average stock for season x ½ [1 +
(Planned sales for the month/Average monthly sales)]
Since the PVM utilizes the same components as the BSM, we
can use the data from the previous example.
BOM (Feb.) -$250,000 x 1/2[1 +
($75,000/$83,333)] - $237,500
BOM (Mar.) -$250,000 x 1/2[1 + ($75,000/$83,333)]
- $237,500
BOM (Apr.) -$250,000 x 1/2[1 +
($100,000/$83,333)] - $275,000
BOM (May) -$250,000 x 1/2[1 + ($50,000/$83,333)]
- $200,000
BOM (Jun.) -$250,000 x 1/2[1 +
($125,000/$83,333)] - $312,500
BOM (Jul.) -$250,000 x 1/2[1 +
($75,000/$83,333)] - $237,500
A third method for planning inventory levels is the weeks’
supply method (WSM). Generally, the WSM formula is used by
retailers such as grocers, whose inventories are planned on a
weekly, not monthly, basis and where sales do not fluctuate
substantially. It states that the inventory level should be set
equal to a predetermined number of weeks’ supply. The](https://image.slidesharecdn.com/problemstatementwithoperationsinmorethan160countriesandr-221026032748-c5e88207/85/Problem-StatementWith-operations-in-more-than-160-countries-and-r-docx-17-320.jpg)