Download as PDF, PPTX
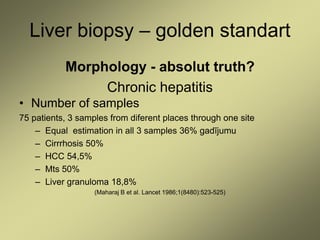
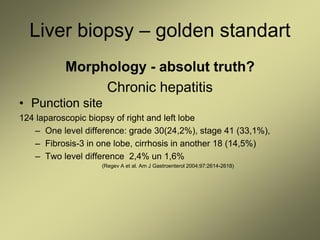
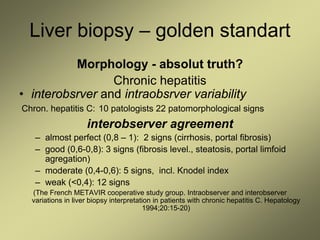
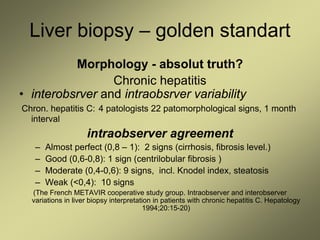


1) Liver fibrosis and steatosis can be assessed through various imaging modalities like ultrasound, CT, MRI and biopsy. However, liver biopsy as the gold standard has limitations related to sample size, number of samples, and inter-observer variability. 2) Non-invasive techniques like transient elastography (FibroScan) and real time elastography have good diagnostic accuracy for staging liver fibrosis compared to biopsy but may overestimate in cases of elevated liver enzymes. 3) Doppler ultrasound of the liver can provide useful information for assessing liver fibrosis through measurements of blood flow in the portal vein, hepatic arteries and hepatic veins. Changes in waveforms indicate advancing fibrosis. 4) MRI and CT can also


