Price elasticity of demand
•Download as DOCX, PDF•
0 likes•958 views

AQA, Aquinas, Economics, ECON1, Markets, Market Failure
Report
Share
Report
Share
Recommended
Price Elasticity of Demand
The document discusses key concepts related to elasticity of demand and supply, including:
1) Price elasticity of demand measures how quantity demanded responds to changes in price, and can be elastic, unit elastic, or inelastic.
2) Factors like availability of substitutes and necessity/luxury of a good influence its price elasticity.
3) Price elasticity of supply measures how quantity supplied responds to price changes and can also be elastic, unit elastic, or inelastic based on production flexibility.
4) Other elasticities like cross elasticity and income elasticity also help understand demand responses.
Types of price elasticity
This presentation discusses the different types of price elasticity of demand. There are five types: perfectly elastic demand, relatively elastic demand, unitary elastic demand, relatively inelastic demand, and perfectly inelastic demand. Perfectly elastic demand means that demand changes proportionally to any change in price, while perfectly inelastic demand means that demand does not change with price changes. There are several methods used to measure price elasticity of demand quantitatively, including percentage change, total revenue, and geometric methods.
Price elasticity of demand (economics)
The document defines price elasticity of demand (PED) and explains the different types of elasticity:
1) Perfectly elastic demand has a PED of infinity and quantity demanded does not change with price.
2) Perfectly inelastic demand has a PED of zero and quantity demanded does not change with price.
3) Elastic, inelastic, and unitary elastic demands are defined by their PED falling between the extremes of 0 and infinity.
Types of elasticity of demand
The document discusses four types of elasticity of demand: price elasticity, cross elasticity, income elasticity, and advertising elasticity. It provides details on cross elasticity, explaining that it measures the responsiveness of the quantity demanded of a good to a change in the price of a related good. Cross elasticity can be positive, negative, or zero depending on whether the goods are substitutes, complements, or unrelated. Income elasticity measures the responsiveness of demand for a good to a change in consumer income. It too can be positive, negative, or zero, depending on whether the good is normal, inferior, or if demand is unchanged by income changes. Advertising elasticity measures the responsiveness of demand
Price Elasticity of Demand
Price Elasticity of Demand measures how responsive demand is to changes in price. It is calculated by taking the percentage change in quantity demanded divided by the percentage change in price. Perfectly inelastic demand does not change with price changes. Inelastic demand changes less than proportionately to price changes. Unit elastic demand changes proportionately. Elastic demand changes more than proportionately. Factors like substitutes, necessity, income share, and time period impact price elasticity. Producers use elasticity estimates to predict revenue and tax impacts and for price discrimination.
Nidhi ppt (production function)
The document discusses production functions and their key characteristics. It defines production functions and provides examples. There are two main types of production functions - fixed proportions and variable proportions. The law of variable proportions describes the relationship between inputs and output when varying one input while holding others constant. In the short run, marginal returns initially increase, then diminish and eventually become negative. In the long run, all inputs are variable and production isoquants illustrate input combinations producing the same output level. Assumptions of production functions include perfect divisibility and substitution between factors.
Production Function
This document discusses production functions and their types. It defines a production function as an equation, table, or graph that shows the maximum output a firm can produce from given inputs over a period of time. It identifies the key inputs as labor, capital, land, raw materials, and power. Fixed and variable inputs are explained, with fixed inputs remaining constant and variable inputs changing with output levels. The concepts of total, average, and marginal product are introduced. Different types of production functions are outlined, including fixed and variable proportion functions. The document also discusses production in the short run and long run. Isoquants and marginal rate of technical substitution are briefly explained.
Elasticity Of Demand.Ppt
This document defines and explains different types of elasticity of demand including price elasticity, income elasticity, cross elasticity, and advertising elasticity. It discusses how elasticity is measured and factors that influence different types of elasticity. Key types are defined such as perfectly inelastic/elastic demand curves. Methods to measure elasticity including percentage and total revenue methods are also summarized. The importance of understanding elasticity for business decisions and policymaking is highlighted.
Creative commons licenses for aquinas economics a2
This document lists various images and their Creative Commons licenses that are used on the Aquinas Economics A2 website. It provides information on the medium, description, owner, license type, intended usage location, and original location for each image. The images cover topics like Wall Street, book spines, railroads, stock exchanges, and more. The licenses range from CC-BY to CC-BY-NC-ND and sources include Wikimedia Commons, Flickr, and Creative Commons.
The theory of production short run
The document discusses key concepts in production economics including short run production, total costs, fixed costs, variable costs, marginal product, diminishing returns, depreciation, productive efficiency, and optimal output. It provides definitions for these terms and asks the reader to explain concepts like diminishing returns and depreciation. It also asks the reader to draw a cost curve diagram showing marginal cost, average total cost, average variable cost, and average fixed cost.
The theory of production long run
This document discusses long run production theory and key concepts including: returns to scale like increasing, decreasing, and constant; possible shapes of long run average total cost curves; the minimum efficient scale; and the relationship between short run and long run costs. It provides questions to answer on these topics as an economics study guide.
The objectives of firms
This document provides questions about key economic concepts related to firms, including defining profits, total revenue, average revenue, and marginal revenue. It asks the reader to explain how to calculate marginal revenue and draw average total revenue and marginal revenue curves. It also asks the reader to explain the traditional theory of the firm, the concept of normal profit, and profit maximization. Finally, it asks the reader to explain super normal and sub normal profits in relation to profit.
The growth of firms
Firms can grow internally through expanding production or externally through mergers and acquisitions. Internal growth involves a firm increasing production by investing in fixed capital, hiring more labor, or developing new products. External growth occurs when firms merge through horizontal integration, vertical integration, or conglomerate mergers. When considering external growth, firms evaluate options like costs, synergies, market power, and risks.
Technological change
Technological change has three components: invention, innovation, and diffusion. Invention is developing a new idea, while innovation is putting the new idea into practice. When a firm innovates, it can reduce costs through more efficient production methods or new products that increase revenue more than costs. An example is automation reducing labor costs through technologies like robotics on factory floors.
Sales maximisation theory
This document contains 5 questions about sales maximization theory and related economic concepts: 1) It asks to explain the term "sales maximization"; 2) How sales are related to market power and market share; 3) Why rational choice theory is sometimes considered unrealistic; 4) To explain the cost plus pricing strategy; 5) Find an example of a company delisting and why they would do so.
The Divorce of Ownership & Control
The document discusses the divorce of ownership and control, different forms of corporate ownership, stakeholders, and satisficing. Specifically, it asks the reader to: 1) Explain the divorce of ownership and control, where it is most likely found. 2) Outline forms of corporate ownership. 3) Explain who stakeholders are for Royal Bank of Scotland, British Airways, and Aquinas College. 4) Define satisficing. The document appears to be an economics study guide posing questions about key concepts.
The Economic Problem
The document discusses some of the basic economic concepts taught in the Aquinas College Economics Department. It explains that economics seeks to answer what to produce, how to produce it, and who receives it. Due to scarcity, or limited resources, choices must be made about how to allocate those resources. This scarcity means that every choice has an opportunity cost associated with it - the next best alternative that is given up. It provides examples of opportunity cost in government spending and personal spending to illustrate this concept.
The circular flow of income
This document provides questions about the circular flow of income model in economics. It asks the reader to explain the term economic model, draw a basic circular flow diagram showing exchanges between producers and consumers, explain why money flows in a circular fashion, define what is meant by an injection into the circular flow, draw a diagram illustrating an injection, explain what is a leakage or withdrawal from the circular flow and provide an example, and finally explain the multiplier effect.
Aggregate Demand
Aggregate demand is the total demand for final goods and services in an economy at a given overall price level and time period. An AD diagram plots aggregate demand (AD) on the y-axis against the price level on the x-axis, with the AD curve sloping downward to the right to show that as the price level increases, aggregate demand decreases. A movement along the AD curve represents a change in a component of AD like consumption, investment, or government spending that causes the overall level of spending to change but not the price level. The AD formula represents the components of aggregate demand as the sum of consumption (C), investment (I), government spending (G), and net exports (X-M). Economic growth would cause
Production
This document contains 8 questions about production, productivity, and costs for an economics assignment. It asks the reader to define production and the difference between production and productivity. It also asks the reader to explain how firms can increase productivity, the advantages of higher production, and the link between demand and productivity. Finally, it asks the reader to define fixed and variable costs and draw a graph to explain productive efficiency.
The supply curve
The document discusses the supply curve and related economic concepts. It asks the reader to: 1) Explain what supply means; 2) Draw a supply curve based on given price and quantity data for llamas and show how it would change if the supplied quantity increased by 3 llamas at each level; 3) Label the supply curves appropriately; 4) Identify other goods that could affect the supply of car tires; 5) List factors that can affect a product's supply; and 6) Explain the term "producer surplus".
Price determination
Supply refers to the quantity of a good or service that producers are willing and able to offer for sale at various possible prices over a period of time. A supply curve shows the relationship between the price of a good and the quantity supplied, with the quantity normally increasing as price rises. If the quantity supplied increases at each price level, the supply curve will shift rightward parallel to the original curve. Factors that can affect supply include input prices, technology, expectations of future prices, number of suppliers, and natural conditions. Producer surplus measures the difference between the price producers receive and their marginal cost of production, representing economic profit for producers.
The demand curve
Demand refers to how much of a product consumers are willing and able to purchase at different prices. Ceteris paribus means all else being equal. The document provides a table with price and demand data for peanuts and instructs the reader to draw a demand curve on a graph using this data, then show the effect of rising incomes and a recession on demand by shifting the curve. It also asks the reader to identify other factors that can affect demand and explain the term consumer surplus.
Unemployment
This document discusses unemployment, including how it is measured, its causes and types, and ways to combat it. It measures unemployment using the claimant count and labor force survey. Causes of unemployment include geographical and occupational immobility, deindustrialization, and voluntary unemployment. Types include frictional, casual, structural, technological, cyclical, and classical unemployment. Combating unemployment involves demand-side policies like stimulus and supply-side policies like education and training programs.
The Phillips Curve
The document discusses the Phillips Curve, which originally showed a short-run tradeoff between inflation and unemployment according to data analyzed by Prof. Phillips. Lower unemployment was believed to cause higher inflation as more employment and spending increased aggregate demand. However, in the 1970s both inflation and unemployment remained high, a phenomenon known as stagflation, requiring economists to rethink the Phillips Curve relationship in the long run.
International Trade
This document from the Aquinas College Economics Department covers several topics related to international trade, including:
1. Theories of absolute and comparative advantage in trade between developed and developing countries.
2. Attitudes toward trade, including developing countries seen as sources of cheap labor and raw materials, and concerns about job losses in developed countries.
3. Benefits and challenges of trade for developing countries, such as increased integration, multiplier effects, and terms of trade issues.
4. Benefits of international trade more broadly, including specialization, exploitation of economies of scale, and potential rises in living standards.
5. Explanations and examples of the theories of absolute advantage and comparative advantage in trade
Inflation and Deflation
Inflation and Deflation key information for ECON4 - Building on the knowledge you should have from ECON2
Main Java[All of the Base Concepts}.docx
This is part 1 of my Java Learning Journey. This Contains Custom methods, classes, constructors, packages, multithreading , try- catch block, finally block and more.
Chapter 4 - Islamic Financial Institutions in Malaysia.pptx
Chapter 4 - Islamic Financial Institutions in Malaysia.pptxMohd Adib Abd Muin, Senior Lecturer at Universiti Utara Malaysia
This slide is special for master students (MIBS & MIFB) in UUM. Also useful for readers who are interested in the topic of contemporary Islamic banking.
More Related Content
More from Aquinas College Economics Department
Creative commons licenses for aquinas economics a2
This document lists various images and their Creative Commons licenses that are used on the Aquinas Economics A2 website. It provides information on the medium, description, owner, license type, intended usage location, and original location for each image. The images cover topics like Wall Street, book spines, railroads, stock exchanges, and more. The licenses range from CC-BY to CC-BY-NC-ND and sources include Wikimedia Commons, Flickr, and Creative Commons.
The theory of production short run
The document discusses key concepts in production economics including short run production, total costs, fixed costs, variable costs, marginal product, diminishing returns, depreciation, productive efficiency, and optimal output. It provides definitions for these terms and asks the reader to explain concepts like diminishing returns and depreciation. It also asks the reader to draw a cost curve diagram showing marginal cost, average total cost, average variable cost, and average fixed cost.
The theory of production long run
This document discusses long run production theory and key concepts including: returns to scale like increasing, decreasing, and constant; possible shapes of long run average total cost curves; the minimum efficient scale; and the relationship between short run and long run costs. It provides questions to answer on these topics as an economics study guide.
The objectives of firms
This document provides questions about key economic concepts related to firms, including defining profits, total revenue, average revenue, and marginal revenue. It asks the reader to explain how to calculate marginal revenue and draw average total revenue and marginal revenue curves. It also asks the reader to explain the traditional theory of the firm, the concept of normal profit, and profit maximization. Finally, it asks the reader to explain super normal and sub normal profits in relation to profit.
The growth of firms
Firms can grow internally through expanding production or externally through mergers and acquisitions. Internal growth involves a firm increasing production by investing in fixed capital, hiring more labor, or developing new products. External growth occurs when firms merge through horizontal integration, vertical integration, or conglomerate mergers. When considering external growth, firms evaluate options like costs, synergies, market power, and risks.
Technological change
Technological change has three components: invention, innovation, and diffusion. Invention is developing a new idea, while innovation is putting the new idea into practice. When a firm innovates, it can reduce costs through more efficient production methods or new products that increase revenue more than costs. An example is automation reducing labor costs through technologies like robotics on factory floors.
Sales maximisation theory
This document contains 5 questions about sales maximization theory and related economic concepts: 1) It asks to explain the term "sales maximization"; 2) How sales are related to market power and market share; 3) Why rational choice theory is sometimes considered unrealistic; 4) To explain the cost plus pricing strategy; 5) Find an example of a company delisting and why they would do so.
The Divorce of Ownership & Control
The document discusses the divorce of ownership and control, different forms of corporate ownership, stakeholders, and satisficing. Specifically, it asks the reader to: 1) Explain the divorce of ownership and control, where it is most likely found. 2) Outline forms of corporate ownership. 3) Explain who stakeholders are for Royal Bank of Scotland, British Airways, and Aquinas College. 4) Define satisficing. The document appears to be an economics study guide posing questions about key concepts.
The Economic Problem
The document discusses some of the basic economic concepts taught in the Aquinas College Economics Department. It explains that economics seeks to answer what to produce, how to produce it, and who receives it. Due to scarcity, or limited resources, choices must be made about how to allocate those resources. This scarcity means that every choice has an opportunity cost associated with it - the next best alternative that is given up. It provides examples of opportunity cost in government spending and personal spending to illustrate this concept.
The circular flow of income
This document provides questions about the circular flow of income model in economics. It asks the reader to explain the term economic model, draw a basic circular flow diagram showing exchanges between producers and consumers, explain why money flows in a circular fashion, define what is meant by an injection into the circular flow, draw a diagram illustrating an injection, explain what is a leakage or withdrawal from the circular flow and provide an example, and finally explain the multiplier effect.
Aggregate Demand
Aggregate demand is the total demand for final goods and services in an economy at a given overall price level and time period. An AD diagram plots aggregate demand (AD) on the y-axis against the price level on the x-axis, with the AD curve sloping downward to the right to show that as the price level increases, aggregate demand decreases. A movement along the AD curve represents a change in a component of AD like consumption, investment, or government spending that causes the overall level of spending to change but not the price level. The AD formula represents the components of aggregate demand as the sum of consumption (C), investment (I), government spending (G), and net exports (X-M). Economic growth would cause
Production
This document contains 8 questions about production, productivity, and costs for an economics assignment. It asks the reader to define production and the difference between production and productivity. It also asks the reader to explain how firms can increase productivity, the advantages of higher production, and the link between demand and productivity. Finally, it asks the reader to define fixed and variable costs and draw a graph to explain productive efficiency.
The supply curve
The document discusses the supply curve and related economic concepts. It asks the reader to: 1) Explain what supply means; 2) Draw a supply curve based on given price and quantity data for llamas and show how it would change if the supplied quantity increased by 3 llamas at each level; 3) Label the supply curves appropriately; 4) Identify other goods that could affect the supply of car tires; 5) List factors that can affect a product's supply; and 6) Explain the term "producer surplus".
Price determination
Supply refers to the quantity of a good or service that producers are willing and able to offer for sale at various possible prices over a period of time. A supply curve shows the relationship between the price of a good and the quantity supplied, with the quantity normally increasing as price rises. If the quantity supplied increases at each price level, the supply curve will shift rightward parallel to the original curve. Factors that can affect supply include input prices, technology, expectations of future prices, number of suppliers, and natural conditions. Producer surplus measures the difference between the price producers receive and their marginal cost of production, representing economic profit for producers.
The demand curve
Demand refers to how much of a product consumers are willing and able to purchase at different prices. Ceteris paribus means all else being equal. The document provides a table with price and demand data for peanuts and instructs the reader to draw a demand curve on a graph using this data, then show the effect of rising incomes and a recession on demand by shifting the curve. It also asks the reader to identify other factors that can affect demand and explain the term consumer surplus.
Unemployment
This document discusses unemployment, including how it is measured, its causes and types, and ways to combat it. It measures unemployment using the claimant count and labor force survey. Causes of unemployment include geographical and occupational immobility, deindustrialization, and voluntary unemployment. Types include frictional, casual, structural, technological, cyclical, and classical unemployment. Combating unemployment involves demand-side policies like stimulus and supply-side policies like education and training programs.
The Phillips Curve
The document discusses the Phillips Curve, which originally showed a short-run tradeoff between inflation and unemployment according to data analyzed by Prof. Phillips. Lower unemployment was believed to cause higher inflation as more employment and spending increased aggregate demand. However, in the 1970s both inflation and unemployment remained high, a phenomenon known as stagflation, requiring economists to rethink the Phillips Curve relationship in the long run.
International Trade
This document from the Aquinas College Economics Department covers several topics related to international trade, including:
1. Theories of absolute and comparative advantage in trade between developed and developing countries.
2. Attitudes toward trade, including developing countries seen as sources of cheap labor and raw materials, and concerns about job losses in developed countries.
3. Benefits and challenges of trade for developing countries, such as increased integration, multiplier effects, and terms of trade issues.
4. Benefits of international trade more broadly, including specialization, exploitation of economies of scale, and potential rises in living standards.
5. Explanations and examples of the theories of absolute advantage and comparative advantage in trade
Inflation and Deflation
Inflation and Deflation key information for ECON4 - Building on the knowledge you should have from ECON2
More from Aquinas College Economics Department (20)
Creative commons licenses for aquinas economics a2
Creative commons licenses for aquinas economics a2
Recently uploaded
Main Java[All of the Base Concepts}.docx
This is part 1 of my Java Learning Journey. This Contains Custom methods, classes, constructors, packages, multithreading , try- catch block, finally block and more.
Chapter 4 - Islamic Financial Institutions in Malaysia.pptx
Chapter 4 - Islamic Financial Institutions in Malaysia.pptxMohd Adib Abd Muin, Senior Lecturer at Universiti Utara Malaysia
This slide is special for master students (MIBS & MIFB) in UUM. Also useful for readers who are interested in the topic of contemporary Islamic banking.
Beyond Degrees - Empowering the Workforce in the Context of Skills-First.pptx
Iván Bornacelly, Policy Analyst at the OECD Centre for Skills, OECD, presents at the webinar 'Tackling job market gaps with a skills-first approach' on 12 June 2024
How to Fix the Import Error in the Odoo 17
An import error occurs when a program fails to import a module or library, disrupting its execution. In languages like Python, this issue arises when the specified module cannot be found or accessed, hindering the program's functionality. Resolving import errors is crucial for maintaining smooth software operation and uninterrupted development processes.
How to deliver Powerpoint Presentations.pptx
"How to make and deliver dynamic presentations by making it more interactive to captivate your audience attention"
Hindi varnamala | hindi alphabet PPT.pdf
हिंदी वर्णमाला पीपीटी, hindi alphabet PPT presentation, hindi varnamala PPT, Hindi Varnamala pdf, हिंदी स्वर, हिंदी व्यंजन, sikhiye hindi varnmala, dr. mulla adam ali, hindi language and literature, hindi alphabet with drawing, hindi alphabet pdf, hindi varnamala for childrens, hindi language, hindi varnamala practice for kids, https://www.drmullaadamali.com
Advanced Java[Extra Concepts, Not Difficult].docx
This is part 2 of my Java Learning Journey. This contains Hashing, ArrayList, LinkedList, Date and Time Classes, Calendar Class and more.
How to Setup Warehouse & Location in Odoo 17 Inventory
In this slide, we'll explore how to set up warehouses and locations in Odoo 17 Inventory. This will help us manage our stock effectively, track inventory levels, and streamline warehouse operations.
Wound healing PPT
This document provides an overview of wound healing, its functions, stages, mechanisms, factors affecting it, and complications.
A wound is a break in the integrity of the skin or tissues, which may be associated with disruption of the structure and function.
Healing is the body’s response to injury in an attempt to restore normal structure and functions.
Healing can occur in two ways: Regeneration and Repair
There are 4 phases of wound healing: hemostasis, inflammation, proliferation, and remodeling. This document also describes the mechanism of wound healing. Factors that affect healing include infection, uncontrolled diabetes, poor nutrition, age, anemia, the presence of foreign bodies, etc.
Complications of wound healing like infection, hyperpigmentation of scar, contractures, and keloid formation.
Pengantar Penggunaan Flutter - Dart programming language1.pptx
Pengantar Penggunaan Flutter - Dart programming language1.pptx
clinical examination of hip joint (1).pdf
described clinical examination all orthopeadic conditions .
Walmart Business+ and Spark Good for Nonprofits.pdf
"Learn about all the ways Walmart supports nonprofit organizations.
You will hear from Liz Willett, the Head of Nonprofits, and hear about what Walmart is doing to help nonprofits, including Walmart Business and Spark Good. Walmart Business+ is a new offer for nonprofits that offers discounts and also streamlines nonprofits order and expense tracking, saving time and money.
The webinar may also give some examples on how nonprofits can best leverage Walmart Business+.
The event will cover the following::
Walmart Business + (https://business.walmart.com/plus) is a new shopping experience for nonprofits, schools, and local business customers that connects an exclusive online shopping experience to stores. Benefits include free delivery and shipping, a 'Spend Analytics” feature, special discounts, deals and tax-exempt shopping.
Special TechSoup offer for a free 180 days membership, and up to $150 in discounts on eligible orders.
Spark Good (walmart.com/sparkgood) is a charitable platform that enables nonprofits to receive donations directly from customers and associates.
Answers about how you can do more with Walmart!"
BBR 2024 Summer Sessions Interview Training
Qualitative research interview training by Professor Katrina Pritchard and Dr Helen Williams
Reimagining Your Library Space: How to Increase the Vibes in Your Library No ...
Librarians are leading the way in creating future-ready citizens – now we need to update our spaces to match. In this session, attendees will get inspiration for transforming their library spaces. You’ll learn how to survey students and patrons, create a focus group, and use design thinking to brainstorm ideas for your space. We’ll discuss budget friendly ways to change your space as well as how to find funding. No matter where you’re at, you’ll find ideas for reimagining your space in this session.
Recently uploaded (20)
Chapter 4 - Islamic Financial Institutions in Malaysia.pptx
Chapter 4 - Islamic Financial Institutions in Malaysia.pptx
Beyond Degrees - Empowering the Workforce in the Context of Skills-First.pptx
Beyond Degrees - Empowering the Workforce in the Context of Skills-First.pptx
Liberal Approach to the Study of Indian Politics.pdf
Liberal Approach to the Study of Indian Politics.pdf
How to Setup Warehouse & Location in Odoo 17 Inventory
How to Setup Warehouse & Location in Odoo 17 Inventory
Pengantar Penggunaan Flutter - Dart programming language1.pptx
Pengantar Penggunaan Flutter - Dart programming language1.pptx
Walmart Business+ and Spark Good for Nonprofits.pdf
Walmart Business+ and Spark Good for Nonprofits.pdf
Reimagining Your Library Space: How to Increase the Vibes in Your Library No ...
Reimagining Your Library Space: How to Increase the Vibes in Your Library No ...
Price elasticity of demand
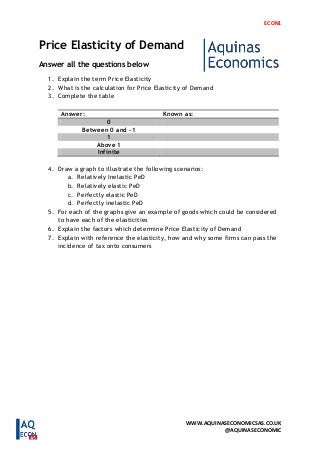
- 1. ECON1 WWW.AQUINASECONOMICSAS.CO.UK @AQUINASECONOMIC Price Elasticity of Demand Answer all the questions below 1. Explain the term Price Elasticity 2. What is the calculation for Price Elasticity of Demand 3. Complete the table Answer: Known as: 0 Between 0 and -1 1 Above 1 Infinite 4. Draw a graph to illustrate the following scenarios: a. Relatively Inelastic PeD b. Relatively elastic PeD c. Perfectly elastic PeD d. Perfectly inelastic PeD 5. For each of the graphs give an example of goods which could be considered to have each of the elasticities 6. Explain the factors which determine Price Elasticity of Demand 7. Explain with reference the elasticity, how and why some firms can pass the incidence of tax onto consumers