SlideShare a Scribd company logo
1 of 14
Download to read offline
Emir. J. Agric. Sci. 2005. 17 (1): 43-56 
http://www.cfa.uaeu.ac.ae/Research/EJAS.htm 
Prevalence of overweight and associated risk factors among 
primary female school children in Al-Ain city 
United Arab Emirates 
Abdelhamid Kerkadi, Nassar Abo-Elnaga, and Wissam Ibrahim 
Department of Nutrition and Health, College of Food and Agriculture, UAE University, UAE 
P.O Box 17555, Al Ain, UAE. 
Abstract: Obesity is currently an escalating epidemic that affects many countries in the world 
including the Gulf region where this condition is responsible for an increasing death rates annually. 
The objective of the study was to evaluate the prevalence of overweight and associated risk factors 
in primary female school children in Al Ain city, United Arab Emirates (UAE). Height and weight 
were measured in a sample of 900 female primary school children aged between 5-14 years. Body 
Mass Index (BMI) was calculated for each child. Children were categorized according to age and 
specific percentile of BMI using 2000 CDC BMI-age growth charts. A questionnaire addressing 
food habits, food consumption and life style (TV watching and physical activity) was completed. 
The results showed that the prevalence of the risk of overweight and overweight were 11.1% and 
15.8% respectively. Sixty percent of children consumed chips and chocolates daily while 28% and 
32.2% reported a daily consumption of vegetables and fruits respectively. Viewing TV more than 
2h/day, parents obesity, breakfast intake and physical activity were significantly associated with a 
higher risk of overweight. Results indicated that a high prevalence of overweight exists among 
primary school female children. This calls for aggressive prevention strategies which, if successful, 
may significantly reduce adult obesity. 
Key words: Overweight. Female school children, risk factors, Food consumption patterns. 
دراسة السمنة وعوامل الخطورة بين بنات المدارس الابتدائية في العين 
الإمارات العربية المتحدة 
عبد الحميد كركادي، ناصر ابو النجا، وسام إبراهيم 
قسم التغذية والصحة، كلية الأغذية والزراعة، جامعة الإمارات العربية المتحدة. ص. ب ١٧٥٥٥ ، العين، الإمارات العربية المتحدة 
ملخص: السمنة من الأعراض المرضية التي أصبحت شائعة في الدول المتقدمة والنامية على السواء بما فيها منطقة الخليج مما 
أدى إلى زيادة في نسب الوفيات سنويًا. يهدف هذا البحث إلى دراسة السمنة وعوامل الخطورة بين بنات المدارس الابتدائية في 
العين، الإمارات العربية المتحدة. فقد تم أخذ الوزن والطول لعينة تتكون من ٩٠٠ طالبة من المرحلة الابتدائية تتراوح 
١٤ سنة. تم حساب منسب كتلة الجسم (م.ك.ج) لكل طالبة، وتم تصنيف الطالبات حسب العمر و م.ك.ج - أعمارهن بين ٥ 
باستعمال لوحات النمو المعيارية الصادرة عن مركز مراقبة الأمراض. كذلك تمت تعبئة استمارة تحتوي على أسئلة خاصة 
بالعادات الغذائية والنمط الاستهلاكي والنمط المعيشي (مشاهدة التلفاز وممارسة الرياضة). وأوضحت النتائج أن نسبة انتشار 
خطورة زيادة الوزن وزيادة الوزن كانت كما يلي على التوالي ١١,١ % و ١٥,٨ %. ستون بالمئة ( ٦٠ %) من المبحوثات 
يتناولن الشكولاتة ورقاقات البطاطس يوميًا. بينما أن استهلاك الخضراوات والفواكه كان قلي ً لا جدًا لدى ٢٨ % و ٣٢,٢ % من 
الطالبات على التوالي. مشاهدة التلفاز لأكثر من ساعتين في اليوم، السمنة لدى الأولياء، تناول فطور الصباح وممارسة النشاط 
الرياضي من العوامل المرتبطة بخطورة الإصابة بزيادة الوزن. وتشير نتائج هذا البحث إلى أن نسبة انتشار زيادة الوزن 
مرتفعة بين بنات المدارس الابتدائية. وهذا يتطلب وضع إستراتجية وقائية في حالة نجاحها يمكن أن تخفف نسبيا من السمنة 
عند البالغين. 
كلمات مفتاحية: زيادة الوزن، مدارس البنات، عوامل الخطورة، النمط لاستهلاكي. 
٤٣
Abdelhamid Kerkadi et al. 
٤٤ 
Introduction 
Obesity is currently an escalating 
epidemic that affects many countries in 
the world including the Arabian Gulf 
region (Al-Awadi and Amine, 1989; Al- 
Shammari et al., 1994; El-Mugamer et 
al., 1995; Al-Mahroos and Al-Roomi, 
1999) where it is responsible for 
increasing death rates annually. This 
condition could occur during any of the 
various stages of human life (Dietz, 
1994). 
Obesity among children is a 
concern, because it may have long term 
health consequences. In high-income 
countries, extensive evidence indicates 
that obesity during childhood is related 
to adult obesity (Rolland-Cachera et al., 
1987; Serdula et al., 1993; Power et al., 
1997; Guo and Chumlea, 1999; Wang 
and Popkin, 2000). 
The causes of pediatric obesity 
have not been elucidated completely, 
although it is suspected that a complex 
interaction of genetic, environmental, 
and behavioural factors is responsible 
(Schonfeld-Warden and Waeden, 1997). 
Recent research suggests that aspects of 
diet composition, may play a role in 
overweight (Nguyen et al., 1996; 
Maffeis et al., 2000). Low physical 
activity rates are associated with obesity 
(Wolf et al., 1993; Obarzanek et al., 
1994) and television viewing has been 
shown to be a significant risk factor for 
pediatric obesity, both cross-sectionally 
and prospectively (Klesges et al., 1993; 
Gortmaker et al., 1996; Hanley et al., 
2000; Coon et al., 2001). 
The rates of overweight and 
obesity are much higher in the Arabian 
Gulf populations, including children, 
compared to developed countries (Al- 
Awadi and Amine, 1989; Al-Shammari 
et al., 1994; El-Mugamer et al., 1995; 
Al-Mahroos and Al-Roomi, 1999). This 
increase in the prevalence of obesity is 
due to life style changes (physical 
activity, leisure, and modernization) and 
nutrition transition which are in relation 
with changing economic, social, and 
health factors (Al Isa, 1999). It is well 
known that Arabian Gulf countries moved 
toward the higher fat and higher refined 
carbohydrates Western diet (Kim et al., 
2000). Major dietary changes include a 
large increase in the consumption of fat 
and added sugar in the diet, and often a 
marked increase in animal food products 
which is contrasted with a fall in total 
cereal intake, vegetable, and fruits 
consumption (Popkin, 2001). 
The objective of the study was to 
evaluate the prevalence of the risk of 
overweight, overweight, and associated 
behavioural risk factors including food 
habits, television viewing, and physical 
activity in primary female school children 
in Al Ain city, United Arab Emirates 
(UAE). 
Methods 
Subjects and sample size 
This study was conducted during the 
months of March and April, 2003 in Al- 
Ain city, UAE on local female students 
attending primary public schools (grades 
one to six). According to the 2002-2003 
statistics of the UAE Ministry of 
Education's, the total number of local 
children enrolled in Al-Ain primary public 
schools is 20,040 out of which 10,303 are 
female students. 
A list of schools was obtained from 
the Ministry of Education and eight 
primary female schools were randomly 
selected from the list using a random 
number table. After that, two classes were 
selected from each grade in each of the 
eight schools. Then, a list of students was 
obtained for each class, students were 
listed according to alphabetical order, and 
a number was assigned to every student on 
the list. This was followed by random 
selection of the desired number of students 
from each grade. Each student had the 
same probability of being selected. If the
Emir. J. Agric. Sci. 2005. 17 (1): 43-56 
http://www.cfa.uaeu.ac.ae/Research/EJAS.htm 
٤٥ 
selected student was absent, the next 
number on the list was picked. The total 
number of subjects that participated in 
this study was 900 children which is 
about 9% of the total number of female 
students (10,303) in Al-Ain primary 
schools. The age range of children was 
5-14 years. 
Data collection 
The UAE University approved the 
protocol of the study. The ministry of 
Education and the Ministry of Health 
(School Health Department) approved 
the performance of the survey in the 
selected schools. The survey was based 
on questionnaire sent home and 
collection of anthropometric data from 
participating children. 
Standard techniques were adopted 
for obtaining anthropometric 
measurements. Subjects were weighed 
in light clothes and with no shoes using a 
seca scale at nearest 0.1 kg. Height was 
measured to nearest 0.1 cm using a wall 
mounted stadiometer. 
The Body Mass Index (BMI) was 
determined from the ratio of weight to 
height square. Children were categorized 
according to age and specific percentile 
of BMI using 2000 CDC BMI-age 
growth charts (Flegal et al., 2002; Mei et 
al., 2002). Underweight is defined as 
less than or equal to the age specific 5th 
percentile. Normal weight is defined as 
between the 5th and 85th age–specific 
percentile. Students between the 85th and 
95th are categorized as at risk of being 
overweight. At the 95th percentile and 
above, children are classified as 
overweight. 
Two questionnaires have been used 
to collect data. These questionnaires 
were pilot tested on one school prior to 
undertaking the study. During pilot 
testing, questionnaires underwent several 
modifications. The modified 
questionnaires were used to collect data. 
The first questionnaire, a self 
administrated questionnaire addressed to 
parents and sent with students along with a 
cover letter explaining the purpose of the 
study. The parents of each selected child 
were asked to complete the questionnaire 
and to send it with their children to school. 
The completed questionnaires were 
collected from the school head master by 
the researchers. The questionnaire 
consisted of two sections. A general 
section concerned family data such as 
marital status of parents, father and mother 
level of education, parents occupation, 
family size, and obesity within family. 
Parents were asked to describe themselves 
as obese or normal. The second section 
consisted a food frequency questionnaire 
which was developed by the Department 
of nutrition and Health, UAE University. 
Intake of foods were categorized as 
follows: Almost daily, once a week, 2-4 
times per week, and none (less than once a 
week). Foods were divided in food groups: 
Fruits and fruit juice, vegetables, meat, 
dairy, bread and cereals. Three other food 
groups were also included: sweet and 
snacks, soft drink and beverage (tea, 
coffee). Sweet and snacks food included 
fast food, chips, cookies. Fast food 
consumption defined as foods consumed 
away from home in fast food restaurants. 
The second questionnaire administrated to 
students in the classroom by trained data 
collectors included questions related to 
behavioural factors such as the number of 
hours spent on watching television and 
video or playing video games the previous 
day. Almost all students reported watching 
television, for that, only this variable was 
used in the analysis. TV watching may 
vary from day to day. For that, TV 
watching was categorized in 0-2 h/d or 
>2h/d. Students were asked to report if 
they were participating in physical activity 
and how much money did they bring daily 
with them to school. Pocket money was 
categorized in two levels: [0-3Dh/d, >3 
Dh/d] (Dh= Dirhams; 1$= 3.678 Dh). The 
questionnaire asked about the 
consumption of snacks (defined as any
Abdelhamid Kerkadi et al. 
٤٦ 
food consumed excluding formal meals), 
while watching television, breakfast and 
number of meals intake. 
Statistic Analysis 
A database was set up using 
Microsoft Access to store the data. Then 
the data was read by SPSS (11.0) for 
windows which was used for statistical 
analysis. 
Data analysis included both 
descriptive and inferential statistics. 
Correlation coefficients were calculated 
for the continuous variables (BMI, 
weight and height) to identify possible 
associations. The mean BMI, weight and 
height were tested by an analysis of 
variance (ANOVA) to assess differences 
between age groups. The percentage of 
the study population in different BMI 
categories was calculated for the total 
sample and stratified by age group. 
Multiple logistic regression was used to 
examine factors associated with 
overweight in the study population, 
including television viewing, breakfast 
intake, daily physical activity, pocket 
money and parents obesity. The outcome 
variable for these analyses was 
overweight defined as children with 
body mass index (BMI) greater or equal 
to the age-specific 85th percentile of 
2000 CDC growth charts. All variables 
were analyzed as a 2 level categorical 
variable: Television viewing [(0–2 h/d), 
(>2h/d)]; daily physical activity [yes, 
no]; pocket money [(0-3Dh/d), 
(>3Dh/d)], breakfast intake [yes, no] and 
parents obesity [at least one of them, no]. 
Age was treated as potential 
confounding variable. Odds ratios (ORs) 
and their 95% confidence intervals (CI) 
for associated factors were estimated 
from logistic regression models by 
exponentiating the β coefficient. Food 
groups frequency of consumption was 
presented as daily frequency of 
consumption. Bivariate for testing 
between group variable differences were 
done using the independent t test. The 
independent association of predictors 
(food groups) with overweight was also 
examined using multiple logistic 
regression adjusting for age. All food 
groups were included in the model. ORs 
were considered statistically significant at 
P value < 0.05. 
Results 
Among nine hundred girls initially 
included in the study, five hundreds forty 
five filled out the questionnaire and 
returned it to schools. We were unable to 
collect the remaining questionnaires 
because some parents did not want to 
participate in the study. In addition some 
parents did not complete all questions 
related to food consumption pattern, we 
were also unable to obtain anthropometric 
measures on 5 children. The reason for 
missing anthropometric measures was lack 
of time to finish anthropometry in some 
schools on scheduled days. 93-97% of 
children gave information on TV 
watching, physical activity, breakfast 
intake, pocket money, number of meals, 
and parents obesity. The demographic and 
socio-economic characteristics of the 
subjects are shown in Table 1. The mean 
age of participants was 9.4 ± 1.8 y. 20.8% 
of children lived in small families (5 
persons or less). Fathers' education was 
higher than mothers' education. Only 12.2 
% of mothers were employed. 6.7% of 
fathers and 12.2% of mothers were obese. 
Anthropometric characteristics of the 
sample according to age are given in Table 
2. The study population was divided into 3 
age groups as follows: group 1: 5-7 years; 
group 2: 8-10 years and group 3: 11 years 
and over. Results show that weight, height, 
and BMI increased with age and 
differences were significant (P < 0.0001) 
between age groups. A statistically 
significant (P < 0.001) positive correlation 
between age and anthropometric 
measurements was observed (Pearson 
Correlation was 0.586, 0.740 and 0.389 for 
weight, height, and BMI, respectively).
Emir. J. Agric. Sci. 2005. 17 (1): 43-56 
http://www.cfa.uaeu.ac.ae/Research/EJAS.htm 
Table 1. Demographic and socio economic characteristics of the sample 
Category Number % 
a Number of individuals living in the same house 
b1= none or elementary school; 2= High school; 3 = College and University 
c House maid : a person who help in cleaning, preparing meals and taking care of children 
Table 2. Anthropometric characteristics of the sample according to age a 
Age groups N b Weight (Kg) Height (cm) BMI c(Kg/m2) 
5-7 184 23.4 ± 0.4* 122.4 ± 0.5* 15.5 ± 0.2* 
8-10 445 32.1± 0.5 * 133.3 ± 0.4* 17.7 ± 0.5* 
≥11 266 44.1 ± 0.8* 146.2 ± 0.5* 20.4 ± 0.3* 
Total 895 33.8 ± 0.4 134.9 ± 0.4 18.1 ± 0.1 
a Values are Mean ± Standard Error (SE) 
b N: Number of individuals 
c BMI: Body Mass Index 
* Significantly different between age groups at P< 0.0001 
٤٧ 
The prevalence of underweight, 
normal weight, risk of overweight and 
overweight according to age is shown in 
Graph 1. Results show that 11.1% were 
at risk of overweight, 15.8% were 
overweight, 61.6 % had a normal weight 
and 11.6% were underweight. The 
prevalence of risk overweight increased 
with age and reached its highest rate 
(12.5%) at age 11 years and over. The 
same trend was noted for overweight 
where the highest rate (21.2%) was 
observed in the oldest group (11 years 
and over). A significantly association 
was found between BMI and age groups 
(χ2 = 23.89, P < 0.001). 
Age (years) 
5 -7 
184 
20.4 
8-10 
≥11 
Total 
Family size (persons) a 
5 or less 
6-10 
≥11 
Total 
Mother education b 
1 
2 
3 
Total 
Father education b 
1 
2 
3 
Total 
Mothers employed 
Fathers employed 
Parents obesity 
Fathers 
Mothers 
Presence of house maid c 
450 
266 
900 
114 
298 
135 
547 
243 
206 
76 
525 
165 
251 
97 
513 
64 
419 
60 
110 
433 
50.0 
29.6 
20.8 
54.5 
24.7 
46.3 
39.2 
14.5 
32.2 
48.9 
18.9 
12.2 
81.5 
06.7 
12.2 
82.5
Abdelhamid Kerkadi et al. 
Underweight Normal weight At Risk of 
overweight 
٤٨ 
Overweight 
BMIgroups 
70 
60 
50 
40 
30 
20 
10 
0 
Percent 
age 
5 to 7 
8 to 10 
11 and more 
Graph 1. Prevalence of underweight, normal weight, risk of overweight and 
overweight according to agea 
a Children were classified according to 2000 CDC BMI-age growth charts 
* Significant difference according to age groups , χ2 = 23.89 , P< 0.001 
Only five hundreds nineteen filled 
out the questionnaire related to food 
consumption frequency. It is noted that 
we did not find significant difference of 
anthropometric measurements (weight, 
height and BMI) between children who 
returned the questionnaire and children 
who did not return it. For that, the 
results of analysis of questionnaires can 
be considered as representative of the 
population. The analysis of the food 
consumption frequencies indicated that the 
consumption of fruits, leafy vegetables, 
and other vegetables was least frequent 
(32.2 %, 28% and 45.5% respectively). In 
addition, 38.8% and 18.8% of the subjects 
reported a daily consumption of chicken 
and meat respectively, while the daily
Emir. J. Agric. Sci. 2005. 17 (1): 43-56 
http://www.cfa.uaeu.ac.ae/Research/EJAS.htm 
٤٩ 
consumption of fish was 13.2% (results 
not shown). The consumption of milk 
products was more frequent than full fat 
milk consumption (64% versus 34.6%). 
among cereals group, rice is the most 
frequently consumed food (71.6%) 
followed by white bread (58.4%) while 
65.7% did not consume whole wheat 
bread (results not shown). We noted that 
60.2% and 25.9% of children reported a 
daily consumed of chips and soft drink 
respectively, and 75% consumed fast 
food at least once a week. In addition, 
37.3% of subjects reported a daily 
consumption of tea. 51.9% of children 
reported that they never snack while 
watching television (results not shown). 
Table 3 shows comparison of food 
groups daily frequency of consumption 
between overweight and normal weight 
female primary school children. We 
noted that the daily frequency of 
consumption for all food groups did not 
differ between the two groups 
(overweight vs normal). Multiple logistic 
regression analysis was used to evaluate 
the association between daily frequency 
of food groups consumption (fruit, fruit 
juice, vegetables, bread and cereals, 
dairy, meat, sweets and snacks, soft 
drink and beverage) and overweight. All 
variables were included in the model 
after adjusting for age. Results shown 
that only the variable vegetables was 
marginally associated with overweight 
(OR= 1.20; 95% CI = 0.995 and 1.250; P 
= 0.056). 
Multiple logistic regression 
analyses indicated that breakfast intake, 
viewing TV more than 2hours/day, 
parent obesity, daily physical activity 
were positively associated with child 
overweight (Table 4). Girls who did not 
take breakfast were more likely to be 
overweight. There was a significant 
association between breakfast intake and 
overweight. Overall, 9.1% of girls 
reported watching 2 or more hours of 
television per day, 45.6% of them were 
overweight (results not shown). The 
prevalence of watching more than 2 hours 
of television per day increased with age 
and the maximum occurred in the oldest 
group (11 years and more) (results not 
shown). Compared with children who 
watched less than 2 h/d of TV, children 
who watched more than 2 h/d had 2.88 
greater OR (odds ratio) of being 
overweight. We noted a statistically 
significant association between watching 2 
hours and more of television per day and 
overweight. 10.4% of girls did not practice 
sport, 40.2% of them were overweight and 
we noted that girls who did not practice 
sport were more likely to be overweight 
and the association between sport and 
overweight was statistically significant. 
27.1% of children reported that they bring 
3 and more Dh as pocket money per day 
and the totality was used to buy chips, 
candies and sandwich from the school's 
canteen. The prevalence of overweight 
children increased as the amount of pocket 
money increased (results not shown). We 
noted that students who bring 3 Dh and 
more had 1.63 OR greater of being 
overweight and the association was not 
statistically significant at P < 0.05. We did 
not find a significant association between 
pocket money and overweight because 
pocket money was correlated with age (r = 
0.21, P = 0.0001) and we adjusted for age 
in the multiple logistic regression model. 
Almost 26% of students have at least one 
of their parents obese and there was a 
significant association (P = 0.023) 
between parents obesity and child 
overweight.
Abdelhamid Kerkadi et al. 
Table 3. Comparison of daily frequency of food consumption1 between overweight 
and normal female school children in Al-Ain city2 
Overweight3 Normal P-value4 
N 146 372 
Food groups5 
٥٠ 
Daily frequency 
Bread and cereals 3.01 ± 0.05 3.01 ± 0.04 0.92 
Vegetables 3.17 ± 0.10 3.00 ± 0.06 0.12 
Fruit 3.17 ± 0.08 3.16 ± 0.05 0.94 
Fruit juices 3.12 ± 0.11 3.15 ± 0.07 0.85 
Meat 2.69 ± 0.05 2.72 ± 0.03 0.64 
Dairy 2.90 ± 0.08 2.92 ± 0.05 0.79 
Sweets and snacks 2.95 ± 0.07 2.96 ± 0.04 0.96 
Soft drinks 2.47 ± 0.10 2.50 ± 0.06 0.75 
Beverage 3.02 ± 0.13 2.97 ± 0.08 0.72 
*Values are means ± SE 
1All age groups were included 
2Overweight children are those with body mass index (BMI) greater or equal to the age-specific 85th 
percentile of 2000 CDC growth charts 
3Student t test 
4Food groups: Breads and cereals: White bread, whole wheat bread, rice, pasta, breakfast cereals; 
Vegetables: leafy vegetables and other vegetables; fruit: apple, mango, peach, grapes, orange, banana; 
Fruit juices: fresh squeezed juices; Meat: beef, lamb, Chicken, fish and meat products; Dairy: milk (low 
fat and full fat), cheese, yogurt; Sweets and snacks: chocolate, chips, candy, cookies, popcorn; soft drinks: 
soft drinks, soda; Beverage: tea, coffee 
Table 4. Factors associated with overweight1 in female school children* in Al Ain 
city. Multiple logistic regression2 
95% CI4 
OR3 _____________________ P-value 
Lower Upper 
Breakfast Intake5 1.82 1.31 2.53 0.0001 
TV viewing, h/d6 1.74 1.05 2.88 0.031 
Parents obesity7 0.67 0.45 0.95 0.023 
Physical activity8 1.58 0.94 2.57 0.06 
Pocket money9, Dh/d 1.15 0.81 1.63 0.45 
* All age groups were included 
1Overweight children are those with body mass index (BMI) greater or equal to the age-specific 85th 
percentile of 2000 CDC growth charts 
2Multiple logistic regression analysis was performed on group membership (overweight vs normal) as 
outcome and all five factors were included in the model after adjusting for age 
3OR= odds ratio 
495% CI=95% Confidence Interval 
5Daily intake of breakfast (yes, no) 
6TV viewing (0-2h/d or lees, > 2h/d) 
7Parents obesity: At least one of parents is obese (yes, no) 
8Daily physical activity (yes, no) 
9Pocket money: the amount of Dh (Dirham Emirate) that each student brings daily and buy foods from the 
school canteen, 1$= 3.678 Dh (0-3 Dh/d, >3 Dh/d)
Emir. J. Agric. Sci. 2005. 17 (1): 43-56 
http://www.cfa.uaeu.ac.ae/Research/EJAS.htm 
٥١ 
Discussion 
Overweight and obesity are 
considered as an 'epidemic' in many 
countries in the World, including 
developed and developing countries. 
Prevalence of obesity and overweight 
varies greatly with age groups, gender 
and socioeconomic status. It has been 
shown that the epidemiological 
transition seen in the developing 
countries as a result of urbanization, 
migration, new eating habits, and recent 
affluence are considered as some of the 
factors involved in the development of 
obesity and overweight. In the present 
study, the prevalence of the risk of 
overweight and overweight was found to 
be 11.1% and 15.8%, respectively 
among female primary school children. 
The prevalence of overweight reported 
in our study seemed to be higher than 
that reported by Al Haddad et al. (2000) 
and Badrinath et al. (2000) in the UAE 
and in Al Ain respectively. In the first 
study, Al Haddad et al. (2000) reported a 
prevalence of 8 % of obesity among 
UAE school children (boys and girls). 
Badrinath et al. (2000) found that 10.4% 
of children (boys and girls) aged 
between 2 and 15 years were classified 
as obese. Other recent studies in the 
Arabian Gulf countries reported a high 
prevalence of overweight and obesity. In 
Saudi Arabia, El Hazmi and Warsy 
(2002) noted that the overall prevalence 
of overweight and obesity among girls 
aged between 1-18 years was 12.7% and 
6.7%, respectively. They noted a high 
variability in the prevalence between 
provinces and age groups. Eastern 
province and the age group (6-9 years) 
had the highest prevalence of overweight 
and obesity. 
Paediatric overweight is caused by 
a complex interplay of both genetic and 
environmental factors. The extent to 
which these factors contribute to 
overweight within a population has not 
been established and it is likely that the 
identity and relative contribution of risk 
factors differ among individuals. 
Socioeconomic status (SES) is a useful 
indicator of a constellation of 
environmental and familial influences 
potentially related to overweight. There is 
a controversial relationship between social 
factors and overweight in the literature. 
Whereas among adults an inverse 
relationship between SES and overweight 
is found frequently, studies of children 
find a weaker and less consistent 
relationship (Melnik et al., 1998). A 
number of studies have shown an inverse 
relationship between the level of parental 
education and overweight in children 
(Garn et al., 1975; Kemper et al., 1999). 
We have used parental education and 
occupation as a measure of SES. Our 
results suggest that there is no relationship 
between SES and prevalence of obesity 
among female school children in Al Ain. 
In contrast to this finding recent studies 
suggest that low SES may be a risk factor 
for obesity among children as young as 
preschool age (Gerald et al., 1994; 
Sherman et al., 1995; Spiegelaere et al., 
1998). The discrepancy between our study 
and other studies may be due to the fact 
that Al Ain city is a part of the rich oil 
producing country, where nationals enjoy 
a high per capita yearly income 
irrespective of education and occupation, 
as a result, SES groups are not distinctly 
defined. 
Dietary habits are among the factors 
that are associated with overweight and 
obesity among both children and adults. 
In this study, we considered few dietary 
factors (breakfast intake, number of meals, 
and food consumption patterns) and these 
mostly concentrated on qualitative rather 
than quantitative indicators. We found that 
the prevalence of girls who skipped 
breakfast increased with age, and girls 
who took breakfast had less prevalence of 
obesity compared to those who skipped 
breakfast, and the difference was 
statistically significant. Links between 
eating pattern and overweight have also
Abdelhamid Kerkadi et al. 
٥٢ 
been reported. Reported associations of 
food groups with childhood overweight 
include: low intake of fruit and 
vegetables (Moore et al., 1995), high 
intake of fast foods and sweets (Muller 
et al., 1999; Robinson, 1999), and high 
intake of sugar-sweetened beverages 
such as soft drinks (Ludwig et al., 2001). 
It is estimated that only 30% of US 
children meet the goals set by the food 
guide pyramid for daily intake of grains, 
meats, fruits and vegetables. The same 
pattern was observed in our study. We 
found that 26% and 60% of children 
daily consumed soft drinks and chips 
respectively, while the consumption of 
fruits and vegetables (leafy vegetables) 
was 32% and 28% respectively. We did 
not find a significant association 
between daily consumption of different 
foods and overweight. We noted low 
prevalence of daily consumption of milk 
whether it is full or low fat milk. Several 
studies suggest that consumption of 
excessive soft drink or other sweetened 
beverages is related to pediatric 
overweight (Troiano et al., 2000; 
Ludwig et al., 2001; Matheson et al., 
2004). It has been shown that for each 
additional serving of a sugar-sweetened 
beverage consumed daily over a 1 1/2 
year period among school-aged children, 
the risk of becoming overweight 
increased 60% after controlling for other 
confounding variables (Ludwig et al., 
2001). 
The multiple logistic regression 
analysis showed that breakfast intake, 
TV viewing, physical activity and 
parents obesity were significant 
associated factors with overweight after 
adjusting for age. Parents obesity is one 
of the most important risk factor for 
childhood obesity (Serdula et al., 1993; 
Lake et al., 1997; Whitaker et al., 1997; 
Guo and Chumlea, 1999). Whitaker et al. 
(1997) found that among young children 
(under 3 years of age) the strongest 
predictor of adulthood obesity was 
parental obesity status. The risk of 
becoming an obese adult increased 3-fold 
if one parent was obese and 13-fold if both 
parents were obese. In addition to 
confirming this relationship, Lake et al. 
(1997) also reported a stronger pattern of 
overweight tracking from childhood to 
adulthood among subjects with two obese 
parents. In agreement with these studies, 
the present study showed that overweight 
was significantly associated with parents' 
obesity. Using logistic regression analysis, 
Moussa et al. (1994) reported an 
association between obesity and family 
history of obesity among school children 
in Al Ain. Among environmental factors, 
physical activity, TV and media and 
dietary factors are the most important risk 
factors for overweight and obesity. Several 
studies suggest that sedentary behavior is 
common in a relevant portion of children 
today and it has been identified as a 
significant predictor of weight gain later in 
life. Low levels of physical activity have 
been related to increased childhood 
overweight (Moore et al., 1995; Takahashi 
et al., 1999; Garaulet et al., 2000; Crespo 
et al., 2001). In the longitudinal 
Framingham Children's Study, preschool 
children with low levels of physical 
activity gained substantially more 
subcutaneous fat than did more active 
children (Takahashi et al., 1999). Our 
results show that inactive girls were more 
likely to be obese compared to active girls. 
It is noted that in many schools, physical 
activity was cancelled from the 
curriculum. Low physical activity levels 
have been associated directly with TV 
viewing and inversely with time spent 
outdoors (Gortmaker et al., 1996). 
Television viewing has become a common 
activity among children in many countries 
and more than ninety percent of children 
live in a home with at least one TV set. 
We found that more than 90% of children 
spent at least 2h/d watching TV. Time 
spent viewing TV has consistently been 
shown to be associated with overweight 
status (Gortmaker et al., 1996; Takahashi 
et al., 1999; Hanley et al., 2000).
Emir. J. Agric. Sci. 2005. 17 (1): 43-56 
http://www.cfa.uaeu.ac.ae/Research/EJAS.htm 
٥٣ 
Gortmaker et al. (1996) reported that 
children who watched TV for more than 
5 h/d have a nearly 5-fold increased risk 
of overweight compared with those who 
watched 0-2h. Our results showed a 
higher risk for overweight among 
children who watched TV for more than 
2h/d. Researchers have suggested two 
mechanisms by which television viewing 
contributes to overweight. These 
mechanisms are reduced energy 
expenditure from reduction in physical 
activity and /or increased dietary intake, 
either during viewing or as a result of 
food advertising (Maffeis et al., 1997; 
Crespo et al., 2001). We also found that 
48.1 % of children ate while watching 
TV, the most consumed products during 
watching TV were candies, chips, and 
chocolates which are rich source of 
energy. 
In conclusion, the present study 
documented a high prevalence of risk of 
overweight and overweight among 
female school children in Al-Ain. 
Studying overweight in childhood is 
important since identification of children 
who may become obese adults can 
facilitate early intervention and 
avoidance of the morbidity and mortality 
associated with adult obesity. For that, a 
multisectorial intervention should be 
established which considers the dietary 
intervention to modify food habits, 
education through mass media and 
encouraging habitual physical activity 
among primary school children in Al 
Ain city. 
Acknowledgement 
This research was supported by the 
Research Affairs of the UAE University 
under contract Nº 01-04-6-11/03. 
Authors would like to thank the UAE 
Ministry of Health and the UAE 
Ministry of Education for facilitating 
access to schools. Grateful 
acknowledgement is also due for senior 
and graduate students who participated in 
data collection and data entry. 
References 
Al-Awadi, F. and E. K. Amine. 1989. 
Overweight and obesity in Kuwait. J. 
R. Soc. Health. 109:175-179. 
Al Haddad, F., Y. Al-Nuaimi, B. B. Little 
and M. Thabit. 2000. Prevalence of 
obesity among school children in the 
United Arab Emirates. Amer. J. 
Human. Biol. 12:498-502. 
Al Isa, A. N. 1999. Dietary and socio 
economic factors associated with 
obesity among Kuwaiti college men. 
Br. J. Nutr. 82:369-374. 
Al- Mahroos, F. J. and K. A. Al-Roomi. 
1999. Overweight and obesity in the 
Arabian Peninsula: an overview. J. R. 
Soc. Health. 119:251-253. 
Al-Shammari, S. A., T. A. Khoja and M. 
Al-Maatouq. 1994. High prevalence of 
clinical obesity among Saudi females: a 
prospective cross-sectional study in the 
Riyadh region. J. Trop. Med. Hyg. 
97:183-188. 
Badrinath, P., Q. A. Al-Shboul, T. 
Zoubeidi, A. S. Gargoun, R. Gubash 
and O. E. El-Rufaie. 2000. Measuring 
the Health of the nation. United Arab 
Emirates Health and Life style Survey. 
Coon, K. A., J. Goldberg, B. L. Rogers 
and K. L. Tucker. 2001. Relationships 
between use of television during meals 
and children’s food consumption 
patterns. Pediatrics 107:167-176. 
Crespo, C. J., E. Smit, R. P. Troiano, S. J. 
Bartlett, C. A. Macera and R. E. 
Anderson. 2001. Television watching, 
energy intake, and obesity in US 
children: results from the Third 
National Health and Nutrition
Abdelhamid Kerkadi et al. 
٥٤ 
Examination Survey. Arch. Pediatr. 
Adolesc. Med. 155:360-365. 
Dietz, W. H. 1994. Critical periods in 
childhood for the development of 
obesity. Amer. J. Clin. Nutr. 59:955- 
959. 
El- Hazmi, M. A. F. and A. S. Warsy. 
2002. A comparative study of 
prevalence of overweight and obesity 
in children in different provinces of 
Saudi Arabia. J. Trop. Pediatrics. 
48:172-177. 
El- Mugamer, I. T., A. S. Ali Zayat, M., 
M. Hossain and B. N. Pugh. 1995. 
Diabetes, obesity and hypertension in 
urban and rural people of Bedouin 
origin in the United Arab Emirates. J. 
Trop. Med. Hyg. 98:407-415. 
Flegal, K. M., R. Wei and C. Ogden. 
2002. Weight for stature compared 
with body mass index for age growth 
charts for the United States from the 
Centers for Diseases Control and 
Prevention. Amer. J. Clin. Nutr. 
75:761-766. 
Garaulet, M., A. Martinez., F. Victoria., 
F. Perez-Liamas., R. M. Ortega and 
S. Zamora. 2000. Differences in 
dietary intake and activity level 
between normal-weight and 
overweight or obese adolescents. J. 
Pediatr. Gastroenterol. Nut. 30:253- 
258. 
Garn, S. M., S. M. Bailey, P. E. Cole and 
I. T. T. Higgins. 1975. Level of 
education, level of income, and level 
of fatness in adults. Amer. J. Clin. 
Nutr. 30:721-727. 
Gerald, L. B., A. Anderson, G. D. 
Johnson, C. Hoff and R. F. Trimm. 
1994. Social class, social support and 
obesity risk in children. Child. Care. 
Health. Dev. 20:145-163. 
Gortmaker, S. L., A. Must, A. M. Sobol, 
K. Peterson., G. A. Colditz and W. H. 
Dietz. 1996. Television viewing as a 
cause of increasing obesity among 
children in the United States, 1986- 
1990. Arch. Pediatr. Adolesc. Med. 
150:356-362. 
Guo, S. S. and W. C. Chumlea. 1999. 
Tracking of body mass index in 
children in relation to overweight in 
adulthood. Amer. J. Clin. Nutr. 
70:145S-148S. 
Hanley, A. J. G, S. B. Harris, J. Gittelsohn, 
T. M. Wolever, B. Saksvig and B. 
Zinman. 2000. Overweight among 
children and adolescents in Native 
Canadian community: prevalence and 
associated factors. Amer. J. Clin. Nutr. 
71:693-700. 
Kemper, H. C. G., G. B. Post, J. W. R. 
Twisk and W. van Mechelen. 1999. 
Lifestyle and obesity in adolescence 
and young adulthood: results from the 
Amsterdam Growth and Health 
Longitudinal study (AGAHLS). Int. J. 
Obes. Relat. Metab. Disord. 23:S34- 
S40. 
Kim, S., S. Moon and B. M. Popkin. 
2000. The nutrition transition in South 
Korea. Amer. J. Clin. Nutr. 71:44-53. 
Klesges, R. C., M. L. Shelton and L. M. 
Klesges. 1993. Effects of television 
viewing on metabolic rate: potential 
implications for childhood obesity. 
Pediatrics 91:281-286. 
Lake, J. K., C. Power and T. Cole. 1997. 
Child to adult body mass index in the 
1958 British birth cohort: association 
with parental obesity. Arch. Dis. Child. 
77:376-381. 
Ludwig, D. S., K. E. Peterson and S. L. 
Gortmaker. 2001. Relation between 
consumption of sugar –sweetened
Emir. J. Agric. Sci. 2005. 17 (1): 43-56 
http://www.cfa.uaeu.ac.ae/Research/EJAS.htm 
٥٥ 
drinks and childhood obesity. Lancet. 
357:505-508. 
Maffeis, C., S. Provera., S. Filippi., G. 
Sidoti., S. Schena and L. Tato. 2000. 
Distribution of food intake as a risk 
factor for childhood obesity. Int. J. 
Obes. Relat. Metab. Disord. 24:75-80. 
Maffeis, C., M. Zaffanello and Y. 
Schutz. 1997. Relationship between 
physical inactivity and adiposity in 
prepubertal boys. J. Pediatr. 131:288- 
292. 
Matheson, D. M., J. D. Killen, Y. Wang, 
A. Varady and T. N. Robinson. 2004. 
Children’s food consumption during 
television viewing. Amer. J Clin 
Nutr. 79:1088 –1094. 
Mei, Z., L. M. Grummer-Strawn, A. 
Pietrobelli, A. Goulding, M. I. Goran 
and W. H. Dietz. 2002. Validity of 
body mass index compared with other 
body composition screening indexes 
for the assessment of body fatness in 
children and adolescents. Amer. J. 
Clin. Nutr. 75:978-985. 
Melnik, T. A., A. C. Rhoades., K. R. 
Wales., C. Cowell. and W. S. Wolfe. 
1998. Overweight school children in 
New York City: prevalence estimates 
and characteristics. Int. J. Obesity. 
22:7-13. 
Moore, L. L., U. S. D. T. Nguyen., K. J. 
Rothman., L. A. Cupples and R. C. 
Ellisun. 1995. Preschool physical 
activity level and change in body 
fatness in young children. Amer. J. 
Epidemiol. 142:982-988. 
Moussa, M. A. A., M. B. Skaik, S. B. 
Selwanes, O. Y. Yaghy and S. A. 
Bin-Othman. 1994. Factors associated 
with obesity in school children. Int. J. 
Obesity. 18:513-515. 
Muller, M. J., I. Koertringer, M. Mast, K. 
Languix and A. Frunch. 1999. Physical 
activity and diet in 5 to 7 year old 
children. Public. Health. Nutr. 2:443- 
444. 
Nguyen, V. T., D. E. Larson, R. K. 
Johnson and M. I. Goran. 1996. Fat 
intake and adiposity in children of lean 
and obese parents. Amer. J. Clin. Nutr. 
63:507-513. 
Obarzanek, E., G. Schreiber G., P. 
Crawford, S. Goldman, P. Barrier and 
M. Frederick. 1994. Energy intake and 
physical activity in relation to indexes 
of body fat: the National Heart, Lung, 
and Blood Institute Growth and Health 
Study. Amer. J. Clin. Nutr. 60:15-22. 
Popkin, B. M. 2001. The nutrition 
transition and obesity in the developing 
world. J. Nutr. 131:871S-873S. 
Power, C., J. K. Lake and T. J. Cole. 1997. 
Measurement and long term health 
risks of child and adolescent fatness. 
Int. J. Obes. Relat. Metab. Disord. 
21:507-526. 
Robinson, T. N. 1999. Reducing children's 
television viewing to prevent obesity: a 
randomized controlled trial. JAMERA. 
282:1561-1567. 
Rolland-Cachera, M. F., M. Deheeger and 
M. Guilloud-Bataille. 1987. Tracking 
the development of adiposity from one 
month of age to adulthood. Ann. For 
Annals Human. Biol. 14: 219-229. 
Schonfeld-Warden, N. and C. H. Waeden. 
1997. Pediatric obesity: an overview of 
etiology and treatment. Pediatr. Clin. 
North. Amer. 44:339-361. 
Serdula, M. K., D. Ivery, R. J. Coates, D. 
S. Freedman, D. F. Williamson and T. 
Byers. 1993. Do obese children become 
obese adults?. Prev. Med. 22:167-177.
Abdelhamid Kerkadi et al. 
٥٦ 
Sherman, G. B., Y. Liao, M. Alexander, 
M. Kim and B. D. Kim. 1995. Family 
factors related to obesity in Mexican 
–American and Anglo preschool 
children. Family. Comm. Health. 
22:29-36. 
Spiegelaere, M. D., M. Dramaix and P. 
Hennart. 1998. Socioeconomic status 
and changes in body mass from 3 to 5 
years. Arch. Dis. Child. 78:477-478. 
Takahashi, E., K. Yoshido H. and H. 
Sugimori. 1999. Influence factors on 
the development of obesity in 3-year-old 
children based on the Toyama 
study. Prev. Med. 28:293-296. 
Troiano, R. P., R. R. Briefel, M. D. 
Carroll and K. Bialostosky. 2000. 
Energy and fat intakes of children and 
adolescents in the United States: data 
from the National Health and 
Nutrition Examination Survey. Amer. J. 
Clin. Nutr. 72:1343S-1353S. 
Wang, Y., K. Ge and B. M. Popkin. 2000. 
Tracking of body mass index from 
childhood to adolescence: a 6-y follow-up 
study in China. Amer. J. Clin. Nutr. 
72:1018-1024. 
Whitaker, R. C., J. A. Wright, M. S. Pepe., 
K. D. Seidel and W. H. Dietz. 1997. 
Predicting obesity in young adulthood 
from childhood and parental obesity. N. 
Eng. J. Med. 337:869-873. 
Wolf, A. M., S. L. Gortmaker, L. Cheung, 
H. M. Gray, D. B. Herzog and G. A. 
Colditz. 1993. Activity, inactivity and 
obesity: racial, ethnic and age 
differences among schoolgirls. Amer. 
J. Public. Health. 83:1625-1627.

More Related Content

What's hot

An assessment of adolescent eating habits in public schools of chak shahzad, ...
An assessment of adolescent eating habits in public schools of chak shahzad, ...An assessment of adolescent eating habits in public schools of chak shahzad, ...
An assessment of adolescent eating habits in public schools of chak shahzad, ...Zubia Qureshi
 
Nutritional status of Girls through Anthropometric and Dietary Assessment
Nutritional status of Girls through Anthropometric and Dietary AssessmentNutritional status of Girls through Anthropometric and Dietary Assessment
Nutritional status of Girls through Anthropometric and Dietary Assessmentiosrjce
 
Eating habits and nutritional status among adolescent school girls: an experi...
Eating habits and nutritional status among adolescent school girls: an experi...Eating habits and nutritional status among adolescent school girls: an experi...
Eating habits and nutritional status among adolescent school girls: an experi...iosrjce
 
National Nutritional Survey 2011
National Nutritional Survey 2011National Nutritional Survey 2011
National Nutritional Survey 2011DrSindhuAlmas
 
Mohieldin et al. - Unknown - The impact of feeding practices on prevalence of...
Mohieldin et al. - Unknown - The impact of feeding practices on prevalence of...Mohieldin et al. - Unknown - The impact of feeding practices on prevalence of...
Mohieldin et al. - Unknown - The impact of feeding practices on prevalence of...Moawia Alshiek
 
Low birth beight and associated maternal factors in ghana
Low birth beight and associated maternal factors in ghanaLow birth beight and associated maternal factors in ghana
Low birth beight and associated maternal factors in ghanaAlexander Decker
 
Childhood obesity treatment literature review
Childhood obesity treatment literature reviewChildhood obesity treatment literature review
Childhood obesity treatment literature reviewAmber Breidel
 
2005 06-13 overweight-childrenadolescents
2005 06-13 overweight-childrenadolescents2005 06-13 overweight-childrenadolescents
2005 06-13 overweight-childrenadolescentsPediatriasur
 
Number of meals consumed by the pre school age going children
Number of meals consumed by the pre school age going childrenNumber of meals consumed by the pre school age going children
Number of meals consumed by the pre school age going childrenAlexander Decker
 
MHNE 650 Thesis - Nutrition & Garden Education
MHNE 650 Thesis - Nutrition & Garden EducationMHNE 650 Thesis - Nutrition & Garden Education
MHNE 650 Thesis - Nutrition & Garden EducationJill Parsh
 
Nutritional status of boarding and non boarding children in selected schools ...
Nutritional status of boarding and non boarding children in selected schools ...Nutritional status of boarding and non boarding children in selected schools ...
Nutritional status of boarding and non boarding children in selected schools ...Alexander Decker
 
Nutrition for Children
Nutrition for ChildrenNutrition for Children
Nutrition for ChildrenKorina Calbay
 
Overweight obesity-and-abdominal-obesity-in-primary-school-children-in-pavia-...
Overweight obesity-and-abdominal-obesity-in-primary-school-children-in-pavia-...Overweight obesity-and-abdominal-obesity-in-primary-school-children-in-pavia-...
Overweight obesity-and-abdominal-obesity-in-primary-school-children-in-pavia-...Annex Publishers
 
ACSM Annual Meeting 2015_Higgins
ACSM Annual Meeting 2015_HigginsACSM Annual Meeting 2015_Higgins
ACSM Annual Meeting 2015_HigginsBrianna Higgins
 
Malnutrition project proposal ( Increasing knowlege about importance of a bal...
Malnutrition project proposal ( Increasing knowlege about importance of a bal...Malnutrition project proposal ( Increasing knowlege about importance of a bal...
Malnutrition project proposal ( Increasing knowlege about importance of a bal...Oriba Dan Langoya
 

What's hot (20)

An assessment of adolescent eating habits in public schools of chak shahzad, ...
An assessment of adolescent eating habits in public schools of chak shahzad, ...An assessment of adolescent eating habits in public schools of chak shahzad, ...
An assessment of adolescent eating habits in public schools of chak shahzad, ...
 
Malabsorption
MalabsorptionMalabsorption
Malabsorption
 
Nutritional status of Girls through Anthropometric and Dietary Assessment
Nutritional status of Girls through Anthropometric and Dietary AssessmentNutritional status of Girls through Anthropometric and Dietary Assessment
Nutritional status of Girls through Anthropometric and Dietary Assessment
 
Eating habits and nutritional status among adolescent school girls: an experi...
Eating habits and nutritional status among adolescent school girls: an experi...Eating habits and nutritional status among adolescent school girls: an experi...
Eating habits and nutritional status among adolescent school girls: an experi...
 
National Nutritional Survey 2011
National Nutritional Survey 2011National Nutritional Survey 2011
National Nutritional Survey 2011
 
MALNUTRITION AMONG PRIMARY SCHOOL CHILDREN IN HYDERABAD, ANDHRA PRADESH, INDIA
MALNUTRITION AMONG PRIMARY SCHOOL CHILDREN IN HYDERABAD, ANDHRA PRADESH, INDIAMALNUTRITION AMONG PRIMARY SCHOOL CHILDREN IN HYDERABAD, ANDHRA PRADESH, INDIA
MALNUTRITION AMONG PRIMARY SCHOOL CHILDREN IN HYDERABAD, ANDHRA PRADESH, INDIA
 
program rationale
program rationaleprogram rationale
program rationale
 
Original article
Original articleOriginal article
Original article
 
Mohieldin et al. - Unknown - The impact of feeding practices on prevalence of...
Mohieldin et al. - Unknown - The impact of feeding practices on prevalence of...Mohieldin et al. - Unknown - The impact of feeding practices on prevalence of...
Mohieldin et al. - Unknown - The impact of feeding practices on prevalence of...
 
Low birth beight and associated maternal factors in ghana
Low birth beight and associated maternal factors in ghanaLow birth beight and associated maternal factors in ghana
Low birth beight and associated maternal factors in ghana
 
Childhood obesity treatment literature review
Childhood obesity treatment literature reviewChildhood obesity treatment literature review
Childhood obesity treatment literature review
 
Mal3
Mal3Mal3
Mal3
 
2005 06-13 overweight-childrenadolescents
2005 06-13 overweight-childrenadolescents2005 06-13 overweight-childrenadolescents
2005 06-13 overweight-childrenadolescents
 
Number of meals consumed by the pre school age going children
Number of meals consumed by the pre school age going childrenNumber of meals consumed by the pre school age going children
Number of meals consumed by the pre school age going children
 
MHNE 650 Thesis - Nutrition & Garden Education
MHNE 650 Thesis - Nutrition & Garden EducationMHNE 650 Thesis - Nutrition & Garden Education
MHNE 650 Thesis - Nutrition & Garden Education
 
Nutritional status of boarding and non boarding children in selected schools ...
Nutritional status of boarding and non boarding children in selected schools ...Nutritional status of boarding and non boarding children in selected schools ...
Nutritional status of boarding and non boarding children in selected schools ...
 
Nutrition for Children
Nutrition for ChildrenNutrition for Children
Nutrition for Children
 
Overweight obesity-and-abdominal-obesity-in-primary-school-children-in-pavia-...
Overweight obesity-and-abdominal-obesity-in-primary-school-children-in-pavia-...Overweight obesity-and-abdominal-obesity-in-primary-school-children-in-pavia-...
Overweight obesity-and-abdominal-obesity-in-primary-school-children-in-pavia-...
 
ACSM Annual Meeting 2015_Higgins
ACSM Annual Meeting 2015_HigginsACSM Annual Meeting 2015_Higgins
ACSM Annual Meeting 2015_Higgins
 
Malnutrition project proposal ( Increasing knowlege about importance of a bal...
Malnutrition project proposal ( Increasing knowlege about importance of a bal...Malnutrition project proposal ( Increasing knowlege about importance of a bal...
Malnutrition project proposal ( Increasing knowlege about importance of a bal...
 

Viewers also liked

orientation intro
orientation introorientation intro
orientation intromiperez466
 
orientation intro
orientation introorientation intro
orientation intromiperez466
 
Predstavenie Spolocnosti RadioLAN
Predstavenie Spolocnosti RadioLANPredstavenie Spolocnosti RadioLAN
Predstavenie Spolocnosti RadioLANandrejtakac
 
Presentation2012 complete
Presentation2012 completePresentation2012 complete
Presentation2012 completemiperez466
 
Star chart ppt 2
Star chart ppt 2Star chart ppt 2
Star chart ppt 2cmburt
 
orientation intro
orientation introorientation intro
orientation intromiperez466
 
Presentation2012 complete(2)
Presentation2012 complete(2)Presentation2012 complete(2)
Presentation2012 complete(2)miperez466
 
Jennings Library
Jennings LibraryJennings Library
Jennings Librarymiperez466
 
Incentive compensation plan diagnosis in the pharmaceutical industry
Incentive compensation plan diagnosis in the pharmaceutical industryIncentive compensation plan diagnosis in the pharmaceutical industry
Incentive compensation plan diagnosis in the pharmaceutical industryPunum Jagg
 
La presse plus apr 2014
La presse plus apr 2014La presse plus apr 2014
La presse plus apr 2014Leith Mason
 
LUMBAR PUNCTURE -by Amiteshwar Reddy
LUMBAR PUNCTURE -by Amiteshwar ReddyLUMBAR PUNCTURE -by Amiteshwar Reddy
LUMBAR PUNCTURE -by Amiteshwar ReddyAmiteshwar Reddy
 

Viewers also liked (16)

orientation intro
orientation introorientation intro
orientation intro
 
My presentation
My presentationMy presentation
My presentation
 
orientation intro
orientation introorientation intro
orientation intro
 
Predstavenie Spolocnosti RadioLAN
Predstavenie Spolocnosti RadioLANPredstavenie Spolocnosti RadioLAN
Predstavenie Spolocnosti RadioLAN
 
Presentation2012 complete
Presentation2012 completePresentation2012 complete
Presentation2012 complete
 
Star chart ppt 2
Star chart ppt 2Star chart ppt 2
Star chart ppt 2
 
orientation intro
orientation introorientation intro
orientation intro
 
Flower bomb!
Flower bomb!Flower bomb!
Flower bomb!
 
Presentation2012 complete(2)
Presentation2012 complete(2)Presentation2012 complete(2)
Presentation2012 complete(2)
 
Types of shots
Types of shotsTypes of shots
Types of shots
 
Jennings Library
Jennings LibraryJennings Library
Jennings Library
 
Provost
ProvostProvost
Provost
 
Adjectives
AdjectivesAdjectives
Adjectives
 
Incentive compensation plan diagnosis in the pharmaceutical industry
Incentive compensation plan diagnosis in the pharmaceutical industryIncentive compensation plan diagnosis in the pharmaceutical industry
Incentive compensation plan diagnosis in the pharmaceutical industry
 
La presse plus apr 2014
La presse plus apr 2014La presse plus apr 2014
La presse plus apr 2014
 
LUMBAR PUNCTURE -by Amiteshwar Reddy
LUMBAR PUNCTURE -by Amiteshwar ReddyLUMBAR PUNCTURE -by Amiteshwar Reddy
LUMBAR PUNCTURE -by Amiteshwar Reddy
 

Similar to Prevalence of overweight and associated risk factors

Determinants of children's nutritional status among primary
Determinants of children's nutritional status among primaryDeterminants of children's nutritional status among primary
Determinants of children's nutritional status among primaryAlexander Decker
 
Dietary practice of school going children
Dietary practice of school going childrenDietary practice of school going children
Dietary practice of school going childrenUday Kumar
 
Undernutrition and Mortality Risk Among Hospitalized Children
Undernutrition and Mortality Risk Among Hospitalized ChildrenUndernutrition and Mortality Risk Among Hospitalized Children
Undernutrition and Mortality Risk Among Hospitalized Childrenasclepiuspdfs
 
Nutritional Status of Children under Five Years of Age and Factors Associate...
Nutritional Status of Children under Five Years of Age and Factors  Associate...Nutritional Status of Children under Five Years of Age and Factors  Associate...
Nutritional Status of Children under Five Years of Age and Factors Associate...Dr. Gawad Alwabr
 
at SciVerse ScienceDirectSocial Science & Medicine 75 (201.docx
at SciVerse ScienceDirectSocial Science & Medicine 75 (201.docxat SciVerse ScienceDirectSocial Science & Medicine 75 (201.docx
at SciVerse ScienceDirectSocial Science & Medicine 75 (201.docxikirkton
 
Food Allergy in School-Going Adolescents and Its Association with Depression ...
Food Allergy in School-Going Adolescents and Its Association with Depression ...Food Allergy in School-Going Adolescents and Its Association with Depression ...
Food Allergy in School-Going Adolescents and Its Association with Depression ...submissionclinmedima
 
Sir waseem presentation
Sir waseem presentationSir waseem presentation
Sir waseem presentationAmnaashraf11
 
Prevalence of Early Childhood Caries and its Association with Body Mass Index...
Prevalence of Early Childhood Caries and its Association with Body Mass Index...Prevalence of Early Childhood Caries and its Association with Body Mass Index...
Prevalence of Early Childhood Caries and its Association with Body Mass Index...iosrjce
 
Prevalence of anemia in adolescent girls and its co relation with demographic...
Prevalence of anemia in adolescent girls and its co relation with demographic...Prevalence of anemia in adolescent girls and its co relation with demographic...
Prevalence of anemia in adolescent girls and its co relation with demographic...Younis I Munshi
 
Evaluation of the impacts of care givers on malnourished children in Ishaka A...
Evaluation of the impacts of care givers on malnourished children in Ishaka A...Evaluation of the impacts of care givers on malnourished children in Ishaka A...
Evaluation of the impacts of care givers on malnourished children in Ishaka A...PUBLISHERJOURNAL
 
Prevalence of malnutrition_and_associated_factors_
Prevalence of malnutrition_and_associated_factors_Prevalence of malnutrition_and_associated_factors_
Prevalence of malnutrition_and_associated_factors_AmanualNuredin
 
Nutritional status, care giving and feeding practices of infant
Nutritional status, care giving and feeding practices of  infantNutritional status, care giving and feeding practices of  infant
Nutritional status, care giving and feeding practices of infantAlexander Decker
 
Malnutrition among Egyptian population
Malnutrition among Egyptian populationMalnutrition among Egyptian population
Malnutrition among Egyptian populationManar Mohamed Rashad
 
A Pilot Study on Prevalence of Obesity and its Determinants among Adolescents...
A Pilot Study on Prevalence of Obesity and its Determinants among Adolescents...A Pilot Study on Prevalence of Obesity and its Determinants among Adolescents...
A Pilot Study on Prevalence of Obesity and its Determinants among Adolescents...ijtsrd
 
Submission Ide e223bfb4-049f-4c26-ba24-2ede2b73157041 SI.docx
Submission Ide e223bfb4-049f-4c26-ba24-2ede2b73157041 SI.docxSubmission Ide e223bfb4-049f-4c26-ba24-2ede2b73157041 SI.docx
Submission Ide e223bfb4-049f-4c26-ba24-2ede2b73157041 SI.docxdeanmtaylor1545
 
Comparison between continuous subcutaneous insulin infusion and multiple dail...
Comparison between continuous subcutaneous insulin infusion and multiple dail...Comparison between continuous subcutaneous insulin infusion and multiple dail...
Comparison between continuous subcutaneous insulin infusion and multiple dail...Alexander Decker
 
Health Consciousness of School Going Adolescents*
Health Consciousness of School Going Adolescents*Health Consciousness of School Going Adolescents*
Health Consciousness of School Going Adolescents*AI Publications
 
Risk factors associated with overweight and obesity among urban school childr...
Risk factors associated with overweight and obesity among urban school childr...Risk factors associated with overweight and obesity among urban school childr...
Risk factors associated with overweight and obesity among urban school childr...MoshiurRahman58271
 

Similar to Prevalence of overweight and associated risk factors (20)

Determinants of children's nutritional status among primary
Determinants of children's nutritional status among primaryDeterminants of children's nutritional status among primary
Determinants of children's nutritional status among primary
 
Dietary practice of school going children
Dietary practice of school going childrenDietary practice of school going children
Dietary practice of school going children
 
Undernutrition and Mortality Risk Among Hospitalized Children
Undernutrition and Mortality Risk Among Hospitalized ChildrenUndernutrition and Mortality Risk Among Hospitalized Children
Undernutrition and Mortality Risk Among Hospitalized Children
 
Nutritional Status of Children under Five Years of Age and Factors Associate...
Nutritional Status of Children under Five Years of Age and Factors  Associate...Nutritional Status of Children under Five Years of Age and Factors  Associate...
Nutritional Status of Children under Five Years of Age and Factors Associate...
 
at SciVerse ScienceDirectSocial Science & Medicine 75 (201.docx
at SciVerse ScienceDirectSocial Science & Medicine 75 (201.docxat SciVerse ScienceDirectSocial Science & Medicine 75 (201.docx
at SciVerse ScienceDirectSocial Science & Medicine 75 (201.docx
 
khosro shafaghi
khosro shafaghikhosro shafaghi
khosro shafaghi
 
Food Allergy in School-Going Adolescents and Its Association with Depression ...
Food Allergy in School-Going Adolescents and Its Association with Depression ...Food Allergy in School-Going Adolescents and Its Association with Depression ...
Food Allergy in School-Going Adolescents and Its Association with Depression ...
 
Sir waseem presentation
Sir waseem presentationSir waseem presentation
Sir waseem presentation
 
Prevalence of Early Childhood Caries and its Association with Body Mass Index...
Prevalence of Early Childhood Caries and its Association with Body Mass Index...Prevalence of Early Childhood Caries and its Association with Body Mass Index...
Prevalence of Early Childhood Caries and its Association with Body Mass Index...
 
Prevalence of anemia in adolescent girls and its co relation with demographic...
Prevalence of anemia in adolescent girls and its co relation with demographic...Prevalence of anemia in adolescent girls and its co relation with demographic...
Prevalence of anemia in adolescent girls and its co relation with demographic...
 
Evaluation of the impacts of care givers on malnourished children in Ishaka A...
Evaluation of the impacts of care givers on malnourished children in Ishaka A...Evaluation of the impacts of care givers on malnourished children in Ishaka A...
Evaluation of the impacts of care givers on malnourished children in Ishaka A...
 
Prevalence of malnutrition_and_associated_factors_
Prevalence of malnutrition_and_associated_factors_Prevalence of malnutrition_and_associated_factors_
Prevalence of malnutrition_and_associated_factors_
 
Nutritional status, care giving and feeding practices of infant
Nutritional status, care giving and feeding practices of  infantNutritional status, care giving and feeding practices of  infant
Nutritional status, care giving and feeding practices of infant
 
Malnutrition among Egyptian population
Malnutrition among Egyptian populationMalnutrition among Egyptian population
Malnutrition among Egyptian population
 
A Pilot Study on Prevalence of Obesity and its Determinants among Adolescents...
A Pilot Study on Prevalence of Obesity and its Determinants among Adolescents...A Pilot Study on Prevalence of Obesity and its Determinants among Adolescents...
A Pilot Study on Prevalence of Obesity and its Determinants among Adolescents...
 
Submission Ide e223bfb4-049f-4c26-ba24-2ede2b73157041 SI.docx
Submission Ide e223bfb4-049f-4c26-ba24-2ede2b73157041 SI.docxSubmission Ide e223bfb4-049f-4c26-ba24-2ede2b73157041 SI.docx
Submission Ide e223bfb4-049f-4c26-ba24-2ede2b73157041 SI.docx
 
Comparison between continuous subcutaneous insulin infusion and multiple dail...
Comparison between continuous subcutaneous insulin infusion and multiple dail...Comparison between continuous subcutaneous insulin infusion and multiple dail...
Comparison between continuous subcutaneous insulin infusion and multiple dail...
 
Comparison between continuous subcutaneous insulin infusion and multiple dail...
Comparison between continuous subcutaneous insulin infusion and multiple dail...Comparison between continuous subcutaneous insulin infusion and multiple dail...
Comparison between continuous subcutaneous insulin infusion and multiple dail...
 
Health Consciousness of School Going Adolescents*
Health Consciousness of School Going Adolescents*Health Consciousness of School Going Adolescents*
Health Consciousness of School Going Adolescents*
 
Risk factors associated with overweight and obesity among urban school childr...
Risk factors associated with overweight and obesity among urban school childr...Risk factors associated with overweight and obesity among urban school childr...
Risk factors associated with overweight and obesity among urban school childr...
 

Recently uploaded

Call Girls Service Pune Vaishnavi 9907093804 Short 1500 Night 6000 Best call ...
Call Girls Service Pune Vaishnavi 9907093804 Short 1500 Night 6000 Best call ...Call Girls Service Pune Vaishnavi 9907093804 Short 1500 Night 6000 Best call ...
Call Girls Service Pune Vaishnavi 9907093804 Short 1500 Night 6000 Best call ...Miss joya
 
VIP Call Girls Pune Vani 9907093804 Short 1500 Night 6000 Best call girls Ser...
VIP Call Girls Pune Vani 9907093804 Short 1500 Night 6000 Best call girls Ser...VIP Call Girls Pune Vani 9907093804 Short 1500 Night 6000 Best call girls Ser...
VIP Call Girls Pune Vani 9907093804 Short 1500 Night 6000 Best call girls Ser...Miss joya
 
Call Girls Horamavu WhatsApp Number 7001035870 Meeting With Bangalore Escorts
Call Girls Horamavu WhatsApp Number 7001035870 Meeting With Bangalore EscortsCall Girls Horamavu WhatsApp Number 7001035870 Meeting With Bangalore Escorts
Call Girls Horamavu WhatsApp Number 7001035870 Meeting With Bangalore Escortsvidya singh
 
VIP Call Girls Tirunelveli Aaradhya 8250192130 Independent Escort Service Tir...
VIP Call Girls Tirunelveli Aaradhya 8250192130 Independent Escort Service Tir...VIP Call Girls Tirunelveli Aaradhya 8250192130 Independent Escort Service Tir...
VIP Call Girls Tirunelveli Aaradhya 8250192130 Independent Escort Service Tir...narwatsonia7
 
Call Girls Service In Shyam Nagar Whatsapp 8445551418 Independent Escort Service
Call Girls Service In Shyam Nagar Whatsapp 8445551418 Independent Escort ServiceCall Girls Service In Shyam Nagar Whatsapp 8445551418 Independent Escort Service
Call Girls Service In Shyam Nagar Whatsapp 8445551418 Independent Escort Serviceparulsinha
 
Russian Call Girls in Chennai Pallavi 9907093804 Independent Call Girls Servi...
Russian Call Girls in Chennai Pallavi 9907093804 Independent Call Girls Servi...Russian Call Girls in Chennai Pallavi 9907093804 Independent Call Girls Servi...
Russian Call Girls in Chennai Pallavi 9907093804 Independent Call Girls Servi...Nehru place Escorts
 
CALL ON ➥9907093804 🔝 Call Girls Hadapsar ( Pune) Girls Service
CALL ON ➥9907093804 🔝 Call Girls Hadapsar ( Pune)  Girls ServiceCALL ON ➥9907093804 🔝 Call Girls Hadapsar ( Pune)  Girls Service
CALL ON ➥9907093804 🔝 Call Girls Hadapsar ( Pune) Girls ServiceMiss joya
 
Call Girl Service Bidadi - For 7001305949 Cheap & Best with original Photos
Call Girl Service Bidadi - For 7001305949 Cheap & Best with original PhotosCall Girl Service Bidadi - For 7001305949 Cheap & Best with original Photos
Call Girl Service Bidadi - For 7001305949 Cheap & Best with original Photosnarwatsonia7
 
Call Girls Yelahanka Just Call 7001305949 Top Class Call Girl Service Available
Call Girls Yelahanka Just Call 7001305949 Top Class Call Girl Service AvailableCall Girls Yelahanka Just Call 7001305949 Top Class Call Girl Service Available
Call Girls Yelahanka Just Call 7001305949 Top Class Call Girl Service Availablenarwatsonia7
 
Bangalore Call Girls Marathahalli 📞 9907093804 High Profile Service 100% Safe
Bangalore Call Girls Marathahalli 📞 9907093804 High Profile Service 100% SafeBangalore Call Girls Marathahalli 📞 9907093804 High Profile Service 100% Safe
Bangalore Call Girls Marathahalli 📞 9907093804 High Profile Service 100% Safenarwatsonia7
 
Sonagachi Call Girls Services 9907093804 @24x7 High Class Babes Here Call Now
Sonagachi Call Girls Services 9907093804 @24x7 High Class Babes Here Call NowSonagachi Call Girls Services 9907093804 @24x7 High Class Babes Here Call Now
Sonagachi Call Girls Services 9907093804 @24x7 High Class Babes Here Call NowRiya Pathan
 
VIP Mumbai Call Girls Hiranandani Gardens Just Call 9920874524 with A/C Room ...
VIP Mumbai Call Girls Hiranandani Gardens Just Call 9920874524 with A/C Room ...VIP Mumbai Call Girls Hiranandani Gardens Just Call 9920874524 with A/C Room ...
VIP Mumbai Call Girls Hiranandani Gardens Just Call 9920874524 with A/C Room ...Garima Khatri
 
Call Girls Service Bellary Road Just Call 7001305949 Enjoy College Girls Service
Call Girls Service Bellary Road Just Call 7001305949 Enjoy College Girls ServiceCall Girls Service Bellary Road Just Call 7001305949 Enjoy College Girls Service
Call Girls Service Bellary Road Just Call 7001305949 Enjoy College Girls Servicenarwatsonia7
 
Call Girls Chennai Megha 9907093804 Independent Call Girls Service Chennai
Call Girls Chennai Megha 9907093804 Independent Call Girls Service ChennaiCall Girls Chennai Megha 9907093804 Independent Call Girls Service Chennai
Call Girls Chennai Megha 9907093804 Independent Call Girls Service ChennaiNehru place Escorts
 
VIP Call Girls Indore Kirti 💚😋 9256729539 🚀 Indore Escorts
VIP Call Girls Indore Kirti 💚😋  9256729539 🚀 Indore EscortsVIP Call Girls Indore Kirti 💚😋  9256729539 🚀 Indore Escorts
VIP Call Girls Indore Kirti 💚😋 9256729539 🚀 Indore Escortsaditipandeya
 
Russian Call Girl Brookfield - 7001305949 Escorts Service 50% Off with Cash O...
Russian Call Girl Brookfield - 7001305949 Escorts Service 50% Off with Cash O...Russian Call Girl Brookfield - 7001305949 Escorts Service 50% Off with Cash O...
Russian Call Girl Brookfield - 7001305949 Escorts Service 50% Off with Cash O...narwatsonia7
 
Call Girls Service Chennai Jiya 7001305949 Independent Escort Service Chennai
Call Girls Service Chennai Jiya 7001305949 Independent Escort Service ChennaiCall Girls Service Chennai Jiya 7001305949 Independent Escort Service Chennai
Call Girls Service Chennai Jiya 7001305949 Independent Escort Service ChennaiNehru place Escorts
 
Call Girls In Andheri East Call 9920874524 Book Hot And Sexy Girls
Call Girls In Andheri East Call 9920874524 Book Hot And Sexy GirlsCall Girls In Andheri East Call 9920874524 Book Hot And Sexy Girls
Call Girls In Andheri East Call 9920874524 Book Hot And Sexy Girlsnehamumbai
 

Recently uploaded (20)

Call Girls Service Pune Vaishnavi 9907093804 Short 1500 Night 6000 Best call ...
Call Girls Service Pune Vaishnavi 9907093804 Short 1500 Night 6000 Best call ...Call Girls Service Pune Vaishnavi 9907093804 Short 1500 Night 6000 Best call ...
Call Girls Service Pune Vaishnavi 9907093804 Short 1500 Night 6000 Best call ...
 
VIP Call Girls Pune Vani 9907093804 Short 1500 Night 6000 Best call girls Ser...
VIP Call Girls Pune Vani 9907093804 Short 1500 Night 6000 Best call girls Ser...VIP Call Girls Pune Vani 9907093804 Short 1500 Night 6000 Best call girls Ser...
VIP Call Girls Pune Vani 9907093804 Short 1500 Night 6000 Best call girls Ser...
 
Call Girls Horamavu WhatsApp Number 7001035870 Meeting With Bangalore Escorts
Call Girls Horamavu WhatsApp Number 7001035870 Meeting With Bangalore EscortsCall Girls Horamavu WhatsApp Number 7001035870 Meeting With Bangalore Escorts
Call Girls Horamavu WhatsApp Number 7001035870 Meeting With Bangalore Escorts
 
VIP Call Girls Tirunelveli Aaradhya 8250192130 Independent Escort Service Tir...
VIP Call Girls Tirunelveli Aaradhya 8250192130 Independent Escort Service Tir...VIP Call Girls Tirunelveli Aaradhya 8250192130 Independent Escort Service Tir...
VIP Call Girls Tirunelveli Aaradhya 8250192130 Independent Escort Service Tir...
 
Call Girls Service In Shyam Nagar Whatsapp 8445551418 Independent Escort Service
Call Girls Service In Shyam Nagar Whatsapp 8445551418 Independent Escort ServiceCall Girls Service In Shyam Nagar Whatsapp 8445551418 Independent Escort Service
Call Girls Service In Shyam Nagar Whatsapp 8445551418 Independent Escort Service
 
Russian Call Girls in Delhi Tanvi ➡️ 9711199012 💋📞 Independent Escort Service...
Russian Call Girls in Delhi Tanvi ➡️ 9711199012 💋📞 Independent Escort Service...Russian Call Girls in Delhi Tanvi ➡️ 9711199012 💋📞 Independent Escort Service...
Russian Call Girls in Delhi Tanvi ➡️ 9711199012 💋📞 Independent Escort Service...
 
Russian Call Girls in Chennai Pallavi 9907093804 Independent Call Girls Servi...
Russian Call Girls in Chennai Pallavi 9907093804 Independent Call Girls Servi...Russian Call Girls in Chennai Pallavi 9907093804 Independent Call Girls Servi...
Russian Call Girls in Chennai Pallavi 9907093804 Independent Call Girls Servi...
 
CALL ON ➥9907093804 🔝 Call Girls Hadapsar ( Pune) Girls Service
CALL ON ➥9907093804 🔝 Call Girls Hadapsar ( Pune)  Girls ServiceCALL ON ➥9907093804 🔝 Call Girls Hadapsar ( Pune)  Girls Service
CALL ON ➥9907093804 🔝 Call Girls Hadapsar ( Pune) Girls Service
 
Escort Service Call Girls In Sarita Vihar,, 99530°56974 Delhi NCR
Escort Service Call Girls In Sarita Vihar,, 99530°56974 Delhi NCREscort Service Call Girls In Sarita Vihar,, 99530°56974 Delhi NCR
Escort Service Call Girls In Sarita Vihar,, 99530°56974 Delhi NCR
 
Call Girl Service Bidadi - For 7001305949 Cheap & Best with original Photos
Call Girl Service Bidadi - For 7001305949 Cheap & Best with original PhotosCall Girl Service Bidadi - For 7001305949 Cheap & Best with original Photos
Call Girl Service Bidadi - For 7001305949 Cheap & Best with original Photos
 
Call Girls Yelahanka Just Call 7001305949 Top Class Call Girl Service Available
Call Girls Yelahanka Just Call 7001305949 Top Class Call Girl Service AvailableCall Girls Yelahanka Just Call 7001305949 Top Class Call Girl Service Available
Call Girls Yelahanka Just Call 7001305949 Top Class Call Girl Service Available
 
Bangalore Call Girls Marathahalli 📞 9907093804 High Profile Service 100% Safe
Bangalore Call Girls Marathahalli 📞 9907093804 High Profile Service 100% SafeBangalore Call Girls Marathahalli 📞 9907093804 High Profile Service 100% Safe
Bangalore Call Girls Marathahalli 📞 9907093804 High Profile Service 100% Safe
 
Sonagachi Call Girls Services 9907093804 @24x7 High Class Babes Here Call Now
Sonagachi Call Girls Services 9907093804 @24x7 High Class Babes Here Call NowSonagachi Call Girls Services 9907093804 @24x7 High Class Babes Here Call Now
Sonagachi Call Girls Services 9907093804 @24x7 High Class Babes Here Call Now
 
VIP Mumbai Call Girls Hiranandani Gardens Just Call 9920874524 with A/C Room ...
VIP Mumbai Call Girls Hiranandani Gardens Just Call 9920874524 with A/C Room ...VIP Mumbai Call Girls Hiranandani Gardens Just Call 9920874524 with A/C Room ...
VIP Mumbai Call Girls Hiranandani Gardens Just Call 9920874524 with A/C Room ...
 
Call Girls Service Bellary Road Just Call 7001305949 Enjoy College Girls Service
Call Girls Service Bellary Road Just Call 7001305949 Enjoy College Girls ServiceCall Girls Service Bellary Road Just Call 7001305949 Enjoy College Girls Service
Call Girls Service Bellary Road Just Call 7001305949 Enjoy College Girls Service
 
Call Girls Chennai Megha 9907093804 Independent Call Girls Service Chennai
Call Girls Chennai Megha 9907093804 Independent Call Girls Service ChennaiCall Girls Chennai Megha 9907093804 Independent Call Girls Service Chennai
Call Girls Chennai Megha 9907093804 Independent Call Girls Service Chennai
 
VIP Call Girls Indore Kirti 💚😋 9256729539 🚀 Indore Escorts
VIP Call Girls Indore Kirti 💚😋  9256729539 🚀 Indore EscortsVIP Call Girls Indore Kirti 💚😋  9256729539 🚀 Indore Escorts
VIP Call Girls Indore Kirti 💚😋 9256729539 🚀 Indore Escorts
 
Russian Call Girl Brookfield - 7001305949 Escorts Service 50% Off with Cash O...
Russian Call Girl Brookfield - 7001305949 Escorts Service 50% Off with Cash O...Russian Call Girl Brookfield - 7001305949 Escorts Service 50% Off with Cash O...
Russian Call Girl Brookfield - 7001305949 Escorts Service 50% Off with Cash O...
 
Call Girls Service Chennai Jiya 7001305949 Independent Escort Service Chennai
Call Girls Service Chennai Jiya 7001305949 Independent Escort Service ChennaiCall Girls Service Chennai Jiya 7001305949 Independent Escort Service Chennai
Call Girls Service Chennai Jiya 7001305949 Independent Escort Service Chennai
 
Call Girls In Andheri East Call 9920874524 Book Hot And Sexy Girls
Call Girls In Andheri East Call 9920874524 Book Hot And Sexy GirlsCall Girls In Andheri East Call 9920874524 Book Hot And Sexy Girls
Call Girls In Andheri East Call 9920874524 Book Hot And Sexy Girls
 

Prevalence of overweight and associated risk factors

  • 1. Emir. J. Agric. Sci. 2005. 17 (1): 43-56 http://www.cfa.uaeu.ac.ae/Research/EJAS.htm Prevalence of overweight and associated risk factors among primary female school children in Al-Ain city United Arab Emirates Abdelhamid Kerkadi, Nassar Abo-Elnaga, and Wissam Ibrahim Department of Nutrition and Health, College of Food and Agriculture, UAE University, UAE P.O Box 17555, Al Ain, UAE. Abstract: Obesity is currently an escalating epidemic that affects many countries in the world including the Gulf region where this condition is responsible for an increasing death rates annually. The objective of the study was to evaluate the prevalence of overweight and associated risk factors in primary female school children in Al Ain city, United Arab Emirates (UAE). Height and weight were measured in a sample of 900 female primary school children aged between 5-14 years. Body Mass Index (BMI) was calculated for each child. Children were categorized according to age and specific percentile of BMI using 2000 CDC BMI-age growth charts. A questionnaire addressing food habits, food consumption and life style (TV watching and physical activity) was completed. The results showed that the prevalence of the risk of overweight and overweight were 11.1% and 15.8% respectively. Sixty percent of children consumed chips and chocolates daily while 28% and 32.2% reported a daily consumption of vegetables and fruits respectively. Viewing TV more than 2h/day, parents obesity, breakfast intake and physical activity were significantly associated with a higher risk of overweight. Results indicated that a high prevalence of overweight exists among primary school female children. This calls for aggressive prevention strategies which, if successful, may significantly reduce adult obesity. Key words: Overweight. Female school children, risk factors, Food consumption patterns. دراسة السمنة وعوامل الخطورة بين بنات المدارس الابتدائية في العين الإمارات العربية المتحدة عبد الحميد كركادي، ناصر ابو النجا، وسام إبراهيم قسم التغذية والصحة، كلية الأغذية والزراعة، جامعة الإمارات العربية المتحدة. ص. ب ١٧٥٥٥ ، العين، الإمارات العربية المتحدة ملخص: السمنة من الأعراض المرضية التي أصبحت شائعة في الدول المتقدمة والنامية على السواء بما فيها منطقة الخليج مما أدى إلى زيادة في نسب الوفيات سنويًا. يهدف هذا البحث إلى دراسة السمنة وعوامل الخطورة بين بنات المدارس الابتدائية في العين، الإمارات العربية المتحدة. فقد تم أخذ الوزن والطول لعينة تتكون من ٩٠٠ طالبة من المرحلة الابتدائية تتراوح ١٤ سنة. تم حساب منسب كتلة الجسم (م.ك.ج) لكل طالبة، وتم تصنيف الطالبات حسب العمر و م.ك.ج - أعمارهن بين ٥ باستعمال لوحات النمو المعيارية الصادرة عن مركز مراقبة الأمراض. كذلك تمت تعبئة استمارة تحتوي على أسئلة خاصة بالعادات الغذائية والنمط الاستهلاكي والنمط المعيشي (مشاهدة التلفاز وممارسة الرياضة). وأوضحت النتائج أن نسبة انتشار خطورة زيادة الوزن وزيادة الوزن كانت كما يلي على التوالي ١١,١ % و ١٥,٨ %. ستون بالمئة ( ٦٠ %) من المبحوثات يتناولن الشكولاتة ورقاقات البطاطس يوميًا. بينما أن استهلاك الخضراوات والفواكه كان قلي ً لا جدًا لدى ٢٨ % و ٣٢,٢ % من الطالبات على التوالي. مشاهدة التلفاز لأكثر من ساعتين في اليوم، السمنة لدى الأولياء، تناول فطور الصباح وممارسة النشاط الرياضي من العوامل المرتبطة بخطورة الإصابة بزيادة الوزن. وتشير نتائج هذا البحث إلى أن نسبة انتشار زيادة الوزن مرتفعة بين بنات المدارس الابتدائية. وهذا يتطلب وضع إستراتجية وقائية في حالة نجاحها يمكن أن تخفف نسبيا من السمنة عند البالغين. كلمات مفتاحية: زيادة الوزن، مدارس البنات، عوامل الخطورة، النمط لاستهلاكي. ٤٣
  • 2. Abdelhamid Kerkadi et al. ٤٤ Introduction Obesity is currently an escalating epidemic that affects many countries in the world including the Arabian Gulf region (Al-Awadi and Amine, 1989; Al- Shammari et al., 1994; El-Mugamer et al., 1995; Al-Mahroos and Al-Roomi, 1999) where it is responsible for increasing death rates annually. This condition could occur during any of the various stages of human life (Dietz, 1994). Obesity among children is a concern, because it may have long term health consequences. In high-income countries, extensive evidence indicates that obesity during childhood is related to adult obesity (Rolland-Cachera et al., 1987; Serdula et al., 1993; Power et al., 1997; Guo and Chumlea, 1999; Wang and Popkin, 2000). The causes of pediatric obesity have not been elucidated completely, although it is suspected that a complex interaction of genetic, environmental, and behavioural factors is responsible (Schonfeld-Warden and Waeden, 1997). Recent research suggests that aspects of diet composition, may play a role in overweight (Nguyen et al., 1996; Maffeis et al., 2000). Low physical activity rates are associated with obesity (Wolf et al., 1993; Obarzanek et al., 1994) and television viewing has been shown to be a significant risk factor for pediatric obesity, both cross-sectionally and prospectively (Klesges et al., 1993; Gortmaker et al., 1996; Hanley et al., 2000; Coon et al., 2001). The rates of overweight and obesity are much higher in the Arabian Gulf populations, including children, compared to developed countries (Al- Awadi and Amine, 1989; Al-Shammari et al., 1994; El-Mugamer et al., 1995; Al-Mahroos and Al-Roomi, 1999). This increase in the prevalence of obesity is due to life style changes (physical activity, leisure, and modernization) and nutrition transition which are in relation with changing economic, social, and health factors (Al Isa, 1999). It is well known that Arabian Gulf countries moved toward the higher fat and higher refined carbohydrates Western diet (Kim et al., 2000). Major dietary changes include a large increase in the consumption of fat and added sugar in the diet, and often a marked increase in animal food products which is contrasted with a fall in total cereal intake, vegetable, and fruits consumption (Popkin, 2001). The objective of the study was to evaluate the prevalence of the risk of overweight, overweight, and associated behavioural risk factors including food habits, television viewing, and physical activity in primary female school children in Al Ain city, United Arab Emirates (UAE). Methods Subjects and sample size This study was conducted during the months of March and April, 2003 in Al- Ain city, UAE on local female students attending primary public schools (grades one to six). According to the 2002-2003 statistics of the UAE Ministry of Education's, the total number of local children enrolled in Al-Ain primary public schools is 20,040 out of which 10,303 are female students. A list of schools was obtained from the Ministry of Education and eight primary female schools were randomly selected from the list using a random number table. After that, two classes were selected from each grade in each of the eight schools. Then, a list of students was obtained for each class, students were listed according to alphabetical order, and a number was assigned to every student on the list. This was followed by random selection of the desired number of students from each grade. Each student had the same probability of being selected. If the
  • 3. Emir. J. Agric. Sci. 2005. 17 (1): 43-56 http://www.cfa.uaeu.ac.ae/Research/EJAS.htm ٤٥ selected student was absent, the next number on the list was picked. The total number of subjects that participated in this study was 900 children which is about 9% of the total number of female students (10,303) in Al-Ain primary schools. The age range of children was 5-14 years. Data collection The UAE University approved the protocol of the study. The ministry of Education and the Ministry of Health (School Health Department) approved the performance of the survey in the selected schools. The survey was based on questionnaire sent home and collection of anthropometric data from participating children. Standard techniques were adopted for obtaining anthropometric measurements. Subjects were weighed in light clothes and with no shoes using a seca scale at nearest 0.1 kg. Height was measured to nearest 0.1 cm using a wall mounted stadiometer. The Body Mass Index (BMI) was determined from the ratio of weight to height square. Children were categorized according to age and specific percentile of BMI using 2000 CDC BMI-age growth charts (Flegal et al., 2002; Mei et al., 2002). Underweight is defined as less than or equal to the age specific 5th percentile. Normal weight is defined as between the 5th and 85th age–specific percentile. Students between the 85th and 95th are categorized as at risk of being overweight. At the 95th percentile and above, children are classified as overweight. Two questionnaires have been used to collect data. These questionnaires were pilot tested on one school prior to undertaking the study. During pilot testing, questionnaires underwent several modifications. The modified questionnaires were used to collect data. The first questionnaire, a self administrated questionnaire addressed to parents and sent with students along with a cover letter explaining the purpose of the study. The parents of each selected child were asked to complete the questionnaire and to send it with their children to school. The completed questionnaires were collected from the school head master by the researchers. The questionnaire consisted of two sections. A general section concerned family data such as marital status of parents, father and mother level of education, parents occupation, family size, and obesity within family. Parents were asked to describe themselves as obese or normal. The second section consisted a food frequency questionnaire which was developed by the Department of nutrition and Health, UAE University. Intake of foods were categorized as follows: Almost daily, once a week, 2-4 times per week, and none (less than once a week). Foods were divided in food groups: Fruits and fruit juice, vegetables, meat, dairy, bread and cereals. Three other food groups were also included: sweet and snacks, soft drink and beverage (tea, coffee). Sweet and snacks food included fast food, chips, cookies. Fast food consumption defined as foods consumed away from home in fast food restaurants. The second questionnaire administrated to students in the classroom by trained data collectors included questions related to behavioural factors such as the number of hours spent on watching television and video or playing video games the previous day. Almost all students reported watching television, for that, only this variable was used in the analysis. TV watching may vary from day to day. For that, TV watching was categorized in 0-2 h/d or >2h/d. Students were asked to report if they were participating in physical activity and how much money did they bring daily with them to school. Pocket money was categorized in two levels: [0-3Dh/d, >3 Dh/d] (Dh= Dirhams; 1$= 3.678 Dh). The questionnaire asked about the consumption of snacks (defined as any
  • 4. Abdelhamid Kerkadi et al. ٤٦ food consumed excluding formal meals), while watching television, breakfast and number of meals intake. Statistic Analysis A database was set up using Microsoft Access to store the data. Then the data was read by SPSS (11.0) for windows which was used for statistical analysis. Data analysis included both descriptive and inferential statistics. Correlation coefficients were calculated for the continuous variables (BMI, weight and height) to identify possible associations. The mean BMI, weight and height were tested by an analysis of variance (ANOVA) to assess differences between age groups. The percentage of the study population in different BMI categories was calculated for the total sample and stratified by age group. Multiple logistic regression was used to examine factors associated with overweight in the study population, including television viewing, breakfast intake, daily physical activity, pocket money and parents obesity. The outcome variable for these analyses was overweight defined as children with body mass index (BMI) greater or equal to the age-specific 85th percentile of 2000 CDC growth charts. All variables were analyzed as a 2 level categorical variable: Television viewing [(0–2 h/d), (>2h/d)]; daily physical activity [yes, no]; pocket money [(0-3Dh/d), (>3Dh/d)], breakfast intake [yes, no] and parents obesity [at least one of them, no]. Age was treated as potential confounding variable. Odds ratios (ORs) and their 95% confidence intervals (CI) for associated factors were estimated from logistic regression models by exponentiating the β coefficient. Food groups frequency of consumption was presented as daily frequency of consumption. Bivariate for testing between group variable differences were done using the independent t test. The independent association of predictors (food groups) with overweight was also examined using multiple logistic regression adjusting for age. All food groups were included in the model. ORs were considered statistically significant at P value < 0.05. Results Among nine hundred girls initially included in the study, five hundreds forty five filled out the questionnaire and returned it to schools. We were unable to collect the remaining questionnaires because some parents did not want to participate in the study. In addition some parents did not complete all questions related to food consumption pattern, we were also unable to obtain anthropometric measures on 5 children. The reason for missing anthropometric measures was lack of time to finish anthropometry in some schools on scheduled days. 93-97% of children gave information on TV watching, physical activity, breakfast intake, pocket money, number of meals, and parents obesity. The demographic and socio-economic characteristics of the subjects are shown in Table 1. The mean age of participants was 9.4 ± 1.8 y. 20.8% of children lived in small families (5 persons or less). Fathers' education was higher than mothers' education. Only 12.2 % of mothers were employed. 6.7% of fathers and 12.2% of mothers were obese. Anthropometric characteristics of the sample according to age are given in Table 2. The study population was divided into 3 age groups as follows: group 1: 5-7 years; group 2: 8-10 years and group 3: 11 years and over. Results show that weight, height, and BMI increased with age and differences were significant (P < 0.0001) between age groups. A statistically significant (P < 0.001) positive correlation between age and anthropometric measurements was observed (Pearson Correlation was 0.586, 0.740 and 0.389 for weight, height, and BMI, respectively).
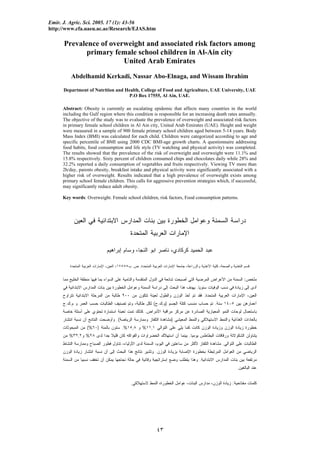
  • 5. Emir. J. Agric. Sci. 2005. 17 (1): 43-56 http://www.cfa.uaeu.ac.ae/Research/EJAS.htm Table 1. Demographic and socio economic characteristics of the sample Category Number % a Number of individuals living in the same house b1= none or elementary school; 2= High school; 3 = College and University c House maid : a person who help in cleaning, preparing meals and taking care of children Table 2. Anthropometric characteristics of the sample according to age a Age groups N b Weight (Kg) Height (cm) BMI c(Kg/m2) 5-7 184 23.4 ± 0.4* 122.4 ± 0.5* 15.5 ± 0.2* 8-10 445 32.1± 0.5 * 133.3 ± 0.4* 17.7 ± 0.5* ≥11 266 44.1 ± 0.8* 146.2 ± 0.5* 20.4 ± 0.3* Total 895 33.8 ± 0.4 134.9 ± 0.4 18.1 ± 0.1 a Values are Mean ± Standard Error (SE) b N: Number of individuals c BMI: Body Mass Index * Significantly different between age groups at P< 0.0001 ٤٧ The prevalence of underweight, normal weight, risk of overweight and overweight according to age is shown in Graph 1. Results show that 11.1% were at risk of overweight, 15.8% were overweight, 61.6 % had a normal weight and 11.6% were underweight. The prevalence of risk overweight increased with age and reached its highest rate (12.5%) at age 11 years and over. The same trend was noted for overweight where the highest rate (21.2%) was observed in the oldest group (11 years and over). A significantly association was found between BMI and age groups (χ2 = 23.89, P < 0.001). Age (years) 5 -7 184 20.4 8-10 ≥11 Total Family size (persons) a 5 or less 6-10 ≥11 Total Mother education b 1 2 3 Total Father education b 1 2 3 Total Mothers employed Fathers employed Parents obesity Fathers Mothers Presence of house maid c 450 266 900 114 298 135 547 243 206 76 525 165 251 97 513 64 419 60 110 433 50.0 29.6 20.8 54.5 24.7 46.3 39.2 14.5 32.2 48.9 18.9 12.2 81.5 06.7 12.2 82.5
  • 6. Abdelhamid Kerkadi et al. Underweight Normal weight At Risk of overweight ٤٨ Overweight BMIgroups 70 60 50 40 30 20 10 0 Percent age 5 to 7 8 to 10 11 and more Graph 1. Prevalence of underweight, normal weight, risk of overweight and overweight according to agea a Children were classified according to 2000 CDC BMI-age growth charts * Significant difference according to age groups , χ2 = 23.89 , P< 0.001 Only five hundreds nineteen filled out the questionnaire related to food consumption frequency. It is noted that we did not find significant difference of anthropometric measurements (weight, height and BMI) between children who returned the questionnaire and children who did not return it. For that, the results of analysis of questionnaires can be considered as representative of the population. The analysis of the food consumption frequencies indicated that the consumption of fruits, leafy vegetables, and other vegetables was least frequent (32.2 %, 28% and 45.5% respectively). In addition, 38.8% and 18.8% of the subjects reported a daily consumption of chicken and meat respectively, while the daily
  • 7. Emir. J. Agric. Sci. 2005. 17 (1): 43-56 http://www.cfa.uaeu.ac.ae/Research/EJAS.htm ٤٩ consumption of fish was 13.2% (results not shown). The consumption of milk products was more frequent than full fat milk consumption (64% versus 34.6%). among cereals group, rice is the most frequently consumed food (71.6%) followed by white bread (58.4%) while 65.7% did not consume whole wheat bread (results not shown). We noted that 60.2% and 25.9% of children reported a daily consumed of chips and soft drink respectively, and 75% consumed fast food at least once a week. In addition, 37.3% of subjects reported a daily consumption of tea. 51.9% of children reported that they never snack while watching television (results not shown). Table 3 shows comparison of food groups daily frequency of consumption between overweight and normal weight female primary school children. We noted that the daily frequency of consumption for all food groups did not differ between the two groups (overweight vs normal). Multiple logistic regression analysis was used to evaluate the association between daily frequency of food groups consumption (fruit, fruit juice, vegetables, bread and cereals, dairy, meat, sweets and snacks, soft drink and beverage) and overweight. All variables were included in the model after adjusting for age. Results shown that only the variable vegetables was marginally associated with overweight (OR= 1.20; 95% CI = 0.995 and 1.250; P = 0.056). Multiple logistic regression analyses indicated that breakfast intake, viewing TV more than 2hours/day, parent obesity, daily physical activity were positively associated with child overweight (Table 4). Girls who did not take breakfast were more likely to be overweight. There was a significant association between breakfast intake and overweight. Overall, 9.1% of girls reported watching 2 or more hours of television per day, 45.6% of them were overweight (results not shown). The prevalence of watching more than 2 hours of television per day increased with age and the maximum occurred in the oldest group (11 years and more) (results not shown). Compared with children who watched less than 2 h/d of TV, children who watched more than 2 h/d had 2.88 greater OR (odds ratio) of being overweight. We noted a statistically significant association between watching 2 hours and more of television per day and overweight. 10.4% of girls did not practice sport, 40.2% of them were overweight and we noted that girls who did not practice sport were more likely to be overweight and the association between sport and overweight was statistically significant. 27.1% of children reported that they bring 3 and more Dh as pocket money per day and the totality was used to buy chips, candies and sandwich from the school's canteen. The prevalence of overweight children increased as the amount of pocket money increased (results not shown). We noted that students who bring 3 Dh and more had 1.63 OR greater of being overweight and the association was not statistically significant at P < 0.05. We did not find a significant association between pocket money and overweight because pocket money was correlated with age (r = 0.21, P = 0.0001) and we adjusted for age in the multiple logistic regression model. Almost 26% of students have at least one of their parents obese and there was a significant association (P = 0.023) between parents obesity and child overweight.
  • 8. Abdelhamid Kerkadi et al. Table 3. Comparison of daily frequency of food consumption1 between overweight and normal female school children in Al-Ain city2 Overweight3 Normal P-value4 N 146 372 Food groups5 ٥٠ Daily frequency Bread and cereals 3.01 ± 0.05 3.01 ± 0.04 0.92 Vegetables 3.17 ± 0.10 3.00 ± 0.06 0.12 Fruit 3.17 ± 0.08 3.16 ± 0.05 0.94 Fruit juices 3.12 ± 0.11 3.15 ± 0.07 0.85 Meat 2.69 ± 0.05 2.72 ± 0.03 0.64 Dairy 2.90 ± 0.08 2.92 ± 0.05 0.79 Sweets and snacks 2.95 ± 0.07 2.96 ± 0.04 0.96 Soft drinks 2.47 ± 0.10 2.50 ± 0.06 0.75 Beverage 3.02 ± 0.13 2.97 ± 0.08 0.72 *Values are means ± SE 1All age groups were included 2Overweight children are those with body mass index (BMI) greater or equal to the age-specific 85th percentile of 2000 CDC growth charts 3Student t test 4Food groups: Breads and cereals: White bread, whole wheat bread, rice, pasta, breakfast cereals; Vegetables: leafy vegetables and other vegetables; fruit: apple, mango, peach, grapes, orange, banana; Fruit juices: fresh squeezed juices; Meat: beef, lamb, Chicken, fish and meat products; Dairy: milk (low fat and full fat), cheese, yogurt; Sweets and snacks: chocolate, chips, candy, cookies, popcorn; soft drinks: soft drinks, soda; Beverage: tea, coffee Table 4. Factors associated with overweight1 in female school children* in Al Ain city. Multiple logistic regression2 95% CI4 OR3 _____________________ P-value Lower Upper Breakfast Intake5 1.82 1.31 2.53 0.0001 TV viewing, h/d6 1.74 1.05 2.88 0.031 Parents obesity7 0.67 0.45 0.95 0.023 Physical activity8 1.58 0.94 2.57 0.06 Pocket money9, Dh/d 1.15 0.81 1.63 0.45 * All age groups were included 1Overweight children are those with body mass index (BMI) greater or equal to the age-specific 85th percentile of 2000 CDC growth charts 2Multiple logistic regression analysis was performed on group membership (overweight vs normal) as outcome and all five factors were included in the model after adjusting for age 3OR= odds ratio 495% CI=95% Confidence Interval 5Daily intake of breakfast (yes, no) 6TV viewing (0-2h/d or lees, > 2h/d) 7Parents obesity: At least one of parents is obese (yes, no) 8Daily physical activity (yes, no) 9Pocket money: the amount of Dh (Dirham Emirate) that each student brings daily and buy foods from the school canteen, 1$= 3.678 Dh (0-3 Dh/d, >3 Dh/d)
  • 9. Emir. J. Agric. Sci. 2005. 17 (1): 43-56 http://www.cfa.uaeu.ac.ae/Research/EJAS.htm ٥١ Discussion Overweight and obesity are considered as an 'epidemic' in many countries in the World, including developed and developing countries. Prevalence of obesity and overweight varies greatly with age groups, gender and socioeconomic status. It has been shown that the epidemiological transition seen in the developing countries as a result of urbanization, migration, new eating habits, and recent affluence are considered as some of the factors involved in the development of obesity and overweight. In the present study, the prevalence of the risk of overweight and overweight was found to be 11.1% and 15.8%, respectively among female primary school children. The prevalence of overweight reported in our study seemed to be higher than that reported by Al Haddad et al. (2000) and Badrinath et al. (2000) in the UAE and in Al Ain respectively. In the first study, Al Haddad et al. (2000) reported a prevalence of 8 % of obesity among UAE school children (boys and girls). Badrinath et al. (2000) found that 10.4% of children (boys and girls) aged between 2 and 15 years were classified as obese. Other recent studies in the Arabian Gulf countries reported a high prevalence of overweight and obesity. In Saudi Arabia, El Hazmi and Warsy (2002) noted that the overall prevalence of overweight and obesity among girls aged between 1-18 years was 12.7% and 6.7%, respectively. They noted a high variability in the prevalence between provinces and age groups. Eastern province and the age group (6-9 years) had the highest prevalence of overweight and obesity. Paediatric overweight is caused by a complex interplay of both genetic and environmental factors. The extent to which these factors contribute to overweight within a population has not been established and it is likely that the identity and relative contribution of risk factors differ among individuals. Socioeconomic status (SES) is a useful indicator of a constellation of environmental and familial influences potentially related to overweight. There is a controversial relationship between social factors and overweight in the literature. Whereas among adults an inverse relationship between SES and overweight is found frequently, studies of children find a weaker and less consistent relationship (Melnik et al., 1998). A number of studies have shown an inverse relationship between the level of parental education and overweight in children (Garn et al., 1975; Kemper et al., 1999). We have used parental education and occupation as a measure of SES. Our results suggest that there is no relationship between SES and prevalence of obesity among female school children in Al Ain. In contrast to this finding recent studies suggest that low SES may be a risk factor for obesity among children as young as preschool age (Gerald et al., 1994; Sherman et al., 1995; Spiegelaere et al., 1998). The discrepancy between our study and other studies may be due to the fact that Al Ain city is a part of the rich oil producing country, where nationals enjoy a high per capita yearly income irrespective of education and occupation, as a result, SES groups are not distinctly defined. Dietary habits are among the factors that are associated with overweight and obesity among both children and adults. In this study, we considered few dietary factors (breakfast intake, number of meals, and food consumption patterns) and these mostly concentrated on qualitative rather than quantitative indicators. We found that the prevalence of girls who skipped breakfast increased with age, and girls who took breakfast had less prevalence of obesity compared to those who skipped breakfast, and the difference was statistically significant. Links between eating pattern and overweight have also
  • 10. Abdelhamid Kerkadi et al. ٥٢ been reported. Reported associations of food groups with childhood overweight include: low intake of fruit and vegetables (Moore et al., 1995), high intake of fast foods and sweets (Muller et al., 1999; Robinson, 1999), and high intake of sugar-sweetened beverages such as soft drinks (Ludwig et al., 2001). It is estimated that only 30% of US children meet the goals set by the food guide pyramid for daily intake of grains, meats, fruits and vegetables. The same pattern was observed in our study. We found that 26% and 60% of children daily consumed soft drinks and chips respectively, while the consumption of fruits and vegetables (leafy vegetables) was 32% and 28% respectively. We did not find a significant association between daily consumption of different foods and overweight. We noted low prevalence of daily consumption of milk whether it is full or low fat milk. Several studies suggest that consumption of excessive soft drink or other sweetened beverages is related to pediatric overweight (Troiano et al., 2000; Ludwig et al., 2001; Matheson et al., 2004). It has been shown that for each additional serving of a sugar-sweetened beverage consumed daily over a 1 1/2 year period among school-aged children, the risk of becoming overweight increased 60% after controlling for other confounding variables (Ludwig et al., 2001). The multiple logistic regression analysis showed that breakfast intake, TV viewing, physical activity and parents obesity were significant associated factors with overweight after adjusting for age. Parents obesity is one of the most important risk factor for childhood obesity (Serdula et al., 1993; Lake et al., 1997; Whitaker et al., 1997; Guo and Chumlea, 1999). Whitaker et al. (1997) found that among young children (under 3 years of age) the strongest predictor of adulthood obesity was parental obesity status. The risk of becoming an obese adult increased 3-fold if one parent was obese and 13-fold if both parents were obese. In addition to confirming this relationship, Lake et al. (1997) also reported a stronger pattern of overweight tracking from childhood to adulthood among subjects with two obese parents. In agreement with these studies, the present study showed that overweight was significantly associated with parents' obesity. Using logistic regression analysis, Moussa et al. (1994) reported an association between obesity and family history of obesity among school children in Al Ain. Among environmental factors, physical activity, TV and media and dietary factors are the most important risk factors for overweight and obesity. Several studies suggest that sedentary behavior is common in a relevant portion of children today and it has been identified as a significant predictor of weight gain later in life. Low levels of physical activity have been related to increased childhood overweight (Moore et al., 1995; Takahashi et al., 1999; Garaulet et al., 2000; Crespo et al., 2001). In the longitudinal Framingham Children's Study, preschool children with low levels of physical activity gained substantially more subcutaneous fat than did more active children (Takahashi et al., 1999). Our results show that inactive girls were more likely to be obese compared to active girls. It is noted that in many schools, physical activity was cancelled from the curriculum. Low physical activity levels have been associated directly with TV viewing and inversely with time spent outdoors (Gortmaker et al., 1996). Television viewing has become a common activity among children in many countries and more than ninety percent of children live in a home with at least one TV set. We found that more than 90% of children spent at least 2h/d watching TV. Time spent viewing TV has consistently been shown to be associated with overweight status (Gortmaker et al., 1996; Takahashi et al., 1999; Hanley et al., 2000).
  • 11. Emir. J. Agric. Sci. 2005. 17 (1): 43-56 http://www.cfa.uaeu.ac.ae/Research/EJAS.htm ٥٣ Gortmaker et al. (1996) reported that children who watched TV for more than 5 h/d have a nearly 5-fold increased risk of overweight compared with those who watched 0-2h. Our results showed a higher risk for overweight among children who watched TV for more than 2h/d. Researchers have suggested two mechanisms by which television viewing contributes to overweight. These mechanisms are reduced energy expenditure from reduction in physical activity and /or increased dietary intake, either during viewing or as a result of food advertising (Maffeis et al., 1997; Crespo et al., 2001). We also found that 48.1 % of children ate while watching TV, the most consumed products during watching TV were candies, chips, and chocolates which are rich source of energy. In conclusion, the present study documented a high prevalence of risk of overweight and overweight among female school children in Al-Ain. Studying overweight in childhood is important since identification of children who may become obese adults can facilitate early intervention and avoidance of the morbidity and mortality associated with adult obesity. For that, a multisectorial intervention should be established which considers the dietary intervention to modify food habits, education through mass media and encouraging habitual physical activity among primary school children in Al Ain city. Acknowledgement This research was supported by the Research Affairs of the UAE University under contract Nº 01-04-6-11/03. Authors would like to thank the UAE Ministry of Health and the UAE Ministry of Education for facilitating access to schools. Grateful acknowledgement is also due for senior and graduate students who participated in data collection and data entry. References Al-Awadi, F. and E. K. Amine. 1989. Overweight and obesity in Kuwait. J. R. Soc. Health. 109:175-179. Al Haddad, F., Y. Al-Nuaimi, B. B. Little and M. Thabit. 2000. Prevalence of obesity among school children in the United Arab Emirates. Amer. J. Human. Biol. 12:498-502. Al Isa, A. N. 1999. Dietary and socio economic factors associated with obesity among Kuwaiti college men. Br. J. Nutr. 82:369-374. Al- Mahroos, F. J. and K. A. Al-Roomi. 1999. Overweight and obesity in the Arabian Peninsula: an overview. J. R. Soc. Health. 119:251-253. Al-Shammari, S. A., T. A. Khoja and M. Al-Maatouq. 1994. High prevalence of clinical obesity among Saudi females: a prospective cross-sectional study in the Riyadh region. J. Trop. Med. Hyg. 97:183-188. Badrinath, P., Q. A. Al-Shboul, T. Zoubeidi, A. S. Gargoun, R. Gubash and O. E. El-Rufaie. 2000. Measuring the Health of the nation. United Arab Emirates Health and Life style Survey. Coon, K. A., J. Goldberg, B. L. Rogers and K. L. Tucker. 2001. Relationships between use of television during meals and children’s food consumption patterns. Pediatrics 107:167-176. Crespo, C. J., E. Smit, R. P. Troiano, S. J. Bartlett, C. A. Macera and R. E. Anderson. 2001. Television watching, energy intake, and obesity in US children: results from the Third National Health and Nutrition
  • 12. Abdelhamid Kerkadi et al. ٥٤ Examination Survey. Arch. Pediatr. Adolesc. Med. 155:360-365. Dietz, W. H. 1994. Critical periods in childhood for the development of obesity. Amer. J. Clin. Nutr. 59:955- 959. El- Hazmi, M. A. F. and A. S. Warsy. 2002. A comparative study of prevalence of overweight and obesity in children in different provinces of Saudi Arabia. J. Trop. Pediatrics. 48:172-177. El- Mugamer, I. T., A. S. Ali Zayat, M., M. Hossain and B. N. Pugh. 1995. Diabetes, obesity and hypertension in urban and rural people of Bedouin origin in the United Arab Emirates. J. Trop. Med. Hyg. 98:407-415. Flegal, K. M., R. Wei and C. Ogden. 2002. Weight for stature compared with body mass index for age growth charts for the United States from the Centers for Diseases Control and Prevention. Amer. J. Clin. Nutr. 75:761-766. Garaulet, M., A. Martinez., F. Victoria., F. Perez-Liamas., R. M. Ortega and S. Zamora. 2000. Differences in dietary intake and activity level between normal-weight and overweight or obese adolescents. J. Pediatr. Gastroenterol. Nut. 30:253- 258. Garn, S. M., S. M. Bailey, P. E. Cole and I. T. T. Higgins. 1975. Level of education, level of income, and level of fatness in adults. Amer. J. Clin. Nutr. 30:721-727. Gerald, L. B., A. Anderson, G. D. Johnson, C. Hoff and R. F. Trimm. 1994. Social class, social support and obesity risk in children. Child. Care. Health. Dev. 20:145-163. Gortmaker, S. L., A. Must, A. M. Sobol, K. Peterson., G. A. Colditz and W. H. Dietz. 1996. Television viewing as a cause of increasing obesity among children in the United States, 1986- 1990. Arch. Pediatr. Adolesc. Med. 150:356-362. Guo, S. S. and W. C. Chumlea. 1999. Tracking of body mass index in children in relation to overweight in adulthood. Amer. J. Clin. Nutr. 70:145S-148S. Hanley, A. J. G, S. B. Harris, J. Gittelsohn, T. M. Wolever, B. Saksvig and B. Zinman. 2000. Overweight among children and adolescents in Native Canadian community: prevalence and associated factors. Amer. J. Clin. Nutr. 71:693-700. Kemper, H. C. G., G. B. Post, J. W. R. Twisk and W. van Mechelen. 1999. Lifestyle and obesity in adolescence and young adulthood: results from the Amsterdam Growth and Health Longitudinal study (AGAHLS). Int. J. Obes. Relat. Metab. Disord. 23:S34- S40. Kim, S., S. Moon and B. M. Popkin. 2000. The nutrition transition in South Korea. Amer. J. Clin. Nutr. 71:44-53. Klesges, R. C., M. L. Shelton and L. M. Klesges. 1993. Effects of television viewing on metabolic rate: potential implications for childhood obesity. Pediatrics 91:281-286. Lake, J. K., C. Power and T. Cole. 1997. Child to adult body mass index in the 1958 British birth cohort: association with parental obesity. Arch. Dis. Child. 77:376-381. Ludwig, D. S., K. E. Peterson and S. L. Gortmaker. 2001. Relation between consumption of sugar –sweetened
  • 13. Emir. J. Agric. Sci. 2005. 17 (1): 43-56 http://www.cfa.uaeu.ac.ae/Research/EJAS.htm ٥٥ drinks and childhood obesity. Lancet. 357:505-508. Maffeis, C., S. Provera., S. Filippi., G. Sidoti., S. Schena and L. Tato. 2000. Distribution of food intake as a risk factor for childhood obesity. Int. J. Obes. Relat. Metab. Disord. 24:75-80. Maffeis, C., M. Zaffanello and Y. Schutz. 1997. Relationship between physical inactivity and adiposity in prepubertal boys. J. Pediatr. 131:288- 292. Matheson, D. M., J. D. Killen, Y. Wang, A. Varady and T. N. Robinson. 2004. Children’s food consumption during television viewing. Amer. J Clin Nutr. 79:1088 –1094. Mei, Z., L. M. Grummer-Strawn, A. Pietrobelli, A. Goulding, M. I. Goran and W. H. Dietz. 2002. Validity of body mass index compared with other body composition screening indexes for the assessment of body fatness in children and adolescents. Amer. J. Clin. Nutr. 75:978-985. Melnik, T. A., A. C. Rhoades., K. R. Wales., C. Cowell. and W. S. Wolfe. 1998. Overweight school children in New York City: prevalence estimates and characteristics. Int. J. Obesity. 22:7-13. Moore, L. L., U. S. D. T. Nguyen., K. J. Rothman., L. A. Cupples and R. C. Ellisun. 1995. Preschool physical activity level and change in body fatness in young children. Amer. J. Epidemiol. 142:982-988. Moussa, M. A. A., M. B. Skaik, S. B. Selwanes, O. Y. Yaghy and S. A. Bin-Othman. 1994. Factors associated with obesity in school children. Int. J. Obesity. 18:513-515. Muller, M. J., I. Koertringer, M. Mast, K. Languix and A. Frunch. 1999. Physical activity and diet in 5 to 7 year old children. Public. Health. Nutr. 2:443- 444. Nguyen, V. T., D. E. Larson, R. K. Johnson and M. I. Goran. 1996. Fat intake and adiposity in children of lean and obese parents. Amer. J. Clin. Nutr. 63:507-513. Obarzanek, E., G. Schreiber G., P. Crawford, S. Goldman, P. Barrier and M. Frederick. 1994. Energy intake and physical activity in relation to indexes of body fat: the National Heart, Lung, and Blood Institute Growth and Health Study. Amer. J. Clin. Nutr. 60:15-22. Popkin, B. M. 2001. The nutrition transition and obesity in the developing world. J. Nutr. 131:871S-873S. Power, C., J. K. Lake and T. J. Cole. 1997. Measurement and long term health risks of child and adolescent fatness. Int. J. Obes. Relat. Metab. Disord. 21:507-526. Robinson, T. N. 1999. Reducing children's television viewing to prevent obesity: a randomized controlled trial. JAMERA. 282:1561-1567. Rolland-Cachera, M. F., M. Deheeger and M. Guilloud-Bataille. 1987. Tracking the development of adiposity from one month of age to adulthood. Ann. For Annals Human. Biol. 14: 219-229. Schonfeld-Warden, N. and C. H. Waeden. 1997. Pediatric obesity: an overview of etiology and treatment. Pediatr. Clin. North. Amer. 44:339-361. Serdula, M. K., D. Ivery, R. J. Coates, D. S. Freedman, D. F. Williamson and T. Byers. 1993. Do obese children become obese adults?. Prev. Med. 22:167-177.
  • 14. Abdelhamid Kerkadi et al. ٥٦ Sherman, G. B., Y. Liao, M. Alexander, M. Kim and B. D. Kim. 1995. Family factors related to obesity in Mexican –American and Anglo preschool children. Family. Comm. Health. 22:29-36. Spiegelaere, M. D., M. Dramaix and P. Hennart. 1998. Socioeconomic status and changes in body mass from 3 to 5 years. Arch. Dis. Child. 78:477-478. Takahashi, E., K. Yoshido H. and H. Sugimori. 1999. Influence factors on the development of obesity in 3-year-old children based on the Toyama study. Prev. Med. 28:293-296. Troiano, R. P., R. R. Briefel, M. D. Carroll and K. Bialostosky. 2000. Energy and fat intakes of children and adolescents in the United States: data from the National Health and Nutrition Examination Survey. Amer. J. Clin. Nutr. 72:1343S-1353S. Wang, Y., K. Ge and B. M. Popkin. 2000. Tracking of body mass index from childhood to adolescence: a 6-y follow-up study in China. Amer. J. Clin. Nutr. 72:1018-1024. Whitaker, R. C., J. A. Wright, M. S. Pepe., K. D. Seidel and W. H. Dietz. 1997. Predicting obesity in young adulthood from childhood and parental obesity. N. Eng. J. Med. 337:869-873. Wolf, A. M., S. L. Gortmaker, L. Cheung, H. M. Gray, D. B. Herzog and G. A. Colditz. 1993. Activity, inactivity and obesity: racial, ethnic and age differences among schoolgirls. Amer. J. Public. Health. 83:1625-1627.