Download to read offline
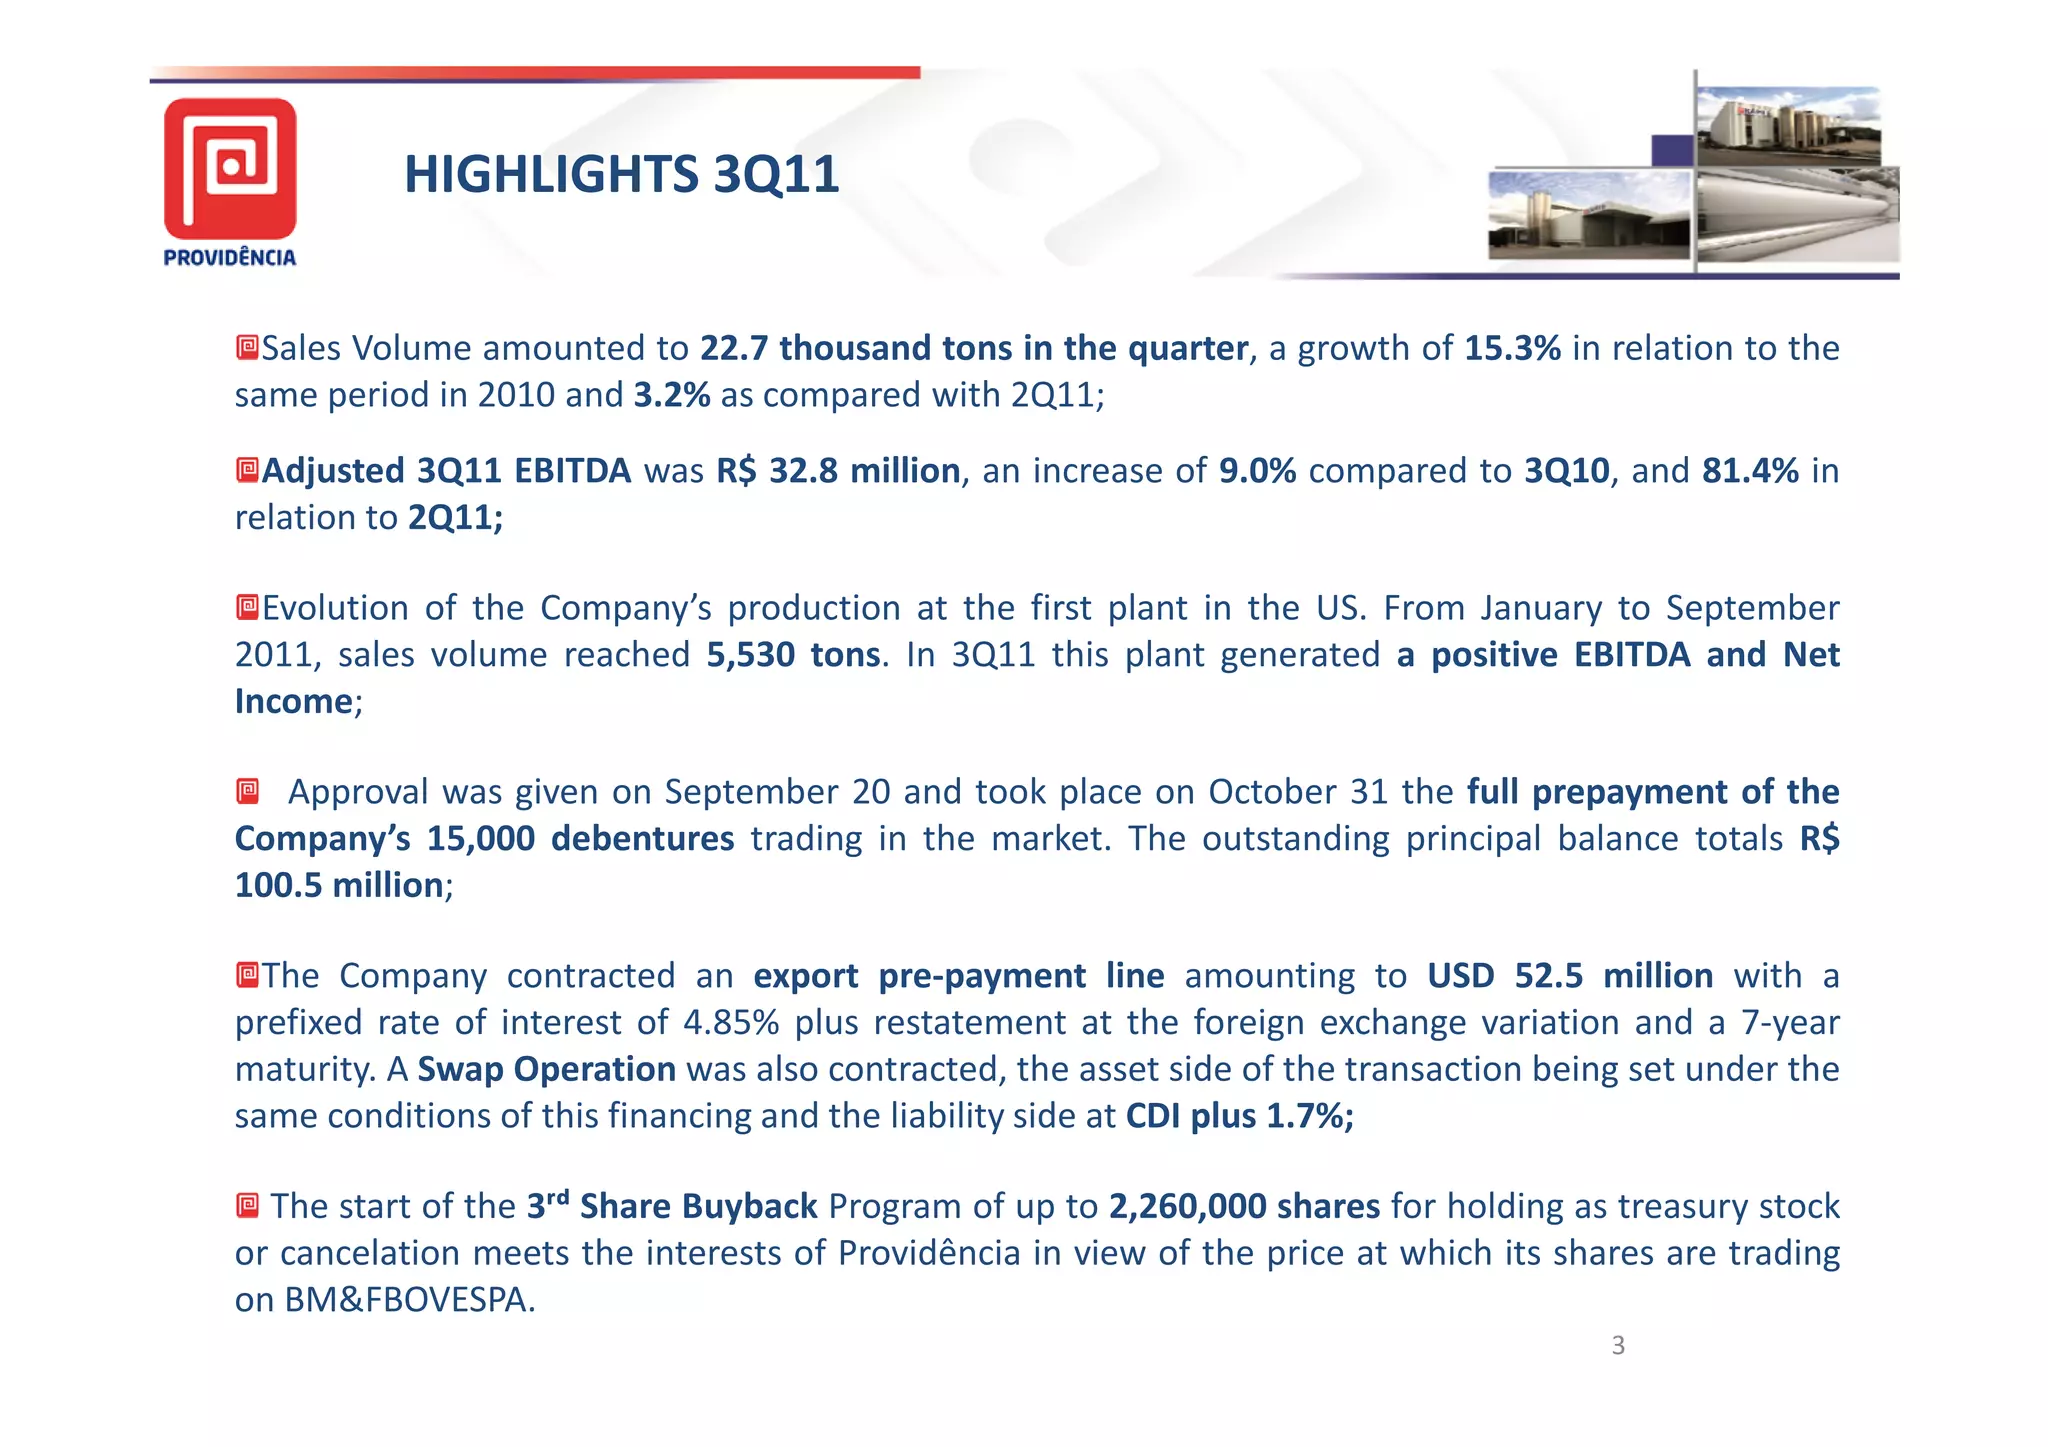
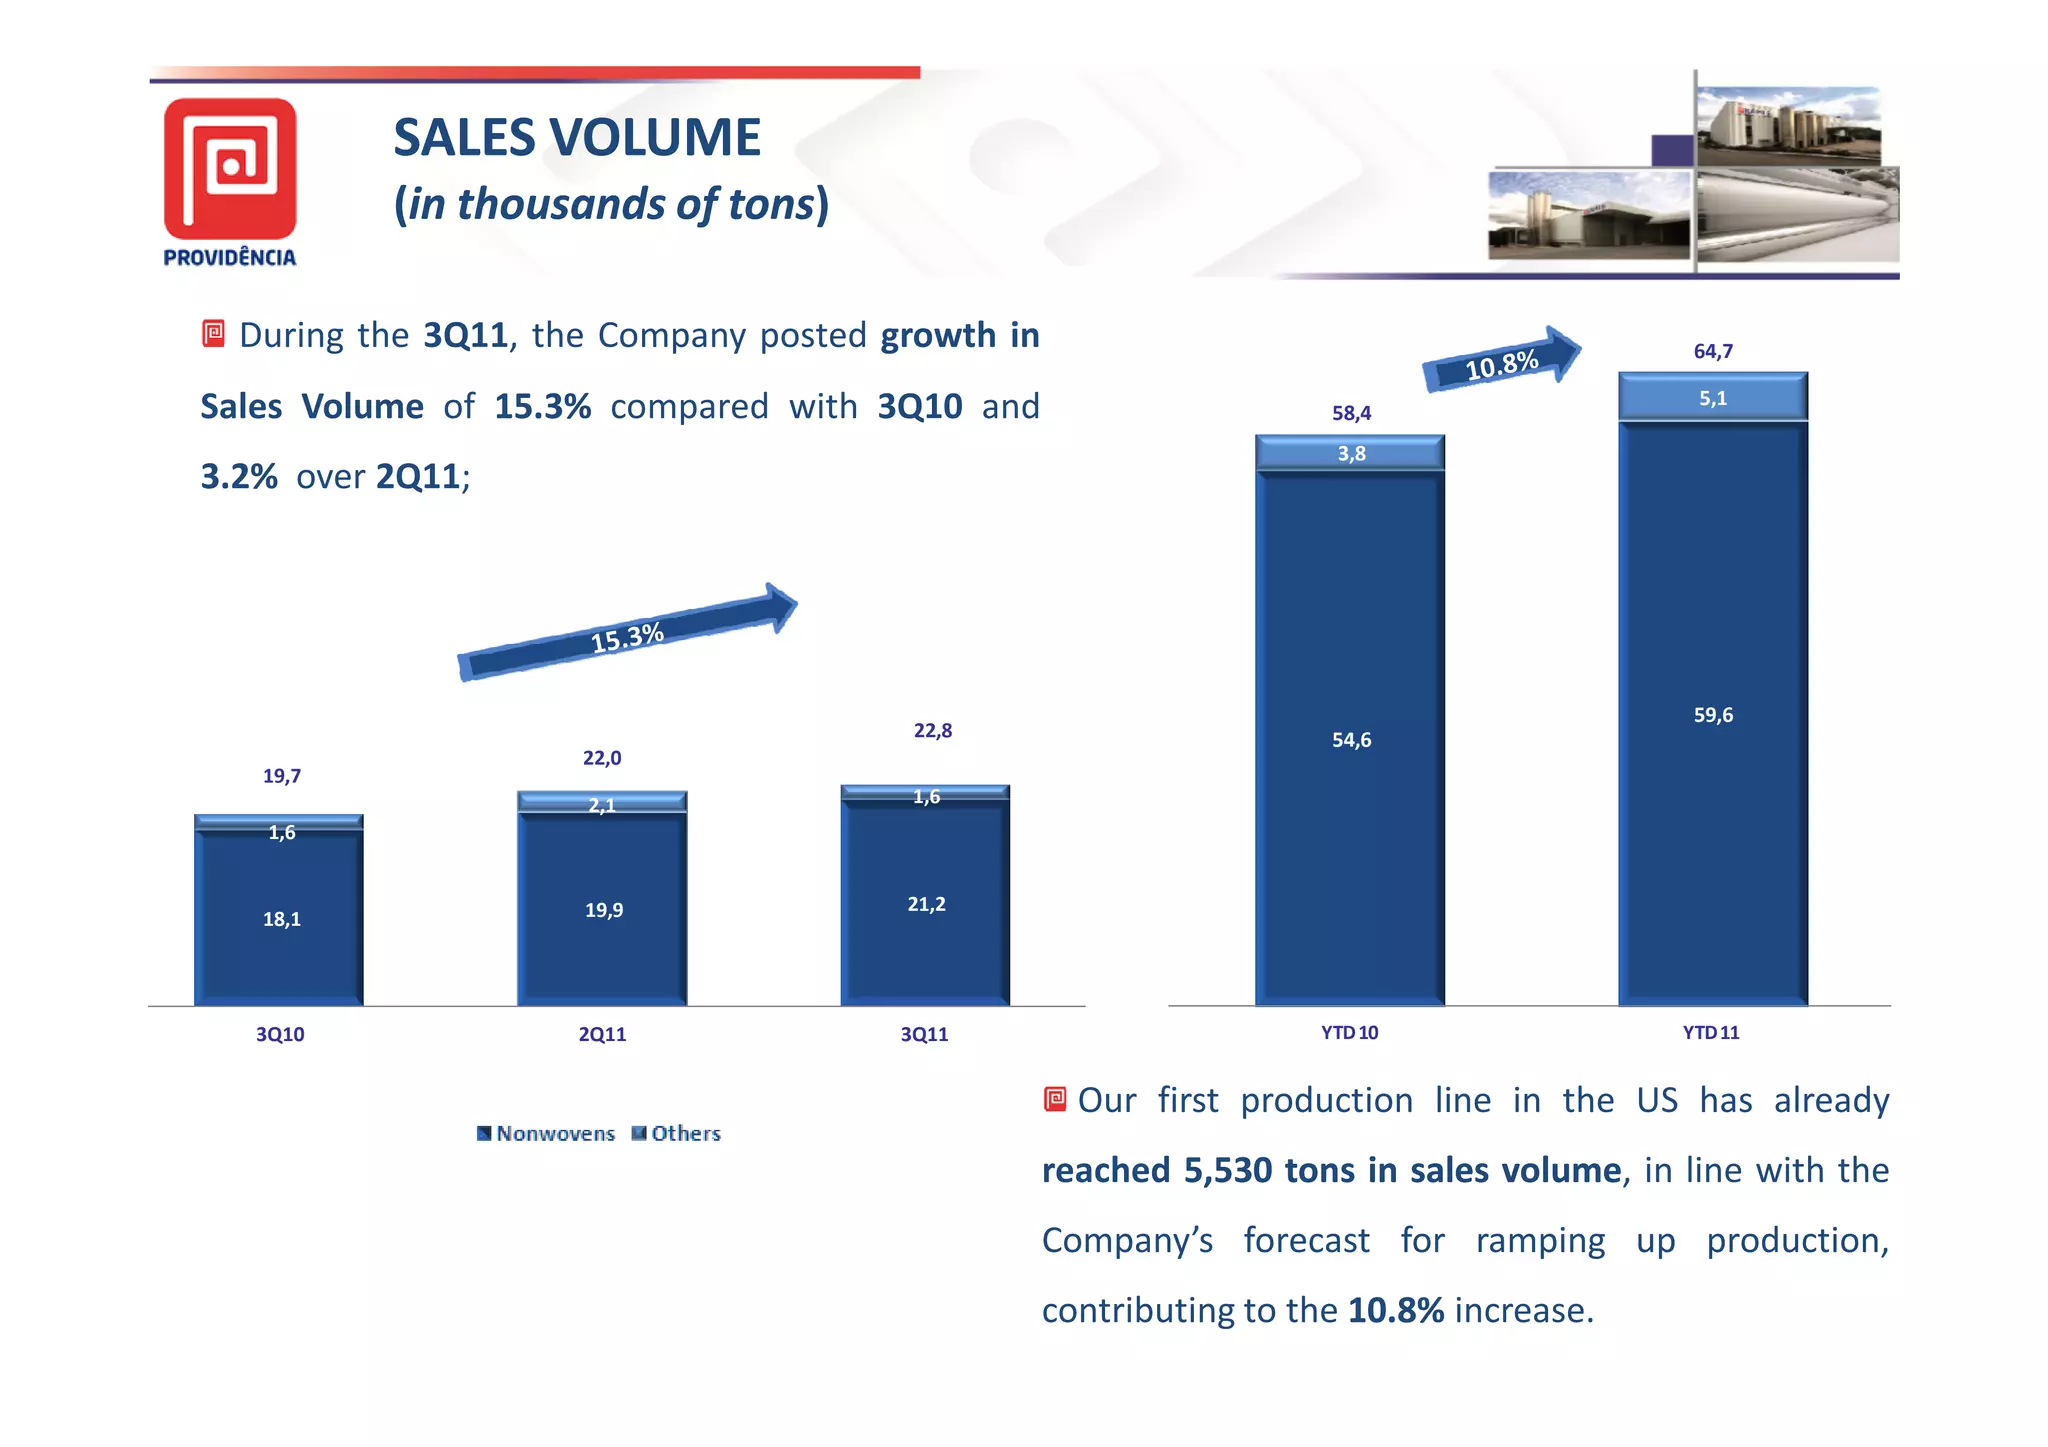
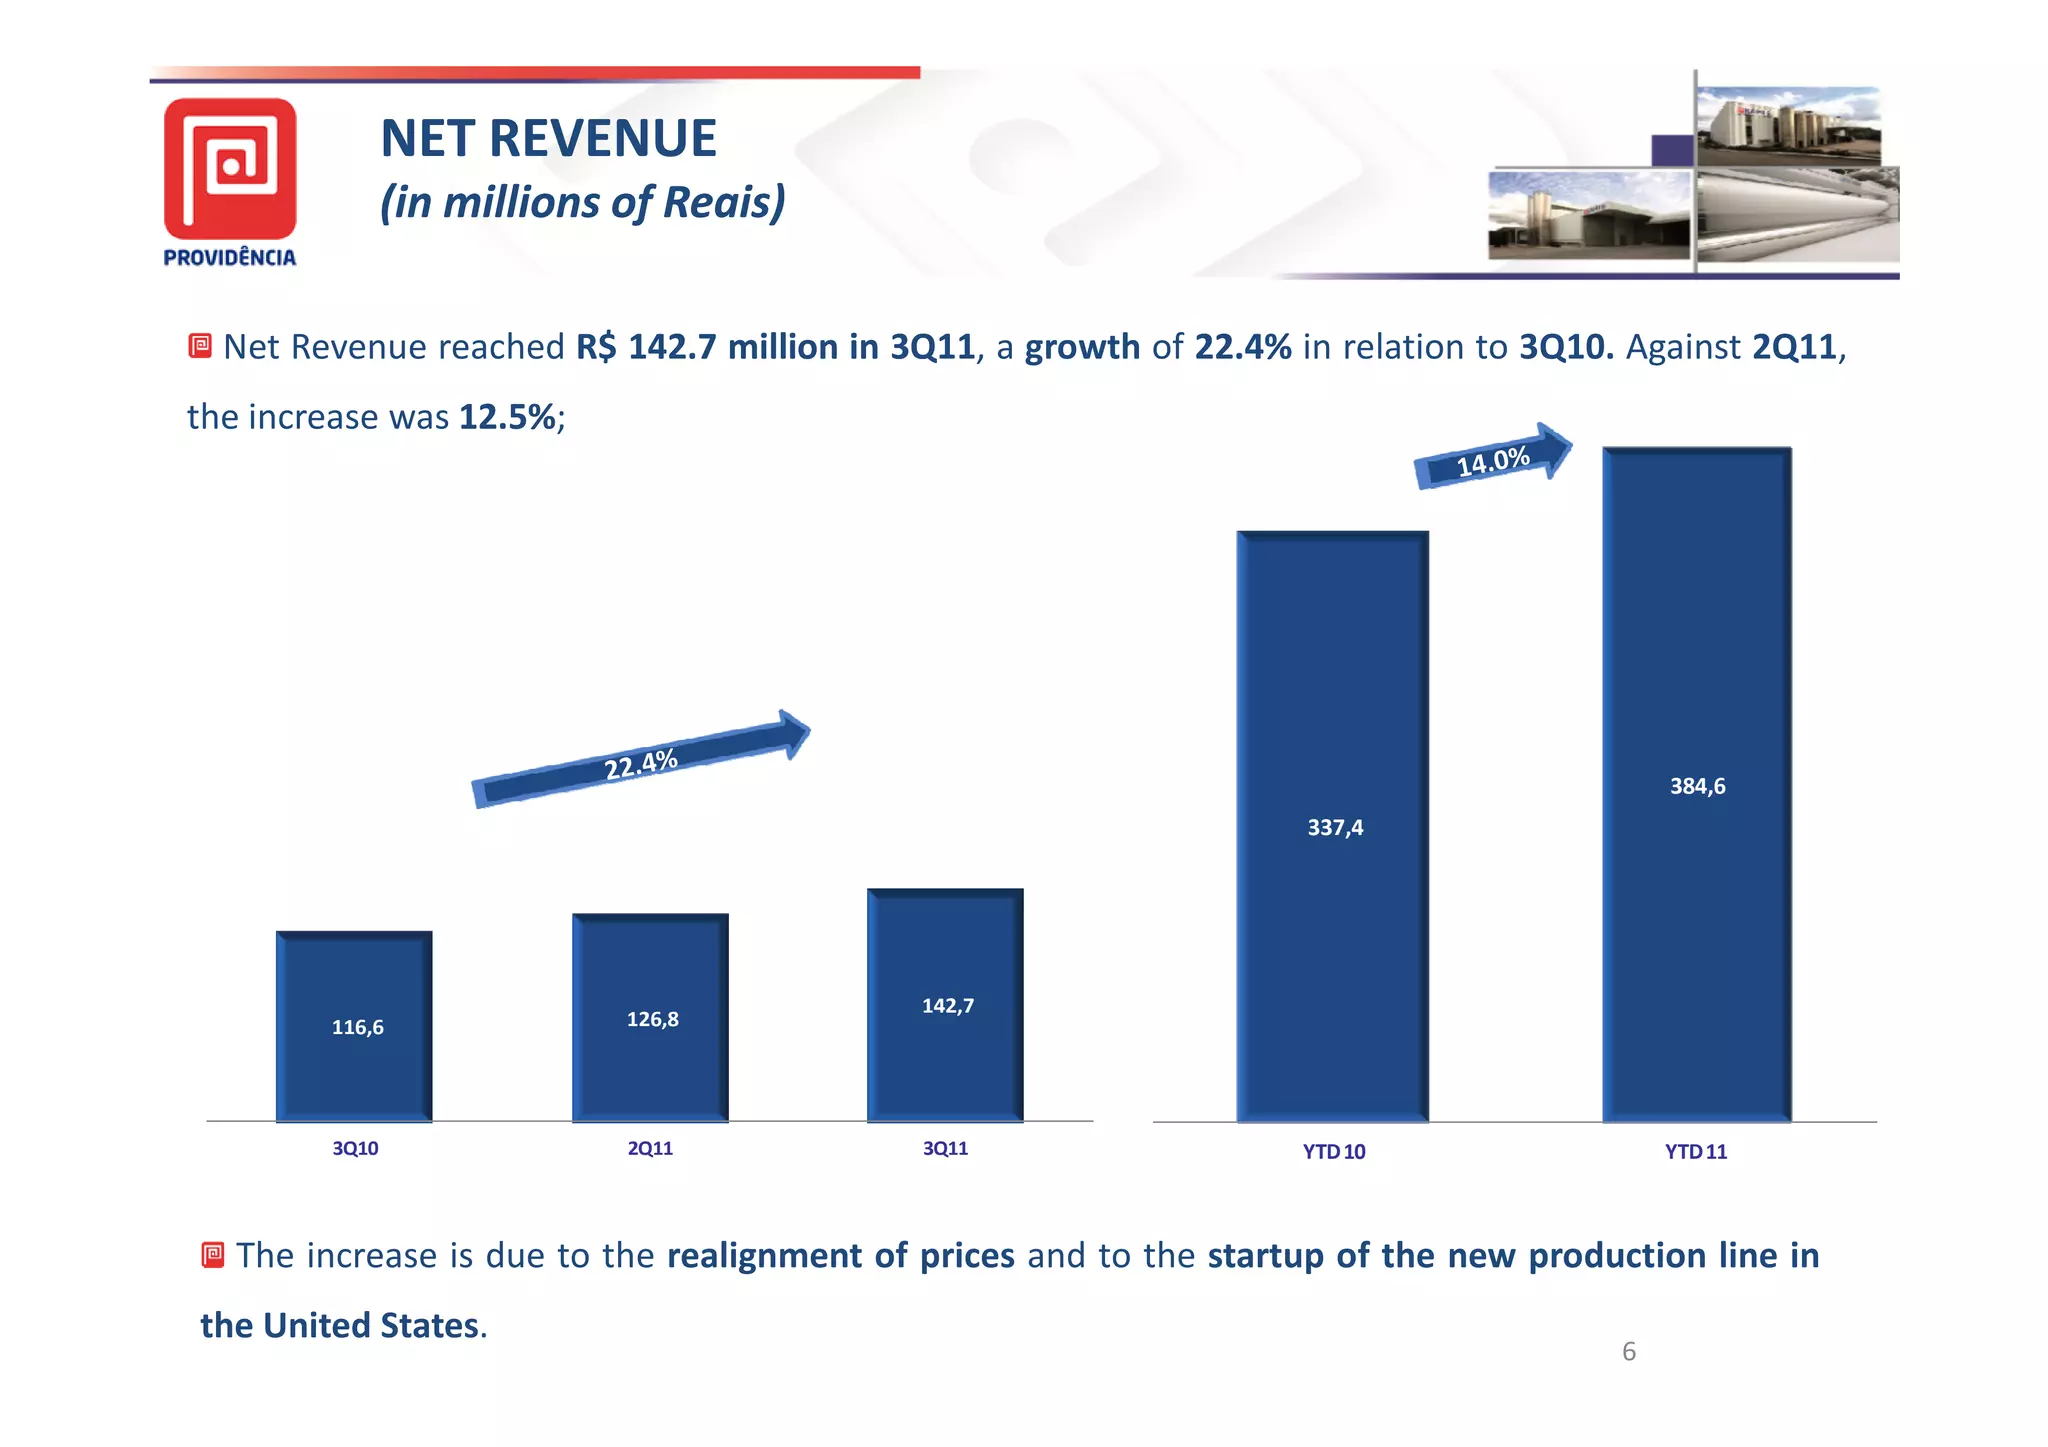
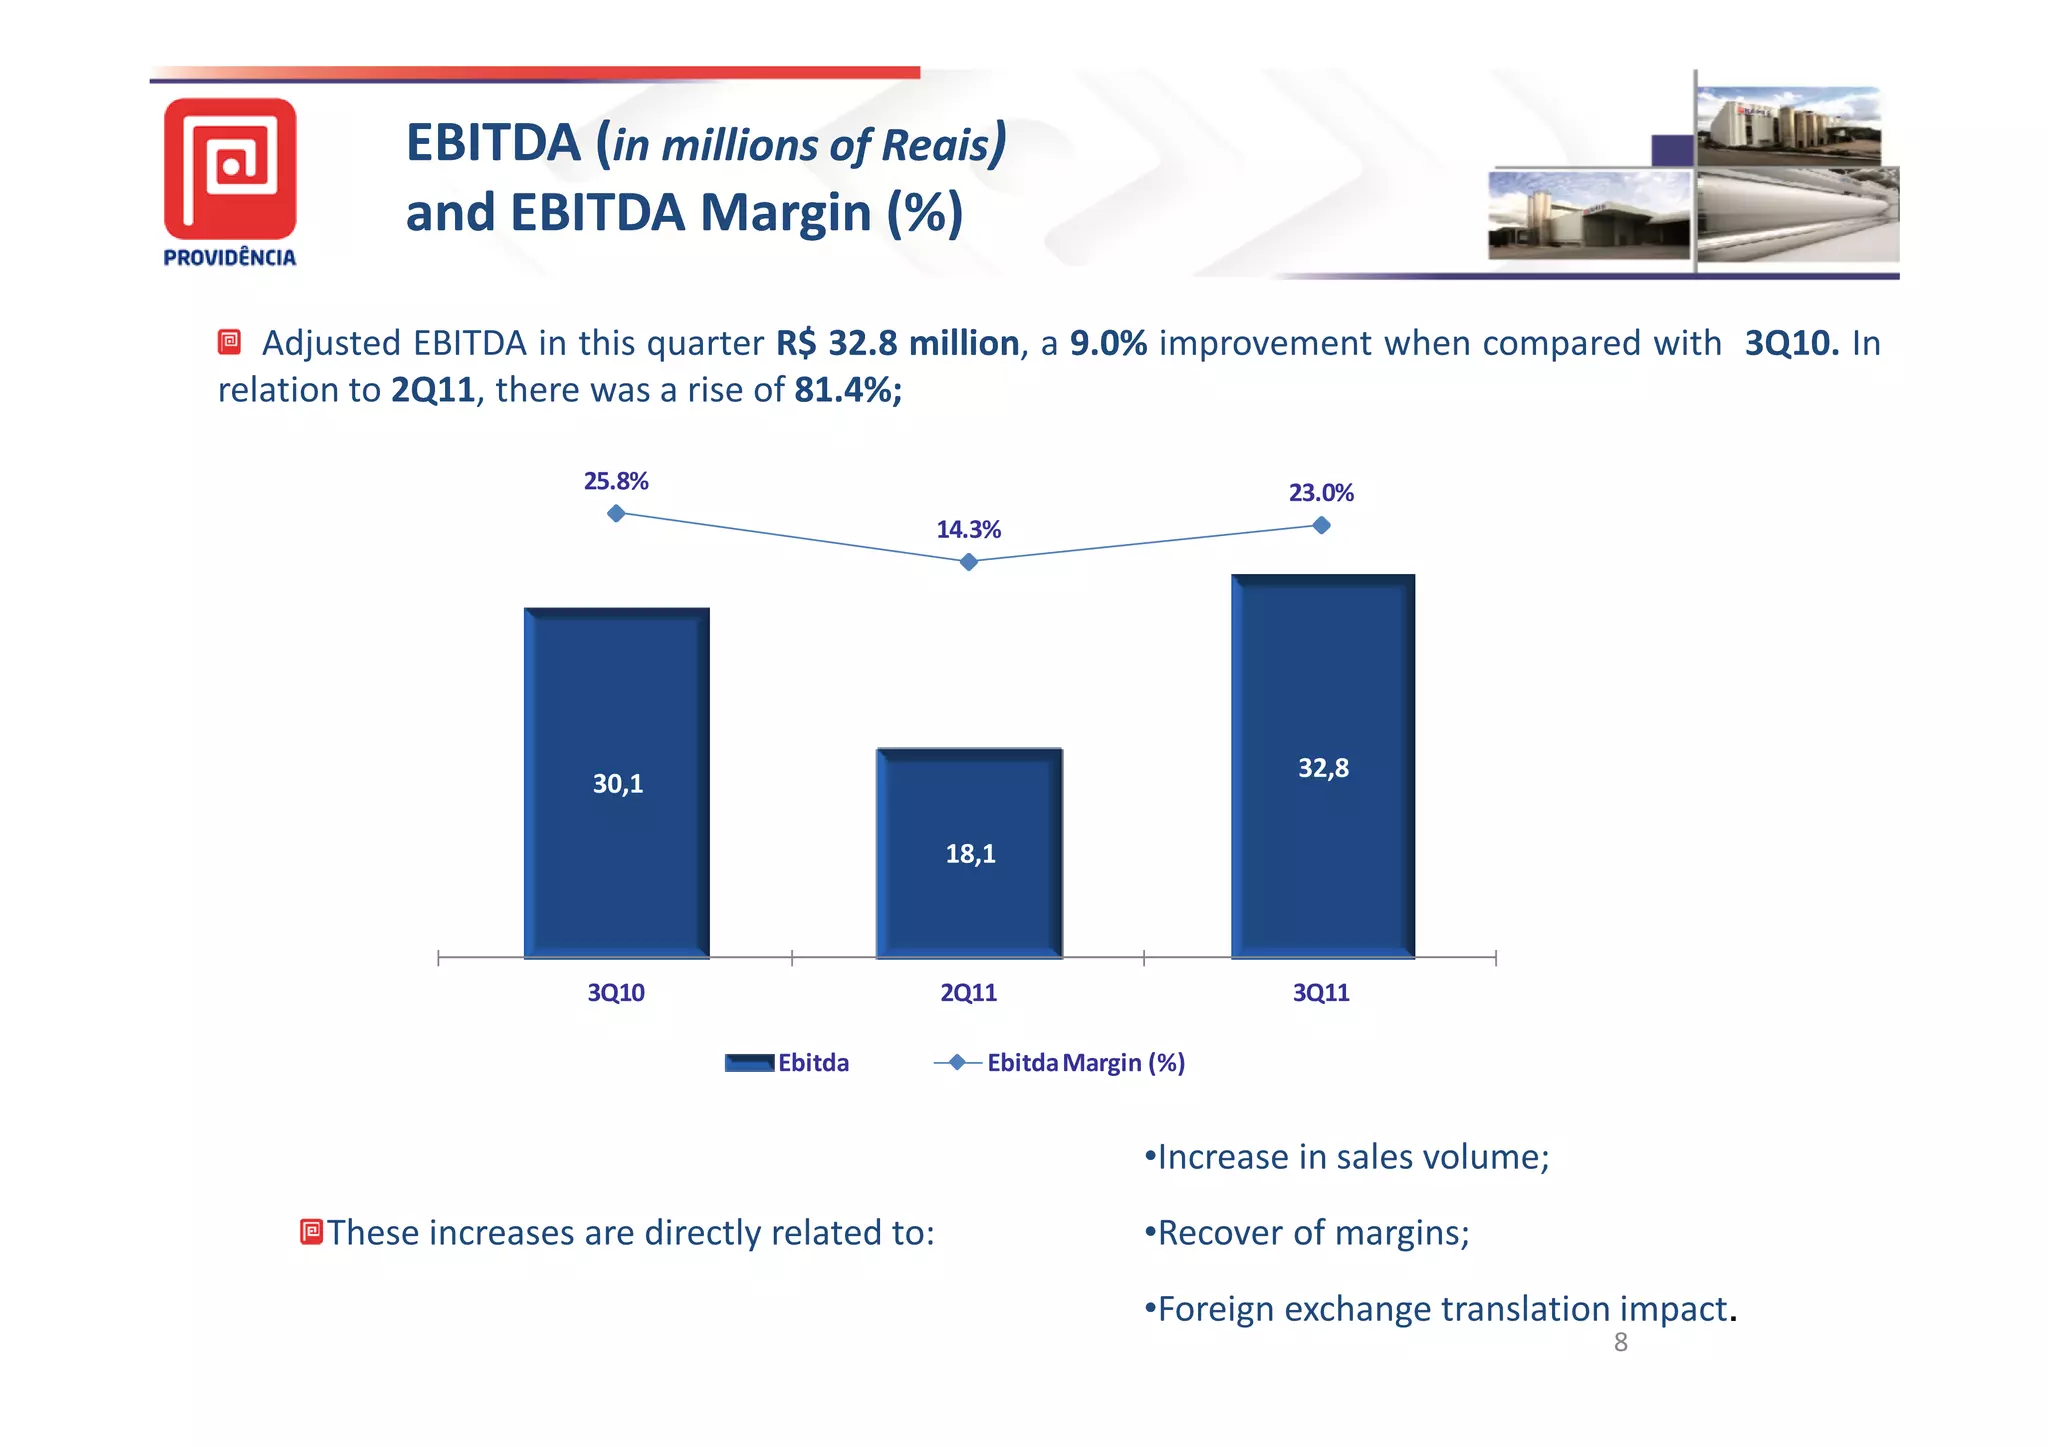

- Sales volume grew 15.3% YoY and 3.2% QoQ to 22.7 thousand tons in 3Q11. The company's US production plant generated positive EBITDA and net income. - Net revenue increased 22.4% YoY and 12.5% QoQ to R$142.7 million in 3Q11 due to price realignments and the new US production line. - Adjusted EBITDA rose 9.0% YoY and 81.4% QoQ to R$32.8 million in 3Q11, driven by higher sales volume, margin recovery, and foreign exchange impacts.


