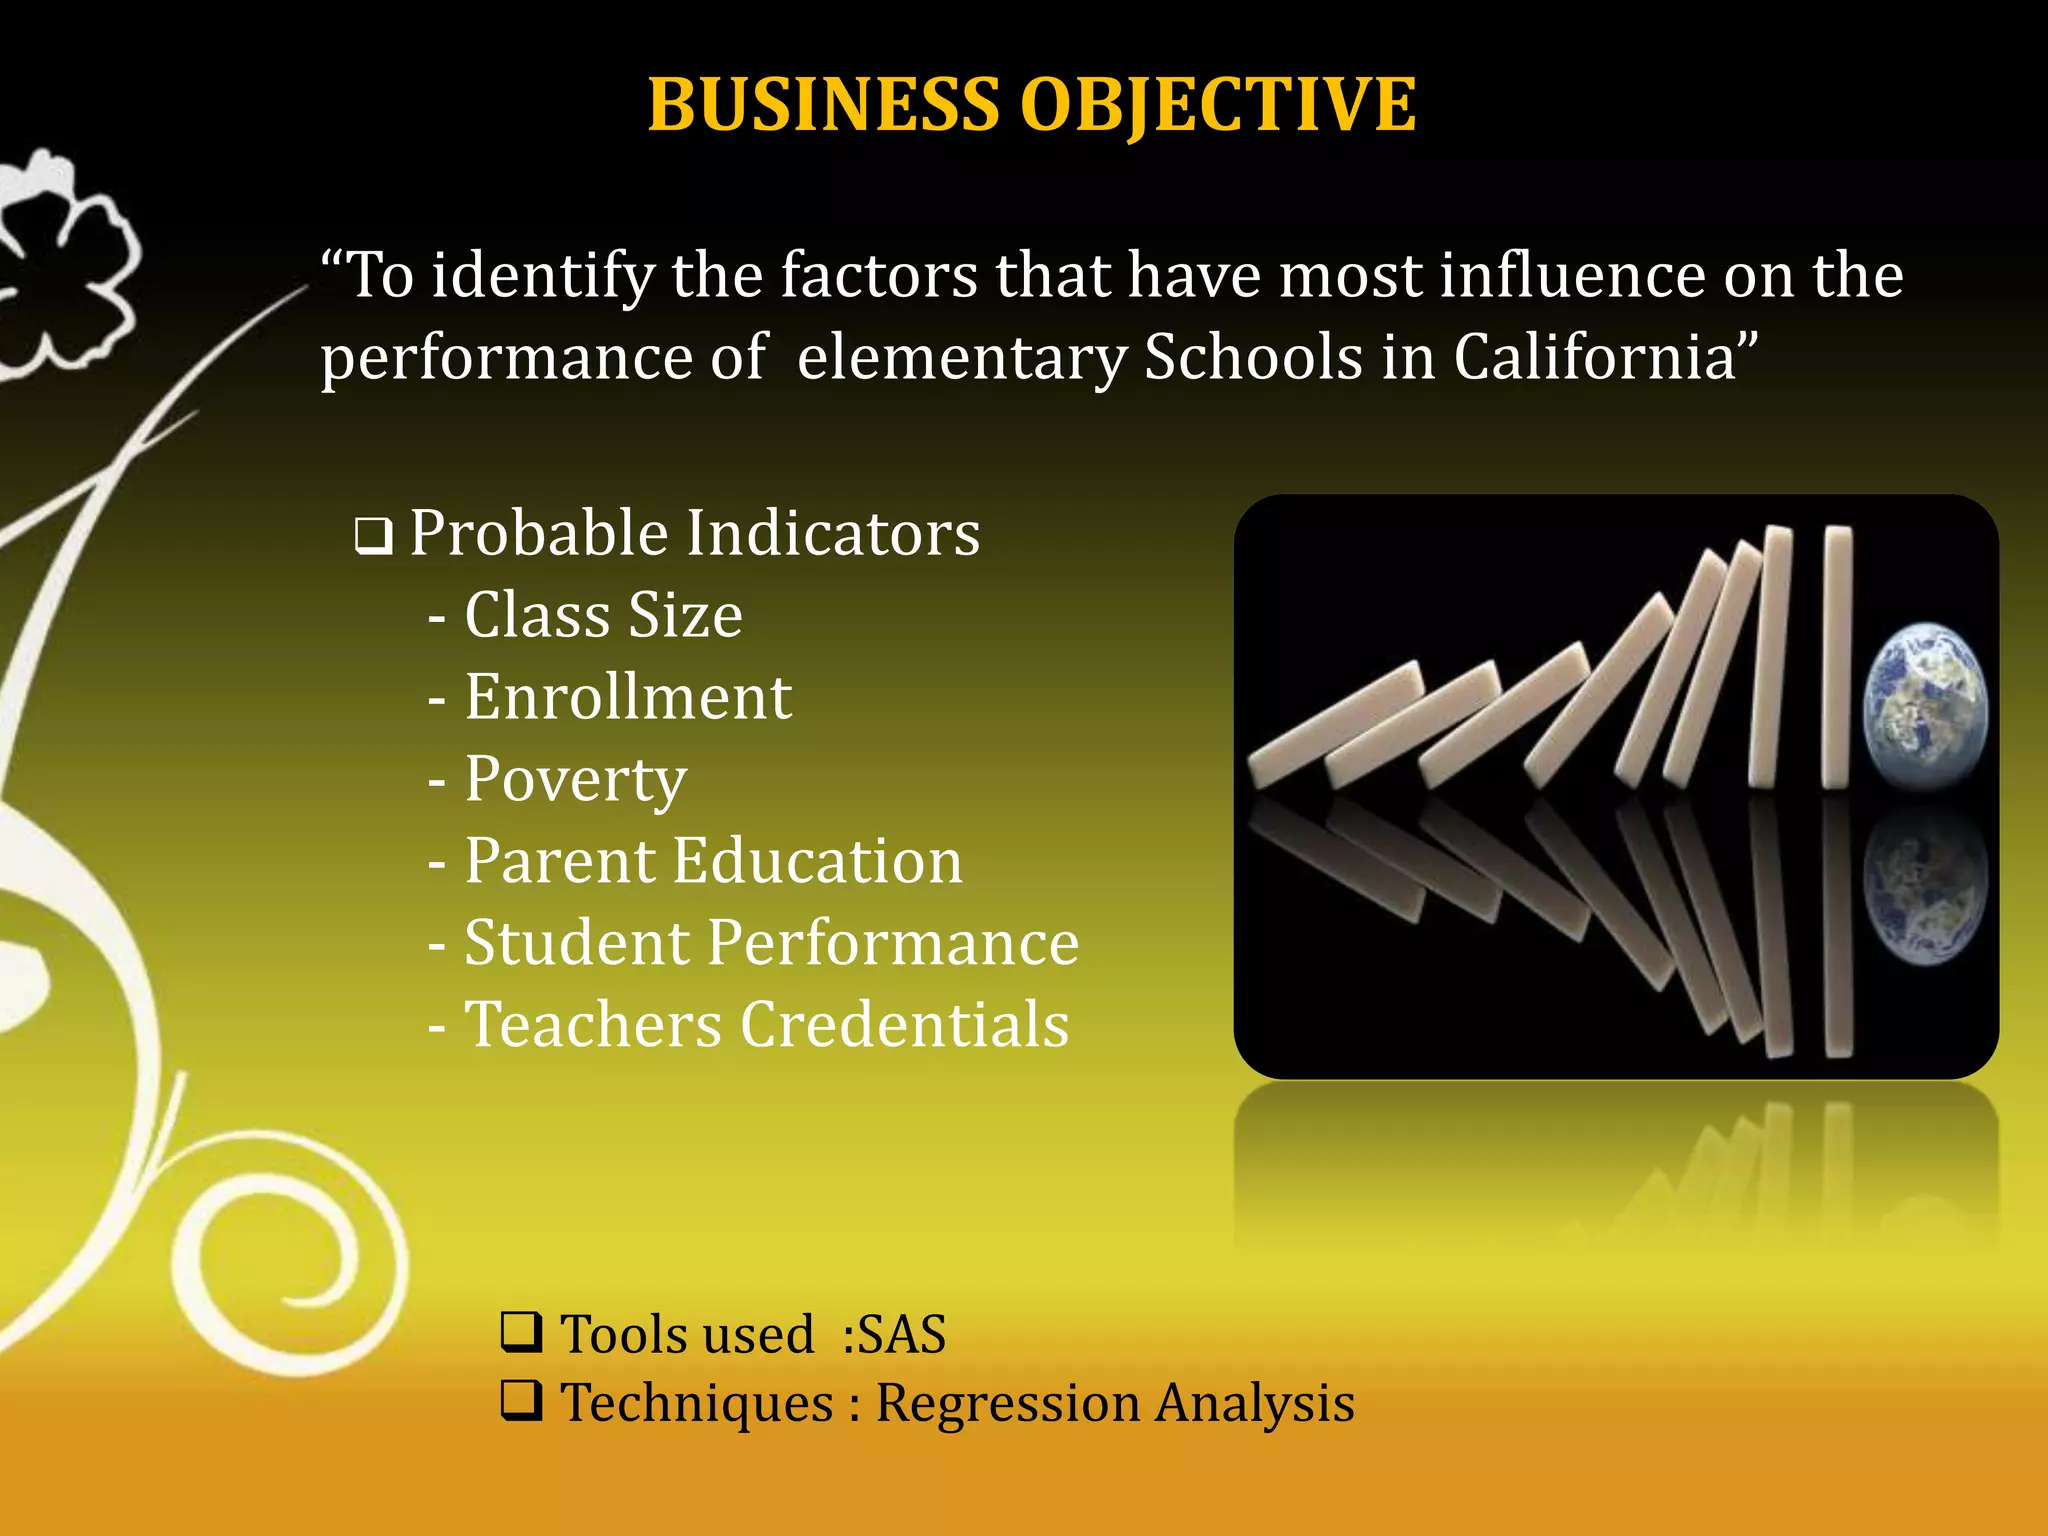
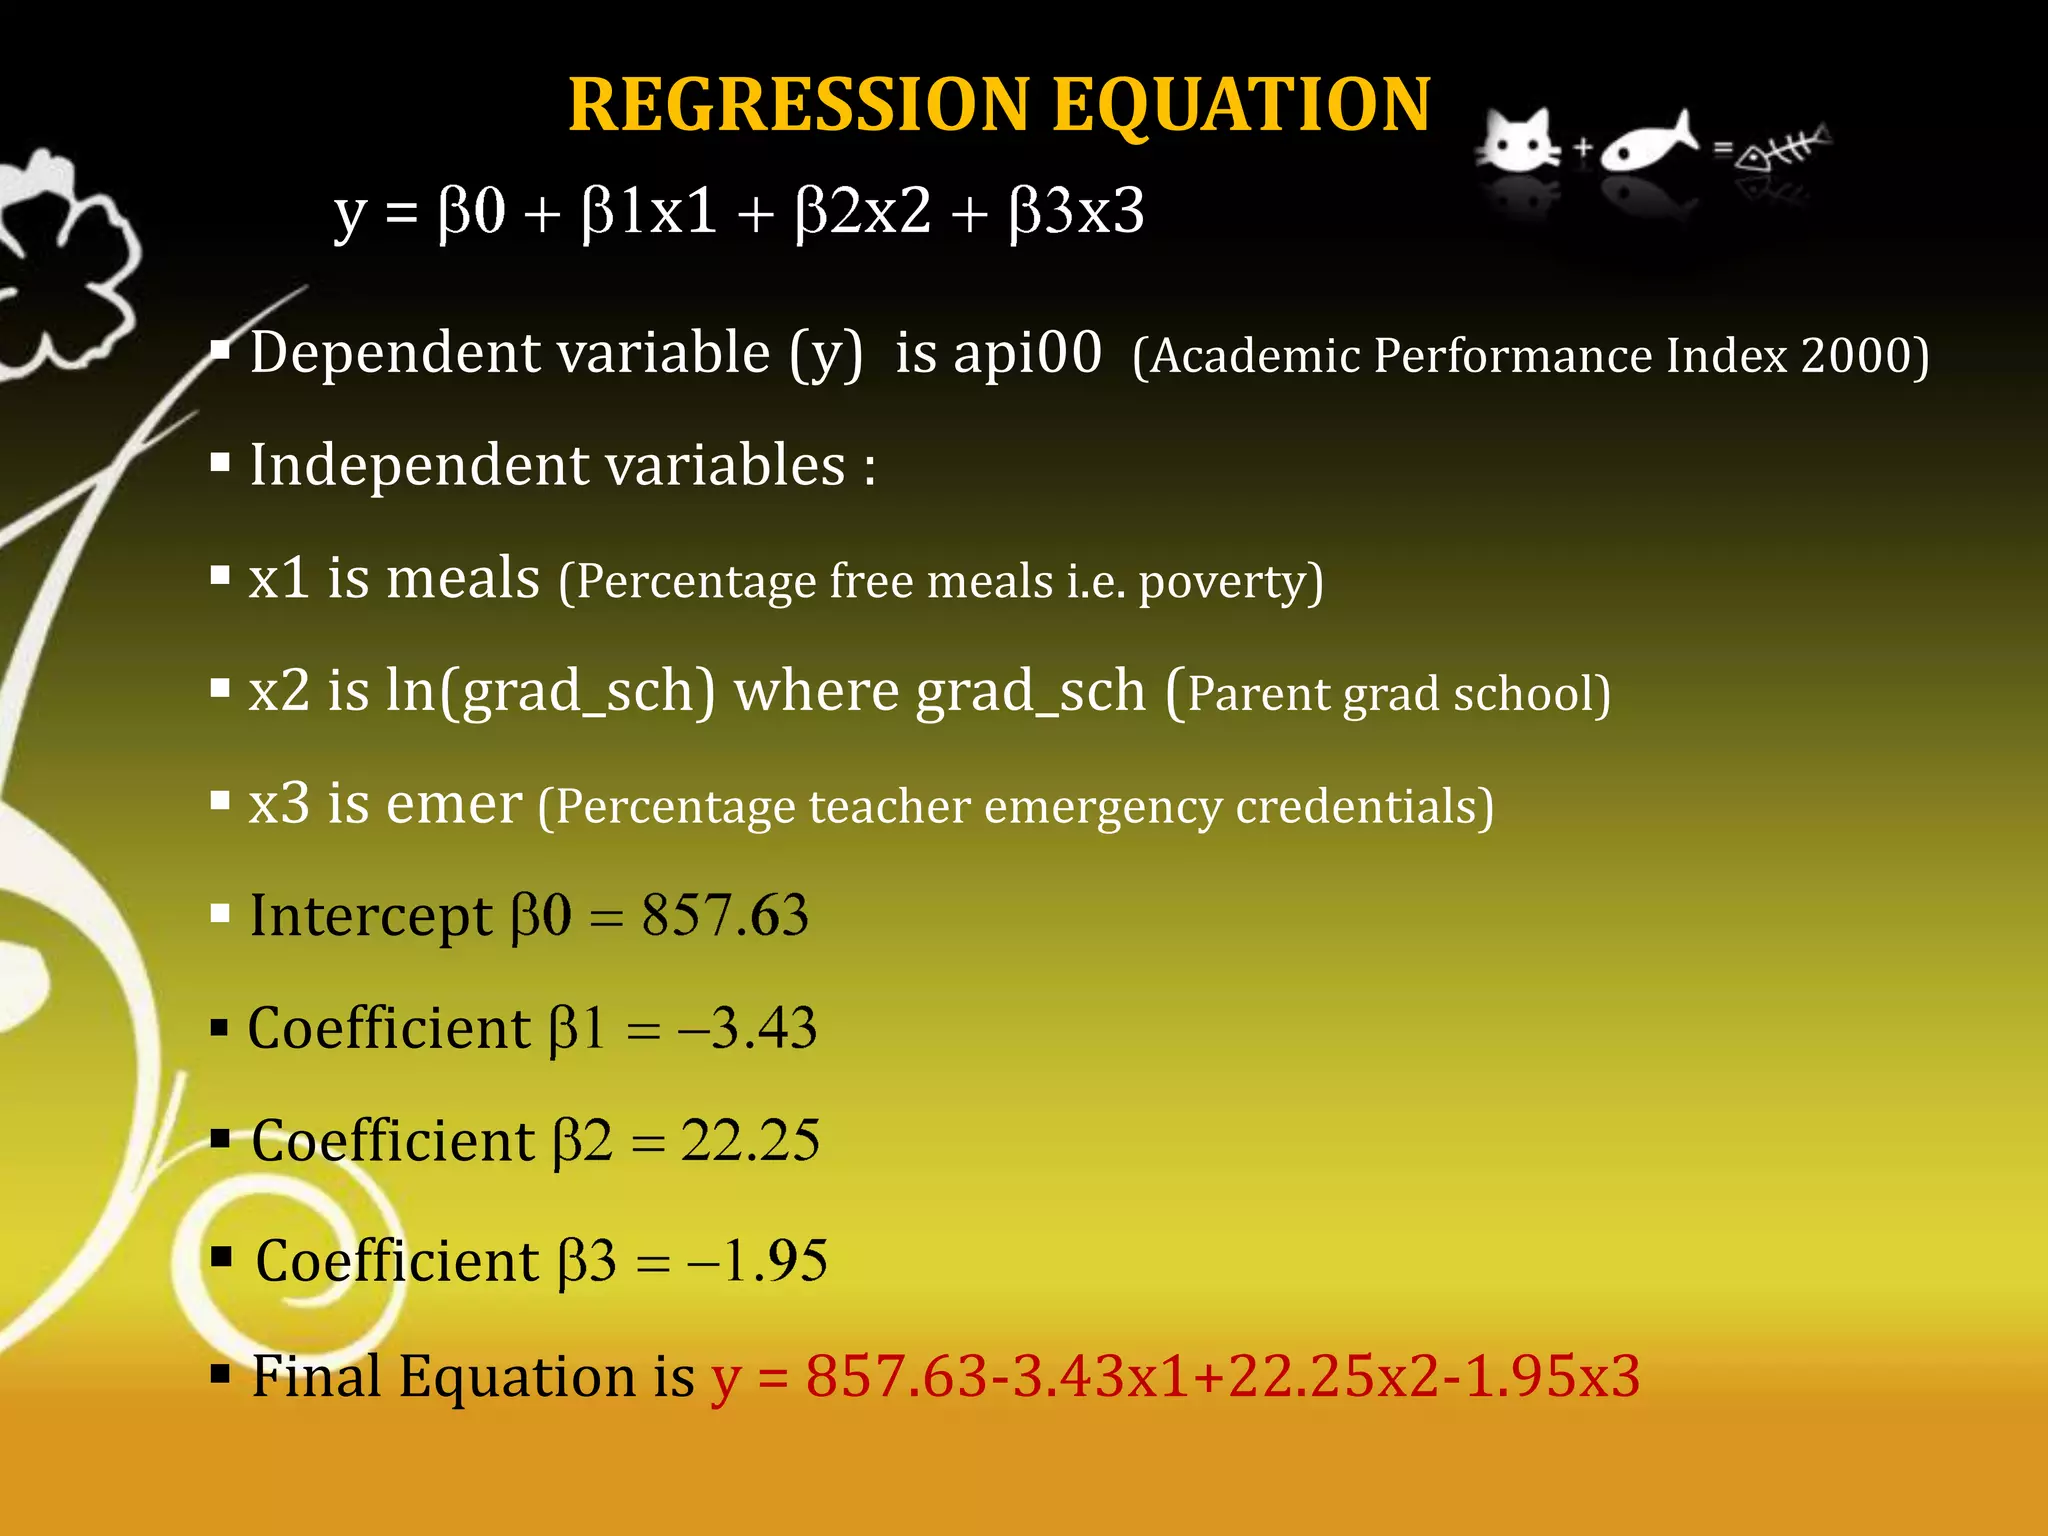
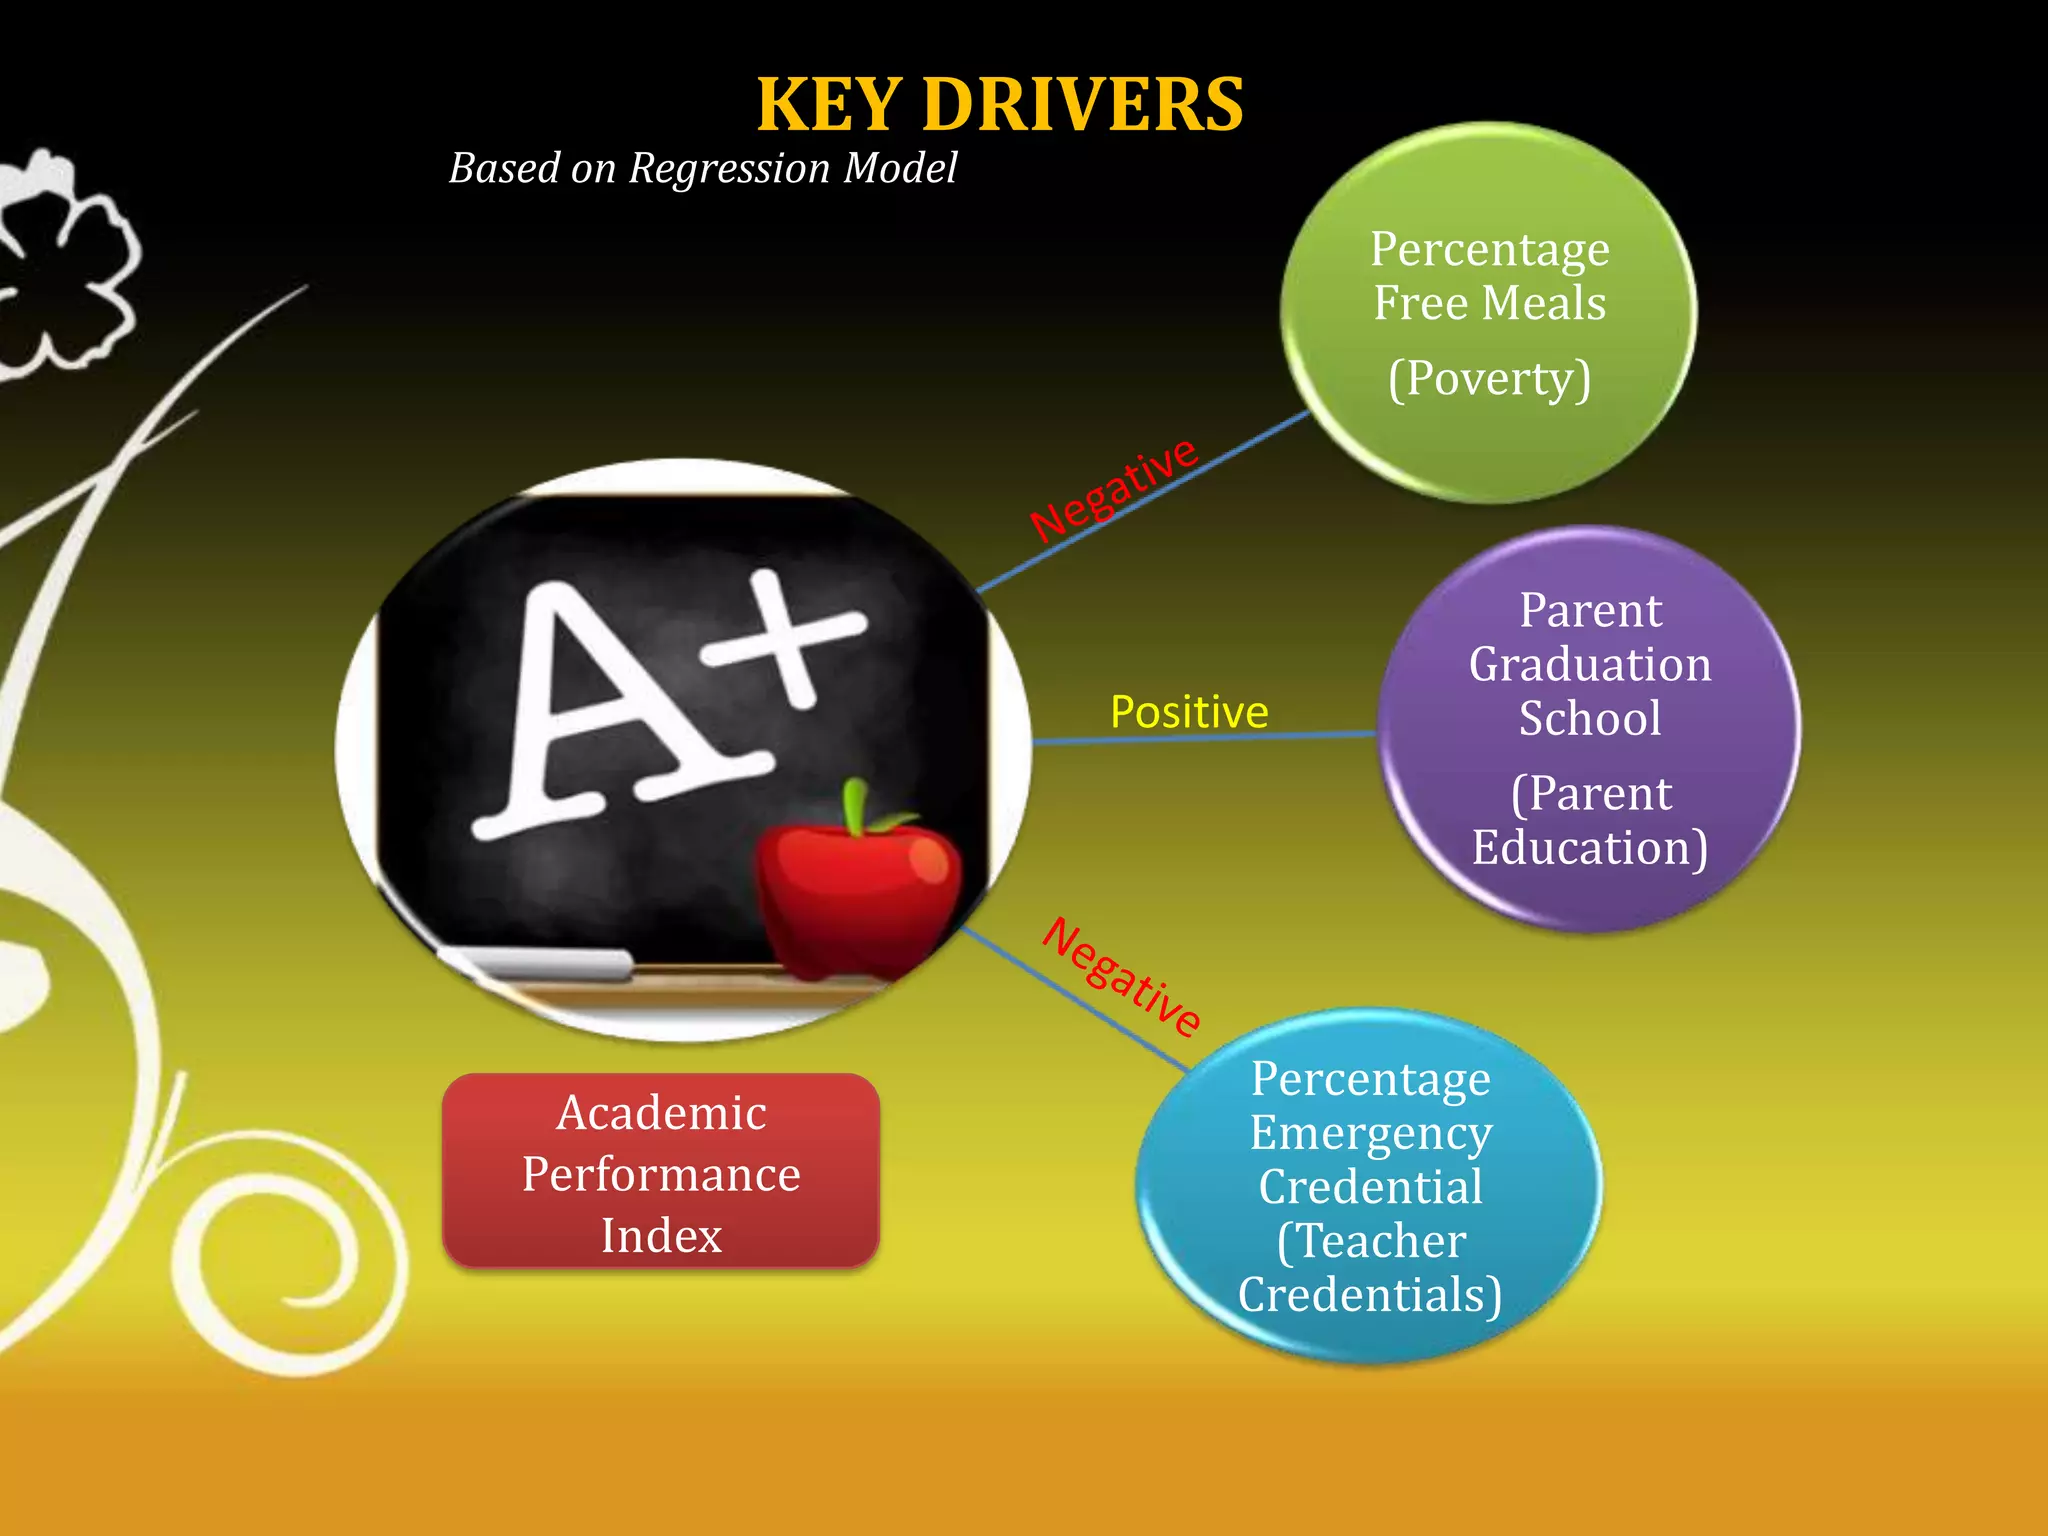
PREDICTION OF ACADEMIC
PERFORMANCE OF ELEMENTARY SCHOOL

SAS CASE STUDY
Presented by
Vaibhav Jain(A13021)
Maruthi Nataraj K(A13009)
Sunil Kumar(A13020)
Punit Kishore(A13011)
Arbind Kumar(A13003)
Praxis Business School , Kolkata
AGENDA
 Introduction
 Business Objective
 Regression Equation
 Key Drivers
 Analysis and Inferences
 Recommendations
 Appendix
INTRODUCTION
 API : The Academic Performance Index (API) is a measurement
of academic performance and progress of individual schools in California,
United States.

 API scores ranges from a low of 200 to a high of 1000.
 The API is closely tied to monetary and incentive awards by setting
Annual Percent Growth Targets for each school and whether the school
met or exceeded this goal.
 Why API ? To benchmark a school’s performance against other peer
schools that are educating similar students to build upon a school’s
strengths by focus on indicative metrics and identify areas for
improvement.
 Allows teachers, parents, school administrators, students, and
taxpayers to analyze and compare the academic performance of
individual schools.
BUSINESS OBJECTIVE
“To identify the factors that have most influence on the
performance of elementary Schools in California”
 Probable Indicators

- Class Size
- Enrollment
- Poverty
- Parent Education
- Student Performance
- Teachers Credentials

 Tools used :SAS
 Techniques : Regression Analysis
REGRESSION EQUATION
y=

x1

x2

x3

 Dependent variable (y) is api00 (Academic Performance Index 2000)
 Independent variables :
 x1 is meals (Percentage free meals i.e. poverty)
 x2 is ln(grad_sch) where grad_sch (Parent grad school)
 x3 is emer (Percentage teacher emergency credentials)
 Intercept
 Coefficient

 Coefficient

 Coefficient
 Final Equation is y = 857.63-3.43x1+22.25x2-1.95x3
KEY DRIVERS

Based on Regression Model

Percentage
Free Meals
(Poverty)

Positive

Academic
Performance
Index

Parent
Graduation
School
(Parent
Education)

Percentage
Emergency
Credential
(Teacher
Credentials)
ANALYSIS AND INFERENCES
Indicator 1 - Poverty
 The percentage of children eligible for free school meals is thought
to be a fair measure of deprivation.
 School with most children eligible for free school meals could have
negative effect in its performance as it has been likely to be teaching
children with access to fewer resources and less home encouragement.
 Many of the students entitled to free meals do not take them

because of worry about bad quality food and insufficient quantity of
the meals, which affects their health and in turn worsens academic
performance.
 Comparing the students availing the free meals option vis-a-vis
others in the school, the API might also get affected due to
performance of other students who are not part of the scheme.
ANALYSIS AND INFERENCES
Indicator 2 – Parent Education
 A child exposed to parents who models achievement-oriented behaviour (e.g.,
obtaining advanced degrees; etc) and provide achievement-oriented opportunities
(e.g., library and museum trips etc) develops the guiding belief that achievement is to
be valued and this belief in turn improves his performance in school.
 Graduated parents are more likely to use complex language and a wider
vocabulary with their young children. Therefore, the children develop language skills,

vocabulary, and cognitive skills earlier and perform better.
 Better educated parents are familiar with how schools work and are more likely to
get involved in the school, thereby monitoring their child’s academic progress.
 The more education they have, the higher their income-earning potential. People

with more money can afford to live in more expensive neighbourhoods and facilitate
better learning environment for the children which is sure to have an impact on
his/her academic performance.
ANALYSIS AND INFERENCES
Indicator 3 – Teachers’ Credentials
 Schools hire emergency-credentialed teachers to fill posts when
they cannot find fully certified teachers.
 It depends on the large number of students and high demand for
teachers.
 Emergency-credentialed teachers may have bachelor's degrees
and/or professional experience in the subjects they teach, but lack the

required teacher training and experience.
 A high percentage of teachers with emergency teaching certificates
may indicate that the school has difficulty in attracting and retaining
qualified teachers.
 Teachers’ salaries and greater number of unqualified teachers
seeking jobs also contribute to the teacher credentials.
RECOMMENDATIONS
 Investment will be needed in the schools offering free meals to eligible

students in order to bring their facilities up to standard.
 New standards should be set for school meals to ensure that the meals
are prepared with fresh , healthy ingredients and give children the
nutrients they need.
 The best strategy for closing achievement gaps is to make sure that
schools serving poor and minority students have their fair share of
qualified teachers.

 States and Districts can explore value-added methods to make
informed decisions about where to assign teachers, how to staff schools,
and what supports and professional development are needed to maximize
the benefits of having good teachers.
RECOMMENDATIONS
 States and Districts can establish and maintain intensive, long-term
induction programs that focus on helping new teachers to meet
challenging professional performance standards.
 Parents with lower levels of education are less likely to have high
expectations for the children's academic careers. When parents do not

have high expectations for children's academic achievement, the children
are unlikely to have expectations for themselves. Such children should be
provided additional motivation and exposure to learning for improved
academic results.
APPENDIX
DATA SNAPSHOT
OUTLIER TREATMENT

APPENDIX
MISSING VALUES

APPENDIX

 In order to treat the missing values as a part of data sanity check ,we need to
understand the data.
 When we look at the data closely, all the variables related to parent education
form a group.

 Also, we can observe that some of the percentage full values are less than 1

though in real most of them are expressed in percentages.
 As we have seen from PROC UNIVARIATE, there were some negative values in
average class size k-3 but fall within the same range as others when taken as
absolute values.

 Percentage free meals depends on the meals category also to some extent and
when replacing the missing values of meals, this point should be taken care.
MISSING VALUES

APPENDIX
APPENDIX
Understanding variable dependency on API00
APPENDIX
TESTING THE OVERALL SIGNIFICANCE OF THE MODEL
 Null Hypothesis : All the unknown population coefficients are
simultaneously zero.
 Alternate Hypothesis : At least one of them is non-zero.

In this case ,since p < alpha (0.01) , we rejected the null
hypothesis. It means that some of the independent variables can
influence dependent variable(api00).
APPENDIX
 The extent of multicollinearity for any variable is captured by variation inflation
factor (VIF) . As higher VIF is not desirable, we needed to bring it down to the
range of 1.5 – 2.0 .
APPENDIX
 Using COLLIN option’s collinearity diagnostic table, we identified variables
which had highest collinearity with others having highest VIF among the two
and retained the one which has lower p-value for higher significance.
APPENDIX
 Then , Heteroscedasticity (SPEC) check was carried out and also the
residual plots were observed to work out on the transformation of the
variables to reduce its effect.
APPENDIX
CHECK FOR SIGNIFICANCE OF INDIVIDUAL PARAMETERS

 Null Hypothesis : j = 0
 Alternate Hypothesis j <> 0
If p < alpha , we reject null hypothesis to claim that j is significantly
different from zero and Xj is an important variable in model.
APPENDIX
Output file with predicted and residual variables

Residuals plots of significant variables of model
APPENDIX
 Null Hypothesis : Model is homescedastic.
 Alternate Hypothesis : Model is heteroscedastic.

As p > alpha,
we accept the
null hypothesis.

 Here, grad_sch was
transformed
to
log(grad_sch) to reduce
the
heteroscedasticity
effect.
APPENDIX
 Null Hypothesis : Residuals are normally distributed
 Alternate Hypothesis : Residuals are not normally distributed

As p>alpha(0.01)
in all cases, we
accept the null
hypothesis.
APPENDIX
Mean Absolute Percentage Error captures the error percentage in the
model and for our model it is 7.92% which is within 10% (ideal).
APPENDIX
Dashboard
Elementary School Performance (SAS Regression Analysis)

Elementary School Performance (SAS Regression Analysis)

  • 1.
    PREDICTION OF ACADEMIC PERFORMANCEOF ELEMENTARY SCHOOL SAS CASE STUDY Presented by Vaibhav Jain(A13021) Maruthi Nataraj K(A13009) Sunil Kumar(A13020) Punit Kishore(A13011) Arbind Kumar(A13003) Praxis Business School , Kolkata
  • 2.
    AGENDA  Introduction  BusinessObjective  Regression Equation  Key Drivers  Analysis and Inferences  Recommendations  Appendix
  • 3.
    INTRODUCTION  API :The Academic Performance Index (API) is a measurement of academic performance and progress of individual schools in California, United States.  API scores ranges from a low of 200 to a high of 1000.  The API is closely tied to monetary and incentive awards by setting Annual Percent Growth Targets for each school and whether the school met or exceeded this goal.  Why API ? To benchmark a school’s performance against other peer schools that are educating similar students to build upon a school’s strengths by focus on indicative metrics and identify areas for improvement.  Allows teachers, parents, school administrators, students, and taxpayers to analyze and compare the academic performance of individual schools.
  • 4.
    BUSINESS OBJECTIVE “To identifythe factors that have most influence on the performance of elementary Schools in California”  Probable Indicators - Class Size - Enrollment - Poverty - Parent Education - Student Performance - Teachers Credentials  Tools used :SAS  Techniques : Regression Analysis
  • 5.
    REGRESSION EQUATION y= x1 x2 x3  Dependentvariable (y) is api00 (Academic Performance Index 2000)  Independent variables :  x1 is meals (Percentage free meals i.e. poverty)  x2 is ln(grad_sch) where grad_sch (Parent grad school)  x3 is emer (Percentage teacher emergency credentials)  Intercept  Coefficient  Coefficient  Coefficient  Final Equation is y = 857.63-3.43x1+22.25x2-1.95x3
  • 6.
    KEY DRIVERS Based onRegression Model Percentage Free Meals (Poverty) Positive Academic Performance Index Parent Graduation School (Parent Education) Percentage Emergency Credential (Teacher Credentials)
  • 7.
    ANALYSIS AND INFERENCES Indicator1 - Poverty  The percentage of children eligible for free school meals is thought to be a fair measure of deprivation.  School with most children eligible for free school meals could have negative effect in its performance as it has been likely to be teaching children with access to fewer resources and less home encouragement.  Many of the students entitled to free meals do not take them because of worry about bad quality food and insufficient quantity of the meals, which affects their health and in turn worsens academic performance.  Comparing the students availing the free meals option vis-a-vis others in the school, the API might also get affected due to performance of other students who are not part of the scheme.
  • 8.
    ANALYSIS AND INFERENCES Indicator2 – Parent Education  A child exposed to parents who models achievement-oriented behaviour (e.g., obtaining advanced degrees; etc) and provide achievement-oriented opportunities (e.g., library and museum trips etc) develops the guiding belief that achievement is to be valued and this belief in turn improves his performance in school.  Graduated parents are more likely to use complex language and a wider vocabulary with their young children. Therefore, the children develop language skills, vocabulary, and cognitive skills earlier and perform better.  Better educated parents are familiar with how schools work and are more likely to get involved in the school, thereby monitoring their child’s academic progress.  The more education they have, the higher their income-earning potential. People with more money can afford to live in more expensive neighbourhoods and facilitate better learning environment for the children which is sure to have an impact on his/her academic performance.
  • 9.
    ANALYSIS AND INFERENCES Indicator3 – Teachers’ Credentials  Schools hire emergency-credentialed teachers to fill posts when they cannot find fully certified teachers.  It depends on the large number of students and high demand for teachers.  Emergency-credentialed teachers may have bachelor's degrees and/or professional experience in the subjects they teach, but lack the required teacher training and experience.  A high percentage of teachers with emergency teaching certificates may indicate that the school has difficulty in attracting and retaining qualified teachers.  Teachers’ salaries and greater number of unqualified teachers seeking jobs also contribute to the teacher credentials.
  • 10.
    RECOMMENDATIONS  Investment willbe needed in the schools offering free meals to eligible students in order to bring their facilities up to standard.  New standards should be set for school meals to ensure that the meals are prepared with fresh , healthy ingredients and give children the nutrients they need.  The best strategy for closing achievement gaps is to make sure that schools serving poor and minority students have their fair share of qualified teachers.  States and Districts can explore value-added methods to make informed decisions about where to assign teachers, how to staff schools, and what supports and professional development are needed to maximize the benefits of having good teachers.
  • 11.
    RECOMMENDATIONS  States andDistricts can establish and maintain intensive, long-term induction programs that focus on helping new teachers to meet challenging professional performance standards.  Parents with lower levels of education are less likely to have high expectations for the children's academic careers. When parents do not have high expectations for children's academic achievement, the children are unlikely to have expectations for themselves. Such children should be provided additional motivation and exposure to learning for improved academic results.
  • 12.
  • 13.
  • 14.
    MISSING VALUES APPENDIX  Inorder to treat the missing values as a part of data sanity check ,we need to understand the data.  When we look at the data closely, all the variables related to parent education form a group.  Also, we can observe that some of the percentage full values are less than 1 though in real most of them are expressed in percentages.  As we have seen from PROC UNIVARIATE, there were some negative values in average class size k-3 but fall within the same range as others when taken as absolute values.  Percentage free meals depends on the meals category also to some extent and when replacing the missing values of meals, this point should be taken care.
  • 15.
  • 16.
  • 17.
    APPENDIX TESTING THE OVERALLSIGNIFICANCE OF THE MODEL  Null Hypothesis : All the unknown population coefficients are simultaneously zero.  Alternate Hypothesis : At least one of them is non-zero. In this case ,since p < alpha (0.01) , we rejected the null hypothesis. It means that some of the independent variables can influence dependent variable(api00).
  • 18.
    APPENDIX  The extentof multicollinearity for any variable is captured by variation inflation factor (VIF) . As higher VIF is not desirable, we needed to bring it down to the range of 1.5 – 2.0 .
  • 19.
    APPENDIX  Using COLLINoption’s collinearity diagnostic table, we identified variables which had highest collinearity with others having highest VIF among the two and retained the one which has lower p-value for higher significance.
  • 20.
    APPENDIX  Then ,Heteroscedasticity (SPEC) check was carried out and also the residual plots were observed to work out on the transformation of the variables to reduce its effect.
  • 21.
    APPENDIX CHECK FOR SIGNIFICANCEOF INDIVIDUAL PARAMETERS  Null Hypothesis : j = 0  Alternate Hypothesis j <> 0 If p < alpha , we reject null hypothesis to claim that j is significantly different from zero and Xj is an important variable in model.
  • 22.
    APPENDIX Output file withpredicted and residual variables Residuals plots of significant variables of model
  • 23.
    APPENDIX  Null Hypothesis: Model is homescedastic.  Alternate Hypothesis : Model is heteroscedastic. As p > alpha, we accept the null hypothesis.  Here, grad_sch was transformed to log(grad_sch) to reduce the heteroscedasticity effect.
  • 24.
    APPENDIX  Null Hypothesis: Residuals are normally distributed  Alternate Hypothesis : Residuals are not normally distributed As p>alpha(0.01) in all cases, we accept the null hypothesis.
  • 25.
    APPENDIX Mean Absolute PercentageError captures the error percentage in the model and for our model it is 7.92% which is within 10% (ideal).
  • 26.