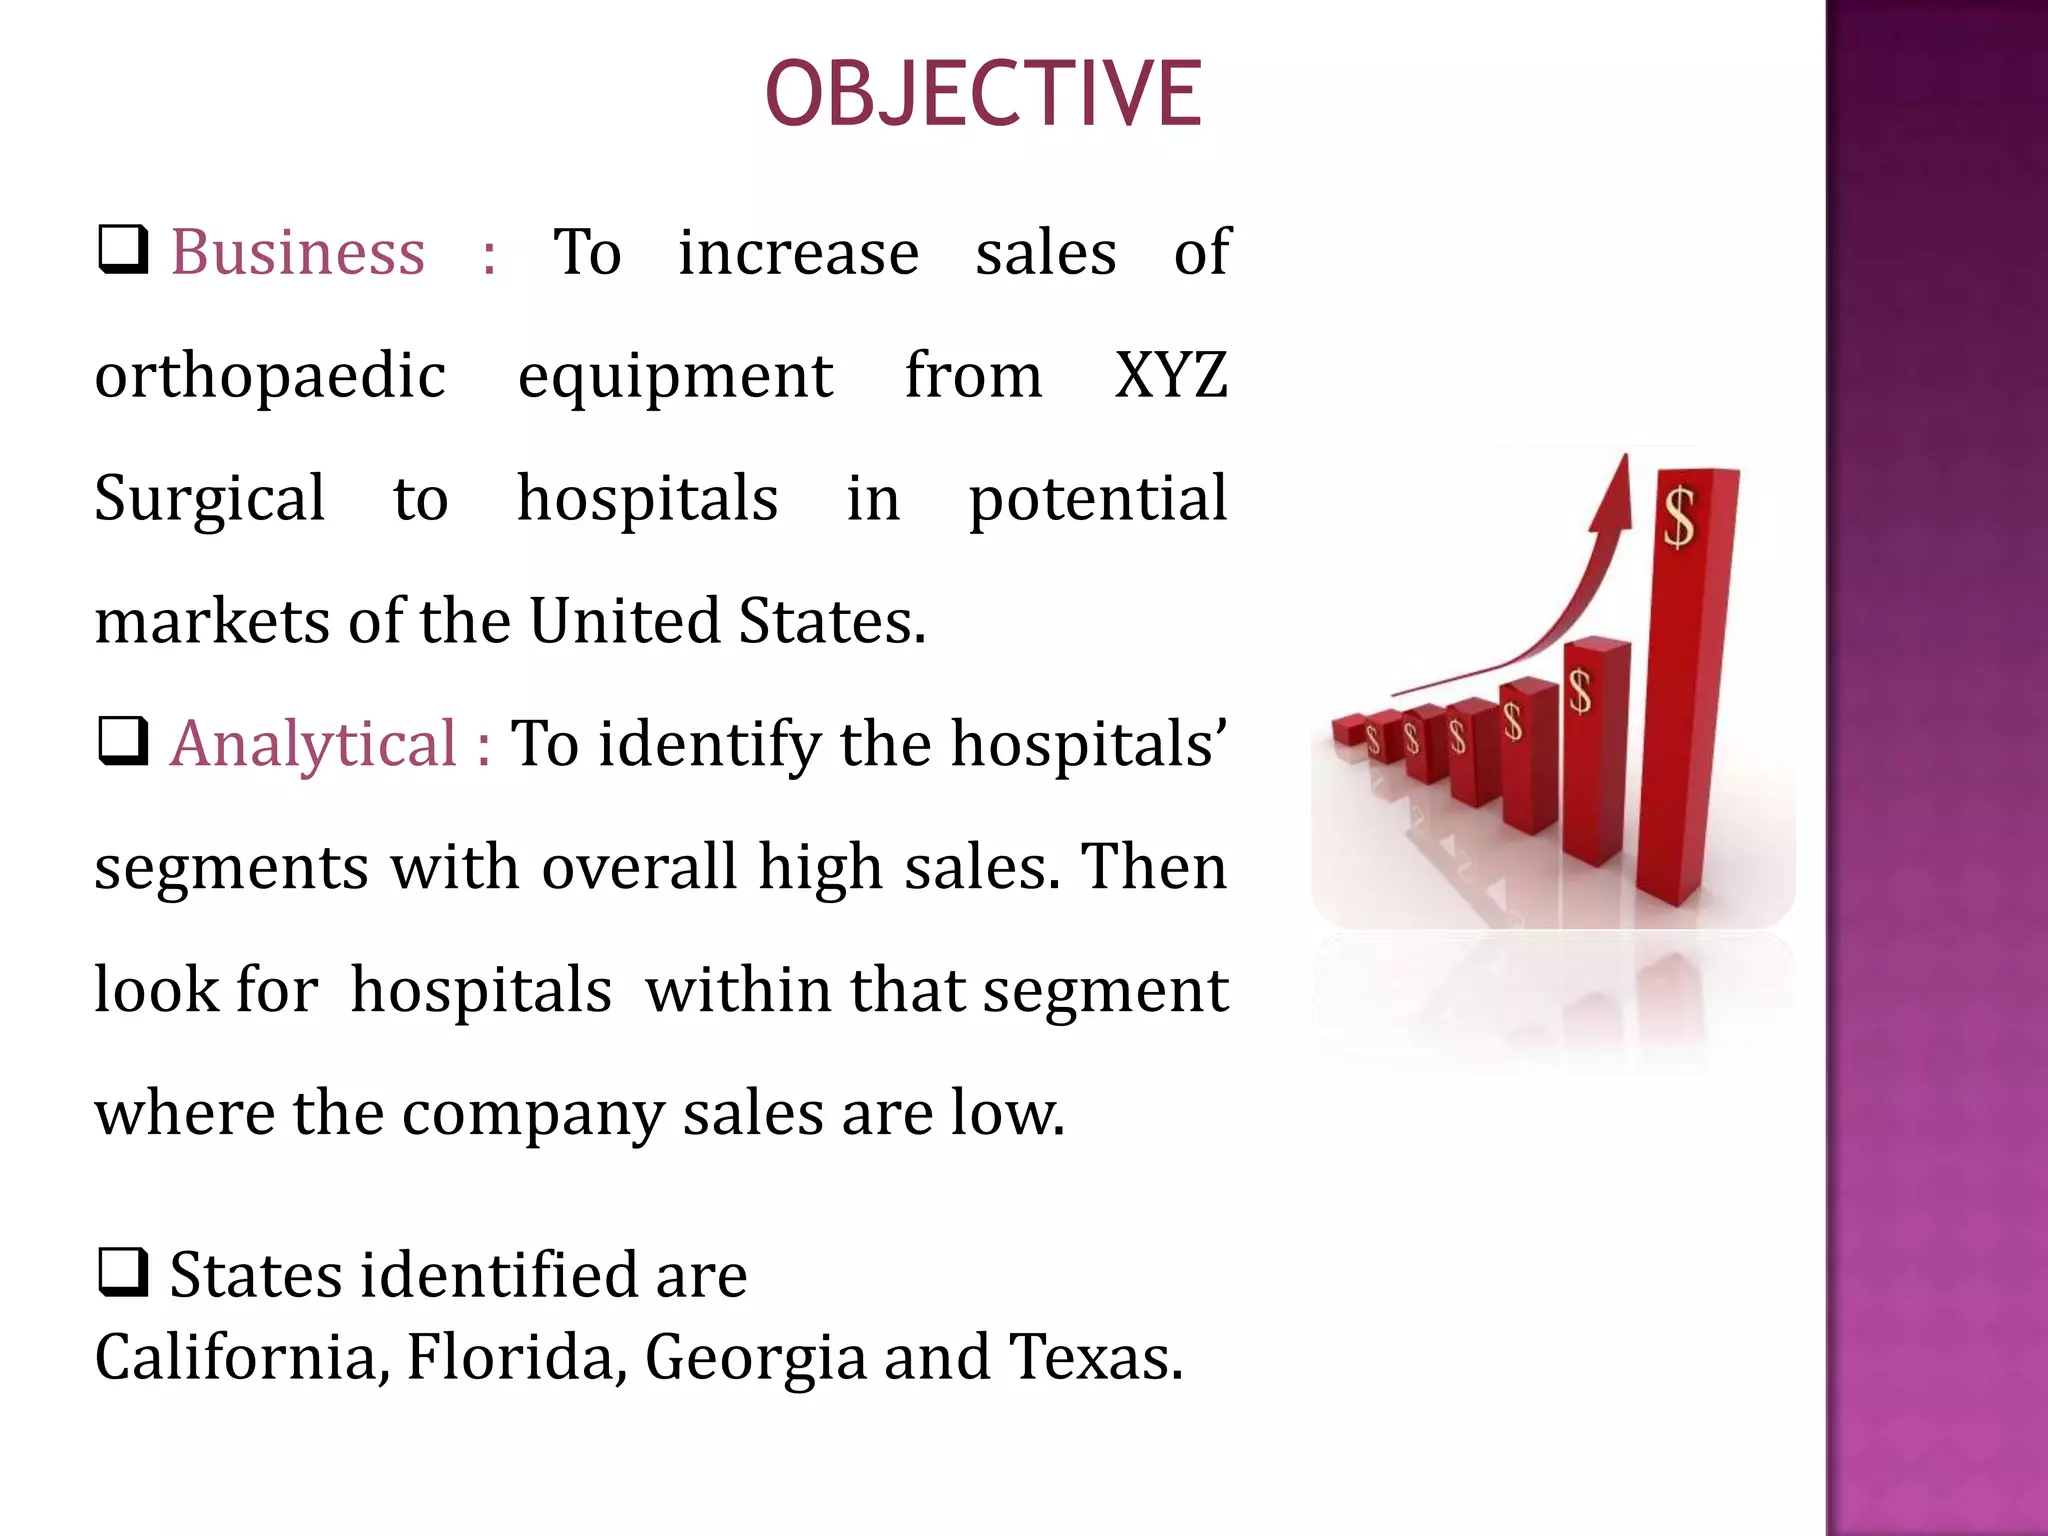
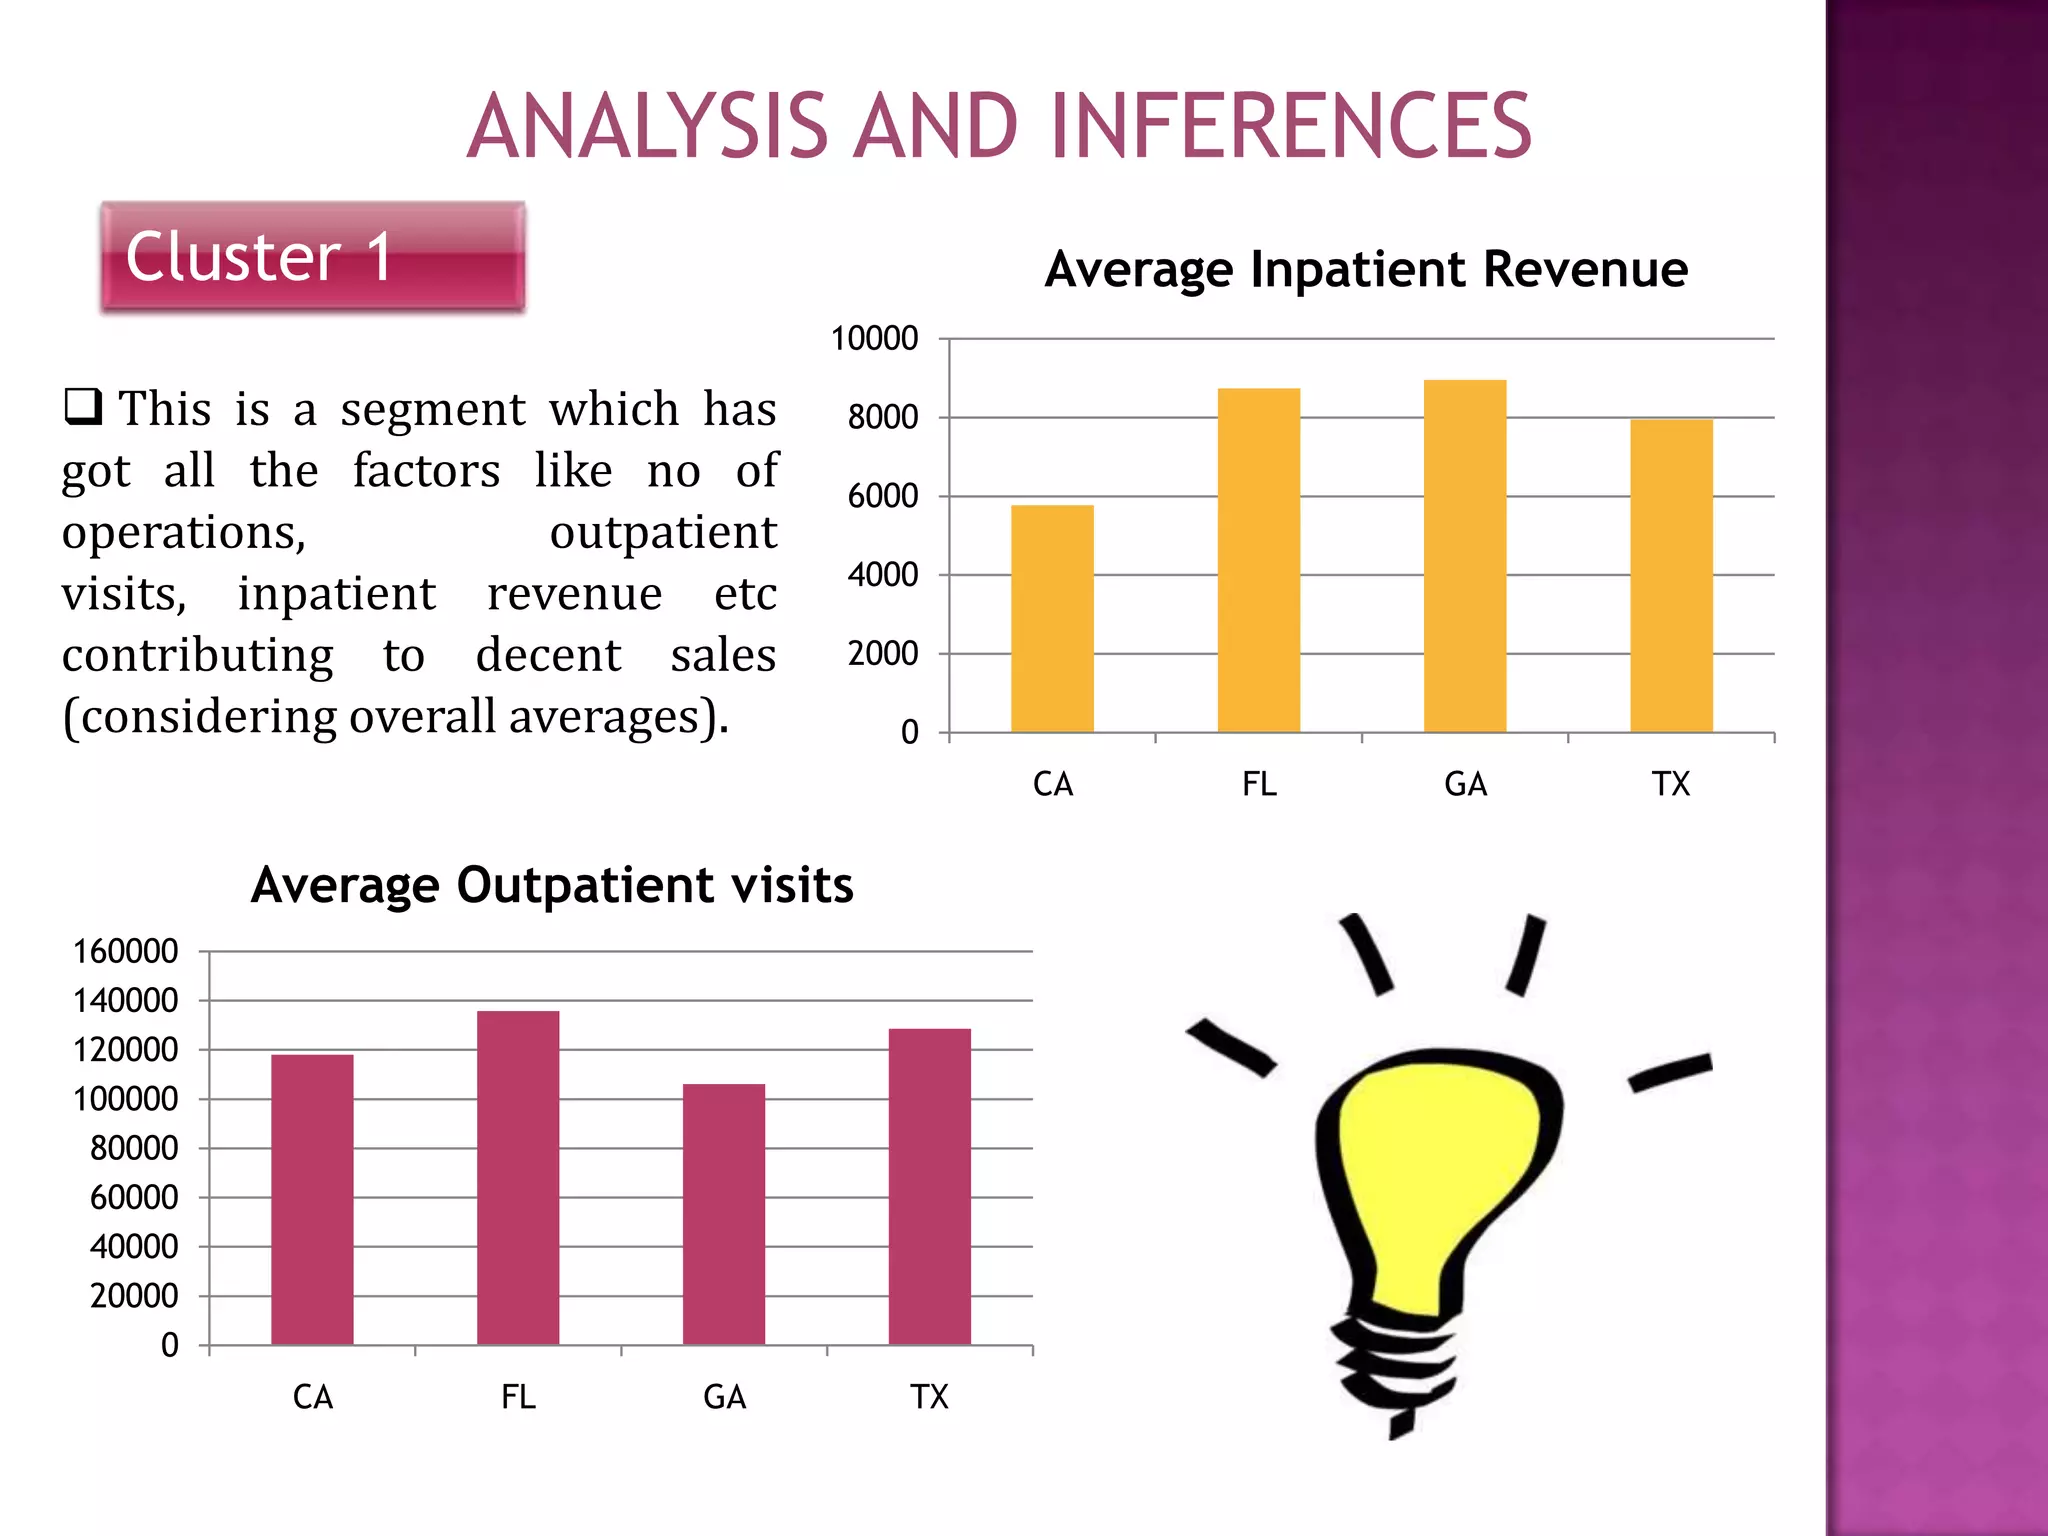
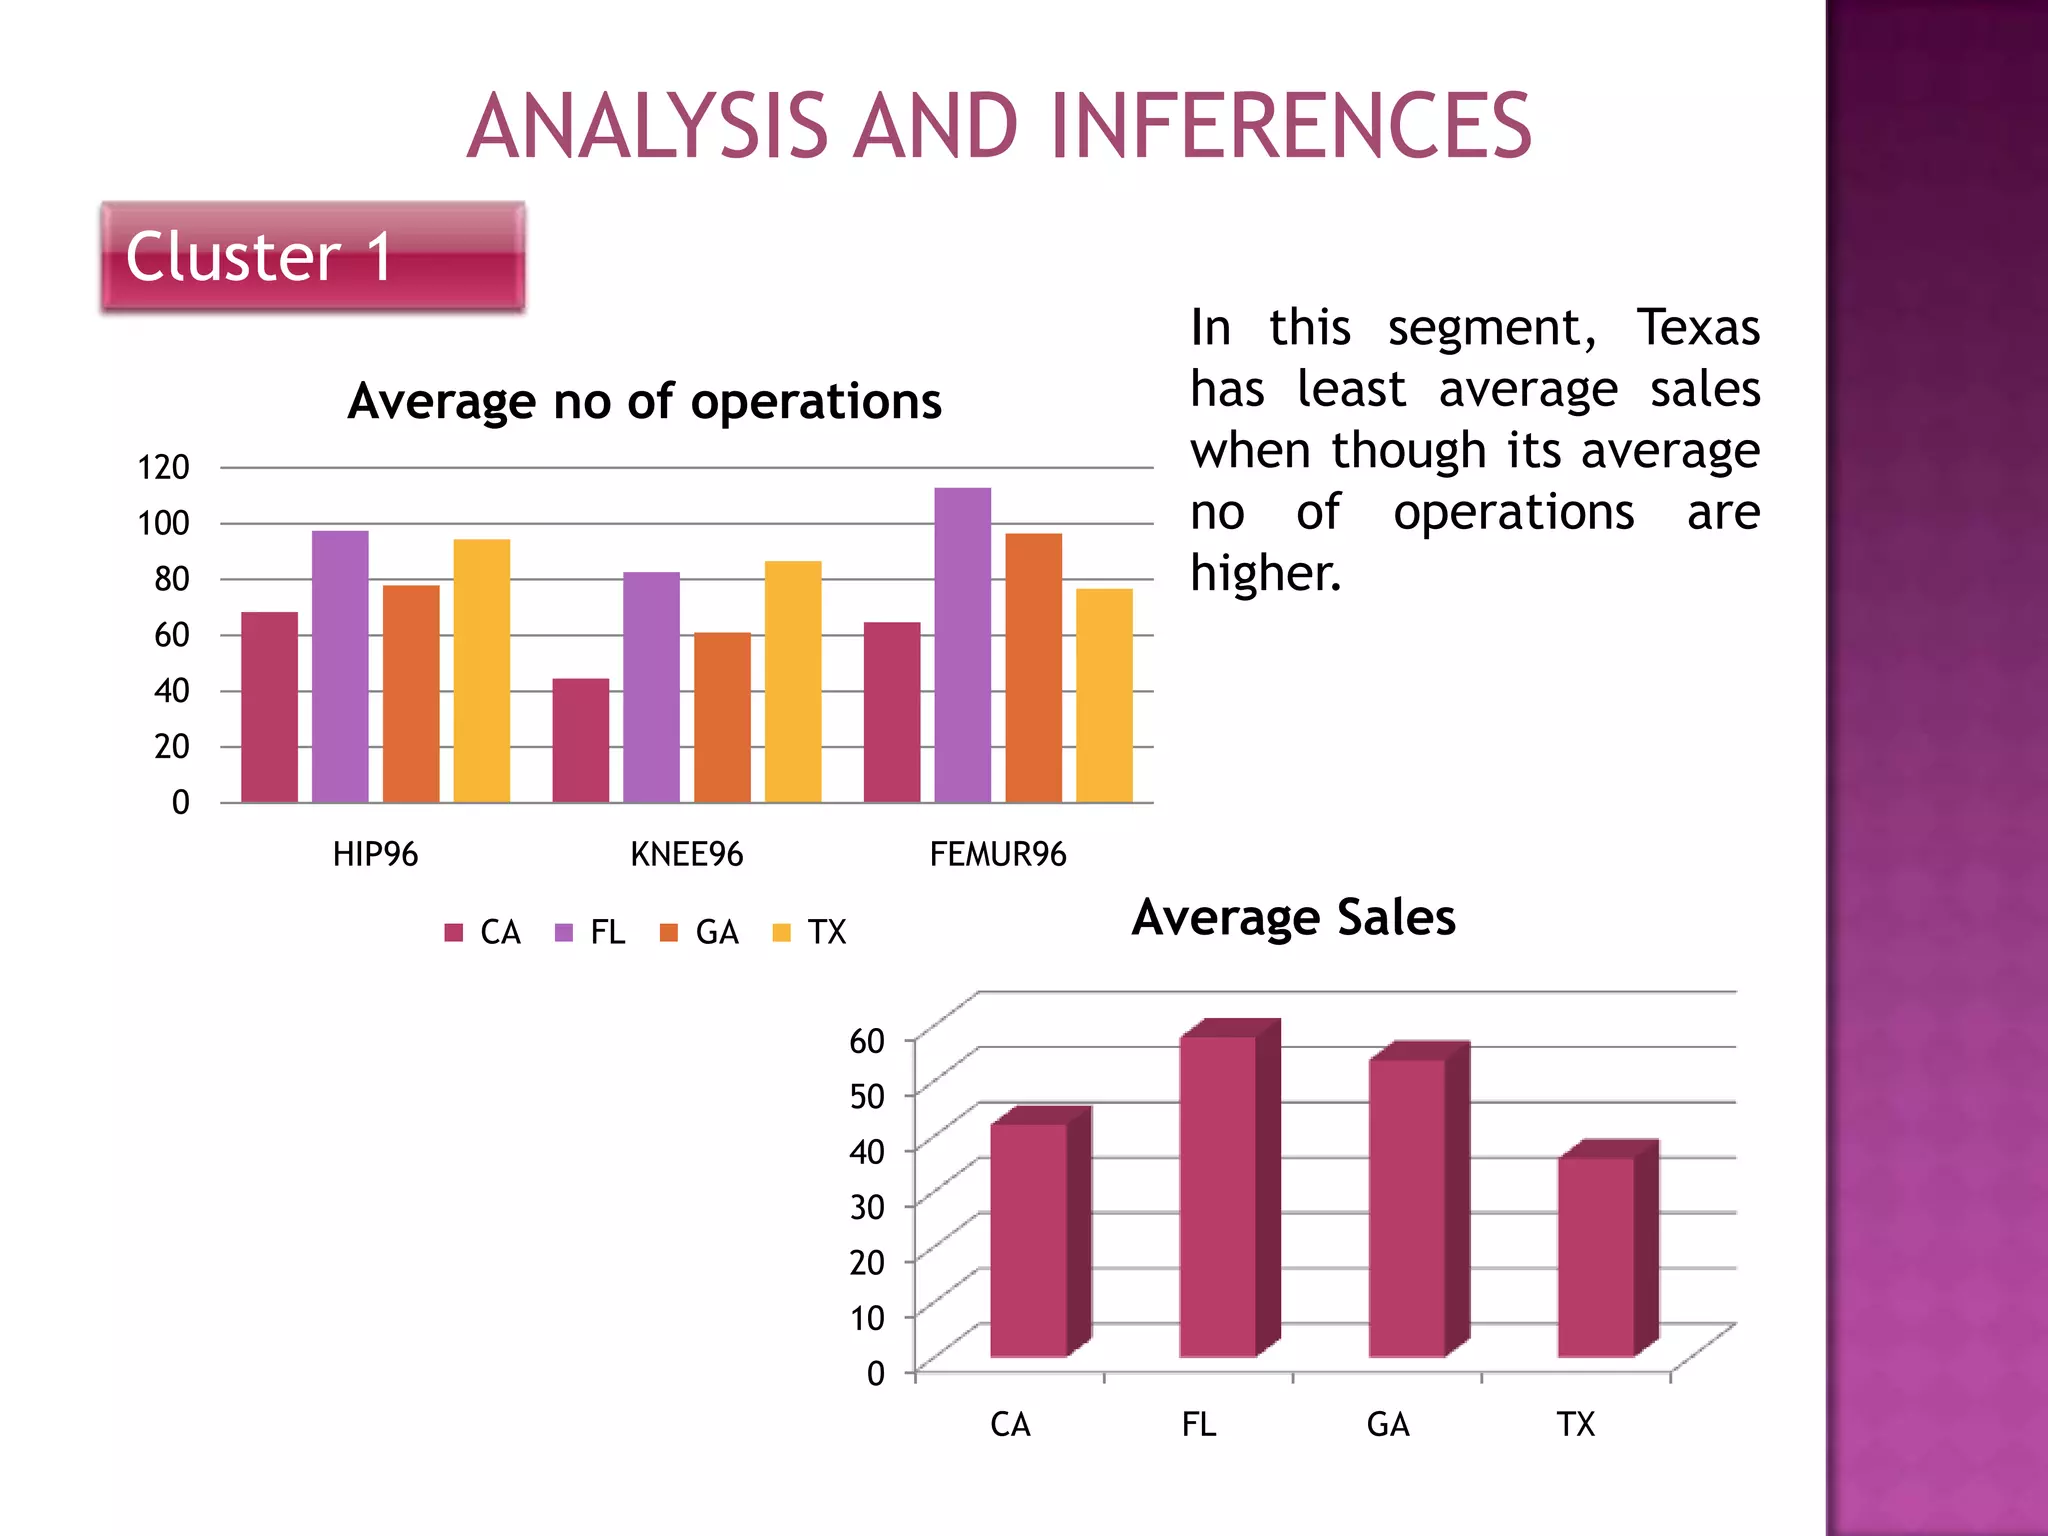
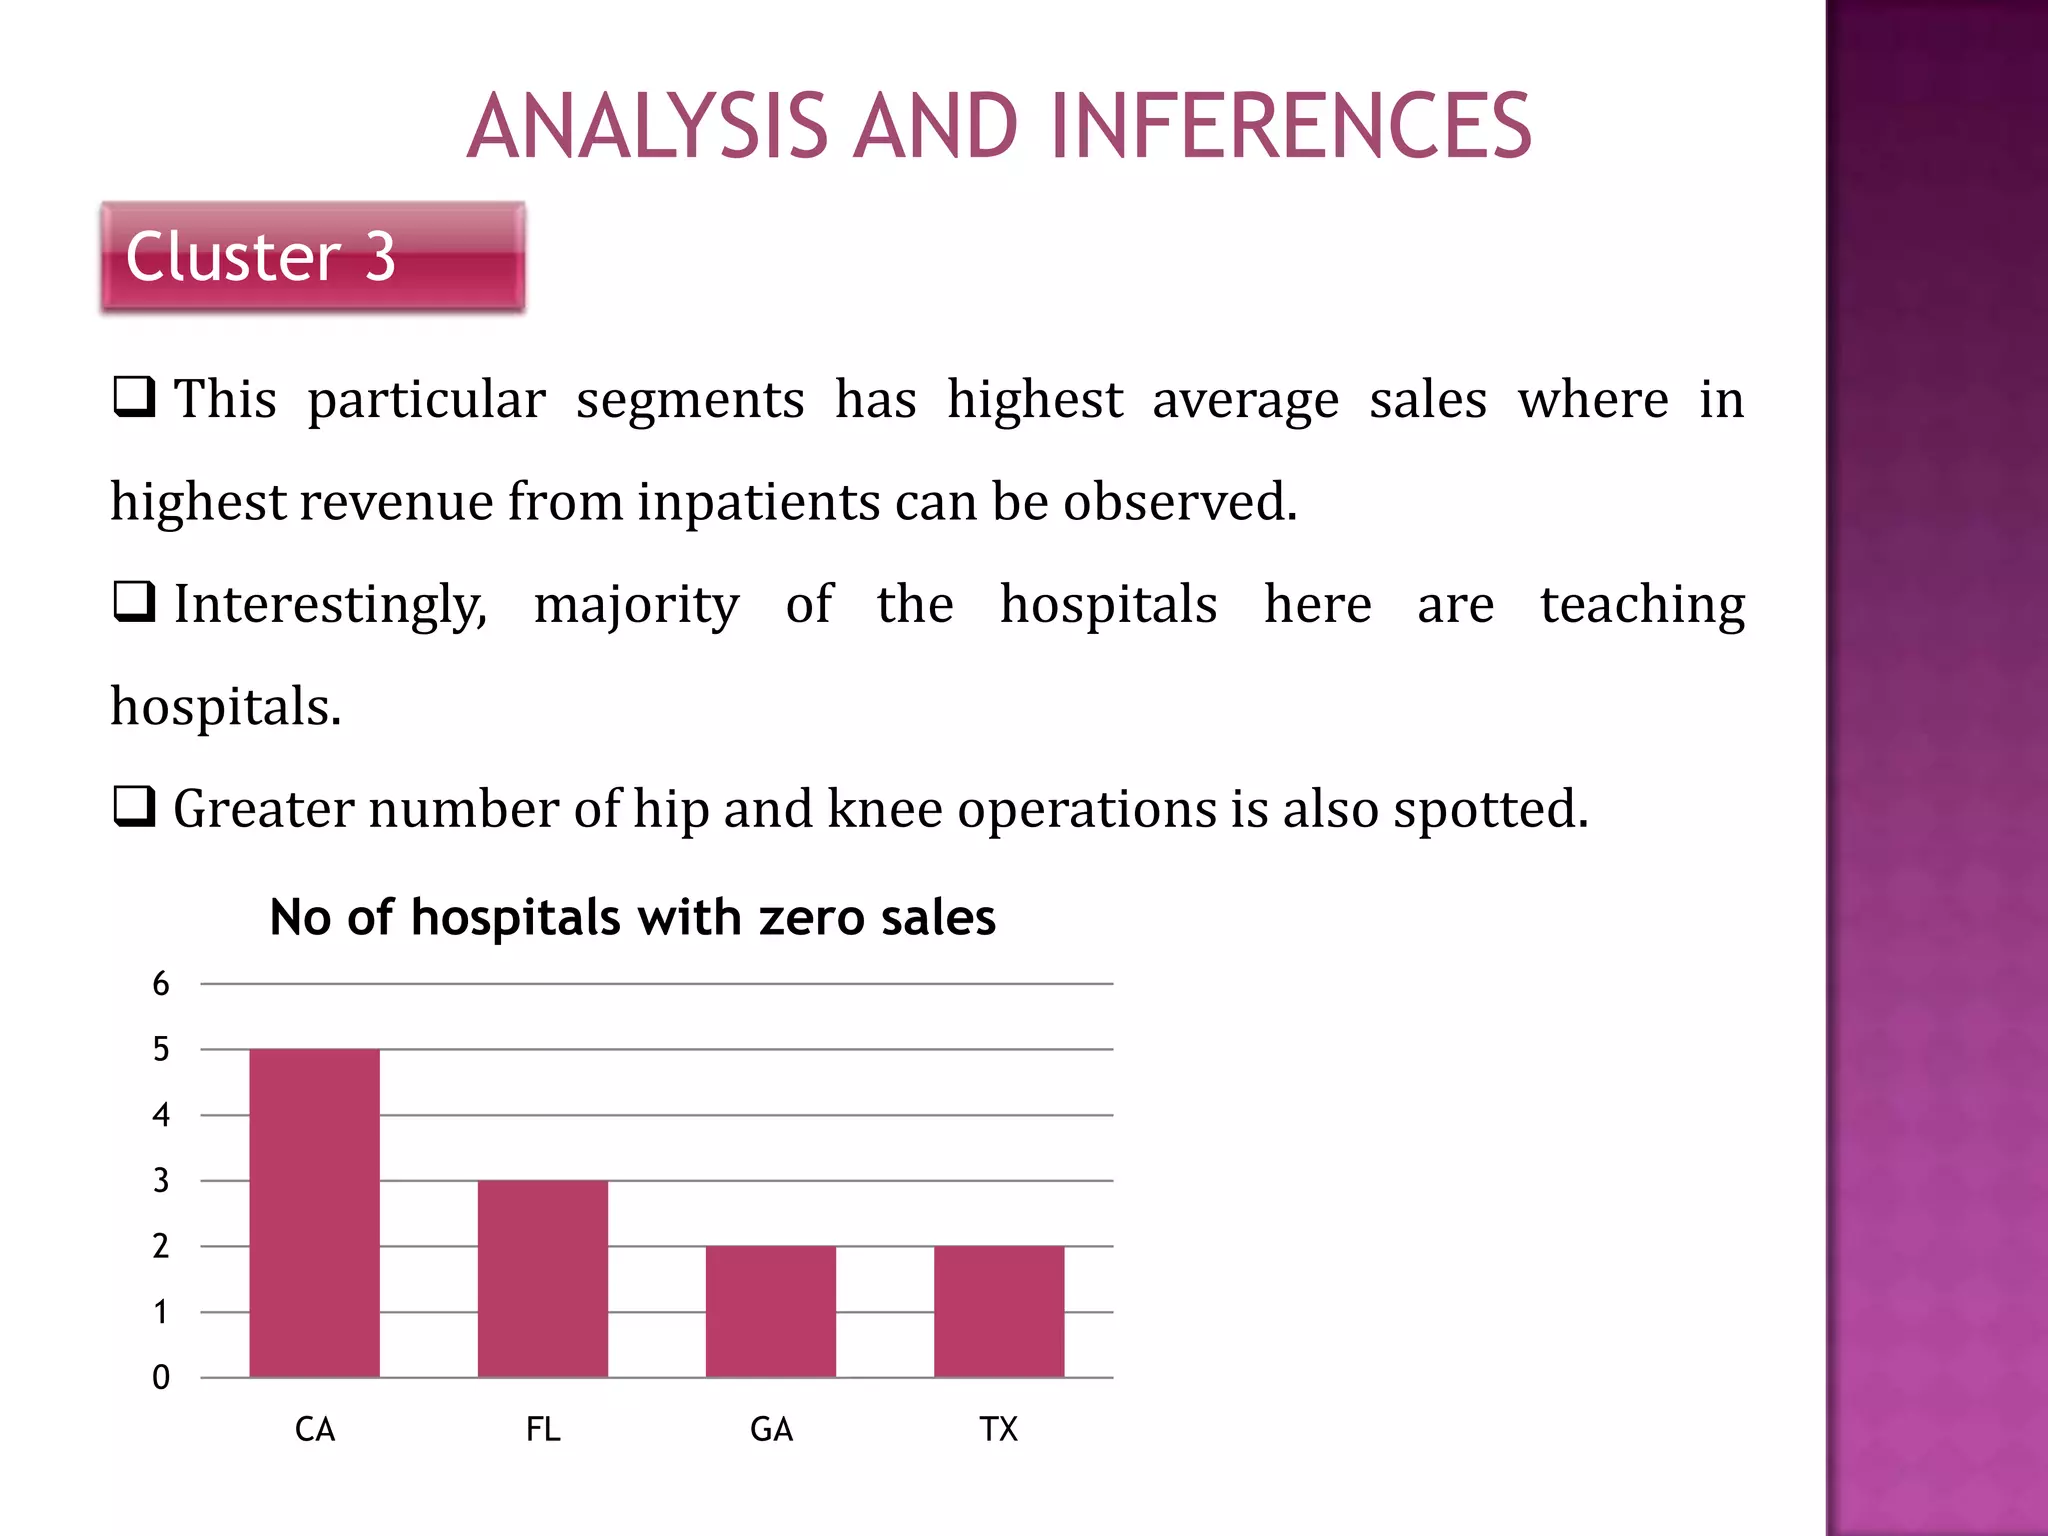
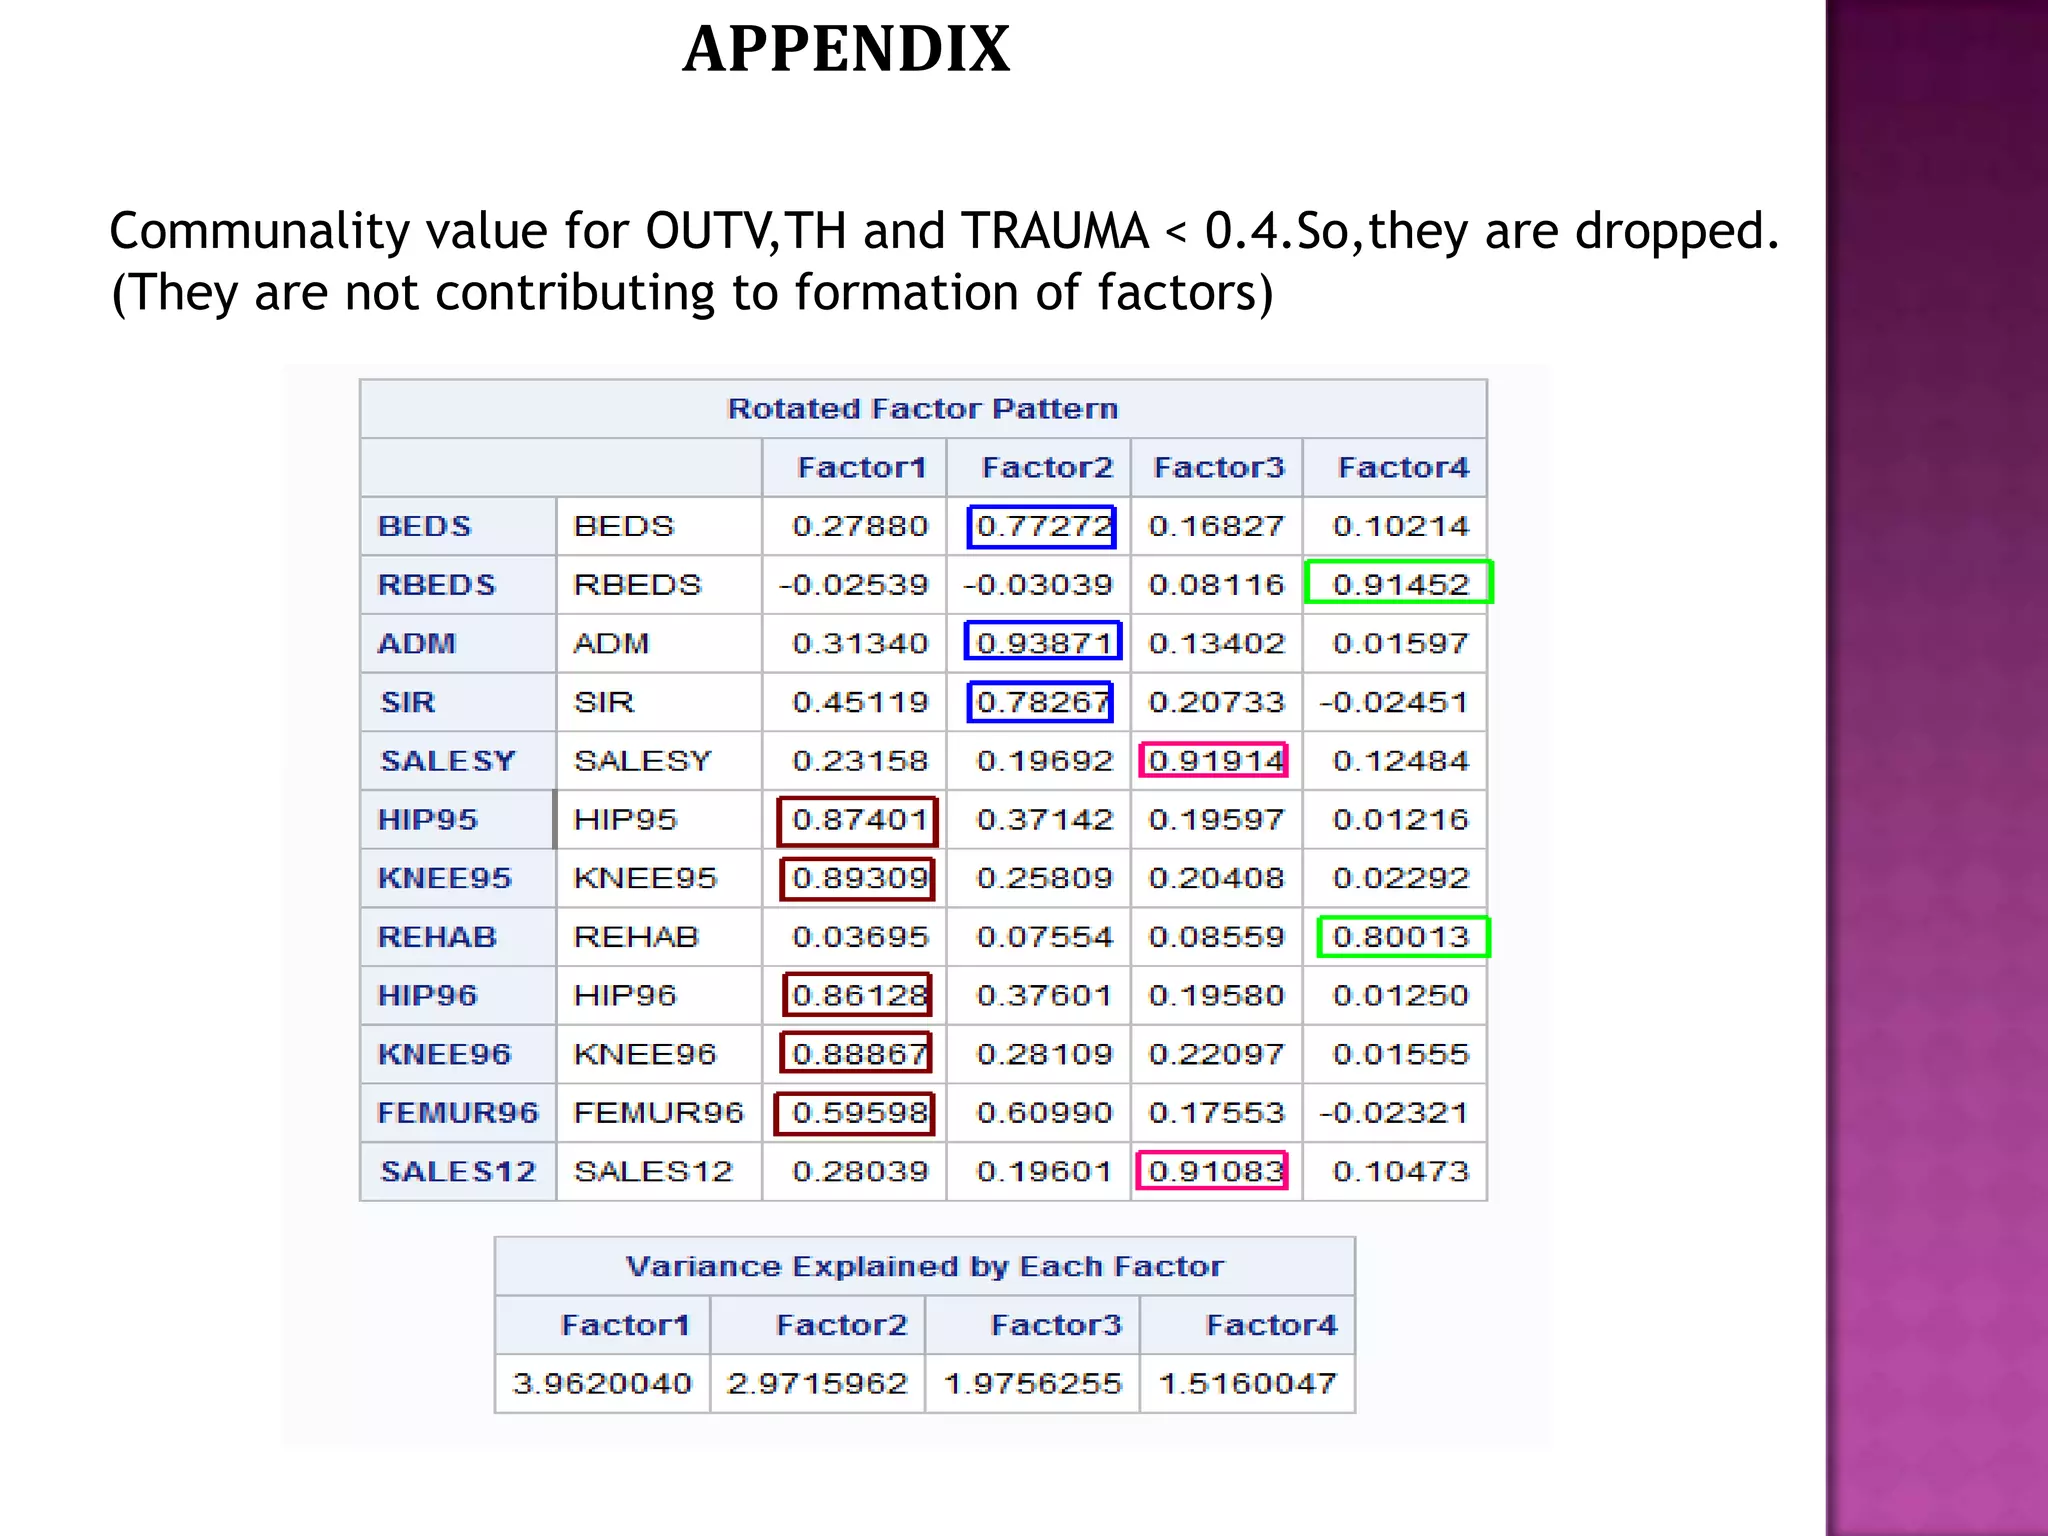
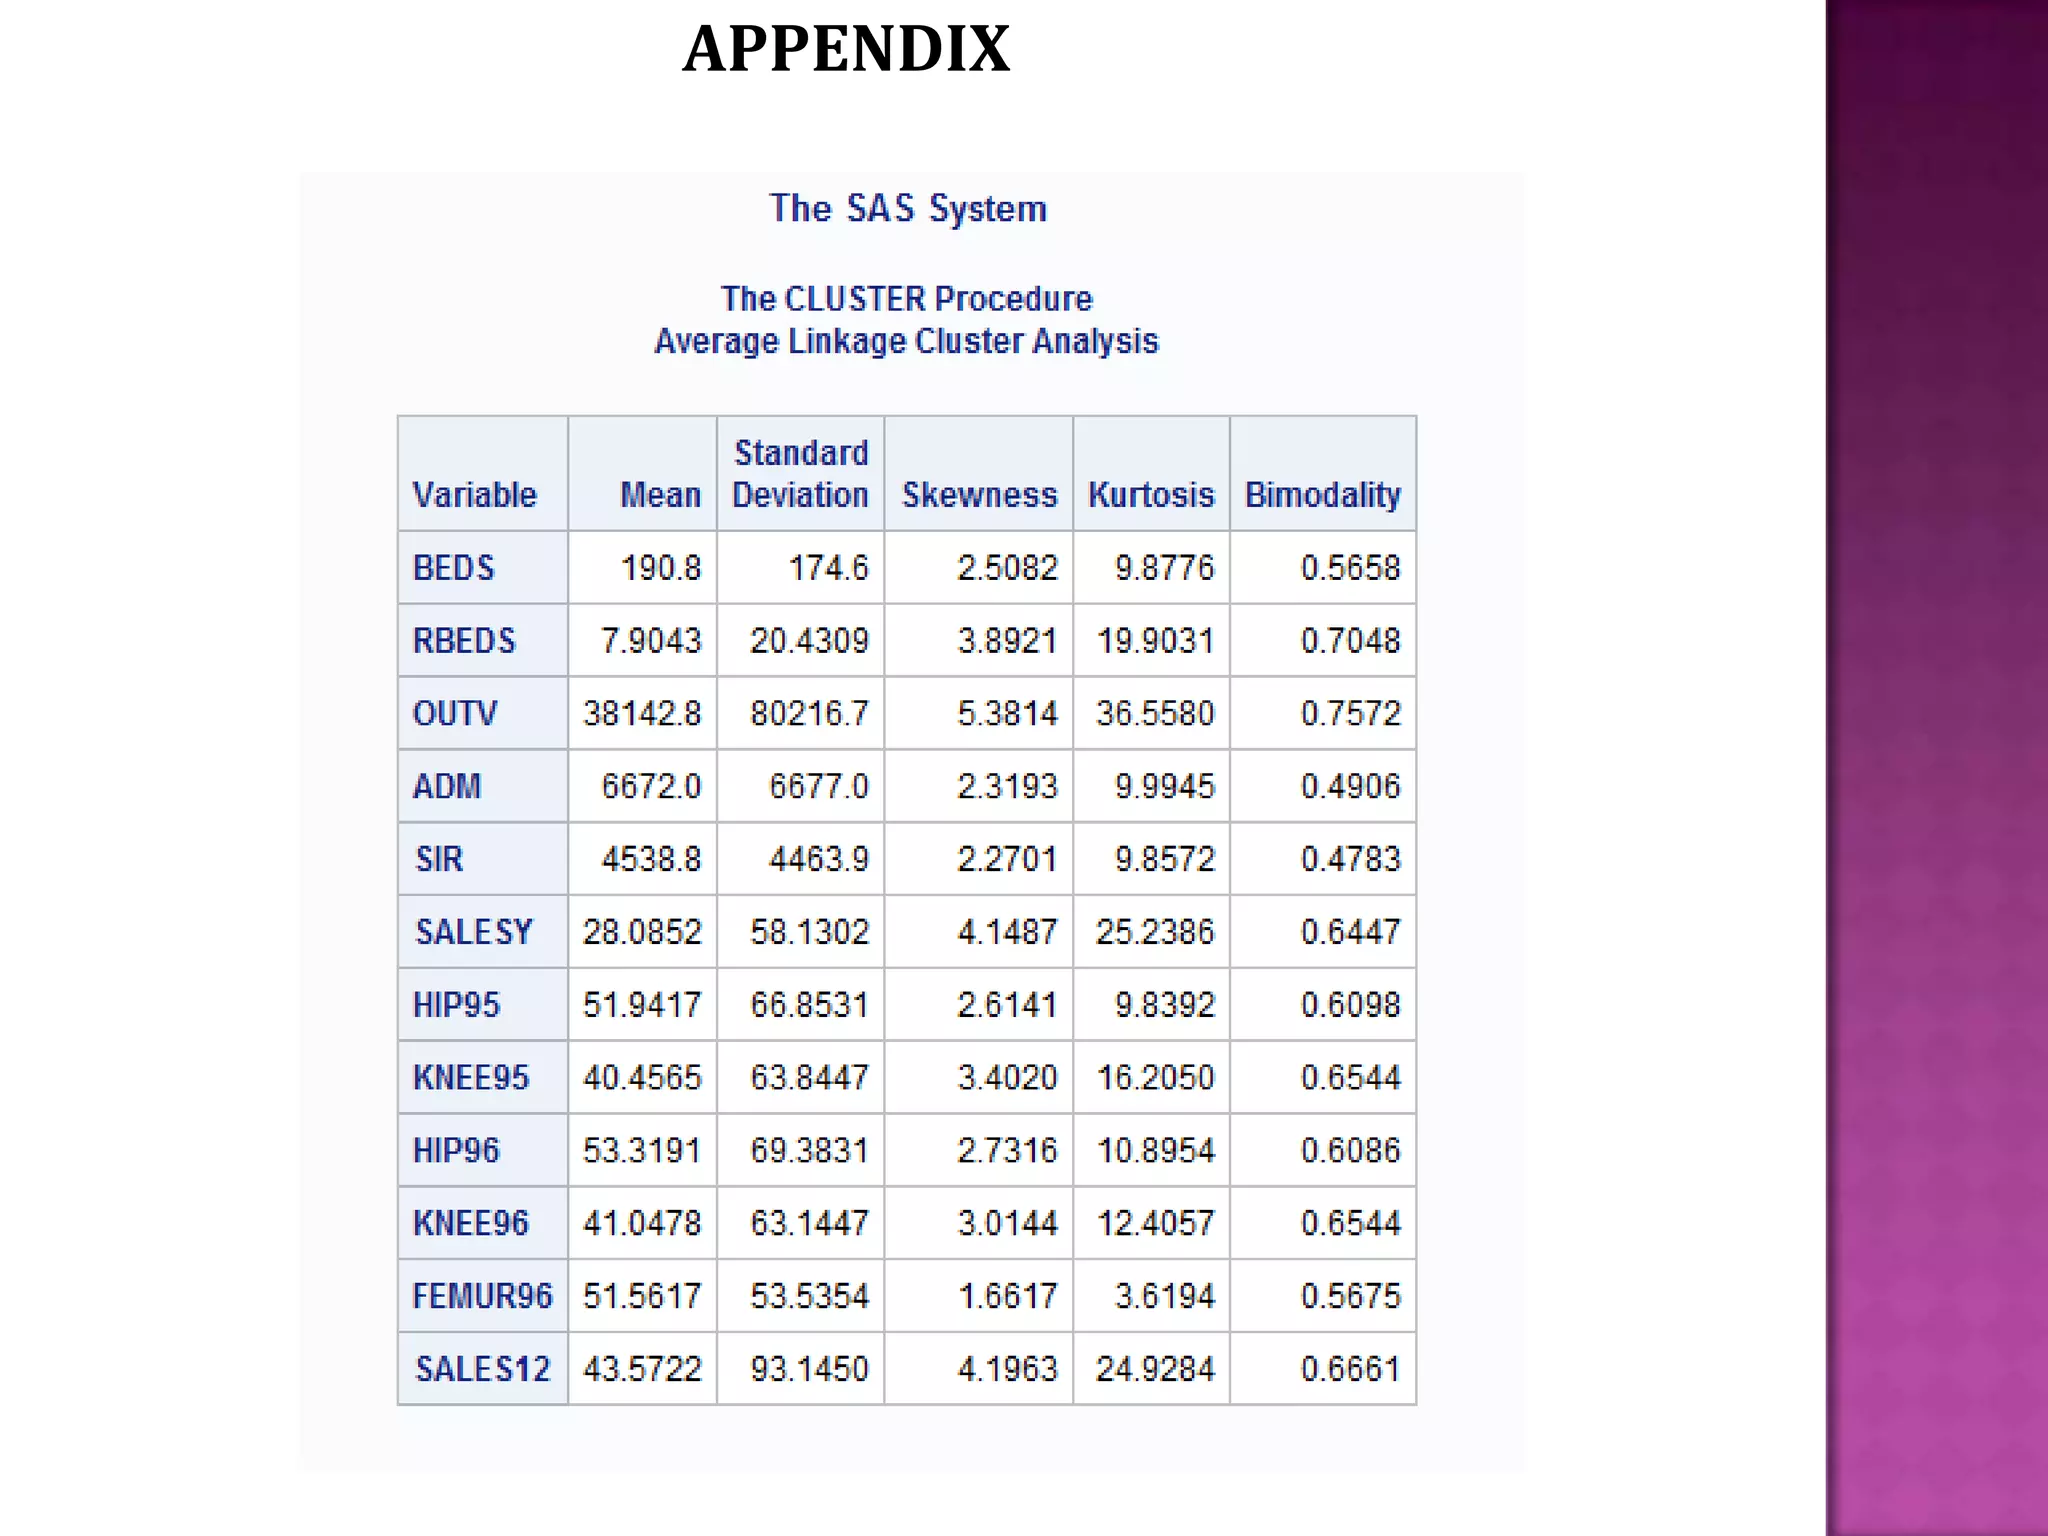
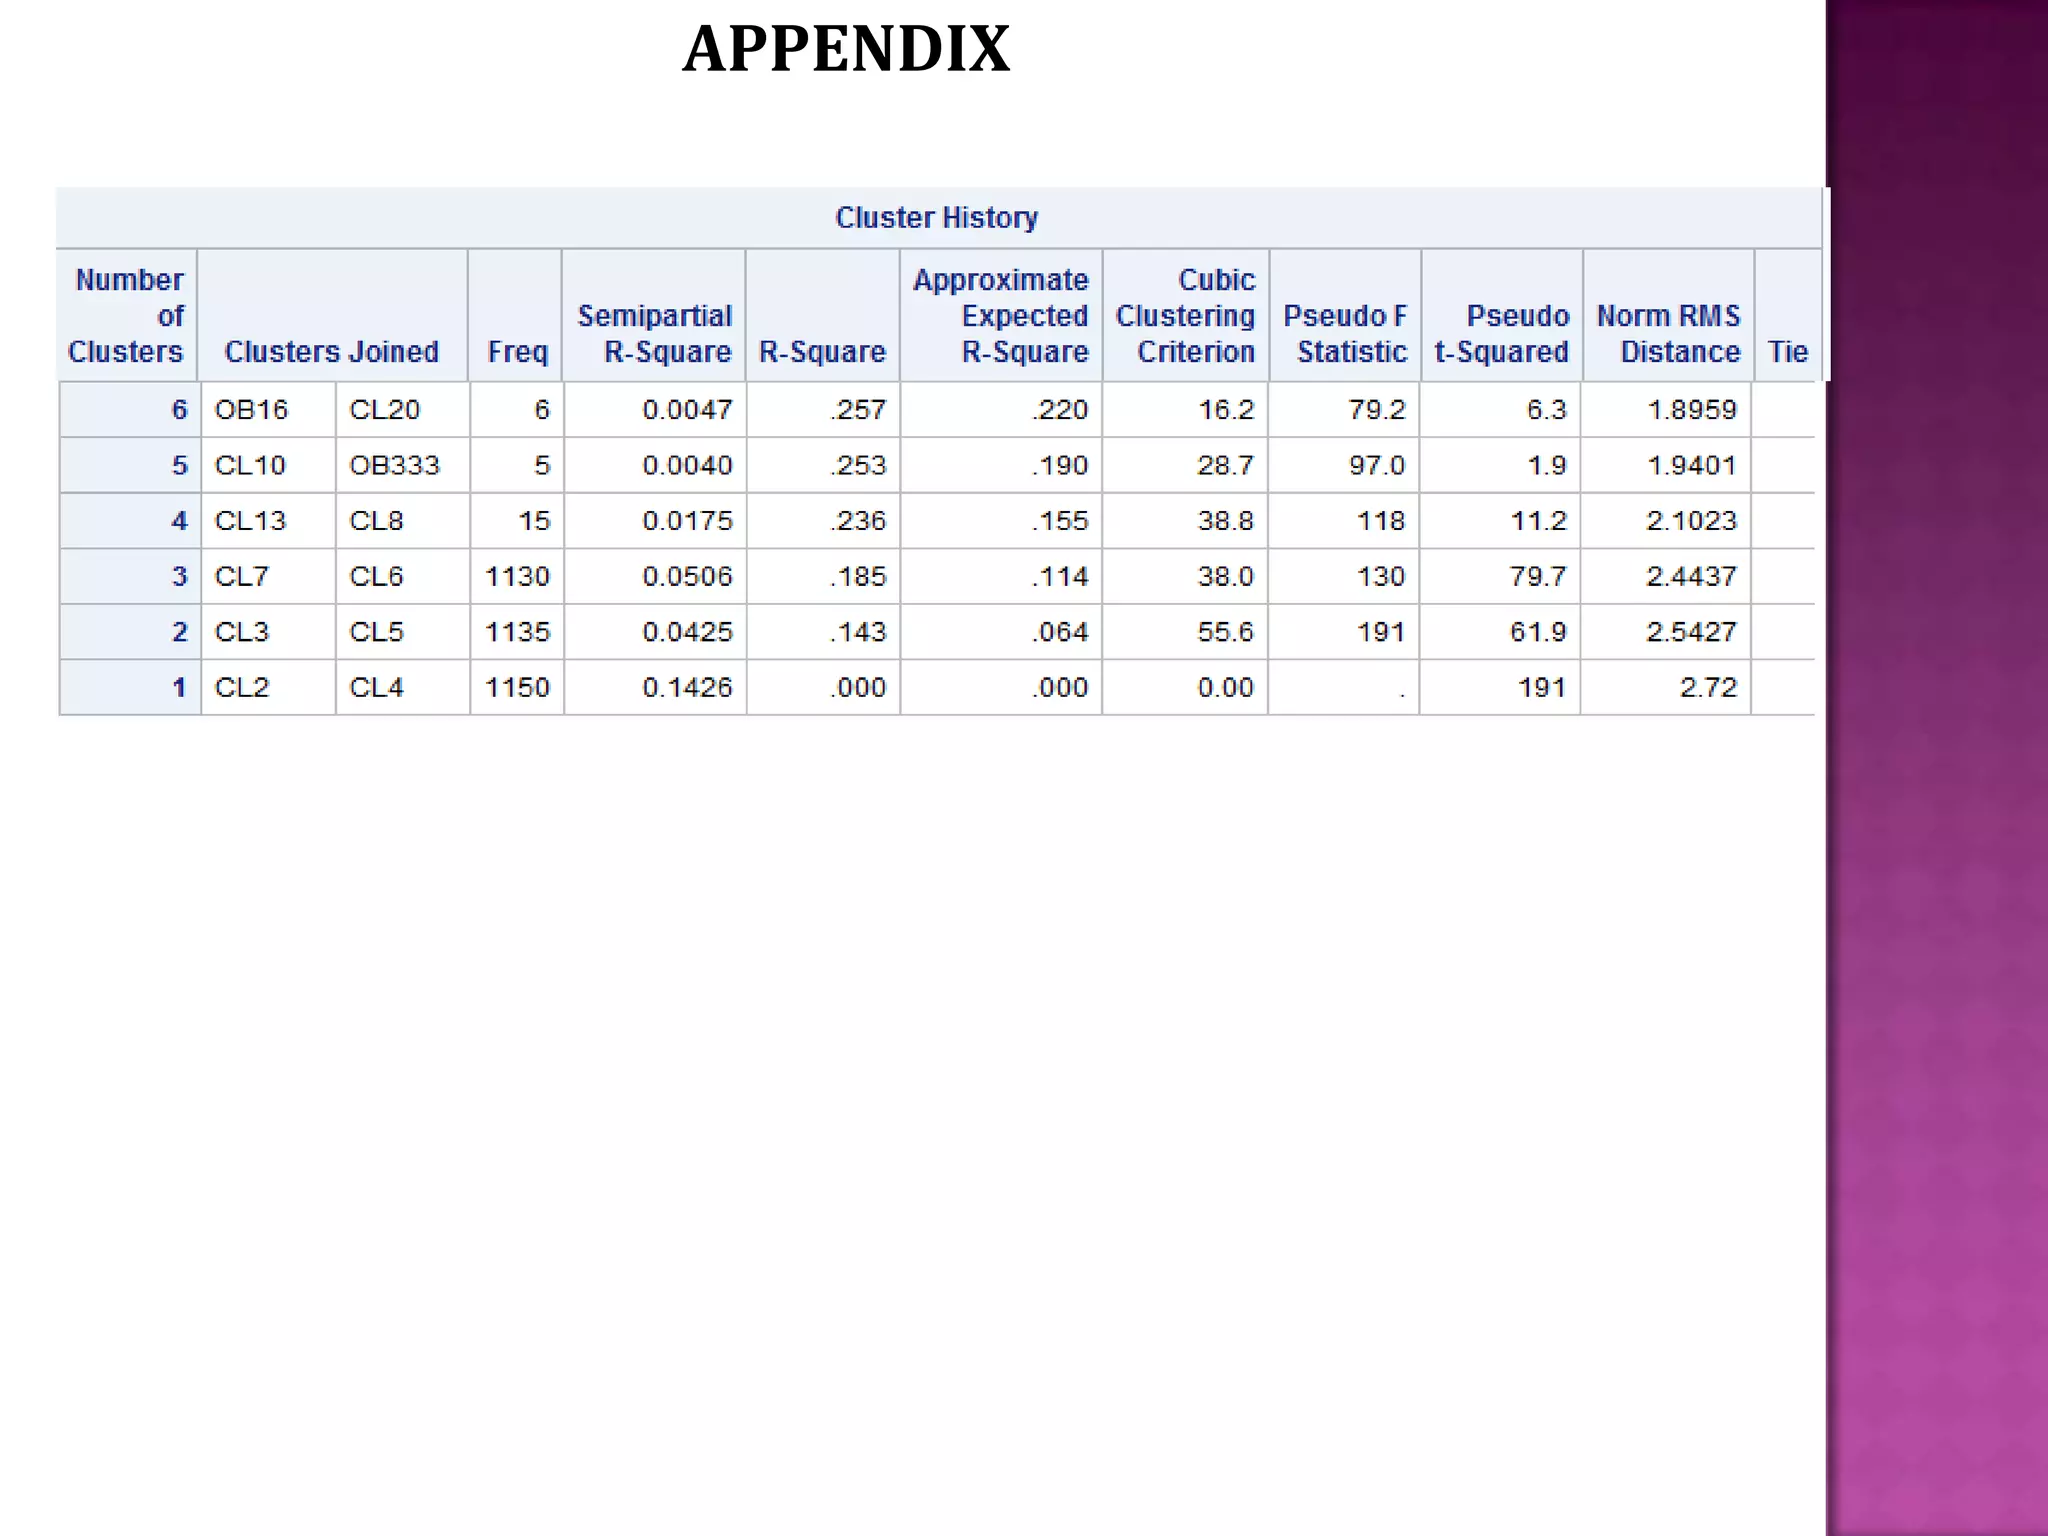
MARKET SEGMENTATION

Presented by
P Sunil Kumar (A13020)
Maruthi Nataraj K (A13009)
Praxis Business School, Kolkata
AGENDA
 Business background
 Objective
 Dataset
 Tools and Techniques
 Evaluation
 Analysis and Inferences
 Conclusions

 Future direction
BUSINESS BACKGROUND
 XYZ Surgical is the leading manufacturer, supplier and exporter of a
wide range of Orthopaedic Surgical Equipment.
 Orthopaedic Surgical Equipment
- Reasonable price
- Variety of options
 Products offered

- Bone plates
- Spinal system products
- Femur locking plates etc
 Products are manufactured under strictly quality control, sterile and
hygienic environment these are complete safe for these purposes.
 Have a list of satisfied and pleased customers based across major cities
in US market.
OBJECTIVE
 Business : To increase sales of
orthopaedic

equipment

from

XYZ

Surgical to hospitals in potential

markets of the United States.
 Analytical : To identify the hospitals’
segments with overall high sales. Then
look for hospitals within that segment
where the company sales are low.

 States identified are
California, Florida, Georgia and Texas.
DATASET
No of Variables – 19
No of Instances – 1150 (for states California (CA)
Florida (FL) ,Georgia (GA) and Texas (TX)

A teaching hospital is a hospital that
provides clinical education and training
to future and current
doctors, nurses, and other health
professionals, in addition to delivering
medical care to patients

Outpatient is one who is
not hospitalized
overnight but who visits a
hospital, clinic, or
associated facility for
diagnosis or treatment

A trauma centre is
a hospital equipped and staffed to
provide comprehensive emergency
medical services to patients
suffering traumatic injuries.

Inpatient Rehabilitation
Unit helps individuals who
have physical or cognitive
deficits to recover from
disease or injury
Ex: Brain, Spinal cord
Orthopedic injuries etc
DATASET
TOOLS AND TECHNIQUES
 Tools

 Technique
- Cluster Analysis
EVALUATION
Obtained using
Rapid Miner
X-means
EVALUATION
ANALYSIS AND INFERENCES
Cluster 0
 This is the segment where there the average sales is least with
lowest number of average operations and output patient visits.
 Even the average revenue from the inpatients is identified to
be lowest.
 Low average sales means that the hospitals in this segment
have few patients who would need our products. So, we are not
interested in them.

Type of Hospital units
100
80
60
40
20
0
TH

TRAUMA
CA

FL

GA

REHAB
TX
ANALYSIS AND INFERENCES
California has least average sales when though
the average no of operations are decent.

Cluster 0

Average Outpatient visits

Average Inpatient Revenue

25000

5000

20000

4000

15000

3000

10000

2000

5000

1000

0

0
CA

FL

GA

CA

TX

Average No of operations
in YR95
80
70
60
50
40
30
20
10
0

FL

GA

TX

Average Sales
35
30
25
20
15
10

5
0
HIP95
CA

KNEE95
FL

GA

TX

CA

FL

GA

TX
ANALYSIS AND INFERENCES
Cluster 1

Average Inpatient Revenue
10000

 This is a segment which has
got all the factors like no of
operations,
outpatient
visits, inpatient revenue etc
contributing to decent sales
(considering overall averages).

8000
6000
4000
2000
0
CA

Average Outpatient visits
160000
140000
120000
100000
80000
60000
40000
20000
0
CA

FL

GA

TX

FL

GA

TX
ANALYSIS AND INFERENCES
Cluster 1
In this segment, Texas
has least average sales
when though its average
no of operations are
higher.

Average no of operations
120
100
80
60
40
20
0
HIP96

KNEE96
CA

FL

GA

FEMUR96

Average Sales

TX
60
50
40
30
20
10
0
CA

FL

GA

TX
ANALYSIS AND INFERENCES
Cluster 2
 In this case, though it has highest number of outpatient visits
and administrative costs, we observe that average sales are not up
to the mark.
 It includes hospitals where most of them have trauma
units, teaching units and having highest average number of beds
also supports the same.
 One more aspect of this segments is that it has highest average
number of femur operations and also there is drop in number of
knee operations from YR95 to YR96.

 Decent revenues from inpatients hints towards being a potential
segment for equipment sales.
ANALYSIS AND INFERENCES
Cluster 3
 This particular segments has highest average sales where in
highest revenue from inpatients can be observed.
 Interestingly, majority of the hospitals here are teaching
hospitals.

 Greater number of hip and knee operations is also spotted.
No of hospitals with zero sales
6
5
4
3
2
1
0
CA

FL

GA

TX
CONCLUSIONS
From our analysis, we have chosen cluster 1 (segment) to increase
our sales because of following reasons :

 There has been a consistent demand for knee and hip
replacement implants in this segment contributing to the growth of
the market.
 As per the US census bureau, persons 65 years and
over, percent, 2012 in California ,Florida and Texas are 12%,18.2%
and 10.9% respectively leading most of them to opt for an
orthopaedic surgery due to osteoarthritis. There is a chance for

improvement of sales in hospitals where it is low in this cluster 1.
 California has been ranked as the most dangerous state for road
users in the US and also the incidence rate of sports injuries in the
younger population is growing across all other states.
CONCLUSIONS
 These states are witnessing the continued adoption of
innovative, premium-priced devices which is favourable factor for

increase in sales.
 Also , according to the American Academy of Orthopaedic
Surgeons, approximately 28.6 million people in the United States
sustain some type of musculoskeletal injury annually which is high
in these cities and will eventually trigger the necessity of quality
surgical equipments.
FUTURE DIRECTION
Dimension Reduction using
Factor Analysis

Fine Tuning of Cluster
Analysis using optimized
parameters
Regression Analysis to
determine the drivers for
sales
APPENDIX
APPENDIX
APPENDIX
Communality value for OUTV,TH and TRAUMA < 0.4.So,they are dropped.
(They are not contributing to formation of factors)
APPENDIX
APPENDIX
REFERENCES
 http://www.rci.rutgers.edu/~cabrera/sc/cs8/cs8.html

 www.nesug.org/Proceedings/nesug11/sa/sa11.pdf
Hospital Market Segmentation using Cluster Analysis

Hospital Market Segmentation using Cluster Analysis

  • 1.
    MARKET SEGMENTATION Presented by PSunil Kumar (A13020) Maruthi Nataraj K (A13009) Praxis Business School, Kolkata
  • 2.
    AGENDA  Business background Objective  Dataset  Tools and Techniques  Evaluation  Analysis and Inferences  Conclusions  Future direction
  • 3.
    BUSINESS BACKGROUND  XYZSurgical is the leading manufacturer, supplier and exporter of a wide range of Orthopaedic Surgical Equipment.  Orthopaedic Surgical Equipment - Reasonable price - Variety of options  Products offered - Bone plates - Spinal system products - Femur locking plates etc  Products are manufactured under strictly quality control, sterile and hygienic environment these are complete safe for these purposes.  Have a list of satisfied and pleased customers based across major cities in US market.
  • 4.
    OBJECTIVE  Business :To increase sales of orthopaedic equipment from XYZ Surgical to hospitals in potential markets of the United States.  Analytical : To identify the hospitals’ segments with overall high sales. Then look for hospitals within that segment where the company sales are low.  States identified are California, Florida, Georgia and Texas.
  • 5.
    DATASET No of Variables– 19 No of Instances – 1150 (for states California (CA) Florida (FL) ,Georgia (GA) and Texas (TX) A teaching hospital is a hospital that provides clinical education and training to future and current doctors, nurses, and other health professionals, in addition to delivering medical care to patients Outpatient is one who is not hospitalized overnight but who visits a hospital, clinic, or associated facility for diagnosis or treatment A trauma centre is a hospital equipped and staffed to provide comprehensive emergency medical services to patients suffering traumatic injuries. Inpatient Rehabilitation Unit helps individuals who have physical or cognitive deficits to recover from disease or injury Ex: Brain, Spinal cord Orthopedic injuries etc
  • 6.
  • 7.
    TOOLS AND TECHNIQUES Tools  Technique - Cluster Analysis
  • 8.
  • 9.
  • 10.
    ANALYSIS AND INFERENCES Cluster0  This is the segment where there the average sales is least with lowest number of average operations and output patient visits.  Even the average revenue from the inpatients is identified to be lowest.  Low average sales means that the hospitals in this segment have few patients who would need our products. So, we are not interested in them. Type of Hospital units 100 80 60 40 20 0 TH TRAUMA CA FL GA REHAB TX
  • 11.
    ANALYSIS AND INFERENCES Californiahas least average sales when though the average no of operations are decent. Cluster 0 Average Outpatient visits Average Inpatient Revenue 25000 5000 20000 4000 15000 3000 10000 2000 5000 1000 0 0 CA FL GA CA TX Average No of operations in YR95 80 70 60 50 40 30 20 10 0 FL GA TX Average Sales 35 30 25 20 15 10 5 0 HIP95 CA KNEE95 FL GA TX CA FL GA TX
  • 12.
    ANALYSIS AND INFERENCES Cluster1 Average Inpatient Revenue 10000  This is a segment which has got all the factors like no of operations, outpatient visits, inpatient revenue etc contributing to decent sales (considering overall averages). 8000 6000 4000 2000 0 CA Average Outpatient visits 160000 140000 120000 100000 80000 60000 40000 20000 0 CA FL GA TX FL GA TX
  • 13.
    ANALYSIS AND INFERENCES Cluster1 In this segment, Texas has least average sales when though its average no of operations are higher. Average no of operations 120 100 80 60 40 20 0 HIP96 KNEE96 CA FL GA FEMUR96 Average Sales TX 60 50 40 30 20 10 0 CA FL GA TX
  • 14.
    ANALYSIS AND INFERENCES Cluster2  In this case, though it has highest number of outpatient visits and administrative costs, we observe that average sales are not up to the mark.  It includes hospitals where most of them have trauma units, teaching units and having highest average number of beds also supports the same.  One more aspect of this segments is that it has highest average number of femur operations and also there is drop in number of knee operations from YR95 to YR96.  Decent revenues from inpatients hints towards being a potential segment for equipment sales.
  • 15.
    ANALYSIS AND INFERENCES Cluster3  This particular segments has highest average sales where in highest revenue from inpatients can be observed.  Interestingly, majority of the hospitals here are teaching hospitals.  Greater number of hip and knee operations is also spotted. No of hospitals with zero sales 6 5 4 3 2 1 0 CA FL GA TX
  • 16.
    CONCLUSIONS From our analysis,we have chosen cluster 1 (segment) to increase our sales because of following reasons :  There has been a consistent demand for knee and hip replacement implants in this segment contributing to the growth of the market.  As per the US census bureau, persons 65 years and over, percent, 2012 in California ,Florida and Texas are 12%,18.2% and 10.9% respectively leading most of them to opt for an orthopaedic surgery due to osteoarthritis. There is a chance for improvement of sales in hospitals where it is low in this cluster 1.  California has been ranked as the most dangerous state for road users in the US and also the incidence rate of sports injuries in the younger population is growing across all other states.
  • 17.
    CONCLUSIONS  These statesare witnessing the continued adoption of innovative, premium-priced devices which is favourable factor for increase in sales.  Also , according to the American Academy of Orthopaedic Surgeons, approximately 28.6 million people in the United States sustain some type of musculoskeletal injury annually which is high in these cities and will eventually trigger the necessity of quality surgical equipments.
  • 18.
    FUTURE DIRECTION Dimension Reductionusing Factor Analysis Fine Tuning of Cluster Analysis using optimized parameters Regression Analysis to determine the drivers for sales
  • 19.
  • 20.
  • 21.
    APPENDIX Communality value forOUTV,TH and TRAUMA < 0.4.So,they are dropped. (They are not contributing to formation of factors)
  • 22.
  • 23.
  • 24.