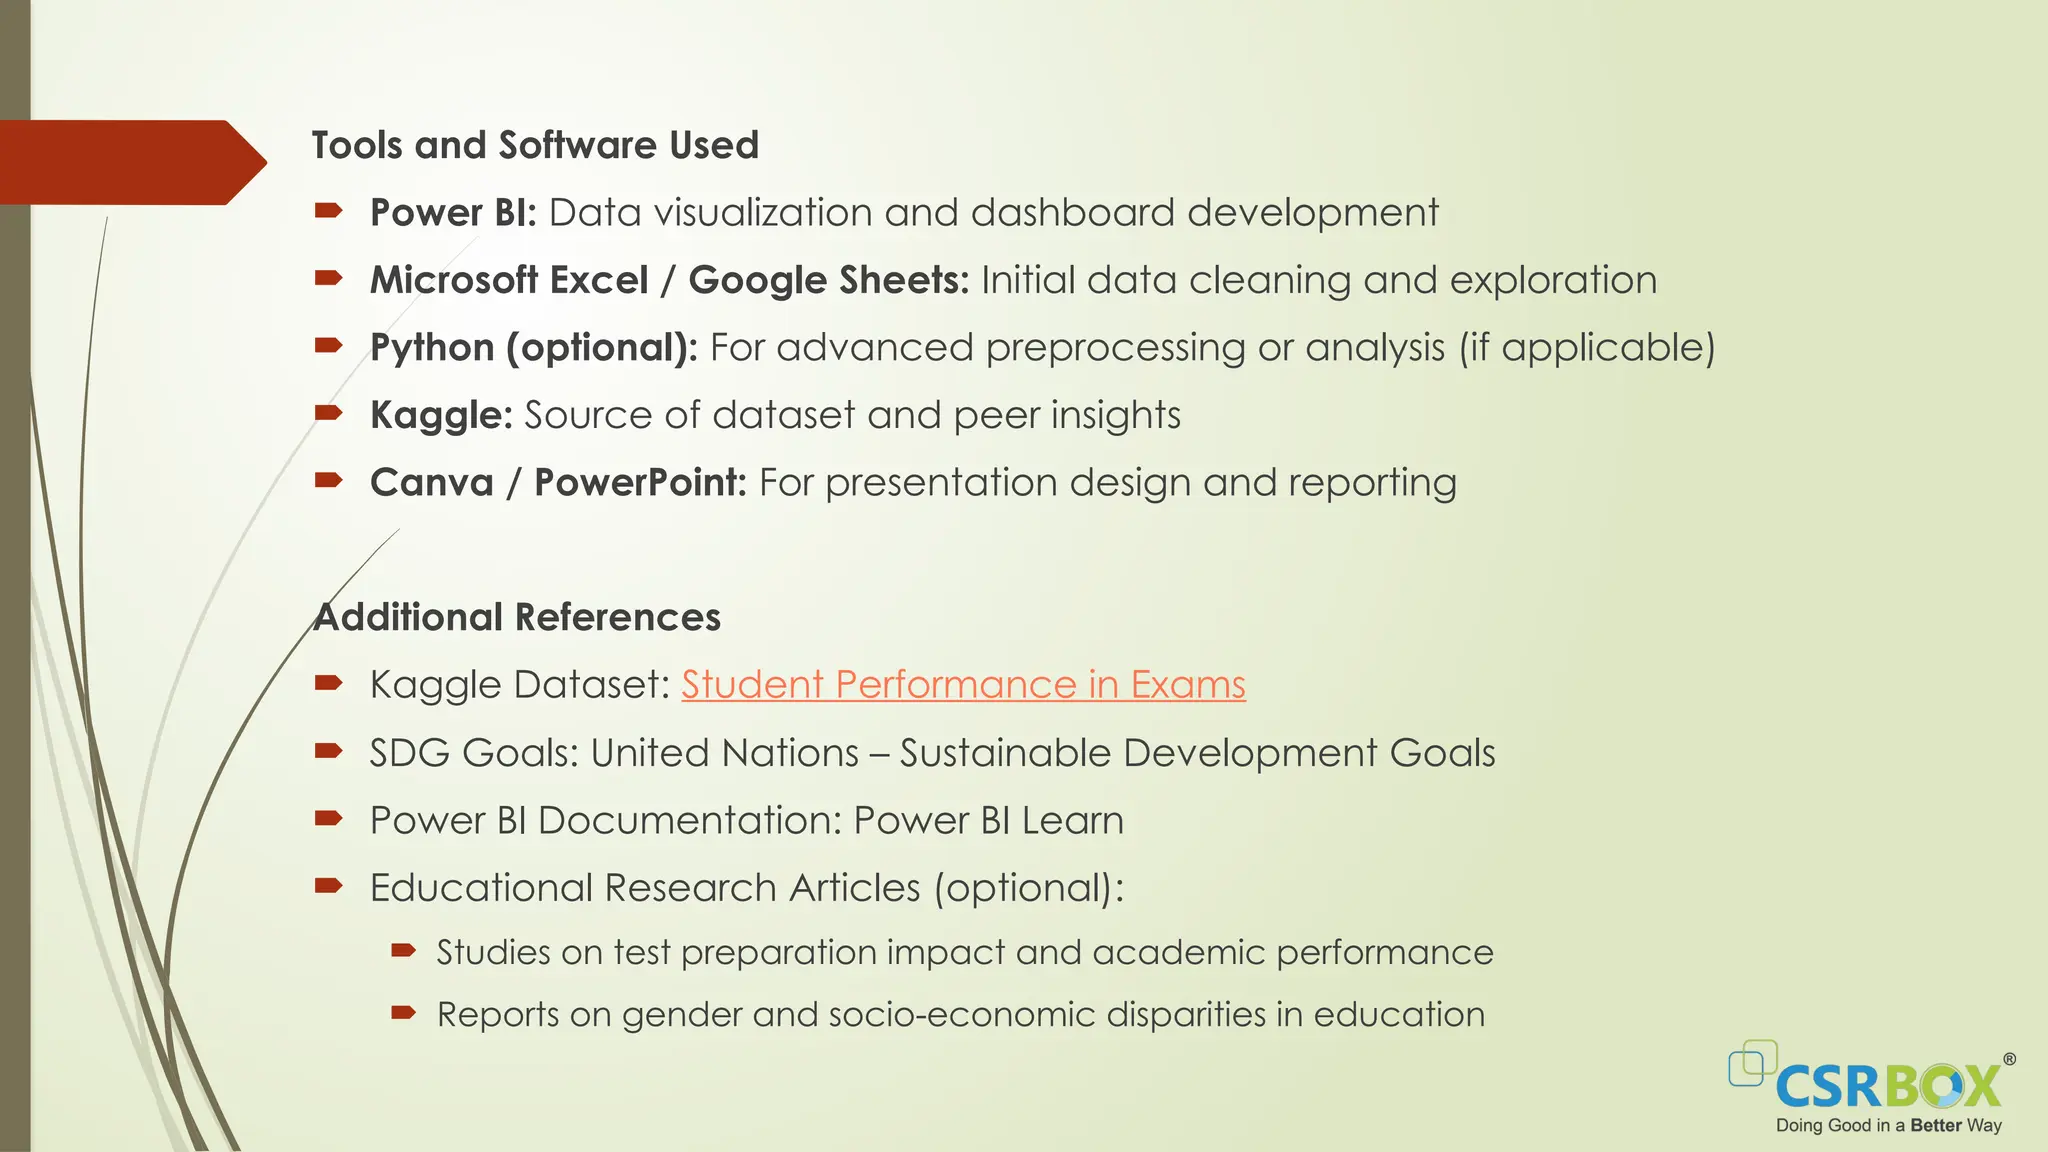
IBM SkillsBuild Decoding Data PBL Program 2025
Final Project Presentation
Project Name: Student Performance Analysis
Team Name: DecodeX
College Name: College of Technology And Engineering, Udaipur
Team Members
Team Leader:
Name: Arriyaan Ali Syed
College: C.T.A.E., Udaipur
Team Member-1:
Name: Harsh Nagori
College: C.T.A.E., Udaipur
Team Member-2:
Name: Naman Yadav
College: C.T.A.E., Udaipur
Team Member-3:
Name: Prem Saini
College: C.T.A.E., Udaipur
Project Overview: Student Performance Analysis
Objective:
Analyze student academic performance across subjects (Math, Reading,
Writing) to identify trends based on gender, parental education, lunch type,
and test preparation.
Key Tasks:
 Cleaned and prepared the dataset
 Calculated average, highest, and lowest scores
 Created bar/column charts for subject and gender comparisons
 Added slicers for interactive filtering (class, gender, etc.)
Tools & Data:
Power BI | Dataset from Kaggle
Outcome:
An interactive Power BI dashboard visualizing performance by subject, class,
gender, and other key demographics.
Problem Statement
There is limited visibility into how various socio-demographic factors—such as gender, parental
education, lunch type, and test preparation—impact student academic performance. This lack of
insight can hinder targeted educational improvements and policy decisions.
Significance of the Problem
 Understanding performance patterns helps educators and policymakers:
 Identify achievement gaps
 Provide focused support to underperforming groups
 Promote data-driven educational reforms
 Enhance student outcomes and equality in learning opportunities
Relevant Sustainable Development Goals (SDGs)
 🎯SDG 4: Quality Education
Ensure inclusive and equitable quality education and promote lifelong learning opportunities for
all.
 🎯SDG 5: Gender Equality
Achieve gender equality and empower all women and girls by identifying and addressing
gender-based disparities in education.
Sources of Data
 Publicly available dataset from Kaggle.
 Provided by SPSScientist, based on simulated yet realistic student exam data.
Data Description
 Total Records: 1,000 students.
 Features:
1. Gender.
2. Race/ethnicity.
3. Parental level of education.
4. Lunch type (standard/free).
5. Test preparation course (completed/not completed).
6. Scores in Math, Reading, and Writing (0–100).
Data Collection Methods
 Dataset is synthetically generated for research/educational use.
 Designed to simulate real-world student performance and demographic patterns.
 No personally identifiable data; fully anonymized and open-source.
Data Cleaning Methods
 Checked for duplicate records and removed any redundancies
 Standardized categorical values (e.g., consistent capitalization)
 Renamed columns for clarity and consistency (e.g., "parental level of education" →
"Parental_Education")
Handling Missing Values
 Verified dataset completeness (no missing values in original dataset)
 In case of missing values in future/extended datasets:
1. Numerical Data: Impute using mean or median
2. Categorical Data: Fill with mode or use "Unknown" category
Data Transformation Techniques
 Converted categorical variables (e.g., gender, lunch type) into numerical codes for analysis
 Created derived fields (e.g., total score, average score)
 Binned score ranges for easier visual grouping (e.g., 0–50: Low, 51–75: Medium, 76–100: High)
Analytical Tools and Methods Used
 Power BI for data visualization and dashboard creation
 Descriptive statistics to calculate average, highest, and lowest scores
 Bar and column charts for comparing subject-wise and gender-based performance
 Slicers for interactive filtering by gender, class, lunch type, etc.
Key Findings
 Students who completed test preparation scored significantly higher
 Male students performed better in Math, while females excelled in Reading and
Writing
 Higher parental education levels correlated with better student performance
 Students with standard lunch outperformed those with free/reduced lunch
Insights Derived
 Academic outcomes are strongly influenced by socio-demographic factors
 Targeted support (like test prep) can bridge performance gaps
 Gender-specific strengths suggest areas for tailored teaching strategies
 School lunch programs may indicate broader socioeconomic impact on education
Formulated Hypothesis
 Students who complete a test preparation course achieve higher average scores
across all subjects compared to those who do not.
Rationale Behind the Hypothesis
 Test preparation provides structured revision and exam strategies
 Students gain confidence and familiarity with exam formats
 Prior studies and observed trends suggest a positive impact on performance
Method for Testing the Hypothesis
 Grouped students based on test preparation status (completed vs. none)
 Calculated and compared average Math, Reading, and Writing scores for both groups
 Used visualizations (bar charts) and summary statistics in Power BI to evaluate
differences
 Considered additional factors like gender and parental education to ensure robustness
Proposed Solution
 Develop an interactive Power BI dashboard that visualizes student performance trends by
subject, gender, and socio-demographic factors. This will support data-driven decisions in
education policy and classroom strategies.
Implementation Plan
 Data Preparation: Clean and structure the dataset
 Analysis: Calculate key metrics (average, max, min scores)
 Dashboard Creation: Build visuals (bar/column charts, filters) in Power BI
 Deployment: Share dashboard with educators and decision-makers for actionable insights
Alignment with SDGs
 🎯 SDG 4 – Quality Education:
Promotes inclusive, data-informed learning interventions
 🎯 SDG 5 – Gender Equality:
Highlights gender-based academic patterns to address disparities
 🎯 SDG 10 – Reduced Inequalities:
Supports equitable education by identifying impacts of socio-economic factors
Prominent Features of the Platform (Power BI Dashboard)
1. Interactive Visualizations: Bar and column charts for subject, gender, and class performance
2. Slicers/Filters: Dynamic filtering by gender, parental education, lunch type, and test preparation
3. Score Breakdown: Average, highest, and lowest scores by subject
4. Comparative Insights: Side-by-side comparisons of different demographic groups
5. User-Friendly Interface: Clean layout for easy navigation and interpretation
Site Map / Dashboard Layout
6. Home Page / Overview
 Summary of dataset and performance metrics
7. Subject Performance Page
 Visuals for Math, Reading, Writing scores
8. Demographic Analysis Page
 Filters and charts by gender, lunch type, parental education
9. Test Preparation Impact Page
 Comparison between students with/without prep
10. Insights & Recommendations Page
 Key takeaways and suggested interventions
Screenshots of the Dashboard
Impact of the Proposed Solution
 Enables data-driven decision-making in education
 Identifies underperforming student groups for targeted support
 Helps schools/policymakers allocate resources more effectively
 Promotes equity and transparency in academic performance tracking
Future Work
 Integrate real-time data from school systems for ongoing monitoring
 Include predictive analytics to forecast student performance
 Expand to analyze additional factors like attendance, teacher experience, or
curriculum
 Build custom dashboards for schools or districts based on their specific needs
Tools and Software Used
 Power BI: Data visualization and dashboard development
 Microsoft Excel / Google Sheets: Initial data cleaning and exploration
 Python (optional): For advanced preprocessing or analysis (if applicable)
 Kaggle: Source of dataset and peer insights
 Canva / PowerPoint: For presentation design and reporting
Additional References
 Kaggle Dataset: Student Performance in Exams
 SDG Goals: United Nations – Sustainable Development Goals
 Power BI Documentation: Power BI Learn
 Educational Research Articles (optional):
 Studies on test preparation impact and academic performance
 Reports on gender and socio-economic disparities in education
Thank You

IBM SkillsBuild Decoding Data PBL Program 2025.pptx

  • 1.
    IBM SkillsBuild DecodingData PBL Program 2025 Final Project Presentation Project Name: Student Performance Analysis Team Name: DecodeX College Name: College of Technology And Engineering, Udaipur
  • 2.
    Team Members Team Leader: Name:Arriyaan Ali Syed College: C.T.A.E., Udaipur Team Member-1: Name: Harsh Nagori College: C.T.A.E., Udaipur Team Member-2: Name: Naman Yadav College: C.T.A.E., Udaipur Team Member-3: Name: Prem Saini College: C.T.A.E., Udaipur
  • 3.
    Project Overview: StudentPerformance Analysis Objective: Analyze student academic performance across subjects (Math, Reading, Writing) to identify trends based on gender, parental education, lunch type, and test preparation. Key Tasks:  Cleaned and prepared the dataset  Calculated average, highest, and lowest scores  Created bar/column charts for subject and gender comparisons  Added slicers for interactive filtering (class, gender, etc.) Tools & Data: Power BI | Dataset from Kaggle Outcome: An interactive Power BI dashboard visualizing performance by subject, class, gender, and other key demographics.
  • 4.
    Problem Statement There islimited visibility into how various socio-demographic factors—such as gender, parental education, lunch type, and test preparation—impact student academic performance. This lack of insight can hinder targeted educational improvements and policy decisions. Significance of the Problem  Understanding performance patterns helps educators and policymakers:  Identify achievement gaps  Provide focused support to underperforming groups  Promote data-driven educational reforms  Enhance student outcomes and equality in learning opportunities Relevant Sustainable Development Goals (SDGs)  🎯SDG 4: Quality Education Ensure inclusive and equitable quality education and promote lifelong learning opportunities for all.  🎯SDG 5: Gender Equality Achieve gender equality and empower all women and girls by identifying and addressing gender-based disparities in education.
  • 5.
    Sources of Data Publicly available dataset from Kaggle.  Provided by SPSScientist, based on simulated yet realistic student exam data. Data Description  Total Records: 1,000 students.  Features: 1. Gender. 2. Race/ethnicity. 3. Parental level of education. 4. Lunch type (standard/free). 5. Test preparation course (completed/not completed). 6. Scores in Math, Reading, and Writing (0–100). Data Collection Methods  Dataset is synthetically generated for research/educational use.  Designed to simulate real-world student performance and demographic patterns.  No personally identifiable data; fully anonymized and open-source.
  • 6.
    Data Cleaning Methods Checked for duplicate records and removed any redundancies  Standardized categorical values (e.g., consistent capitalization)  Renamed columns for clarity and consistency (e.g., "parental level of education" → "Parental_Education") Handling Missing Values  Verified dataset completeness (no missing values in original dataset)  In case of missing values in future/extended datasets: 1. Numerical Data: Impute using mean or median 2. Categorical Data: Fill with mode or use "Unknown" category Data Transformation Techniques  Converted categorical variables (e.g., gender, lunch type) into numerical codes for analysis  Created derived fields (e.g., total score, average score)  Binned score ranges for easier visual grouping (e.g., 0–50: Low, 51–75: Medium, 76–100: High)
  • 7.
    Analytical Tools andMethods Used  Power BI for data visualization and dashboard creation  Descriptive statistics to calculate average, highest, and lowest scores  Bar and column charts for comparing subject-wise and gender-based performance  Slicers for interactive filtering by gender, class, lunch type, etc. Key Findings  Students who completed test preparation scored significantly higher  Male students performed better in Math, while females excelled in Reading and Writing  Higher parental education levels correlated with better student performance  Students with standard lunch outperformed those with free/reduced lunch Insights Derived  Academic outcomes are strongly influenced by socio-demographic factors  Targeted support (like test prep) can bridge performance gaps  Gender-specific strengths suggest areas for tailored teaching strategies  School lunch programs may indicate broader socioeconomic impact on education
  • 8.
    Formulated Hypothesis  Studentswho complete a test preparation course achieve higher average scores across all subjects compared to those who do not. Rationale Behind the Hypothesis  Test preparation provides structured revision and exam strategies  Students gain confidence and familiarity with exam formats  Prior studies and observed trends suggest a positive impact on performance Method for Testing the Hypothesis  Grouped students based on test preparation status (completed vs. none)  Calculated and compared average Math, Reading, and Writing scores for both groups  Used visualizations (bar charts) and summary statistics in Power BI to evaluate differences  Considered additional factors like gender and parental education to ensure robustness
  • 9.
    Proposed Solution  Developan interactive Power BI dashboard that visualizes student performance trends by subject, gender, and socio-demographic factors. This will support data-driven decisions in education policy and classroom strategies. Implementation Plan  Data Preparation: Clean and structure the dataset  Analysis: Calculate key metrics (average, max, min scores)  Dashboard Creation: Build visuals (bar/column charts, filters) in Power BI  Deployment: Share dashboard with educators and decision-makers for actionable insights Alignment with SDGs  🎯 SDG 4 – Quality Education: Promotes inclusive, data-informed learning interventions  🎯 SDG 5 – Gender Equality: Highlights gender-based academic patterns to address disparities  🎯 SDG 10 – Reduced Inequalities: Supports equitable education by identifying impacts of socio-economic factors
  • 10.
    Prominent Features ofthe Platform (Power BI Dashboard) 1. Interactive Visualizations: Bar and column charts for subject, gender, and class performance 2. Slicers/Filters: Dynamic filtering by gender, parental education, lunch type, and test preparation 3. Score Breakdown: Average, highest, and lowest scores by subject 4. Comparative Insights: Side-by-side comparisons of different demographic groups 5. User-Friendly Interface: Clean layout for easy navigation and interpretation Site Map / Dashboard Layout 6. Home Page / Overview  Summary of dataset and performance metrics 7. Subject Performance Page  Visuals for Math, Reading, Writing scores 8. Demographic Analysis Page  Filters and charts by gender, lunch type, parental education 9. Test Preparation Impact Page  Comparison between students with/without prep 10. Insights & Recommendations Page  Key takeaways and suggested interventions
  • 11.
  • 12.
    Impact of theProposed Solution  Enables data-driven decision-making in education  Identifies underperforming student groups for targeted support  Helps schools/policymakers allocate resources more effectively  Promotes equity and transparency in academic performance tracking Future Work  Integrate real-time data from school systems for ongoing monitoring  Include predictive analytics to forecast student performance  Expand to analyze additional factors like attendance, teacher experience, or curriculum  Build custom dashboards for schools or districts based on their specific needs
  • 13.
    Tools and SoftwareUsed  Power BI: Data visualization and dashboard development  Microsoft Excel / Google Sheets: Initial data cleaning and exploration  Python (optional): For advanced preprocessing or analysis (if applicable)  Kaggle: Source of dataset and peer insights  Canva / PowerPoint: For presentation design and reporting Additional References  Kaggle Dataset: Student Performance in Exams  SDG Goals: United Nations – Sustainable Development Goals  Power BI Documentation: Power BI Learn  Educational Research Articles (optional):  Studies on test preparation impact and academic performance  Reports on gender and socio-economic disparities in education
  • 14.