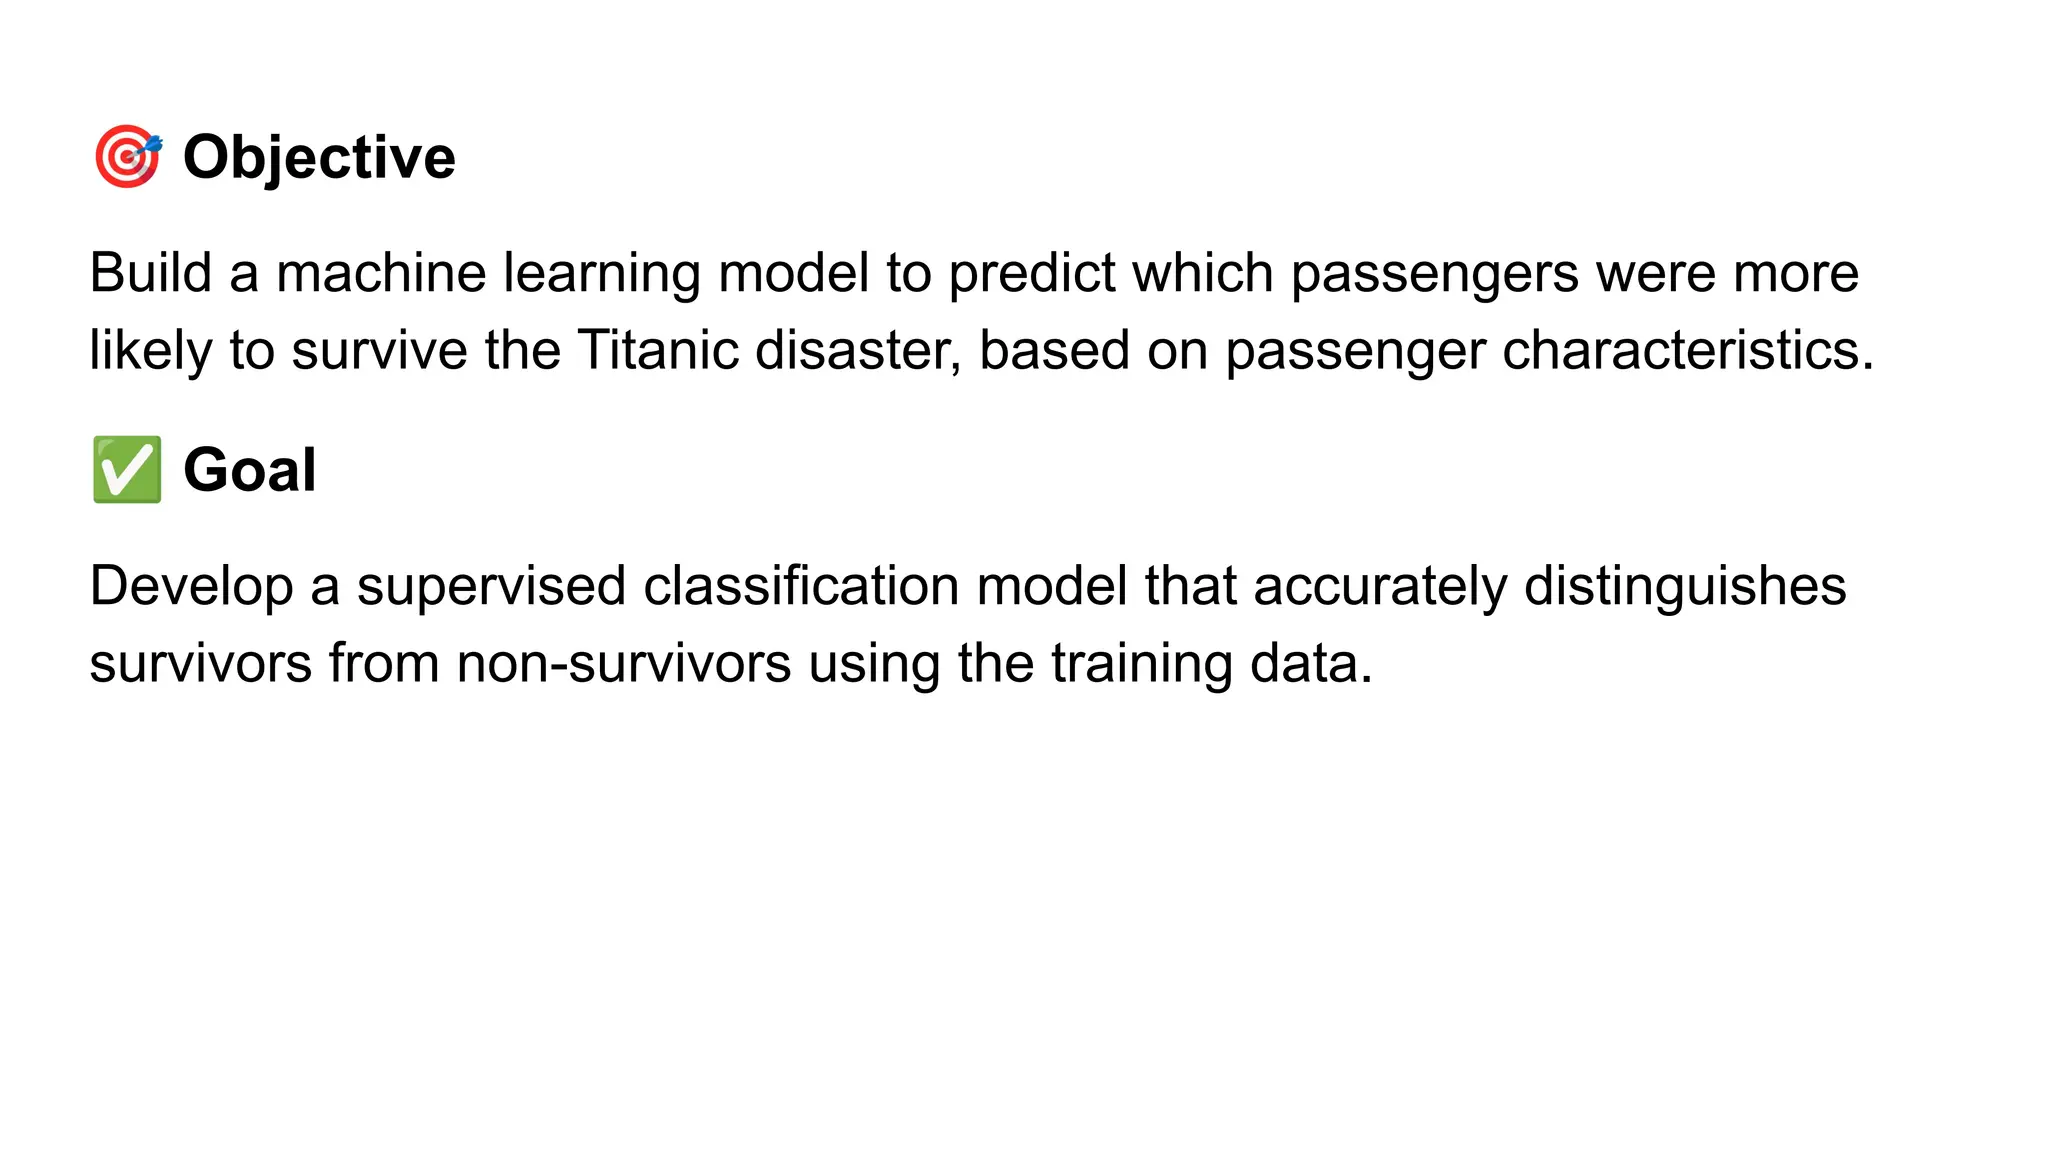
🎯 Objective
Build amachine learning model to predict which passengers were more
likely to survive the Titanic disaster, based on passenger characteristics.
✅ Goal
Develop a supervised classification model that accurately distinguishes
survivors from non-survivors using the training data.
3.
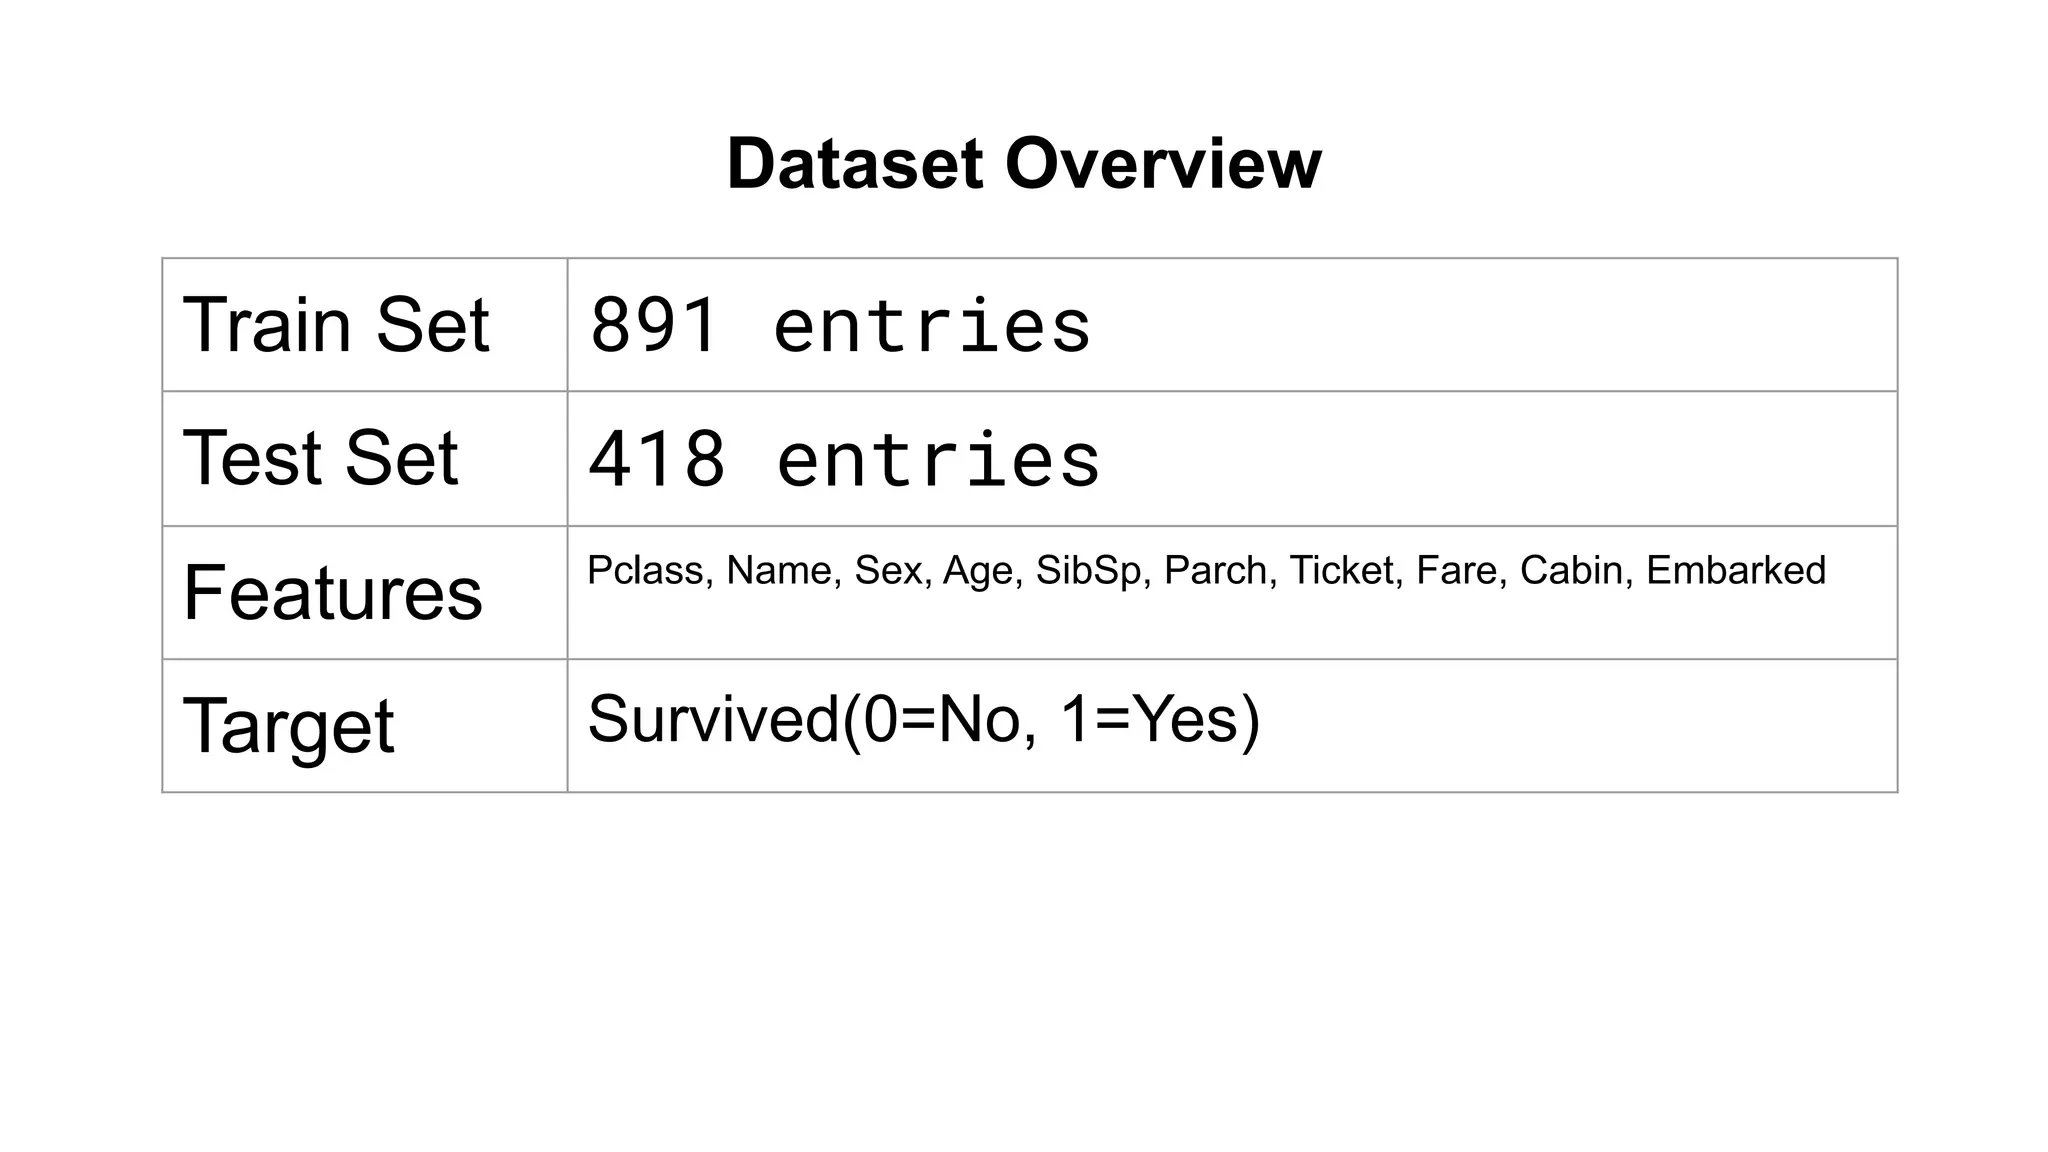
Dataset Overview
Train Set891 entries
Test Set 418 entries
Features Pclass, Name, Sex, Age, SibSp, Parch, Ticket, Fare, Cabin, Embarked
Target Survived(0=No, 1=Yes)
4.
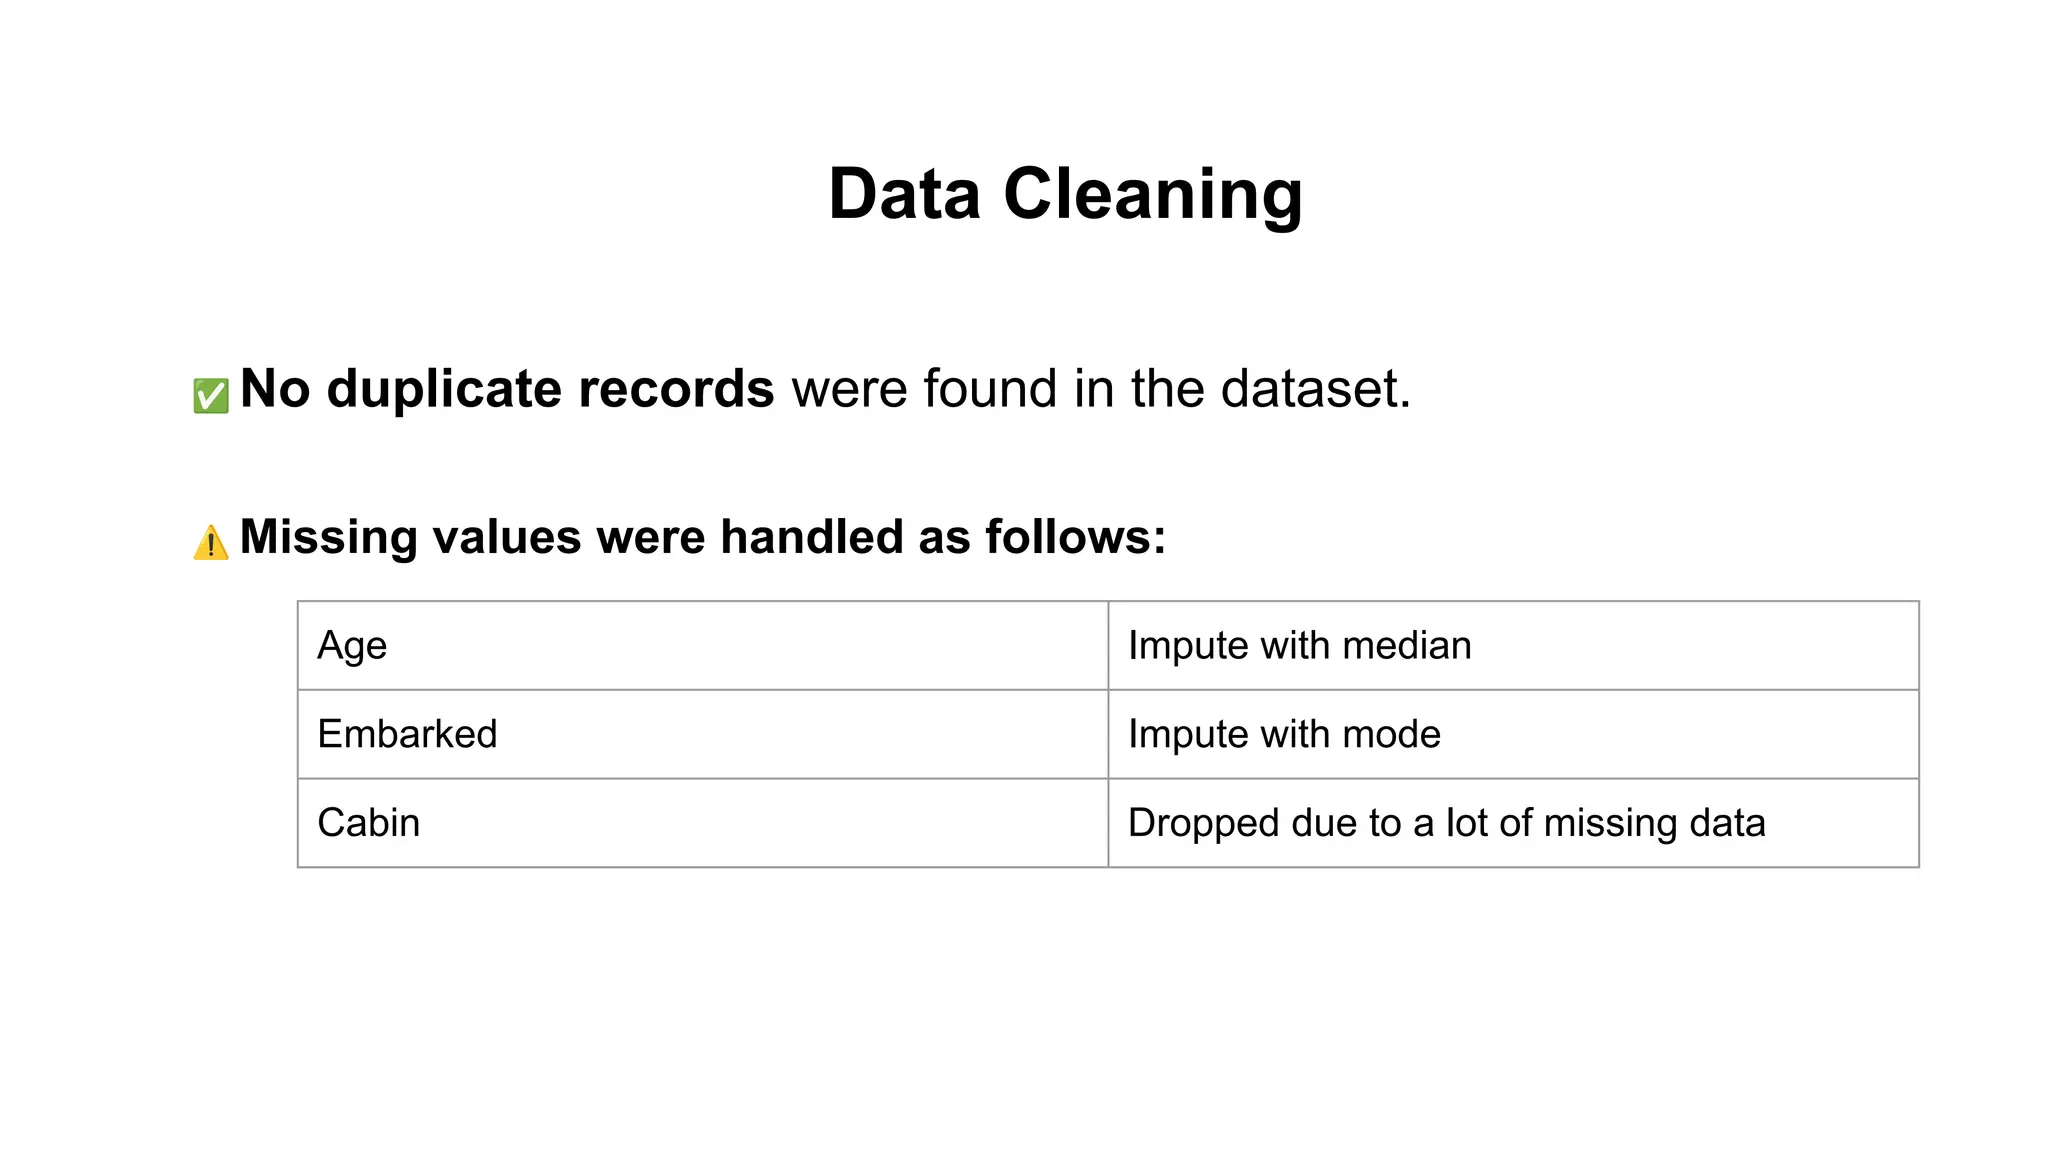
Data Cleaning
✅ Noduplicate records were found in the dataset.
⚠ Missing values were handled as follows:
Age Impute with median
Embarked Impute with mode
Cabin Dropped due to a lot of missing data
5.
Exploratory Data Analysis
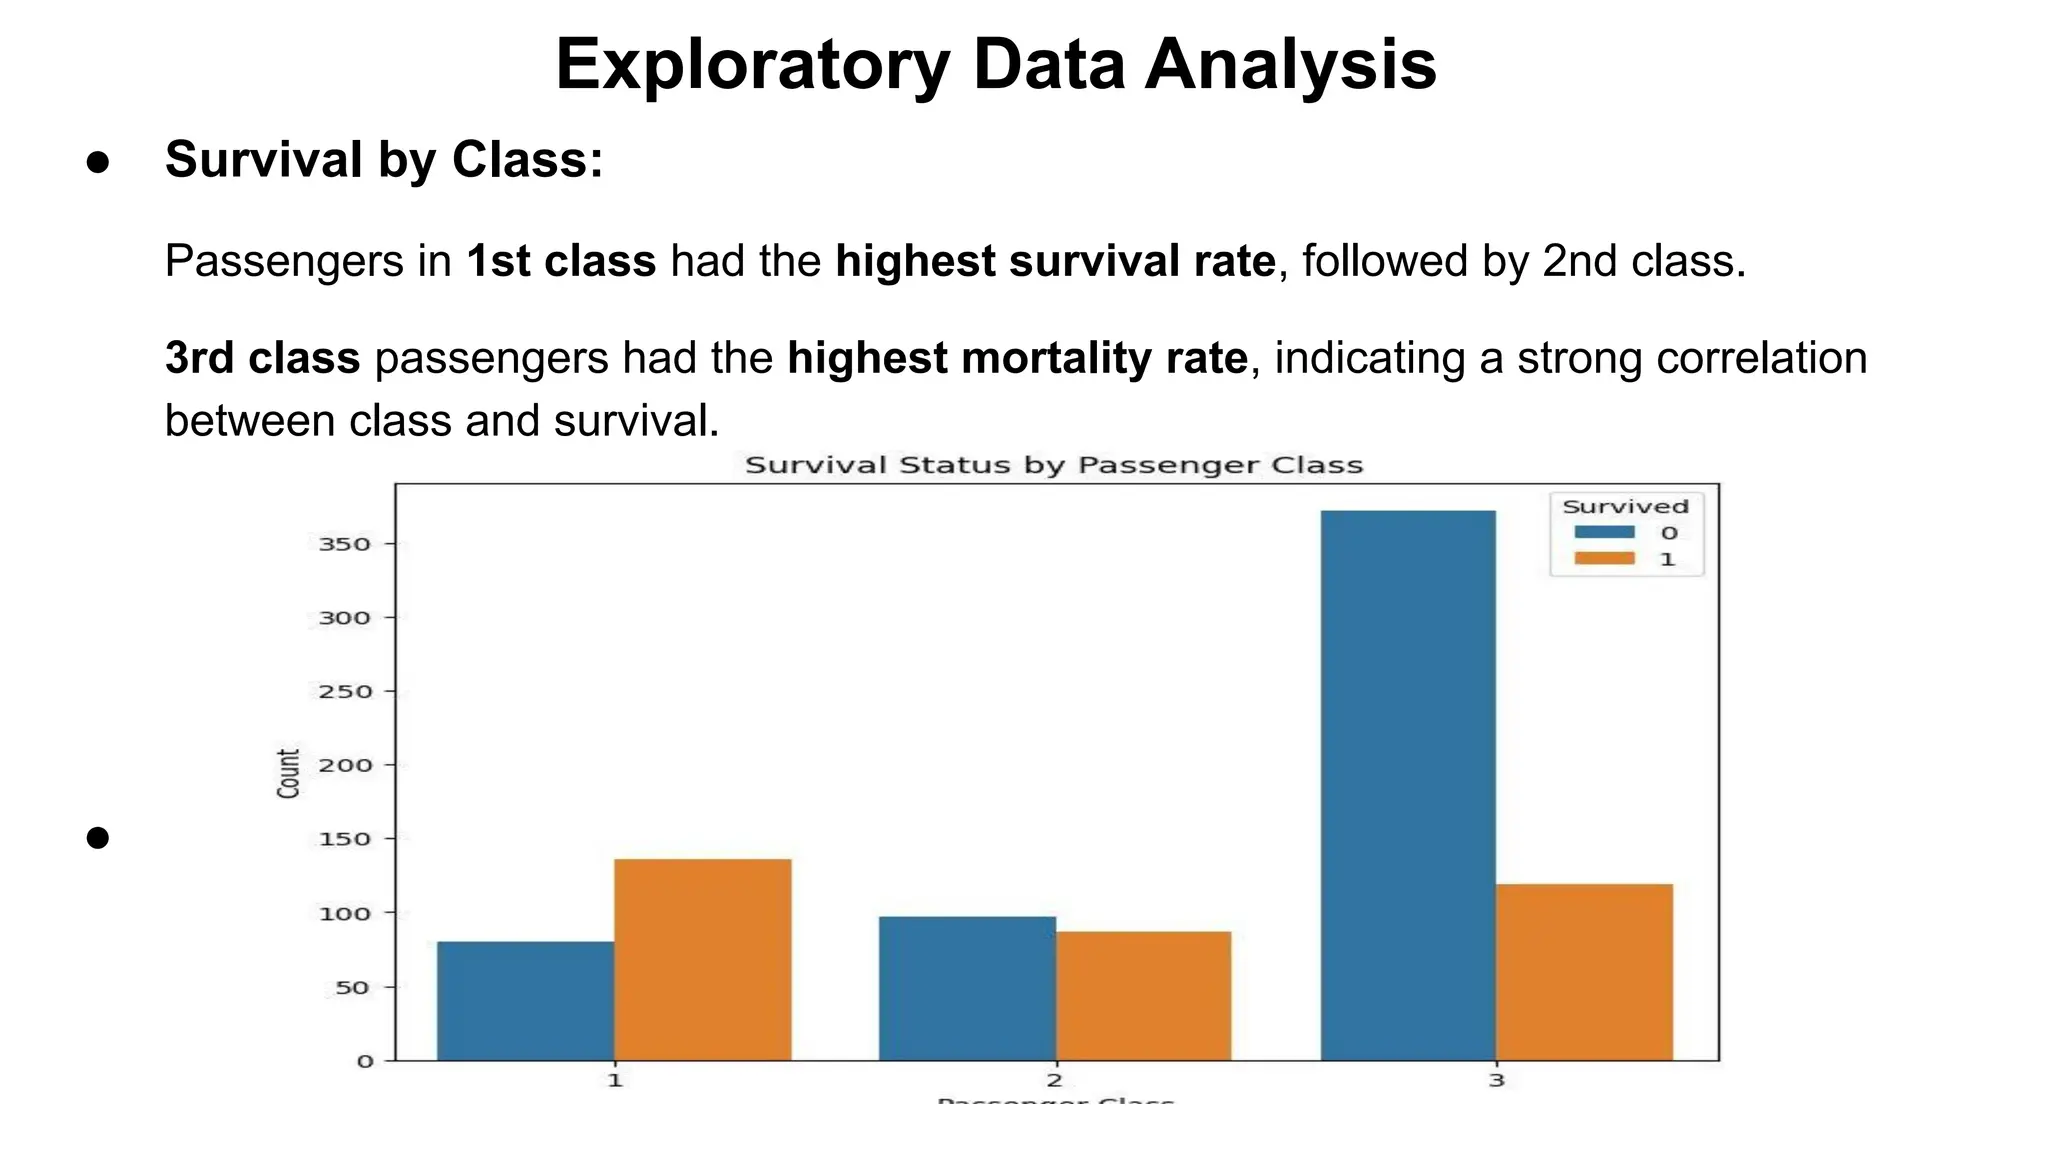
●Survival by Class:
Passengers in 1st class had the highest survival rate, followed by 2nd class.
3rd class passengers had the highest mortality rate, indicating a strong correlation
between class and survival.
●
6.
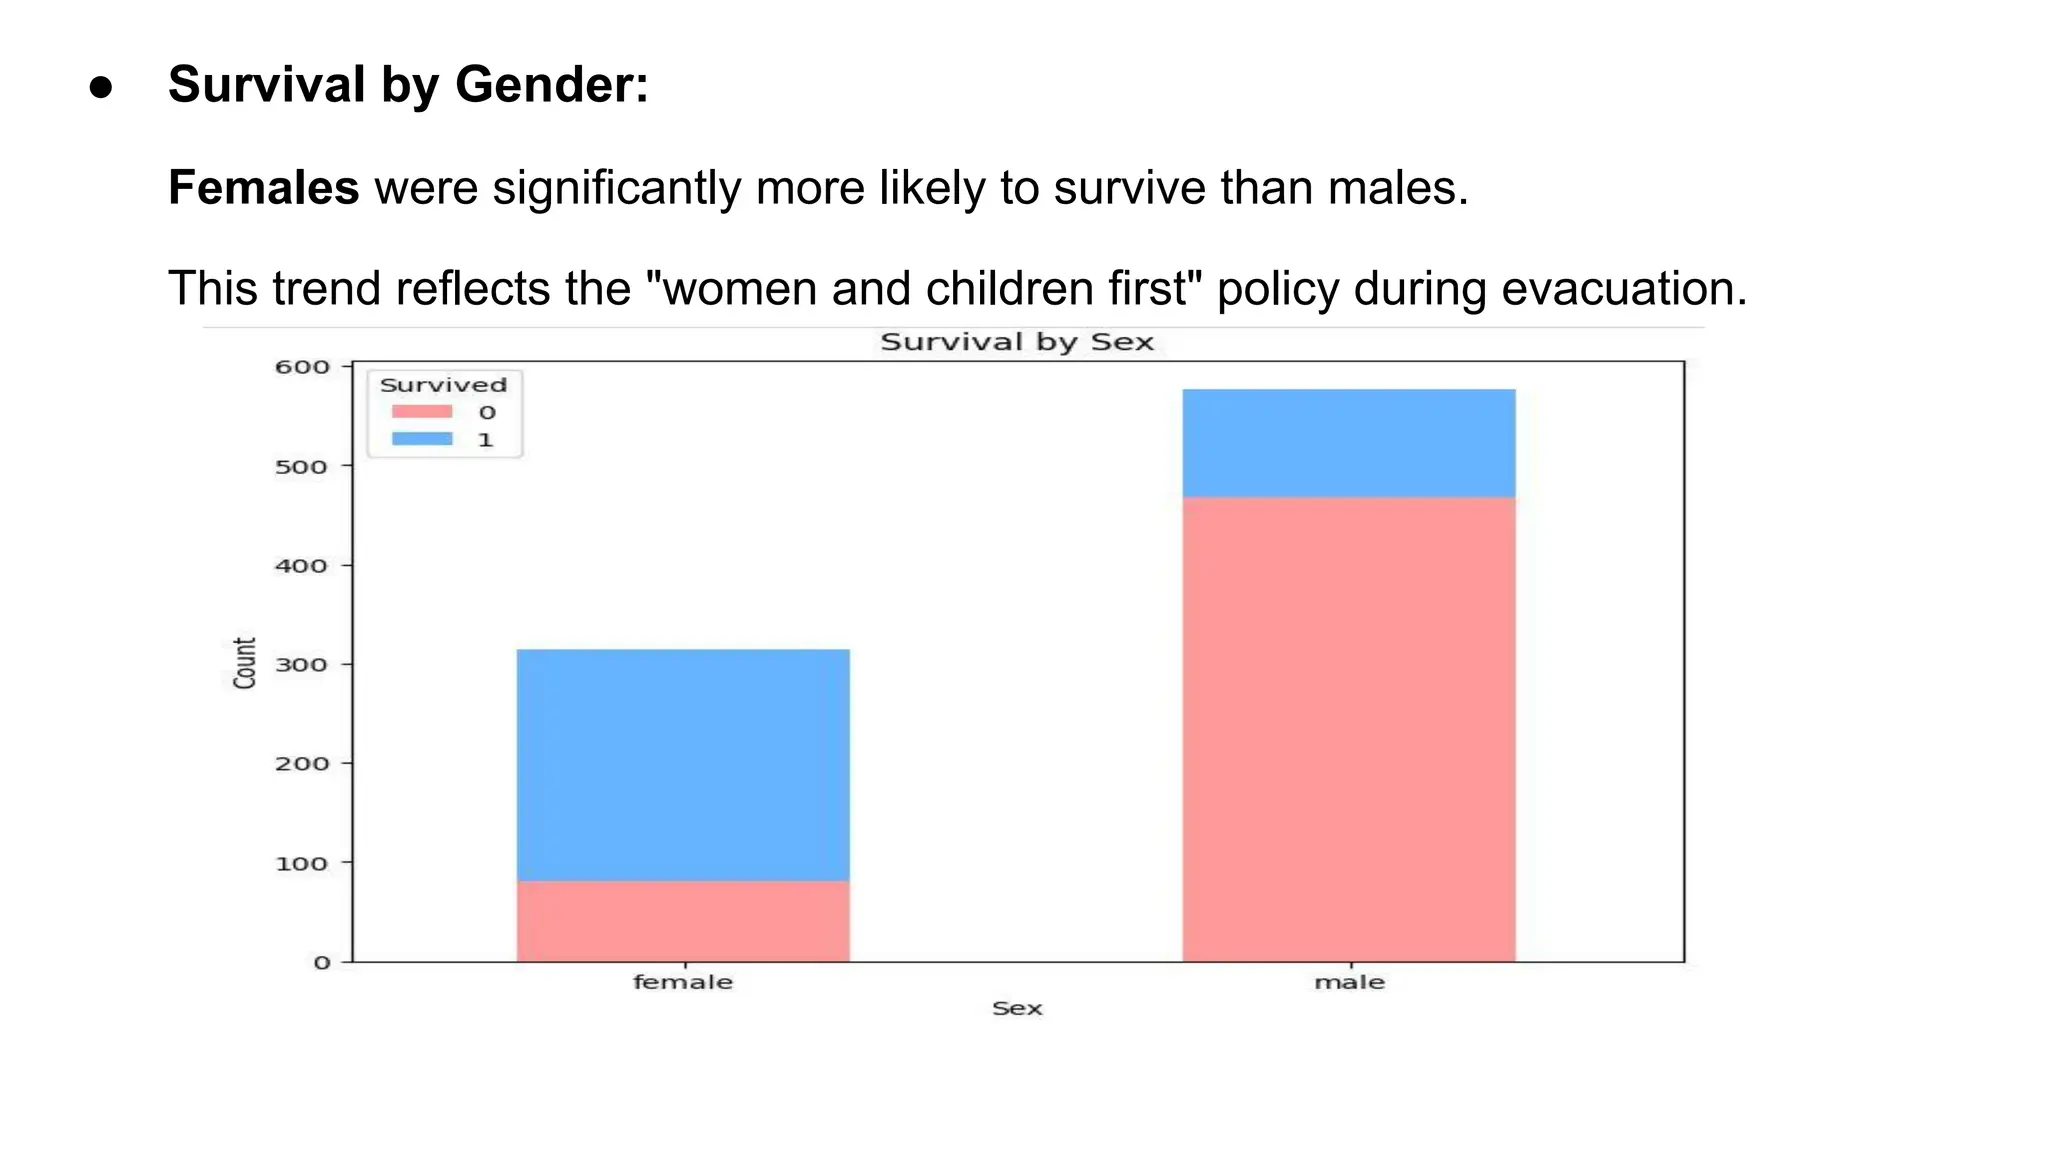
● Survival byGender:
Females were significantly more likely to survive than males.
This trend reflects the "women and children first" policy during evacuation.
7.
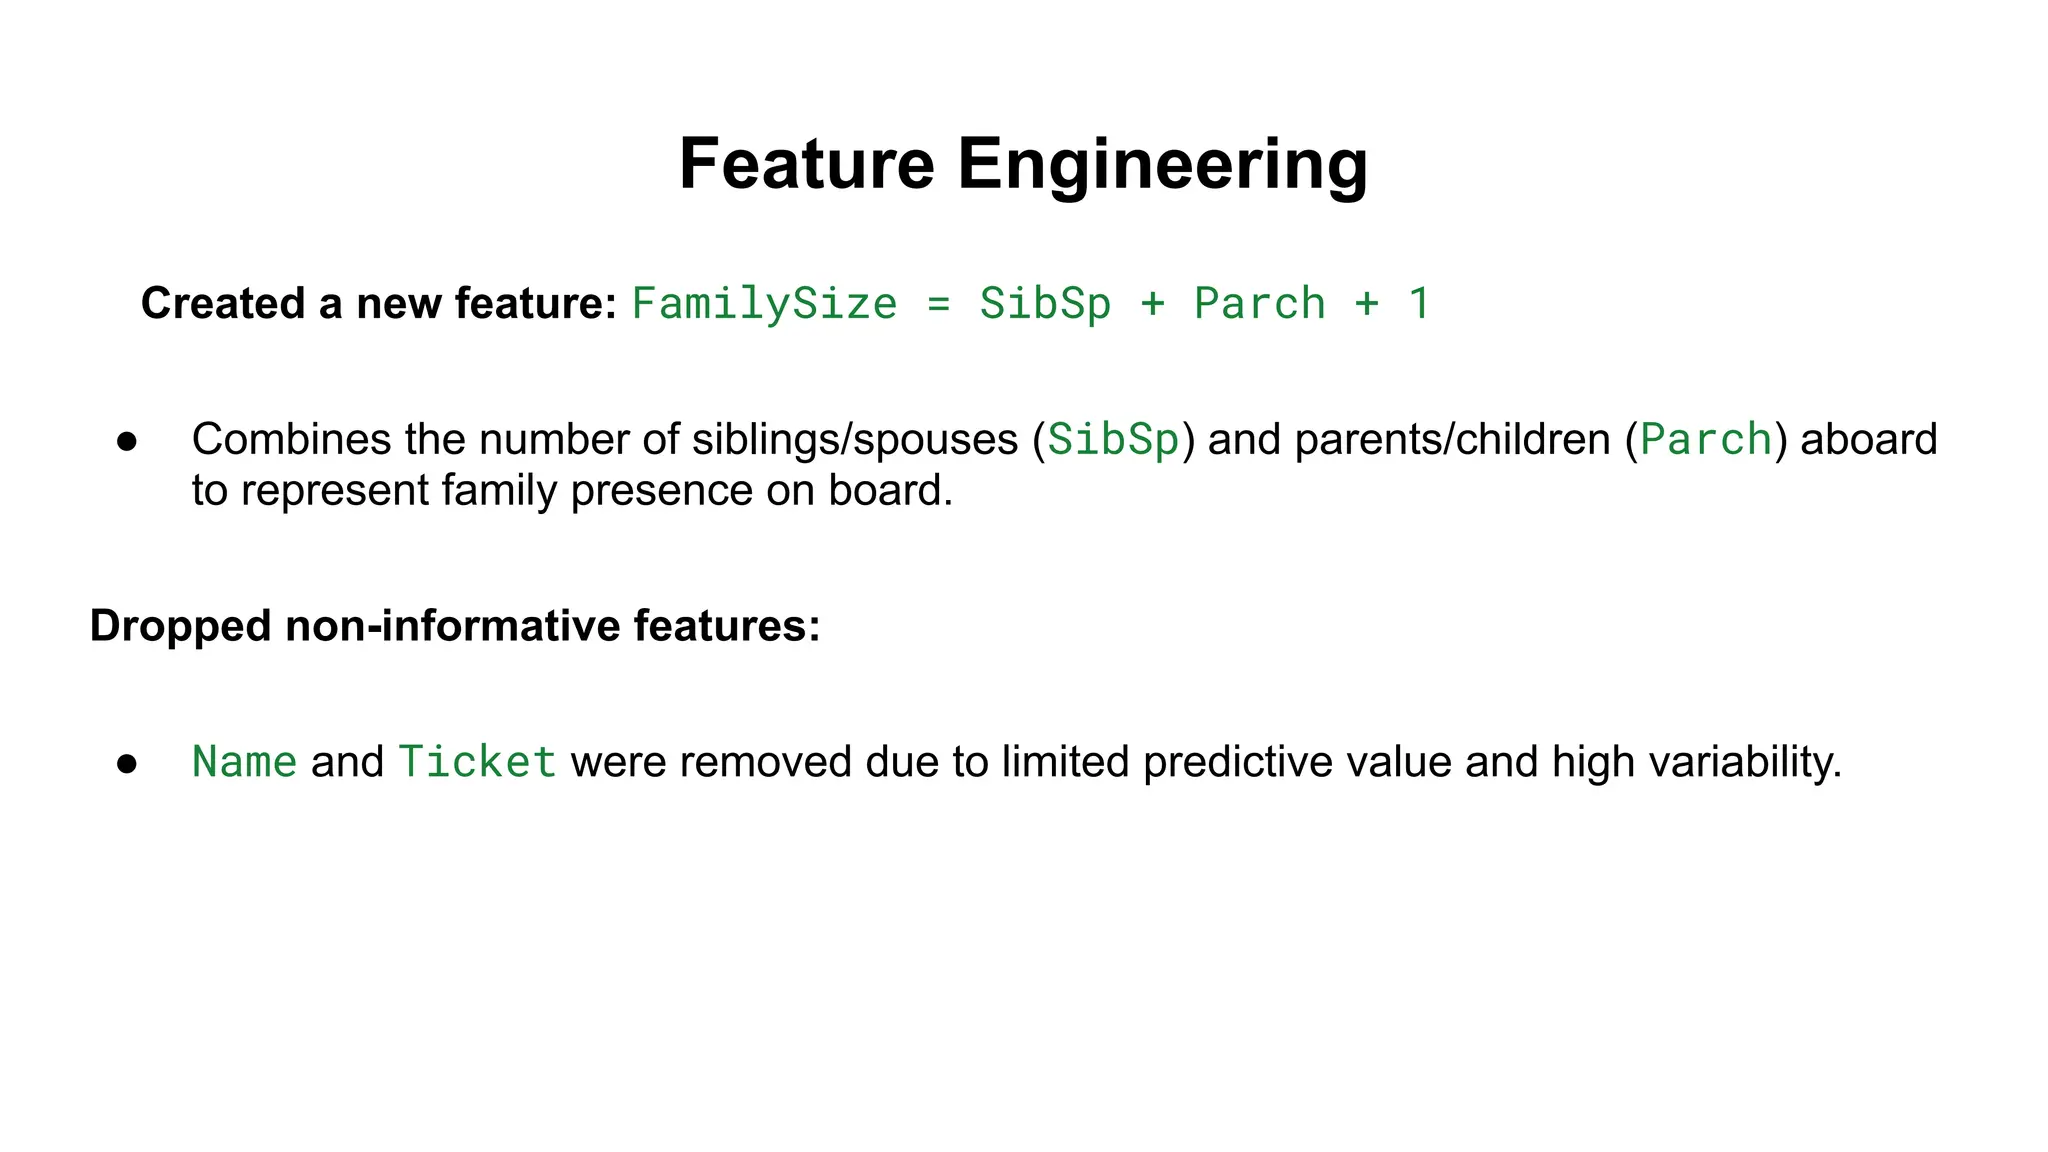
Feature Engineering
Created anew feature: FamilySize = SibSp + Parch + 1
● Combines the number of siblings/spouses (SibSp) and parents/children (Parch) aboard
to represent family presence on board.
Dropped non-informative features:
● Name and Ticket were removed due to limited predictive value and high variability.
8.
Data Preprocessing-Encoded &Scaling
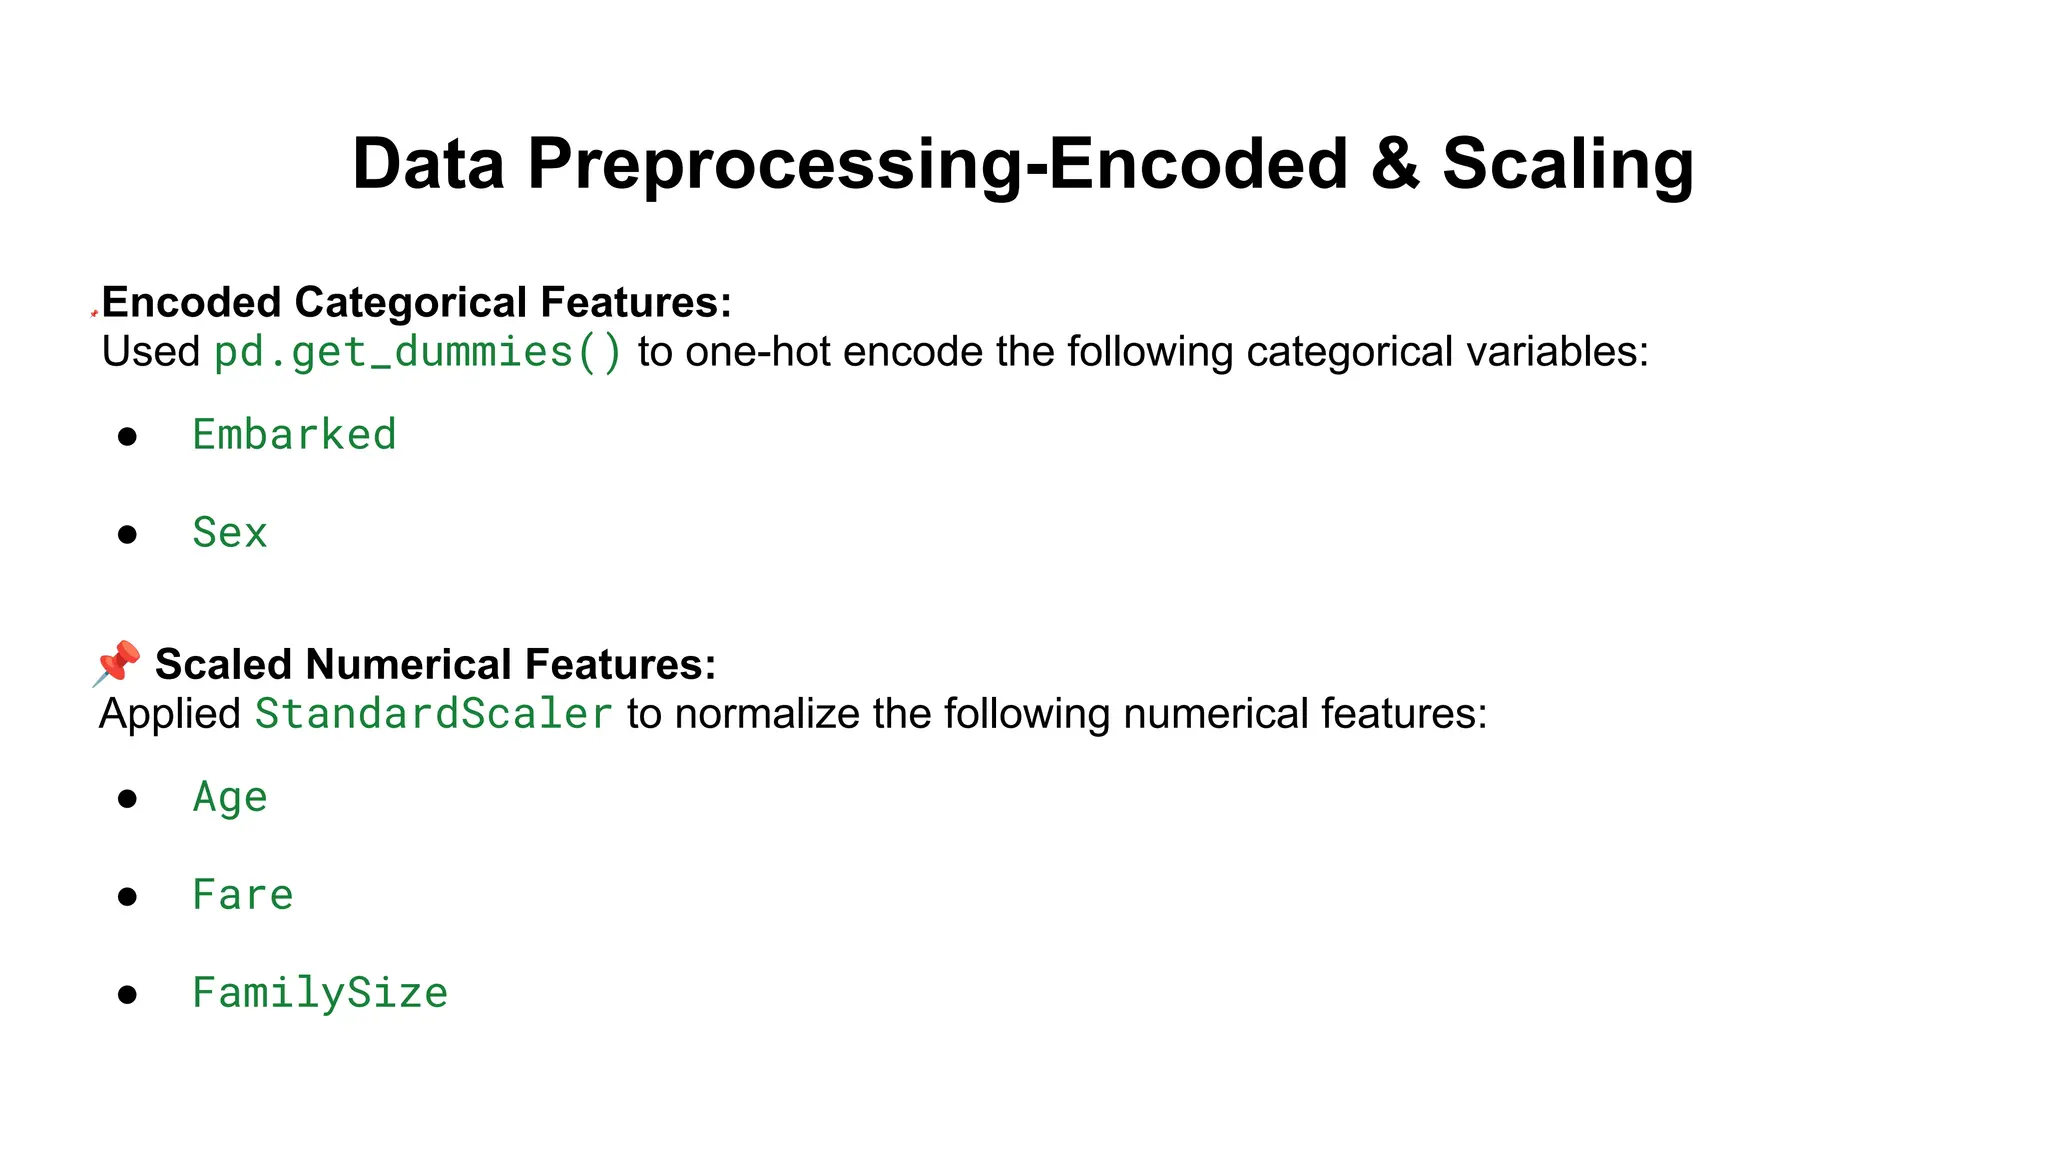
📌 Encoded Categorical Features:
Used pd.get_dummies() to one-hot encode the following categorical variables:
● Embarked
● Sex
📌 Scaled Numerical Features:
Applied StandardScaler to normalize the following numerical features:
● Age
● Fare
● FamilySize
9.
Splitting the TrainingDatasets
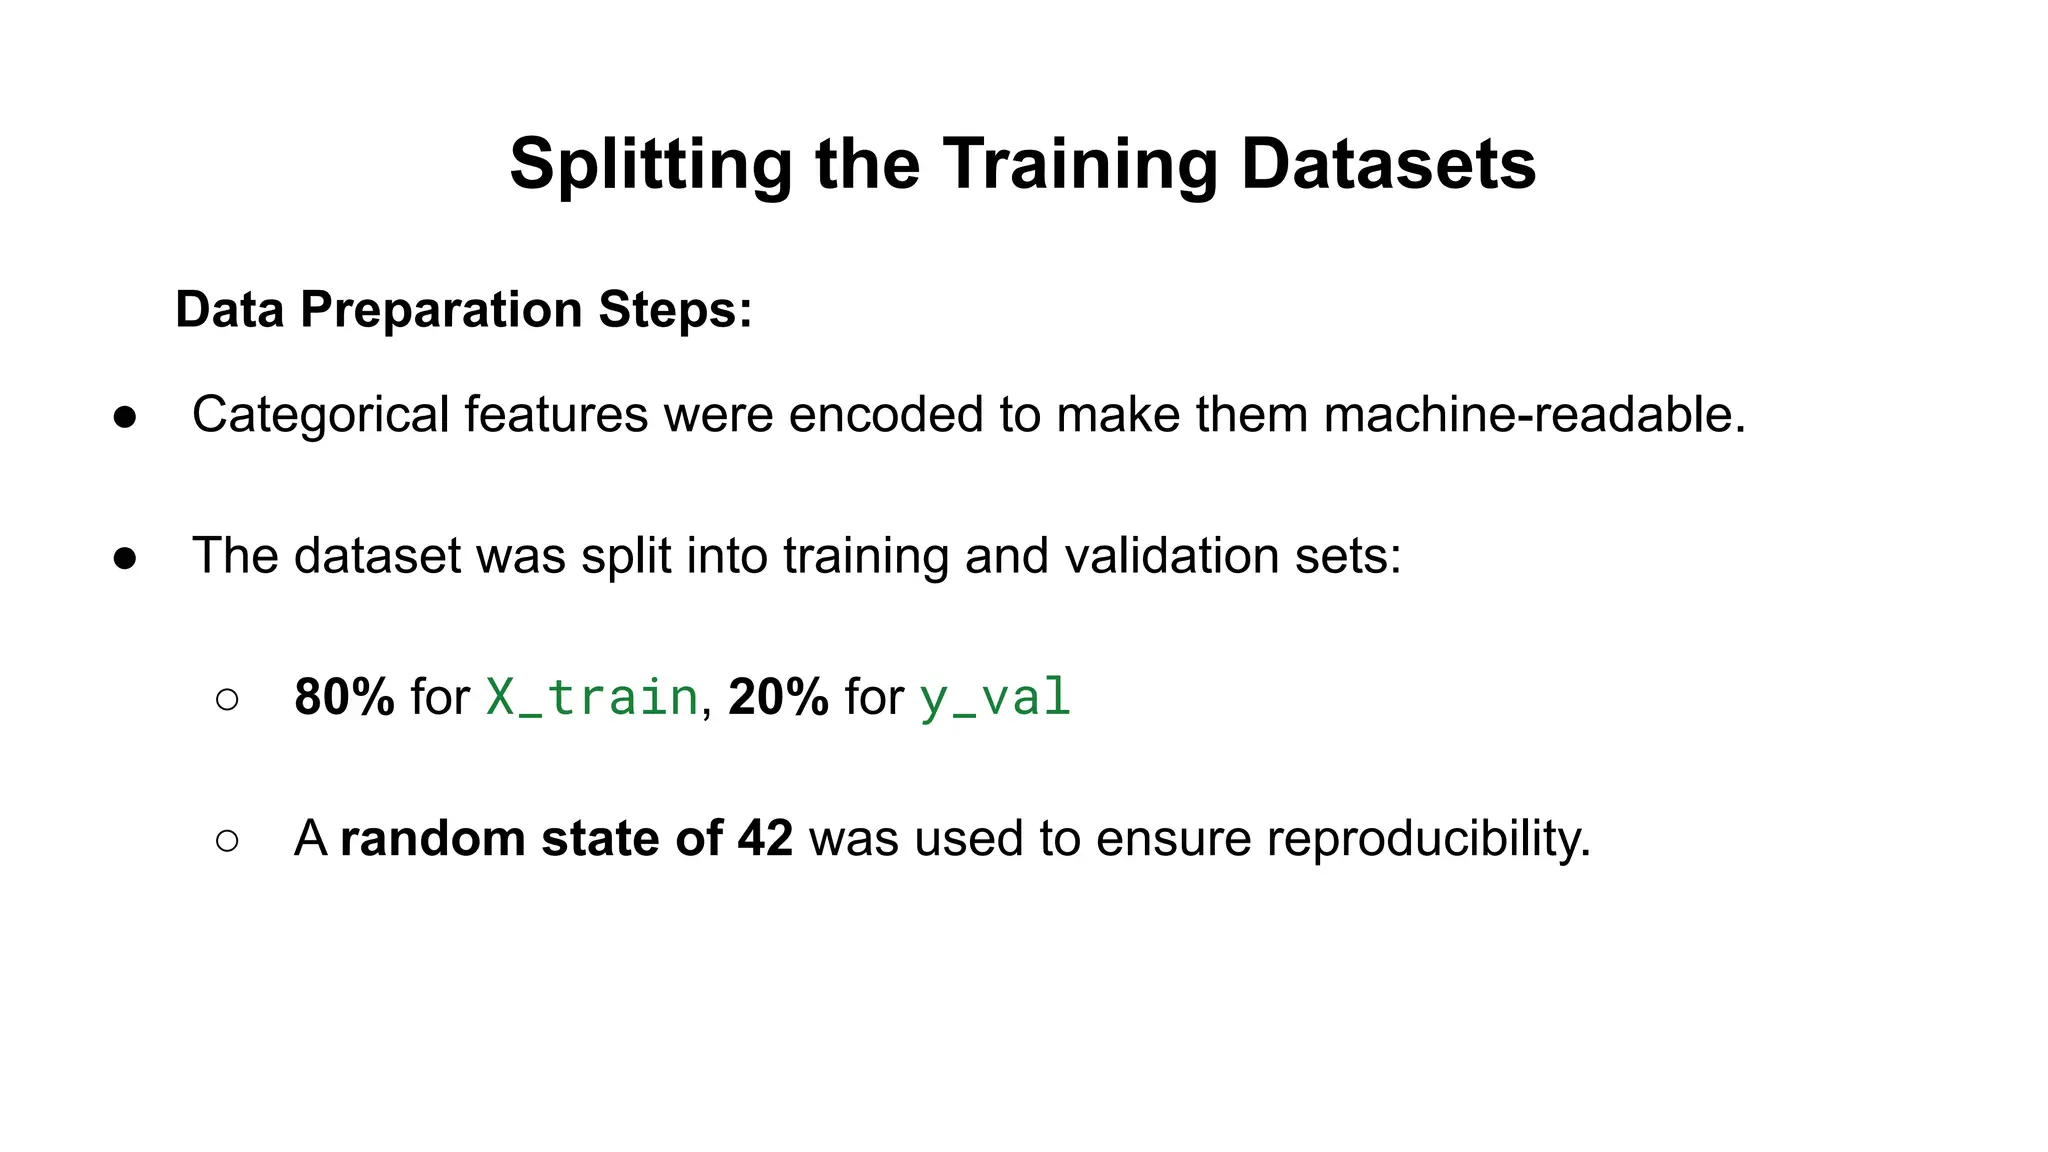
Data Preparation Steps:
● Categorical features were encoded to make them machine-readable.
● The dataset was split into training and validation sets:
○ 80% for X_train, 20% for y_val
○ A random state of 42 was used to ensure reproducibility.
10.
Model Selection
Selected Model:RandomForestClassifier
Why Random Forest? It handles non-linear relationships well and reduces overfitting through ensemble
learning.
Evaluation Strategy: Performed cross-validation to assess model robustness.
Results:
● Cross-validation scores: [0.83916084 0.85314685 0.82394366 0.78169014 0.82394366]
● Mean Accuracy: 0.8244
● Standard Deviation: 0.0240
●
11.
Model Performance
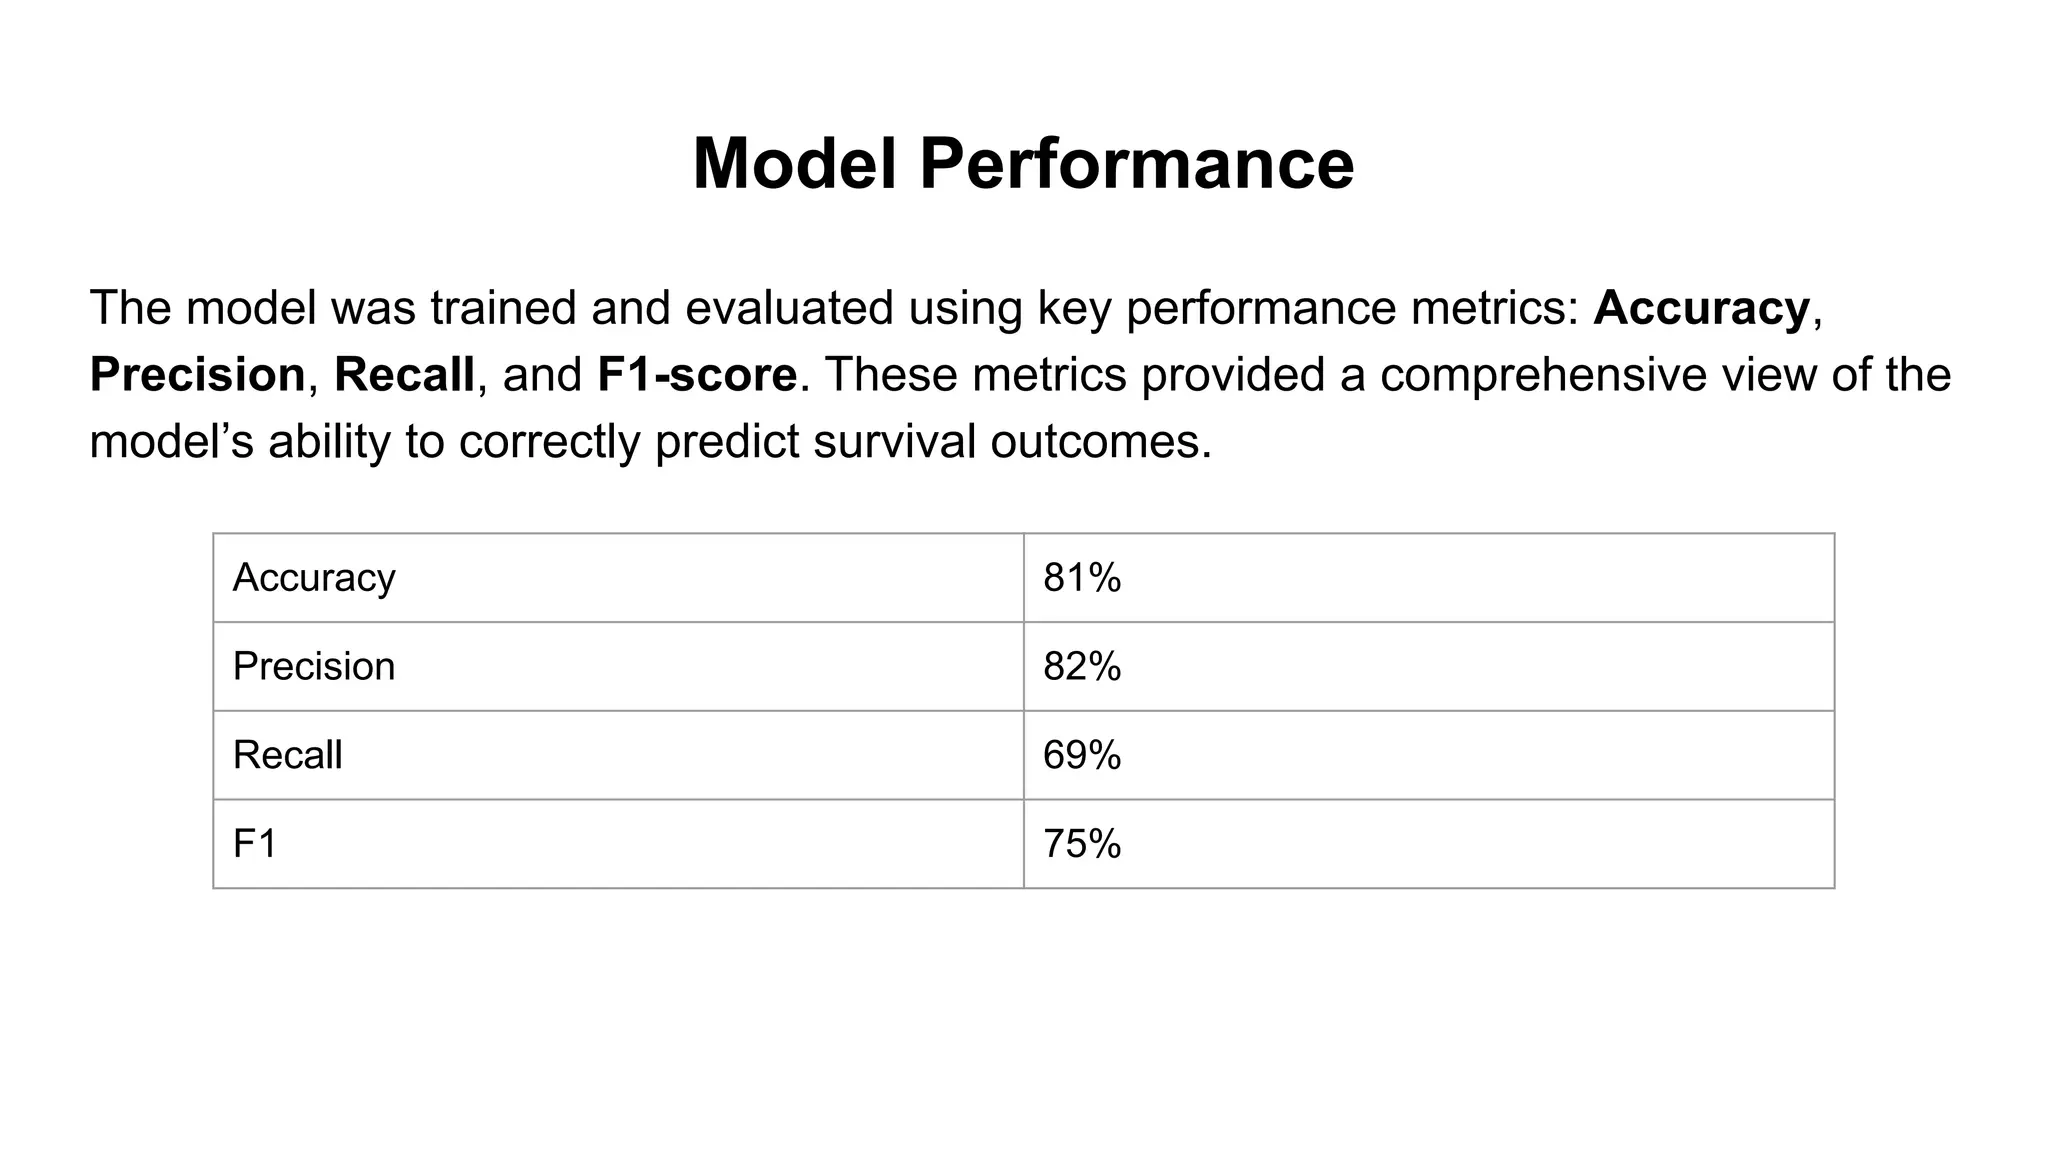
The modelwas trained and evaluated using key performance metrics: Accuracy,
Precision, Recall, and F1-score. These metrics provided a comprehensive view of the
model’s ability to correctly predict survival outcomes.
Accuracy 81%
Precision 82%
Recall 69%
F1 75%
12.
Making Predictions onTest Data
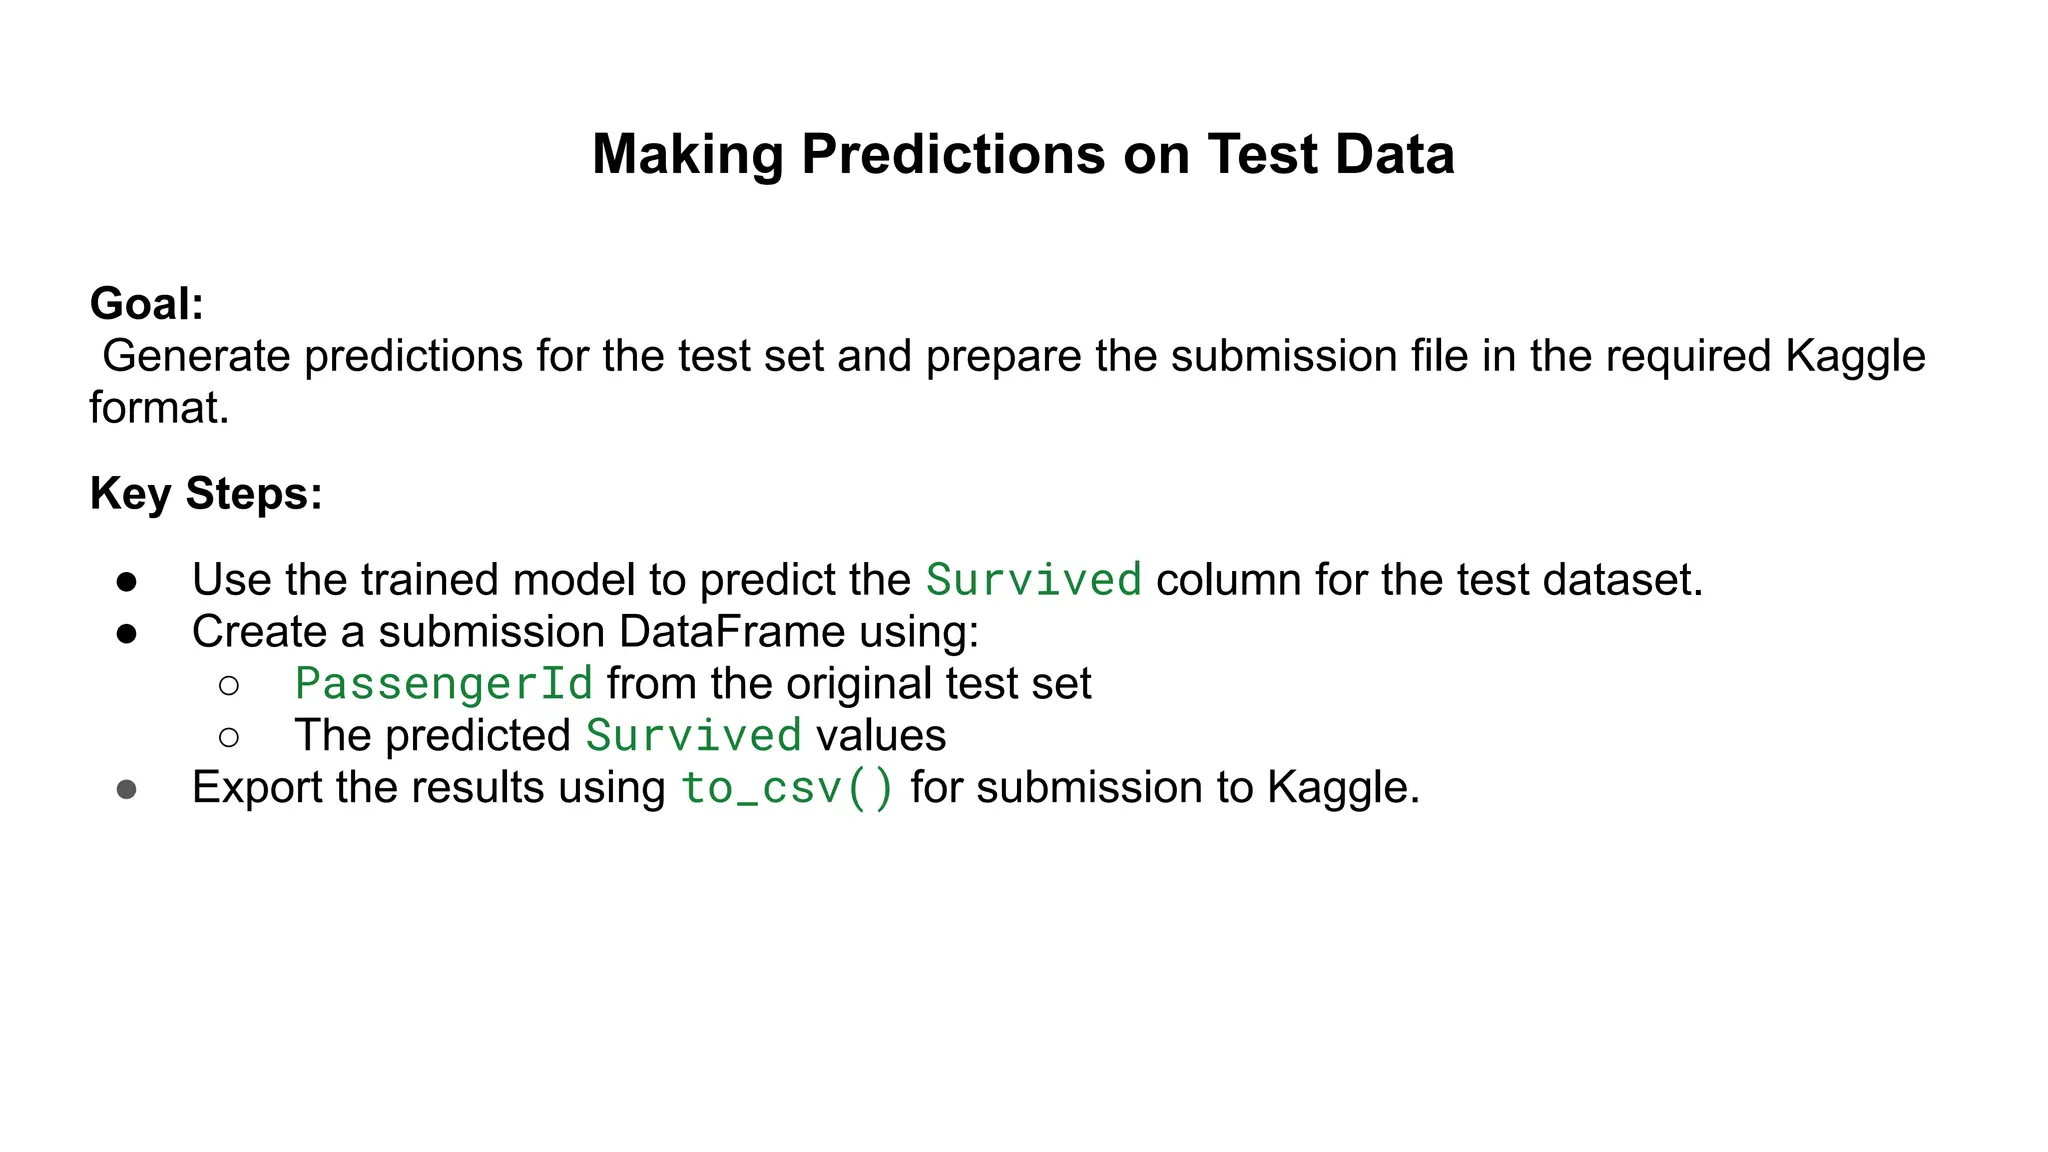
Goal:
Generate predictions for the test set and prepare the submission file in the required Kaggle
format.
Key Steps:
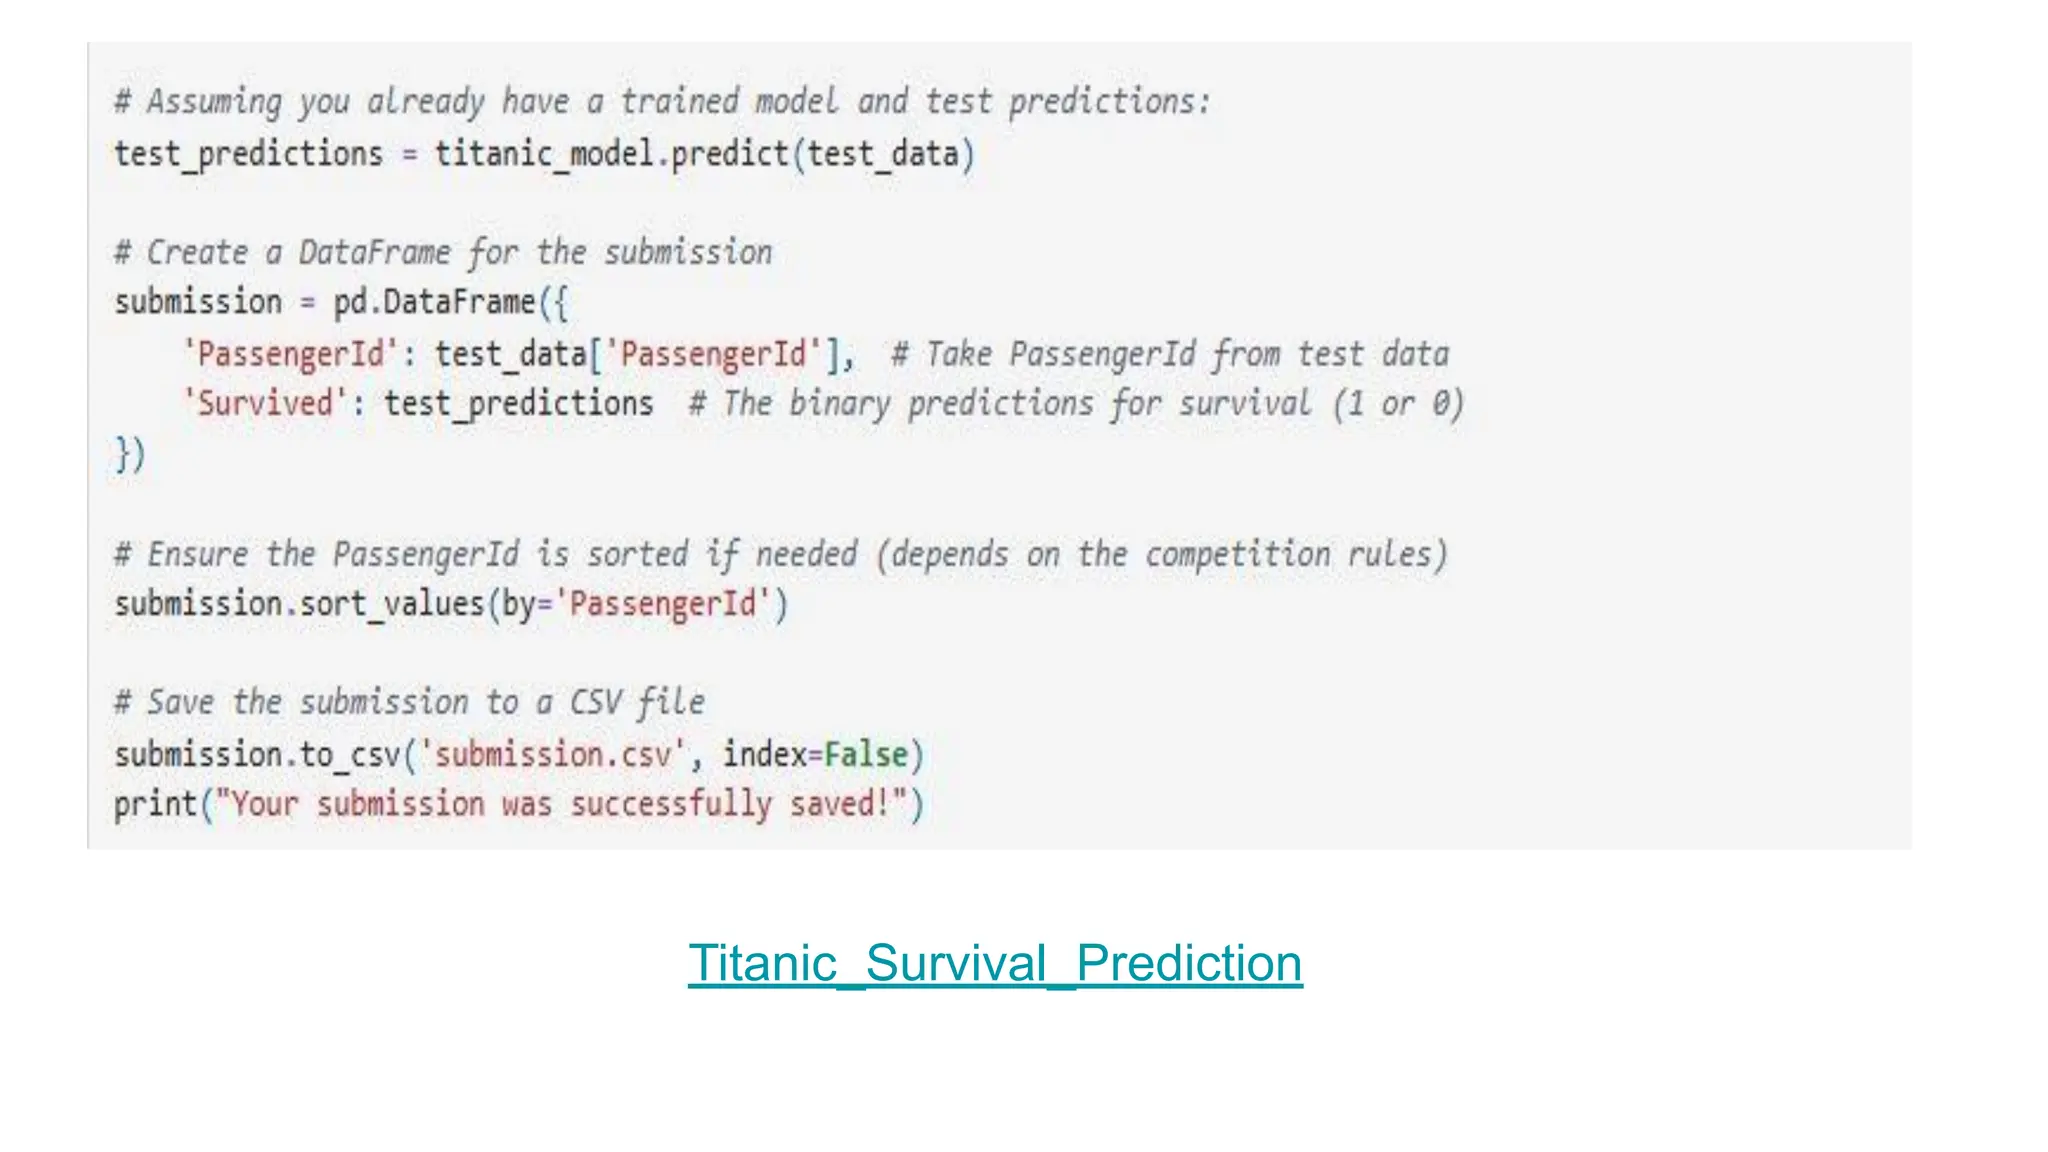
● Use the trained model to predict the Survived column for the test dataset.
● Create a submission DataFrame using:
○ PassengerId from the original test set
○ The predicted Survived values
● Export the results using to_csv() for submission to Kaggle.
![Model Selection
Selected Model: RandomForestClassifier
Why Random Forest? It handles non-linear relationships well and reduces overfitting through ensemble
learning.
Evaluation Strategy: Performed cross-validation to assess model robustness.
Results:
● Cross-validation scores: [0.83916084 0.85314685 0.82394366 0.78169014 0.82394366]
● Mean Accuracy: 0.8244
● Standard Deviation: 0.0240
●](https://image.slidesharecdn.com/presentattionkaggle-250623130702-35427d21/75/Predicting-Titanic-Survival-Presentation-10-2048.jpg)


![[DSC Europe 25] Ivan Peric - Intelligence Swarm Logic and Techno-Functional M...](https://cdn.slidesharecdn.com/ss_thumbnails/7my7c97fsduiccadgavw-2-251212103249-5a03f7c6-thumbnail.jpg?width=640&height=640&fit=bounds)
![[DSC Europe 25] Tatevik Maytesyan - How to actually use AI in marketing: gett...](https://cdn.slidesharecdn.com/ss_thumbnails/tjo626lsqdgfntbgl2mw-4-251216103155-e36cd239-thumbnail.jpg?width=640&height=640&fit=bounds)
![[DSC Europe 25] Danica Soc - The Science Behind Marketing: Experimentation me...](https://cdn.slidesharecdn.com/ss_thumbnails/c0nofsggs9gw5ucmallr-3-251216103155-56bd64d1-thumbnail.jpg?width=640&height=640&fit=bounds)

![[DSC Europe 25] Branko Urosevic -Rethinking Financial Talent: Integrating Cod...](https://cdn.slidesharecdn.com/ss_thumbnails/8jjrus8ttko6qj64f58f-3-251212103250-642c6374-thumbnail.jpg?width=640&height=640&fit=bounds)
![[DSC Europe 25] Jovan Bogicevic - Legacy to AI-Driven Defense: Transforming D...](https://cdn.slidesharecdn.com/ss_thumbnails/rsarluadt563hntyfc8q-3-251211083849-3e7bc4c0-thumbnail.jpg?width=640&height=640&fit=bounds)

![[DSC Europe 25] Nikolay Burlutskiy - Best Practices for Building Enterprise M...](https://cdn.slidesharecdn.com/ss_thumbnails/uirvaiuvq8y1w8hzd9tx-7-251212103249-2619edb4-thumbnail.jpg?width=640&height=640&fit=bounds)
![[DSC Europe 25] Debmalya Biswas - Agentification: the art of transforming man...](https://cdn.slidesharecdn.com/ss_thumbnails/r5azlggvtqiaiiusrqdr-4-251212103249-5a12c89b-thumbnail.jpg?width=640&height=640&fit=bounds)
![[DSC Europe 25] Uros Pesic - The Reality of AI in Marketing.pdf](https://cdn.slidesharecdn.com/ss_thumbnails/rtkodnmtycovsllvzsyn-9-251215095918-b0c6bfe3-thumbnail.jpg?width=640&height=640&fit=bounds)


![[DSC Europe 25] Jon Dajci - Bridging TradFi and DeFi: Building the Future of ...](https://cdn.slidesharecdn.com/ss_thumbnails/fqmhfvlbqhkihjvqvhmu-7-251211083849-6af7e325-thumbnail.jpg?width=640&height=640&fit=bounds)
![[DSC Europe 25] Hans Kleinsman - The Compliance Gearbox: How Tax Tech Mediate...](https://cdn.slidesharecdn.com/ss_thumbnails/dxdytie1toel0hr90bjs-2-251212103250-174fdbe7-thumbnail.jpg?width=640&height=640&fit=bounds)
![[DSC Europe 25] Katherine Forrest - AI NOW: Understanding the Velocity of Cha...](https://cdn.slidesharecdn.com/ss_thumbnails/wvvbruqfrci0sfq9xwgb-4-251212104007-e5ad1987-thumbnail.jpg?width=640&height=640&fit=bounds)

![[DSC Europe 25] Branko Dzakula - From Defense to Attack: How AI Redefines Cyb...](https://cdn.slidesharecdn.com/ss_thumbnails/80bdzdxpr3ky2g0qvyk9-8-251211083048-ce5fc1ee-thumbnail.jpg?width=640&height=640&fit=bounds)
