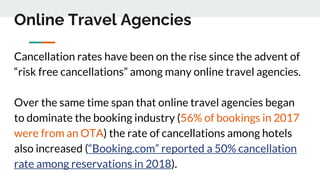
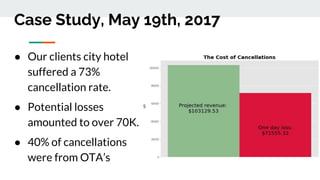
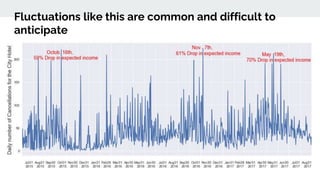
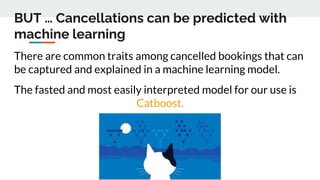
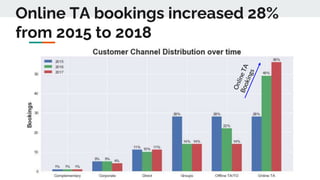
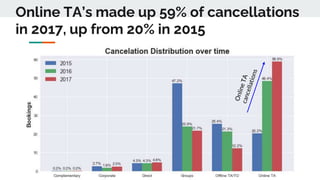
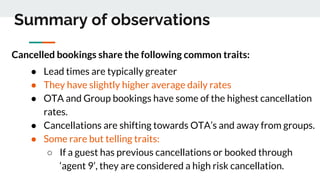
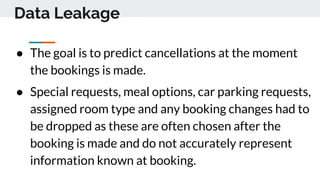
Predicting Hotel Booking
Cancellations
By Matthew Merrill
Problem
Cancellations cause…
● Daily actualized income to drop below projections when
rooms cannot be re-booked.
● Forced price reduction to fill vacancies.
● Increased distribution costs to sell those vacant rooms.
Problem
Data from 2015 to 2017 from our clients two hotels
in Portugal (one city, resort) show an increase in
cancellations correlated with an increase in
bookings from online travel agencies.
Cancellations from OTA’s increased 39% in the
3 years our data was collected.
Online Travel Agencies
Cancellation rates have been on the rise since the advent of
“risk free cancellations” among many online travel agencies.
Over the same time span that online travel agencies began
to dominate the booking industry (56% of bookings in 2017
were from an OTA) the rate of cancellations among hotels
also increased (“Booking.com” reported a 50% cancellation
rate among reservations in 2018).
● Our clients city hotel
suffered a 73%
cancellation rate.
● Potential losses
amounted to over 70K.
● 40% of cancellations
were from OTA’s
Case Study, May 19th, 2017
Fluctuations like this are common and difficult to
anticipate
BUT … Cancellations can be predicted with
machine learning
There are common traits among cancelled bookings that can
be captured and explained in a machine learning model.
The fasted and most easily interpreted model for our use is
Catboost.
Using our model
We could have predicted...
● 99% of cancellations on October 16th
● 94% of cancellations on November 7th
● 86% of cancellations on May 19th
from the moment the booking was logged.
Observations
from
Exploratory Analysis
Lead time
● Median lead
from from
canceled
bookings was
145% greater
than for non-
canceled.
Customer type
● Transient
bookings
accounted for
83% of
cancellations
but only 75%
of bookings.
Seasonality: Summer months have
lower cancellation rates
Days with over 150 cancellations
Summer
Months
Market Segment
● Changes in the share of canceled bookings has
changed over time.
○ 47% were from group bookings in 2015
○ 59% were from online travel agencies in 2017
● OTA cancellation rate in 2017 was 41%, the
highest among any group.
Online TA bookings increased 28%
from 2015 to 2018
Online TA’s made up 59% of cancellations
in 2017, up from 20% in 2015
Summary of observations
Cancelled bookings share the following common traits:
● Lead times are typically greater
● They have slightly higher average daily rates
● OTA and Group bookings have some of the highest cancellation
rates.
● Cancellations are shifting towards OTA’s and away from groups.
● Some rare but telling traits:
○ If a guest has previous cancellations or booked through
‘agent 9’, they are considered a high risk cancellation.
Machine Learning
Data Leakage
● The goal is to predict cancellations at the moment
the bookings is made.
● Special requests, meal options, car parking requests,
assigned room type and any booking changes had to
be dropped as these are often chosen after the
booking is made and do not accurately represent
information known at booking.
Country of origin is assigned to Portugal if
the booking is canceled or a no show
Unjustified
discrepancy
Model results
● Our goal is to predict cancellations, but accuracy is
not the most important metric, AUROC is.
● The AUROC will tell us how well the model can
distinguish between classes (canceled vs non-
canceled)
● We also care much more about reducing false
negatives than false positives.
Model results
● Logistic Regression: 77% AUROC
● Random Forests: 90% AUROC
● Catboost: 89% AUROC
Model of choice: Catboost
It handles categorical features extremely well, makes
fast predictions and is interpretable.
Catboost Summary plot
Feature
importance can
be understood
with a
summary plot.
The most
important
appear on top.
Catboost Summary plot
ADR and arrival week
need to be investigated
further.
Lead time, previous
cancellations, transient
bookings and group
bookings are clear
indicators of high
cancellation risk.
Catboost Dependency Plot: lead time
Lead time is our strongest
indicator.
Bookings with lead times
greater than 200 are
considered high risk.
Last minute bookings are
typically followed through.
Catboost Dependency Plot: arrival
week Greater lead times are
marked with a red hue.
Points below the horizontal
0 line are less likely to cancel.
Lead times are good
indicators of cancellations,
except during the summer
months when they imply the
opposite.
Catboost Dependency Plot: ADR
There’s a slight increase in
risk for higher room rates.
Higher room rates occur in
summer (seen by points
with a purple hue) when
cancellations are less
erratic.
Free bookings are
extremely low risk.
Potential uses for model
The implications of this work bring a myriad of options
to lower overall cancellation rate, increase actualized
income and improve customer experience for hotels.
With the ability to distinguish between possible
cancellations early on, hotels can create a focused
effort towards preventing canceled bookings.
Potential uses for model
● Improve the accuracy of projections for daily
actualized income
● Reach out to high risk bookings with discounted
packages, perks and early options to customize their
experience.
● Use projected cancellation rates to optimize the
distribution of customer channels.
Model Deployment
Using the Rshiny package in Rstudio, a web application
was created to display the results and interact with the
catboost model.
Please email me to check out the web app.
matt.merrill94@gmail.com
Personal Profile links
Sources
1. Hertzfeld, Esther. Study: Cancellation Rate at 40% as OTAs Push Free Change Policy.
Hotel Management, 23 Apr. 2019, www.hotelmanagement.net/tech/study-cancelation-rate-
at-40-as-otas-push-free-change-policy.
2. Funnell, Rob. “The Real Cost of ‘Free’ Cancellations for Hotels.” Triptease, Triptease -
Attract. Convert. Compete., 13 May 2019, www.triptease.com/blog/the-real-cost-of-free-
cancellations/?utm_source=MediaPartner&utm_medium=HotelSpeak.

Predicting hotel booking cancellations

  • 1.
  • 2.
    Problem Cancellations cause… ● Dailyactualized income to drop below projections when rooms cannot be re-booked. ● Forced price reduction to fill vacancies. ● Increased distribution costs to sell those vacant rooms.
  • 3.
    Problem Data from 2015to 2017 from our clients two hotels in Portugal (one city, resort) show an increase in cancellations correlated with an increase in bookings from online travel agencies. Cancellations from OTA’s increased 39% in the 3 years our data was collected.
  • 4.
    Online Travel Agencies Cancellationrates have been on the rise since the advent of “risk free cancellations” among many online travel agencies. Over the same time span that online travel agencies began to dominate the booking industry (56% of bookings in 2017 were from an OTA) the rate of cancellations among hotels also increased (“Booking.com” reported a 50% cancellation rate among reservations in 2018).
  • 5.
    ● Our clientscity hotel suffered a 73% cancellation rate. ● Potential losses amounted to over 70K. ● 40% of cancellations were from OTA’s Case Study, May 19th, 2017
  • 6.
    Fluctuations like thisare common and difficult to anticipate
  • 7.
    BUT … Cancellationscan be predicted with machine learning There are common traits among cancelled bookings that can be captured and explained in a machine learning model. The fasted and most easily interpreted model for our use is Catboost.
  • 8.
    Using our model Wecould have predicted... ● 99% of cancellations on October 16th ● 94% of cancellations on November 7th ● 86% of cancellations on May 19th from the moment the booking was logged.
  • 9.
  • 10.
    Lead time ● Medianlead from from canceled bookings was 145% greater than for non- canceled.
  • 11.
    Customer type ● Transient bookings accountedfor 83% of cancellations but only 75% of bookings.
  • 12.
    Seasonality: Summer monthshave lower cancellation rates Days with over 150 cancellations Summer Months
  • 13.
    Market Segment ● Changesin the share of canceled bookings has changed over time. ○ 47% were from group bookings in 2015 ○ 59% were from online travel agencies in 2017 ● OTA cancellation rate in 2017 was 41%, the highest among any group.
  • 14.
    Online TA bookingsincreased 28% from 2015 to 2018
  • 15.
    Online TA’s madeup 59% of cancellations in 2017, up from 20% in 2015
  • 16.
    Summary of observations Cancelledbookings share the following common traits: ● Lead times are typically greater ● They have slightly higher average daily rates ● OTA and Group bookings have some of the highest cancellation rates. ● Cancellations are shifting towards OTA’s and away from groups. ● Some rare but telling traits: ○ If a guest has previous cancellations or booked through ‘agent 9’, they are considered a high risk cancellation.
  • 17.
  • 18.
    Data Leakage ● Thegoal is to predict cancellations at the moment the bookings is made. ● Special requests, meal options, car parking requests, assigned room type and any booking changes had to be dropped as these are often chosen after the booking is made and do not accurately represent information known at booking.
  • 19.
    Country of originis assigned to Portugal if the booking is canceled or a no show Unjustified discrepancy
  • 20.
    Model results ● Ourgoal is to predict cancellations, but accuracy is not the most important metric, AUROC is. ● The AUROC will tell us how well the model can distinguish between classes (canceled vs non- canceled) ● We also care much more about reducing false negatives than false positives.
  • 21.
    Model results ● LogisticRegression: 77% AUROC ● Random Forests: 90% AUROC ● Catboost: 89% AUROC Model of choice: Catboost It handles categorical features extremely well, makes fast predictions and is interpretable.
  • 22.
    Catboost Summary plot Feature importancecan be understood with a summary plot. The most important appear on top.
  • 23.
    Catboost Summary plot ADRand arrival week need to be investigated further. Lead time, previous cancellations, transient bookings and group bookings are clear indicators of high cancellation risk.
  • 24.
    Catboost Dependency Plot:lead time Lead time is our strongest indicator. Bookings with lead times greater than 200 are considered high risk. Last minute bookings are typically followed through.
  • 25.
    Catboost Dependency Plot:arrival week Greater lead times are marked with a red hue. Points below the horizontal 0 line are less likely to cancel. Lead times are good indicators of cancellations, except during the summer months when they imply the opposite.
  • 26.
    Catboost Dependency Plot:ADR There’s a slight increase in risk for higher room rates. Higher room rates occur in summer (seen by points with a purple hue) when cancellations are less erratic. Free bookings are extremely low risk.
  • 27.
    Potential uses formodel The implications of this work bring a myriad of options to lower overall cancellation rate, increase actualized income and improve customer experience for hotels. With the ability to distinguish between possible cancellations early on, hotels can create a focused effort towards preventing canceled bookings.
  • 28.
    Potential uses formodel ● Improve the accuracy of projections for daily actualized income ● Reach out to high risk bookings with discounted packages, perks and early options to customize their experience. ● Use projected cancellation rates to optimize the distribution of customer channels.
  • 29.
    Model Deployment Using theRshiny package in Rstudio, a web application was created to display the results and interact with the catboost model. Please email me to check out the web app. matt.merrill94@gmail.com
  • 30.
  • 31.
    Sources 1. Hertzfeld, Esther.Study: Cancellation Rate at 40% as OTAs Push Free Change Policy. Hotel Management, 23 Apr. 2019, www.hotelmanagement.net/tech/study-cancelation-rate- at-40-as-otas-push-free-change-policy. 2. Funnell, Rob. “The Real Cost of ‘Free’ Cancellations for Hotels.” Triptease, Triptease - Attract. Convert. Compete., 13 May 2019, www.triptease.com/blog/the-real-cost-of-free- cancellations/?utm_source=MediaPartner&utm_medium=HotelSpeak.