PURPOSE
Determine if CustomerSpecific requirements are
correctly understood by supplier
Process has potential to produce product
meeting these requirements during actual
production at the desired production rate
Should be taken for significant production runs
3.
When Required..?
Prior tofirst production shipment
New Product or Part
Correction of previous submission
Product modification
Optional constructional Material
New/ Modified tool used
Process Change
Re-Arrangement of existing Tools or equipments
Change in source of material
Tooling remains inactive for over 12 months
Change in transportation method/type of packing
4.
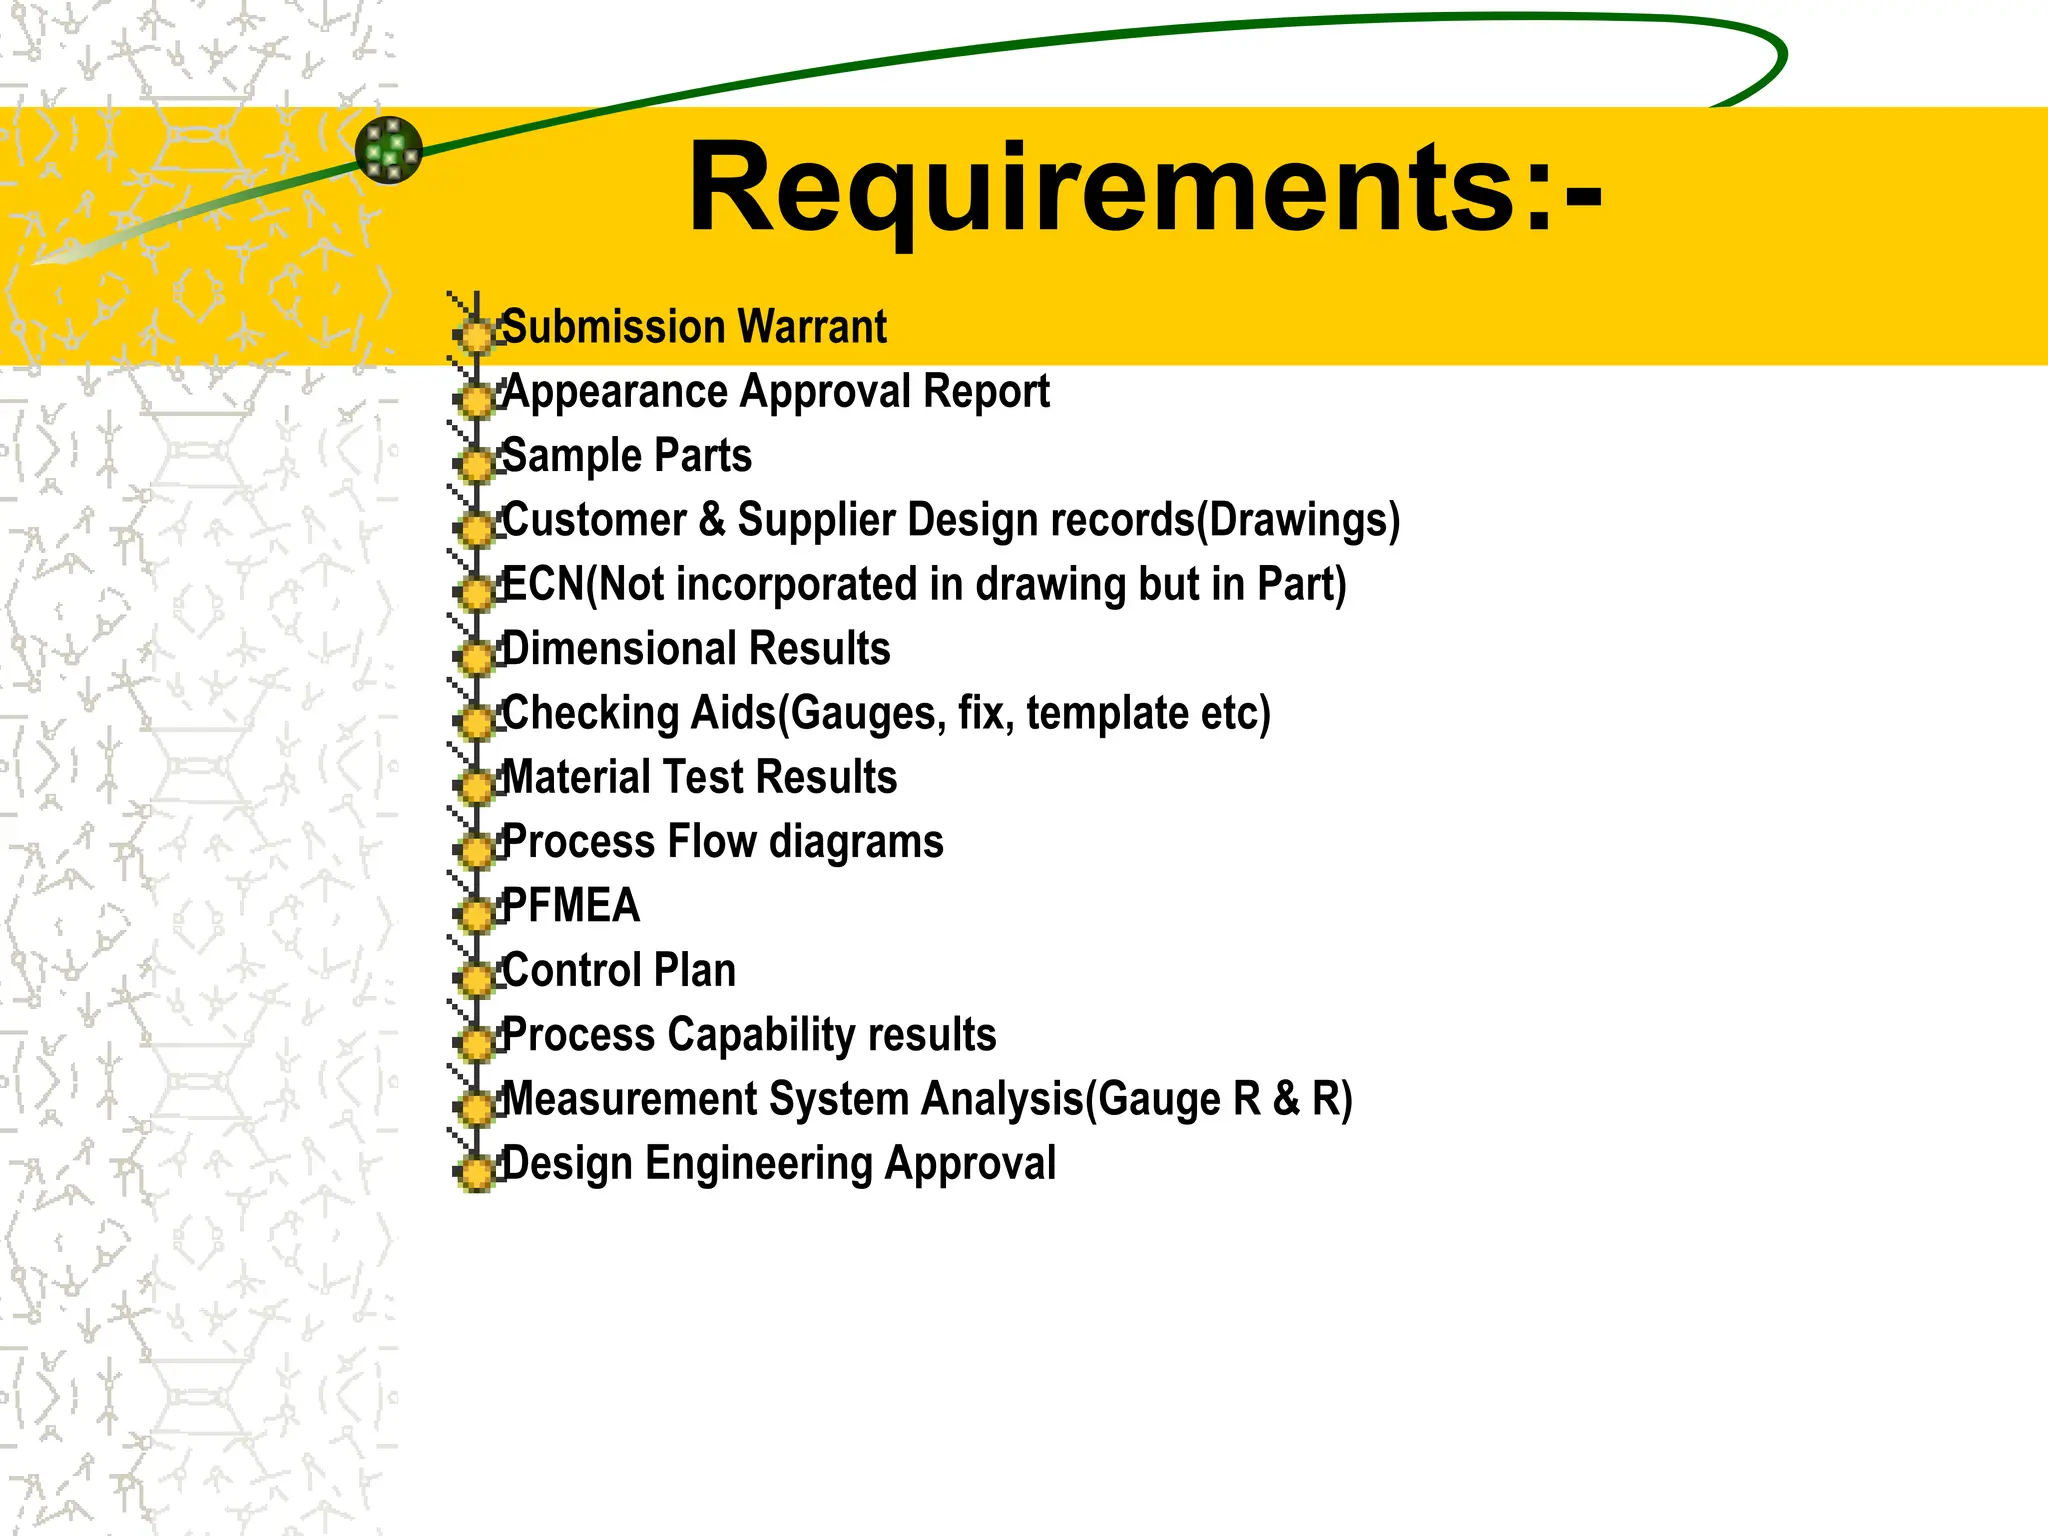
Requirements:-
Submission Warrant
Appearance ApprovalReport
Sample Parts
Customer & Supplier Design records(Drawings)
ECN(Not incorporated in drawing but in Part)
Dimensional Results
Checking Aids(Gauges, fix, template etc)
Material Test Results
Process Flow diagrams
PFMEA
Control Plan
Process Capability results
Measurement System Analysis(Gauge R & R)
Design Engineering Approval
5.
Submission Levels:-
Level -1
– Warrant Only
Level- 2
– Warrant + Samples + Limited Supported Data
Level-3
– Warrant + Samples + Complete Supported Data
Level-4
– Warrant+Complete Supporting Data
Level-5
– Warrant+ samples+complete supporting data reviewed at supplier’s
manufacturing location
Level-3 is Default
6.
S.
No.
Requirement Level-1 Level-2Level-3 Level-4 Level-5
1 Warrant S S S S R
2 Appear. Approval Report S S S S R
3 Samples R S S R R
4 Design Records R R R R R
5 Changed Documents R S S S R
6 Dimensional Results R S S S R
7 Checking Aids R R R R R
8 Test Results R S S S R
9 Flow Diagram R R S S R
10 Process FMEA R R S S R
11 Control Plan R R S S R
12 Process Capability R R S S R
13 MSA R R S S R
14 Design Approval R R S S R
LEGENDS:-
LEGENDS:-
R-Retain
(Available for
customer on
request. Can be
demanded by
customer)
S-Submit
(To designated
Part Approval
Activity)
NOTE:-
NOTE:-
Default Level is
Level-3
SUBMISSION REQUIREMENT
1 & 2-Part Description
3-Safety/Regulatory Item
4-Change Level & Date of
Submission
5-Changes Incorporated in Part not in
Drg.
6.Part Number
7. Purchase order No.(If Available)
8. Weight of Part
9 & 10 Checking Aid Number &
Revision/Approval Date(Gauge etc.)
11 & 12 Supplier’s Name. Code &
Address
13 Submission Type
14 & 15 Customer, Buyer Name,
Code
16 Model Year, Vehicle Name etc.
17-Reason for submission
18-Submission Level requested by
customer( Default 3)
19 & 20-Results of Submission
21 & 22- Comments & Signature of
Authorized Person with Title & Ph.
Number on Declaration
9.
Part Name PartNumber
Safety and/or
Government Regulation Yes No Engineering Draw ing Change Level Dated
Additional Engineering Changes Dated
Show n on Draw ing No Purchase Order No. Weight kg
Checking Aid No Engineering Change Level Dated
SUPPLIER MANUFACTURINGINFORMATION SUBMISSION INFORMATION
Dimensional Materials/Functional Appearance
Supplier Name Supplier Code
Customer Name/Division
Street Address Buyer/Buyer Code
Application
City/ State/ Postal Code
REASON FOR SUBMISSION
Initial Submission Change to Optional Construction or Material
Engineering Change(s) Sub supplier or Material Source Change
Tooling Transfer, Replacement, Refurbishment or additional Change in Pad Processing
Correction of Discrepancy Parts Produced at Additional Location
Other - please specify
REQUESTED SUBMISSION LEVEL ( Check one)
Level 1 - Warrant, Appearance Approval Report ( for designated appearance items only)
Level 2 - Warrant, Parts, Draw ings, Inspection Results, Laboratory and Functional Results, Appearance Approval Report.
Level 3 - At Customer Location - Warrant, Parts, Draw ings, Inspection Results, Laboratory and Functional Results, Appearance
Approval Report, Process Capability Results, Capability Study, Process Control Plan, Gage Study, FMEA.
Level 4 - Per Level 3, but w ithout parts.
Level 5 - At Customer Location - Warrant, Parts, Draw ings, Inspection Results, Laboratory and Functional Results, Appearance
Approval Report, Process Capability Results, Capability Study, Process Control Plan, Gage Study, FMEA.
SUBMISSION RESULTS
The results for dimensional measurements material & functional tests appearance criteria statistical process
package. These results meet all draw ing and specification requirement : Yes No (If "NO"- Explanation Required)
DECLARATION
I affirm that the samples represented by this w arrant are representative of our parts and have been made to the applicable
customer draw ings and specifications and are made from specified materials on regular production tooling w ith no operations
other than the regular production process. I have noted any deviations from this declaration below :
EXPLANATION/ COMMENTS :
Print Name Title Phone No.
Supplier Authorised Signature Date
Approved Rejected Other
Part Disposition
Customer Name Customer Signature Date
FOR CUSTOMER USEONLY
OMAX AUTOS LIMITED
69, KM STONE
DELHI JAIPUR HIGHWAY
DHARUHERA
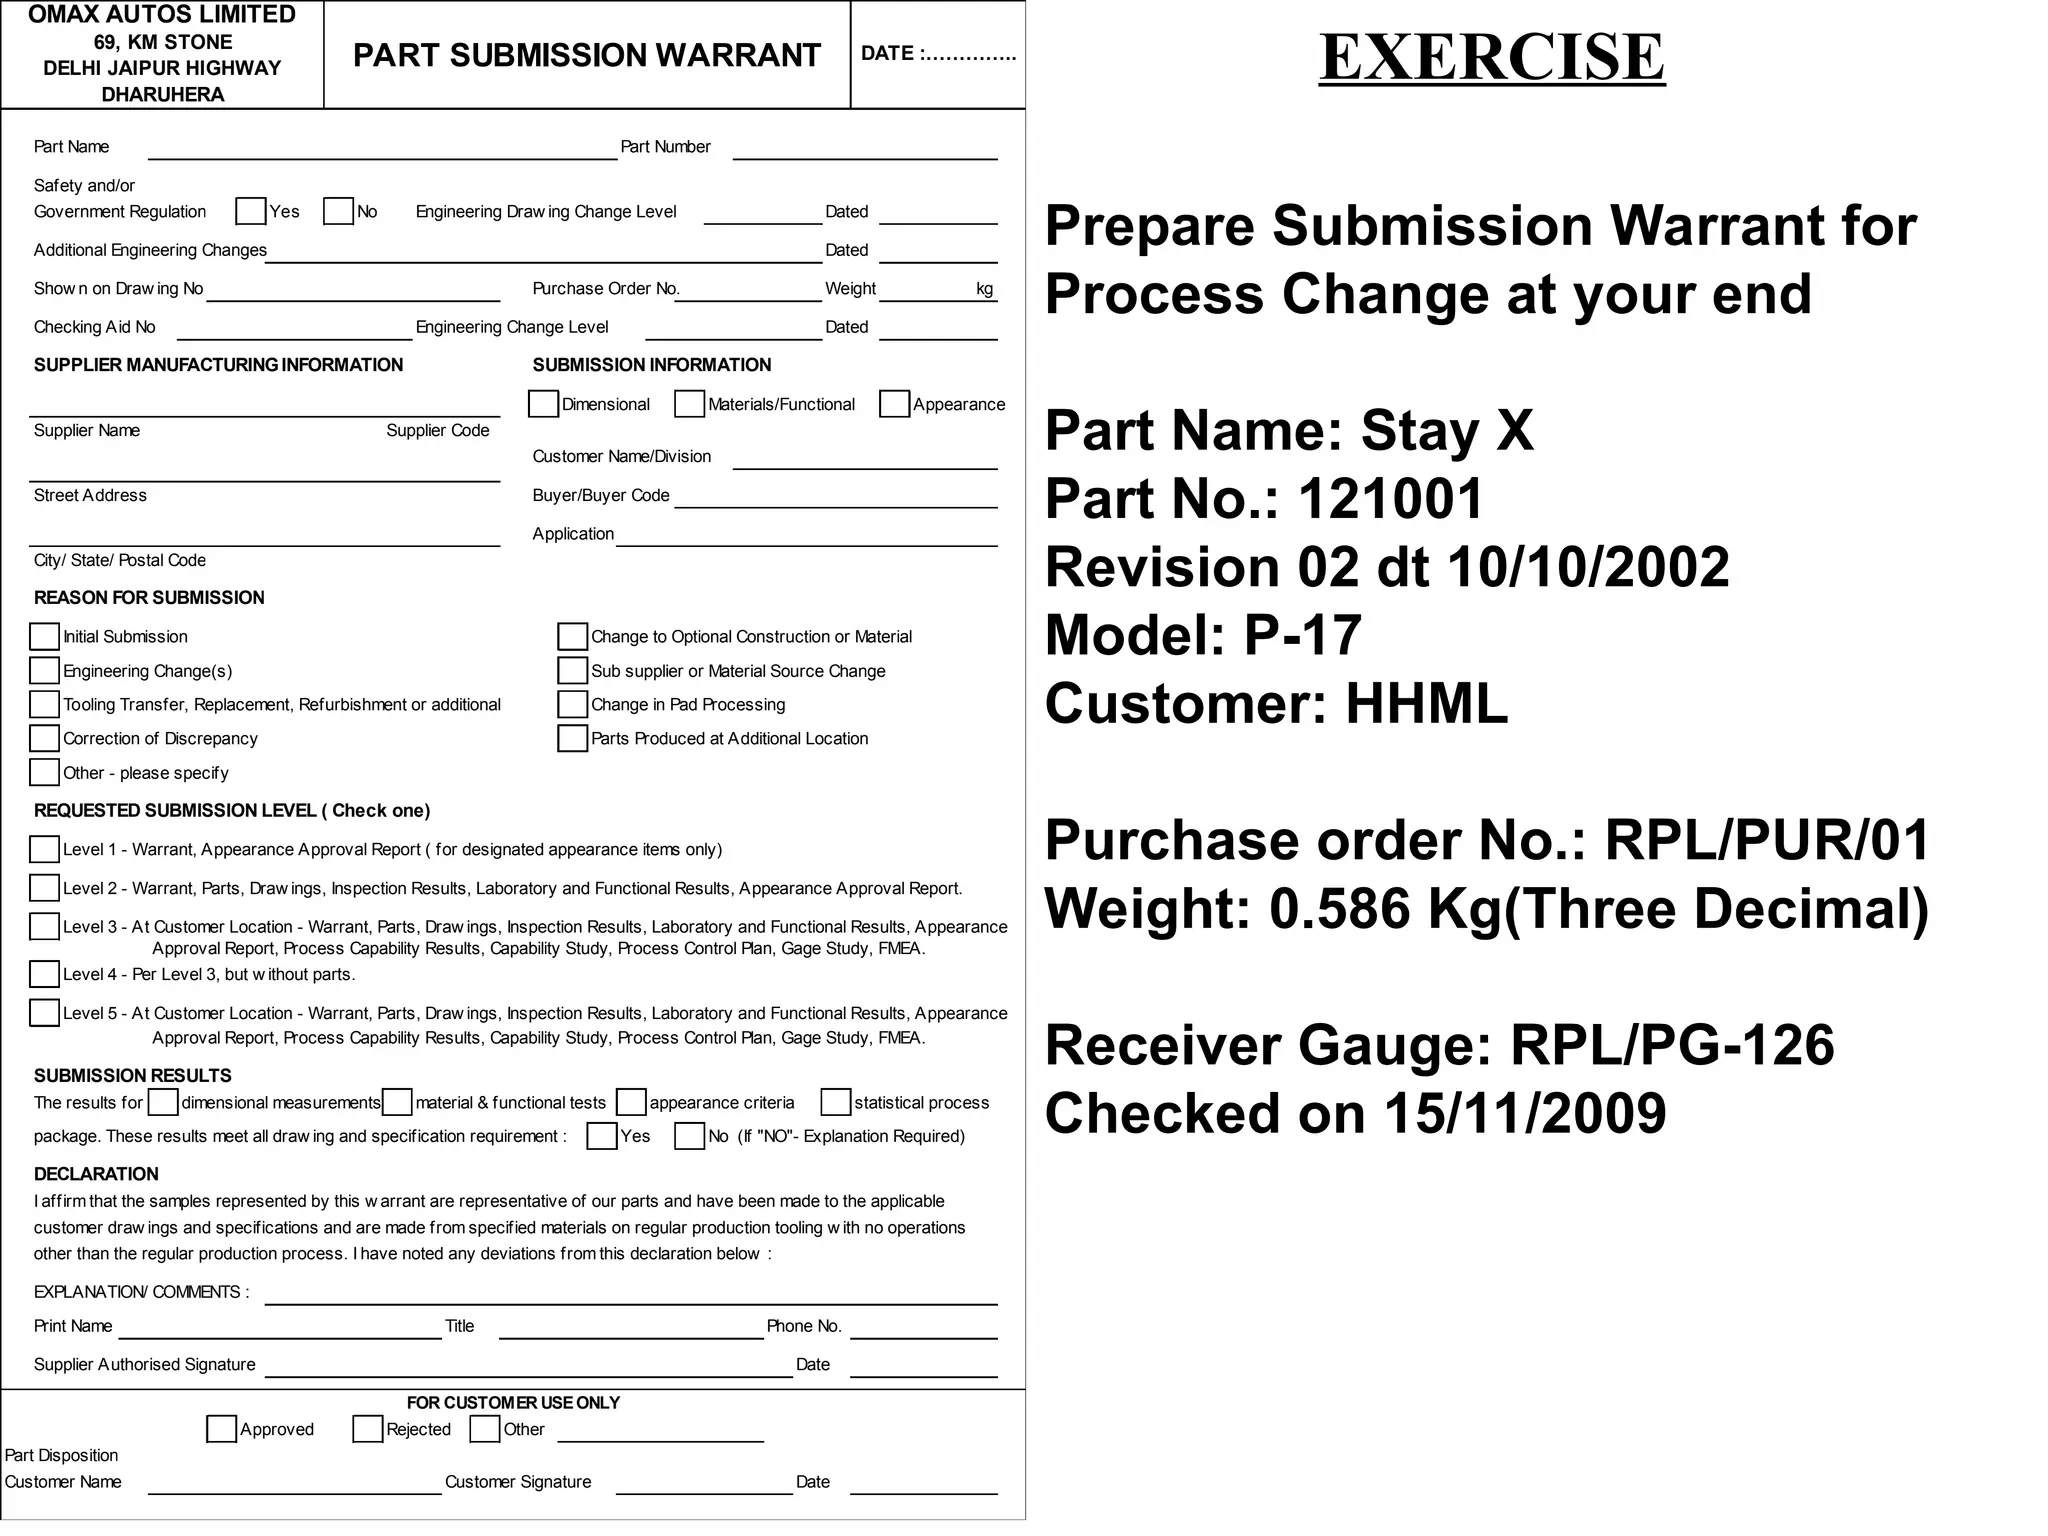
PART SUBMISSION WARRANT DATE :…………..
Prepare Submission Warrant for
Process Change at your end
Part Name: Stay X
Part No.: 121001
Revision 02 dt 10/10/2002
Model: P-17
Customer: HHML
Purchase order No.: RPL/PUR/01
Weight: 0.586 Kg(Three Decimal)
Receiver Gauge: RPL/PG-126
Checked on 15/11/2009
EXERCISE
10.
AAR
Appearance Approval Report
Requiredfor Components having Aesthetic
Importance( Color, grain, Surface
requirements) as specified by Customer viz:-
Painted Parts,Plated Parts etc.
11.
Samples
Master Samples:- Tobe retained by Supplier
Sample Product:- Submitted to customer/
Retained as per Submission Level
Requirements
12.
Design Records
Design Recordscovers All Customer and
supplier design records e.g.
Part Drawing, Specifications, CAD/CAM data
Including detail drawings
13.
Change Documents (IfAny)
Any Authorized Engineering Change document
not yet incorporated in the design record but
incorporated in the part
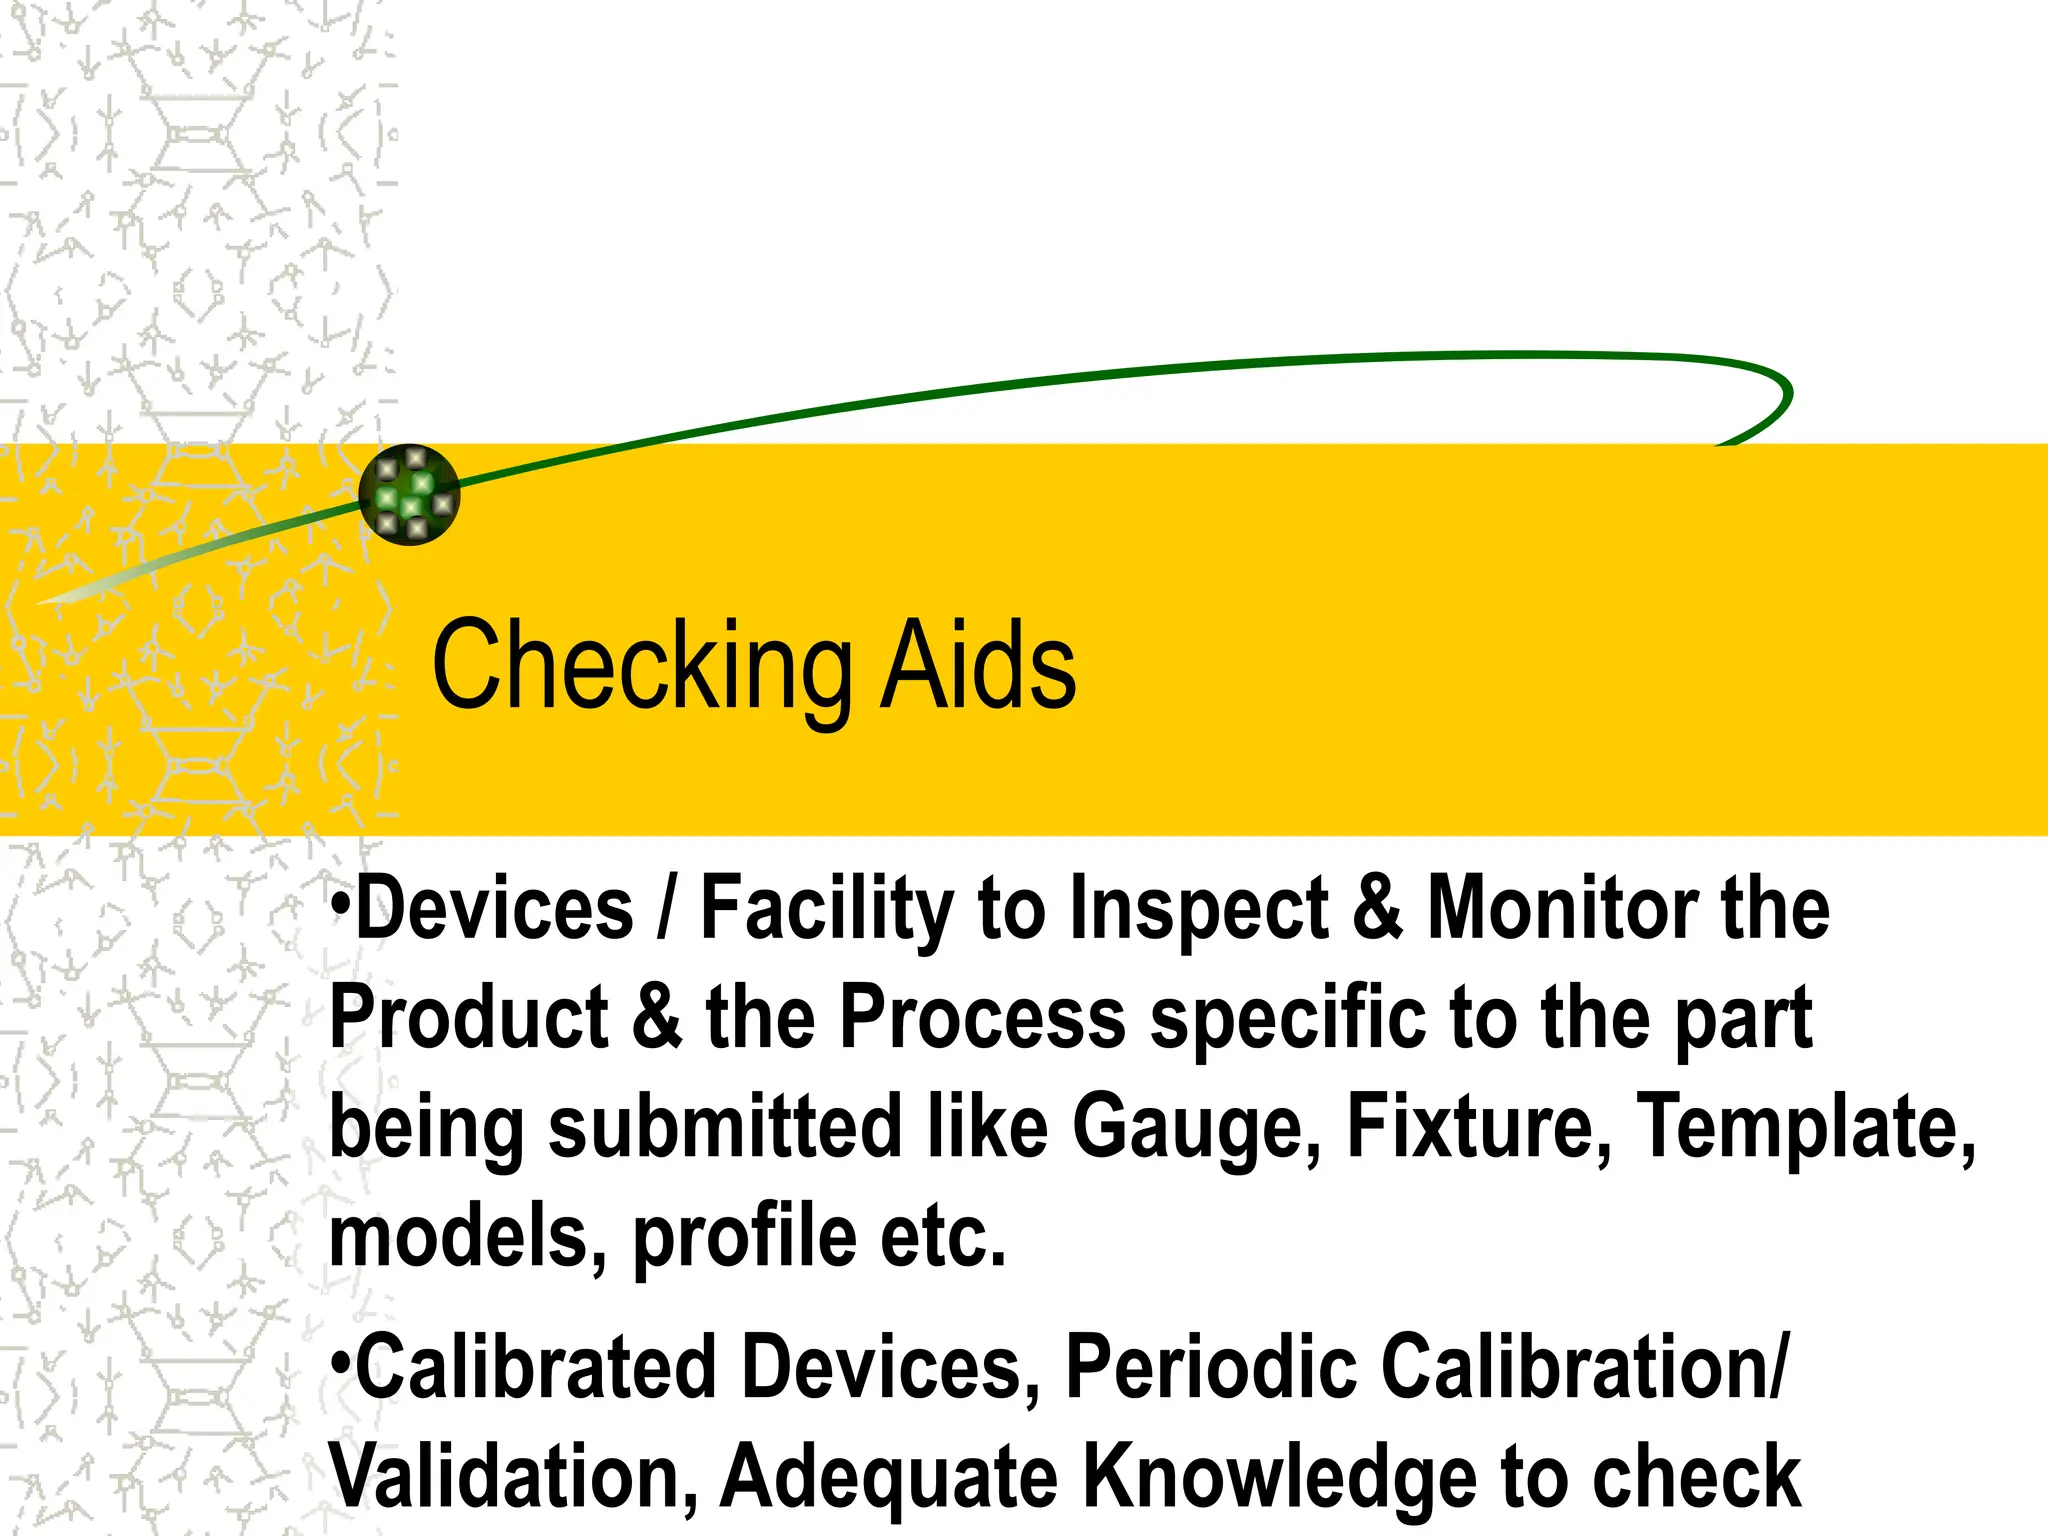
Checking Aids
•Devices /Facility to Inspect & Monitor the
Product & the Process specific to the part
being submitted like Gauge, Fixture, Template,
models, profile etc.
•Calibrated Devices, Periodic Calibration/
Validation, Adequate Knowledge to check
16.
Test Results
•Test Reports(Material,Test & Performance) as
specified in design record.
•Material as per Specification of reference ( IS,
HES,JIS or other applicable standard) in
Drawing
Process Flow Diagram
•Describesbriefly how the process moves
through Different process stages/ location
•Differentiate Route of Material Flow/
Process
•Optimize Use of Floor Space & Avoid Un-
Necessary/Multiple Handling
•Help in Process Audit
CRITICAL CHARACTERSTICS
Those characteristicsthat can effect subsequent
operations, product function or customer satisfaction
May be classified as:-
– Safety
– Fit/Function
– Aesthetic/ Appearance
– Performance etc.
These Characteristics are variously termed as “KEY”,
“SAFETY”, “SIGNIFICANT”, “CRITICAL”
Special Attention at all levels is desired for such
characteristics & Adoption of POKA YOKE to avoid any
type of failure.
Failure Mode andEffects Analysis
Process FMEA used to address potential risks in the manufacturing process achieving
functional performance, by:
– Identifying potential process failures, their causes & effects
– Rating the;
• Severity of effects; 1 to 10 (10 = most severe),
• Occurrence of effects; 1 to 10 (10 = most likely),
• Detection/prevention of effects by current controls eg. test; 1 to 10 (10=unlikely to be detected/prevented),
using guidance available in PFMEA manuals.
– Using the Risk Priority Number (RPN)
…to prioritise action – focussing on preventing failure
• Customers may define triggers for action e.g. RPN >100, Severity > 8
RPN = Severity rating x Occurrence rating x Detection rating
24.
FMEA
FMEA is asystematized technique which identifies and rank
the potential failure modes of a design or manufacturing
process in order to prioritize improvement actions
• DESIGN FMEA
• PROCESS FMEA
SEVERITY(S):-Seriousness of effect (Ranking 1 to 10)
OCCURANCE(O):- Likelihood that a specific cause will
occur( Ranking 1 to 10)
DETECTION(D):-Ability to detect the failure mode(Ranking 1
to 10)
RPN(Risk Priority Number)
RPN=SXOXD (Ranging from 01 to 1000)
25.
FMEA
Item Responsibility &
Function
Requirements
Target
CompletionDate
Actions Taken S
e
v
O
c
c
D
e
t
R
P
N
R
P
N
Recommended
Action(s)
Action Results
Potential
Failure Mode
Potential
Effect(s) of
Failure
S
e
v
C
l
a
s
s
Potential
Cause(s)/
Mechanisms
of Failure
O
c
c
u
r
Current
Controls
(Prevention /
Detection)
D
e
t
e
c
What are the
customer
related
functions or
requirements?
What can
go wrong?
-No function
-Partial/over/
degraded
function
-Intermittent
function
-Unintended
function
What are
the effects?
How
bad
is it?
What are
the
causes?
How often
does it
happen?
How can
cause or
effect be
prevented &
detected?
How good
is this
method at
detecting /
preventing?
What risks
are highest
priority?
What should be
done, by whom
& when?
-design/ process
change
-special controls,
changes in
procedures/
guides
What has
been
done?
Is there
still a
priority
risk?
CONTROL PLAN
Are Writtendescriptions of the System for
controlling Production, Part & Process
Structured Approach for Design, Selection &
Implementation of Control methods
Helps to minimize Product/Process Variations
It is integrated part of Overall Quality Process
Describes actions required at each process phase
Maintained & Used throughout the Product life cycle
Reflects current methods of control & measurement
system used
Process Capability Study
•Purpose: To determine if the production
process is like to produce product that will
meet the customer’s requirements:-
• Control Charts:-
– X bar, R Chart- Variable Data
– np chart : Number of Defectives
– P chart : Proportion Defectives
– C Chart : Number of defects
• Process Capability & Process Capability
Index > 1.67
36.
Data
• Variable Data:
Data/ Readings in which we can assign a particular
number to measurement i.e.
Measurement from V.Caliper, Micrometer, Height
Gauge
So data observed in the form of :-
Dia 25.4, Height- 118.2, Length- 250.6, Temp- 28°C
etc.
• Attribute Data:
Only Decision can be concluded in the form of OK/NG,
GO/NOTGO, Qualify/Not Qualify etc. I.e. Observation
from Plug Gauge, Receiver Gauge, Visual Checking
etc.
37.
CAUSES OF VARIATION
CAUSESOF VARIATION
Common vs Assignable Causes
Common vs Assignable Causes
COMMON CAUSE ASSIGNABLE CAUSE
-Consists of many individual
causes
-Cannot be economically
eliminated
-Process follows a predictab
le pattern
GOK
( GOD ONLY KNOWS )
-Consists of just one or few
individual causes
-Easy to detect and generally
economical to eliminate
-No specific pattern
HAK
( HUMAN ALSO KNOWS )
Technology Advancement
Huge Investment
Experience
38.
Control Charts -Variable data
_
X - R Chart (average, range chart)
_
X - Controls the process setting
R - controls variability
Cpk - The actual value achieved as compared to that which
can be achieved.
Cp - The maximum capability of the process
39.
Control Chart -Variable data
Decide characteristic to be controlled
Define rational sub-groups
Decide subgroup size (usually 4 to 5 Nos)
Obtain data for 20-75 (usually 4 to 5)
Obtain data for 20-25 subgroups
Homogenize data
For X Chart
CL = X =
UCL = X=
+ A2R- ,
LCL = X=
- A2R-
For range chart
CL = R-
UCL = D4R-, LCL = D3R-
40.
Process capability
Performance againstcapability
Cp = Tolerance (Both sided
6 tolerance)
Cpu = USL - µ
3
Cpl = µ - LSL
3
Cpk = (1-K) Cp
Cpk = Min. (Cpu and Cpl )
Measurement System Analysis
•Repeatability:
Variation in measurement obtained with one
measuring instrument when used several times
by an appraiser(Inspector) while measuring the
identical characteristics on the same part
• Reproducibility:
Variations in the average of the measurements
made by different Appraisers(Inspectors) using
the same gauge when measuring a
characteristics on one part
47.
Measurement System Analysis
•GRR or Gauge R & R:
Combined estimate of measurement
system repeatability and
reproducibility
VARIABLE ATTRIBUTE
48.
GAGE REPEATABILITY ANDREPRODUCIBILITY DATA SHEET GAGE REPEATABILITY AND REPRODUCIBILITY DATA SHEET
Analysed By Gage Name Appraiser A
Approved By Gage Number Appraiser B
Part No. Gage Type Appraiser C
Part Name Trials Parts Appraisers Date Performed
3
APPRAISER/ 1 2 3 4 5 6 7 8 9 10 AVERAGE
TRIAL #
1. A 1 0.290 -0.560 1.340 0.470 -0.800 0.020 0.590 -0.310 2.260 -1.360 0.1940
2. 2 0.410 -0.680 1.170 0.500 -0.920 -0.110 0.750 -0.200 1.990 -1.250 0.1660
3. 3 0.640 -0.580 1.270 0.640 -0.840 -0.210 0.660 -0.170 2.010 -1.310 0.2110
4. AVE 0.447 -0.607 1.260 0.537 -0.853 -0.100 0.667 -0.227 2.087 -1.307 xa= 0.1903
5. R 0.350 0.120 0.170 0.170 0.120 0.230 0.160 0.140 0.270 0.110 ra= 0.1840
6. B 1 0.080 -0.470 1.190 0.010 -0.560 -0.200 0.470 -0.630 1.800 -1.680 0.0010
7. 2 0.250 -1.220 0.940 1.030 -1.200 0.220 0.550 0.080 2.120 -1.620 0.1150
8. 3 0.070 -0.680 1.340 0.200 -1.280 0.060 0.830 -0.340 2.190 -1.500 0.0890
9. AVE 0.133 -0.790 1.157 0.413 -1.013 0.027 0.617 -0.297 2.037 -1.600 xb= 0.0683
10. R 0.180 0.750 0.400 1.020 0.720 0.420 0.360 0.710 0.390 0.180 rb= 0.5130
11. C 1 0.040 -1.380 0.880 0.140 -1.460 -0.290 0.020 -0.460 1.770 -1.490 -0.2230
12. 2 -0.110 -1.130 1.090 0.200 -1.070 -0.670 0.010 -0.560 1.450 -1.770 -0.2560
13. 3 -0.150 -0.960 0.670 0.110 -1.450 -0.490 0.210 -0.490 1.870 -2.160 -0.2840
14. AVE -0.073 -1.157 0.880 0.150 -1.327 -0.483 0.080 -0.503 1.697 -1.807 xc= -0.2543
15. R 0.190 0.420 0.420 0.090 0.390 0.380 0.200 0.100 0.420 0.670 rc= 0.3280
16. PART X= 0.0014
AVE ( xp ) 0.169 -0.851 1.099 0.367 -1.064 -0.186 0.454 -0.342 1.940 -1.571 Rp= 3.5111
17. (ra + rb + rc) / (# OF APPRAISERS) = R= 0.34167
18. (Max x - Min x) = xDIFF= 0.44467
19. R x D4* = APPRAISER B OUT OF CONTROL UCLR= 0.88150
20. R x D3* = LCLR= 0.00000
* D4 =3.27 for 2 trials and 2.58 for 3 trials; D3 = 0 for up to 7 trials. UCLR represents the limit of individual R's. Circle those that are
beyond this limit. Identify the cause and correct. Repeat these readings using the same appraiser and unit as originally used or dis-
card values and re-average and recompute R and the limiting value from the remaining observations.
Notes:
1
2
3 10
GAGE REPEATABILITY AND REPRODUCIBILITY DATA SHEET
Analysed By Gage Name Appraiser A
Approved By Gage Number Appraiser B
Part No. Gage Type Appraiser C
Part Name Trials Parts Appraisers Date Performed
Measurement Unit Analysis % Total Variation (TV)
Repeatability - Equipment Variation (EV)
EV = R x K1 Trials K1 % EV = 100 (EV/TV)
= 0.342 x 0.5908 2 0.8862 = 100(0.202/1.146)
= 0.20186 3 0.5908 = 17.61
Reproducibility - Appraiser Variation (AV)
AV = {(xDIFF x K2)2
- (EV2
/nr)}1/2
% AV = 100 (AV/TV)
= {(0.445 x 0.5231)^2 - (0.202 ^2/(10 x 3))}^1/2 = 100(0.230/1.146)
= 0.22967 A ppraisers 2 3 = 20.04
K2 0.7071 0.5231 n = number of parts
Repeatability & Reproducibility (R & R) r = number of trials
R & R = {(EV2
+ AV2
)}1/2
Parts K3
= {(0.202^2 + 0.230^2)}^1/2 2 0.7071 % R&R = 100 (R&R/TV)
= 0.30577 3 0.5231 = 100(0.306/1.146)
Part Variation (PV) 4 0.4467 = 26.68
PV = RP x K3 5 0.4030 Gage system may be acceptable
= 3.511 x 0.3146 6 0.3742
= 1.10460 7 0.3534 % PV = 100 (PV/TV)
Total Variation (TV) 8 0.3375 = 100(1.105/1.146)
TV = {(R&R2
+ PV2
)}1/2
9 0.3249 = 96.38
= {(0.306^2 + 1.105^2)}^1/2 10 0.3146
= 1.14613
1
2
0
3 10 3
49.
REPEATABILITY RANGE CONTROLCHART
Analysed By Gage Name Appraiser A
Approved By Gage Number Appraiser B
Part No. Gage Type Appraiser C
Part Name Trials Parts Appraisers Date Performed
x= UCL = LCL = AVERAGES (X BAR CHART)
r= UCL = LCL = RANGES (R CHART)
PART BY APPRAISER PLOT
3 10
1
2
0
3
0.0014 0.3499 -0.3471
6.0000 0.8815 0.00
-3.0
-2.0
-1.0
0.0
1.0
2.0
3.0
1 2 3 4 5 6 7 8 9 10 11 12 13 14 15 16 17 18 19 20 21 22 23 24 25 26 27 28 29 30
UCL LINE X LCL LINE
0.000
0.200
0.400
0.600
0.800
1.000
1.200
1 2 3 4 5 6 7 8 9 10 11 12 13 14 15 16 17 18 19 20 21 22 23 24 25 26 27 28 29 30
UCL LINE AVERAGE RANGE
-3.00
-2.00
-1.00
0.00
1.00
2.00
3.00
1 2 3 4 5 6 7 8 9 10
APPA APP B APP C
How to proceed
•Prepare Standardized Work Instructions (PQCS)
• Prepare Control Plans
• Prepare Process Routing by Process Flow
diagram
• Conduct FMEA Study & Identify the focus areas
for Improvement & Critical Characteristics
• Establish Control over process by:-
• Process Orientation
• Root cause Analysis & Preventive Actions
• Reducing Process Variations
• Audits & Monitoring
• Demonstrate Process Capability by Calculating
Cp, Cpk
53.
How to proceed
•Approval from customer in case any
significant change in:-
• Machine
• Material
• Method
• Practice Standardized Working & Long Term
Thinking
• Continual Improvement
• Think with:-
• New Methods
New Methods
• New Approach
New Approach
• New Idea
New Idea
• Positive Approach
Positive Approach
“
“Extra Ordinary Results Requires Extra Ordinary Efforts”
Extra Ordinary Results Requires Extra Ordinary Efforts”
Question
Q.1 What isthe objective of PPAP ?
Q2 What is the latest edition of PPAP?
Q3 when PPAP is to be submitted ?
Q4 Define the submission level of PPAP with detail requirement?
Q5 Define the acceptance criteria for MSA Gauge R & R?
Q6 Define the acceptance criteria for MSA Attribute Data?
Q7 Define the SPC Requirement while submitting PPAP?
Q8 define the production run output criteria while Running
PPAP Lot?


![APQP-PPAP[1].ppt for engineering products](https://cdn.slidesharecdn.com/ss_thumbnails/apqp-ppap1-240406033953-f86cdc8f-thumbnail.jpg?width=640&height=640&fit=bounds)


