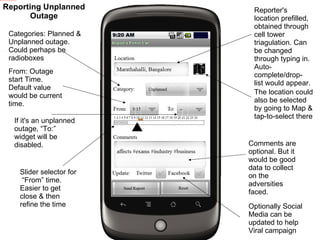
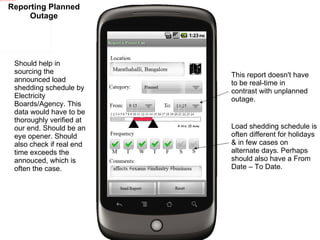
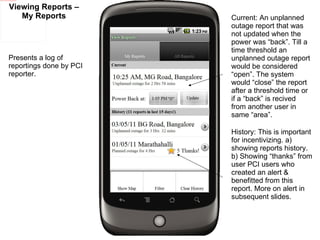
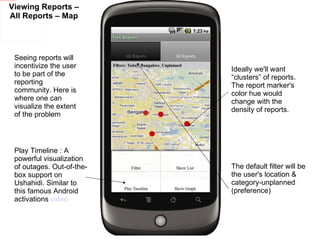
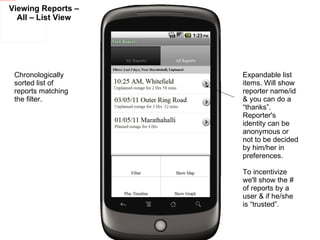
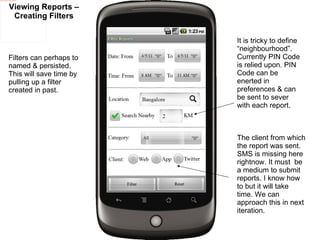
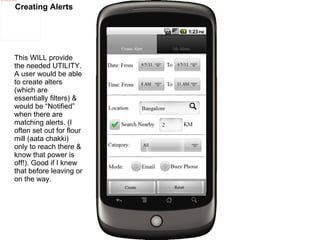
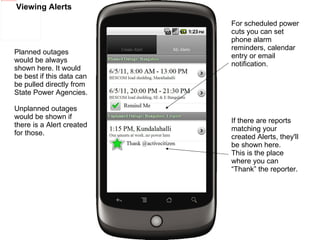
Reporter's location prefilled, obtained through cell tower triagulation. Can be changed through typing in. Auto-complete/drop-list would appear. The location could also be selected by going to Map & tap-to-select there Categories: Planned & Unplanned outage. Could perhaps be radioboxes From: Outage start Time. Default value would be current time. If it's an unplanned outage, “To:” widget will be disabled. Slider selector for  “From” time. Easier to get close & then refine the time Comments are optional. But it would be good data to collect on the adversities faced. Optionally Social Media can be updated to help Viral campaign Reporting Unplanned Outage
Should help in sourcing the announced load shedding schedule by Electricity Boards/Agency. This data would have to be thoroughly verified at our end. Should be an eye opener. Should also check if real end time exceeds the annouced, which is often the case.  Load shedding schedule is often different for holidays & in few cases on alternate days. Perhaps should also have a From Date – To Date. This report doesn't have to be real-time in contrast with unplanned outage. Reporting Planned Outage
Viewing Reports – My Reports Presents a log of reportings done by PCI reporter.  Current: An unplanned outage report that was not updated when the power was “back”. Till a time threshold an unplanned outage report would be considered “open”. The system would “close” the report after a threshold time or if a “back” is recived from another user in same “area”.  History: This is important for incentivizing. a) showing reports history. b) Showing “thanks” from user PCI users who created an alert & benefitted from this report. More on alert in subsequent slides.
Viewing Reports – All Reports – Map Play Timeline : A powerful visualization of outages. Out-of-the-box support on Ushahidi. Similar to this famous Android activations  video Seeing reports will incentivize the user to be part of the reporting community. Here is where one can visualize the extent of the problem Ideally we'll want “clusters” of reports. The report marker's color hue would change with the density of reports.  The default filter will be the user's location & category-unplanned (preference)
Viewing Reports – All – List View Expandable list items. Will show reporter name/id & you can do a “thanks”. Reporter's identity can be anonymous or not to be decided by him/her in preferences.  To incentivize we'll show the # of reports by a user & if he/she is “trusted”. Chronologically sorted list of reports matching the filter.
Viewing Reports – Creating Filters Filters can perhaps to named & persisted. This will save time by pulling up a filter created in past. The client from which the report was sent. SMS is missing here rightnow. It must  be a medium to submit reports. I know how to but it will take time. We can approach this in next iteration. It is tricky to define “neighbourhood”. Currently PIN Code is relied upon. PIN Code can be enerted in preferences & can be sent to sever with each report.
Creating Alerts This WILL provide the needed UTILITY. A user would be able to create alters (which are essentially filters) & would be “Notified” when there are matching alerts. (I often set out for flour mill (aata chakki) only to reach there & know that power is off!). Good if I knew that before leaving or on the way.
Viewing Alerts If there are reports matching your created Alerts, they'll be shown here. This is the place where you can “Thank” the reporter. For scheduled power cuts you can set phone alarm reminders, calendar entry or email notification. Planned outages would be always shown here. It would be best if this data can be pulled directly from State Power Agencies. Unplanned outages would be shown if there is a Alert created for those.

Power Cut Android App Prototype

  • 1.
  • 2.
    Reporter's location prefilled,obtained through cell tower triagulation. Can be changed through typing in. Auto-complete/drop-list would appear. The location could also be selected by going to Map & tap-to-select there Categories: Planned & Unplanned outage. Could perhaps be radioboxes From: Outage start Time. Default value would be current time. If it's an unplanned outage, “To:” widget will be disabled. Slider selector for “From” time. Easier to get close & then refine the time Comments are optional. But it would be good data to collect on the adversities faced. Optionally Social Media can be updated to help Viral campaign Reporting Unplanned Outage
  • 3.
    Should help insourcing the announced load shedding schedule by Electricity Boards/Agency. This data would have to be thoroughly verified at our end. Should be an eye opener. Should also check if real end time exceeds the annouced, which is often the case. Load shedding schedule is often different for holidays & in few cases on alternate days. Perhaps should also have a From Date – To Date. This report doesn't have to be real-time in contrast with unplanned outage. Reporting Planned Outage
  • 4.
    Viewing Reports –My Reports Presents a log of reportings done by PCI reporter. Current: An unplanned outage report that was not updated when the power was “back”. Till a time threshold an unplanned outage report would be considered “open”. The system would “close” the report after a threshold time or if a “back” is recived from another user in same “area”. History: This is important for incentivizing. a) showing reports history. b) Showing “thanks” from user PCI users who created an alert & benefitted from this report. More on alert in subsequent slides.
  • 5.
    Viewing Reports –All Reports – Map Play Timeline : A powerful visualization of outages. Out-of-the-box support on Ushahidi. Similar to this famous Android activations video Seeing reports will incentivize the user to be part of the reporting community. Here is where one can visualize the extent of the problem Ideally we'll want “clusters” of reports. The report marker's color hue would change with the density of reports. The default filter will be the user's location & category-unplanned (preference)
  • 6.
    Viewing Reports –All – List View Expandable list items. Will show reporter name/id & you can do a “thanks”. Reporter's identity can be anonymous or not to be decided by him/her in preferences. To incentivize we'll show the # of reports by a user & if he/she is “trusted”. Chronologically sorted list of reports matching the filter.
  • 7.
    Viewing Reports –Creating Filters Filters can perhaps to named & persisted. This will save time by pulling up a filter created in past. The client from which the report was sent. SMS is missing here rightnow. It must be a medium to submit reports. I know how to but it will take time. We can approach this in next iteration. It is tricky to define “neighbourhood”. Currently PIN Code is relied upon. PIN Code can be enerted in preferences & can be sent to sever with each report.
  • 8.
    Creating Alerts ThisWILL provide the needed UTILITY. A user would be able to create alters (which are essentially filters) & would be “Notified” when there are matching alerts. (I often set out for flour mill (aata chakki) only to reach there & know that power is off!). Good if I knew that before leaving or on the way.
  • 9.
    Viewing Alerts Ifthere are reports matching your created Alerts, they'll be shown here. This is the place where you can “Thank” the reporter. For scheduled power cuts you can set phone alarm reminders, calendar entry or email notification. Planned outages would be always shown here. It would be best if this data can be pulled directly from State Power Agencies. Unplanned outages would be shown if there is a Alert created for those.