‘From Molecular to Systems Nutrition. Lessons from mouse to man’ NUGO Dublin...
PosterPrint
1. Introduction
Drosophila melanogaster is a useful model
organism because it has a short generation
time, requires little maintenance, and most
importantly shares many disease-causing
genes with humans. Obesity, a growing
concern for humans, can be studied
using Drosophila to identify responsible
genes and study their activities.
Drosophila selected for starvation
resistance have the ability to survive longer
than controls when starved. These flies are
also larger and appear more "obese" when
physically compared to non-selected
populations. To investigate how diet might
affect fat storage in these flies, we reared
larvae on media containing different
caloric contents and different levels of
dietary sugar and protein.
Methods & Materials
Larvae from 3 replicated starvation-
selected and 3 replicated non-selected
control populations were reared on low,
medium, and high (L, M, H) caloric foods
of 10g, 20g, and 30g per 100ml of water.
Each caloric level was made of sugar and
yeast with sugar fractions of 10, 30, 50,
70, and 90% (e.g. a low caloric level of
10% sugar would contain 1g of sugar and
9g of yeast per 100 ml). The eclosing flies
were collected starting on day 8 and
were collected every 24 hours until all
flies had eclosed. Development data
were collected for all eclosed flies. Only
females were used for energy content
assays. Female flies, 2 per sample and 6-
8 samples per replicated population,
were homogenized in lysis buffer.
Triglyceride assays were carried out used
the Infinity Triglyceride kit (Thermo
Scientific) and protein assays were
conducted using the bicinchoninic acid
method (Smith et al., 1985). Data for
these assays were collected using a 96-
well plate reader.
Conclusions
• Protein levels were less affected than
triglyceride levels for all populations,
which suggests that selected flies in
general and control flies on a high
sugar diet are not simply bigger but are
specifically more obese.
• High sugar diets caused delayed
development time. Because the flies
gain the majority of their fat stores as
larvae, flies that took longer to develop
were fatter when they eclosed.
• Starvation selected flies had higher
triglyceride concentrations for all
caloric levels and sugar fractions when
compared to controls. Control flies fed
the highest caloric amount and with
the highest sugar fraction were able to
match triglyceride concentration
ranges of selected flies on the lowest
sugar fraction.
Acknowledgements
References
Masek. P., L.A. Reynolds, W.L. Bollinger, C.
Moody, A. Mehta, A.G. Gibbs and A.C.
Keene (2014). Altered regulation of sleep
and feeding contributes to starvation
resistance in Drosophila. Journal of
Experimental Biology 217: 3122-3132.
Smith, PK, Krohn, RI, Hermanson, GT et al.
(1985). Measurement of protein using
bicinchoninic acid. Analytical Biochemistry
150: 76-85.
Funding for this program was provided by the
National Science Foundation grant DBI REU
1358896.
Additional funding was provided by National
Science Foundation grant IOS-1355210.
Special thanks to Maeleen Morrison for figures
3 and 4.
Effects of Altered Diets on Development and Energy Content of Drosophila melanogaster
Paige E. Jacobs1,3, Alyssa A. Caplan2,3, Allen G. Gibbs3
1Department of Biology, SUNY Fredonia, Fredonia, NY, 14063, USA
2Department of Biology, Vassar College, Poughkeepsie, NY, 12604, USA
3School of Life Sciences, University of Nevada, Las Vegas, NV, 89154, USA
Effect
(F/R)
SS df MS F p
Selection Fixed 38.99 1 38.99 13.763 0.020656
Replication
(Selection)
Random 11.33 4 2.83 4.006 0.003951
Calorie Level Fixed 66.67 2 33.34 47.143 0.000000
Fraction
Sugar
Fixed 683.87 4 170.97 241.781 0.000000
Sex Fixed 0.00 1 0.00 0.003 0.953843
Error 118.09 167 0.71
Development Time
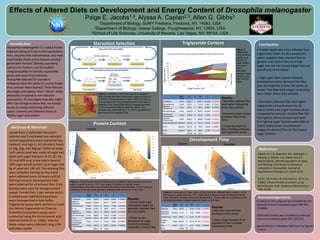
Triglyceride Content
Protein Content
Effect
(F/R)
SS df MS F p
{1}Selection Fixed 13509.4 1 13509.4 3.3655 0.140486
Replicate
(Selection)
Random 16056.2 4 4014.1 7.8059 0.002733
{3}CalorieLevel Fixed 1344.9 2 672.5 1.7084 0.241096
2(1*3) Random 3149.0 8 393.6 3.6181 0.002994
Selection*
CalorieLevel
Fixed 465.8 2 232.9 0.5916 0.575926
{4}FractionSugar Fixed 3999.8 4 1000.0 4.3590 0.014219
2(1*4) Random 3670.4 16 229.4 2.1086 0.028374
CalorieLevel*
FractionSugar
Fixed 1734.0 8 216.8 1.9923 0.072532
Selection*
FractionSugar
Fixed 1854.0 4 463.5 2.0205 0.139908
Error 4351.7 40 108.8
Effect
(F/R)
SS df MS F p
{1}Selection Fixed 84281.2 1 84281.2 46.4806 0.002420
{3}CalorieLevel Fixed 2215.7 2 1107.8 2.8657 0.115214
Selection*
CalorieLevel
Fixed 525.9 2 262.9 0.6801 0.533584
{4}FractionSugar Fixed 33390.6 4 8347.7 54.0441 0.000000
CalorieLevel*
FractionSugar
Fixed 1796.9 8 224.6 2.3929 0.032755
Selection*
FractionSugar
Fixed 9635.2 4 2408.8 15.5950 0.000022
Replicate(Selection) Random 7253.0 4 1813.3 4.0548 0.033857
2*4(1) Random 2471.4 16 154.5 1.6455 0.100827
2*3(1) Random 3092.7 8 386.6 4.1185 0.001176
Error 3754.6 40 93.9
L
M
H
0
20
40
60
80
100
120
140
160
10 30 50 70 90
140-160 120-140 100-120 80-100 60-80 40-60 20-40 0-20
Sugar Fraction (%)
TriglycerideConc.
CaloricLevel
Starvation Selection
Figure 1. Selection method for starvation resistant
flies. Eclosed are flies transferred to agar and starved
until 80% of the population is dead. Surviving flies go
on to produce the next generation and the process is
repeated. The control flies did not undergo starvation
but the remaining methods were the same. This
process was conducted for A, B, and C populations of
both control and selected flies.
Figure 2.
Triglyceride
concentrations
(mg/fly) as a
function of
sugar fraction
and caloric
level.
Starvation
selected levels
shown on top
with controls
below.
Figure 3. Protein levels (mg/fly) of flies reared on different caloric levels (L,M,H) and
sugar to yeast ratios (ex. 3/7). Light yellow indicates the highest protein
concentrations while dark blue indicates the lowest concentrations. Control data are
presented on the left while starvation resistant data are shown on the right.
Figure 4. Development times (days) of flies reared on different caloric levels (L,M,H)
and sugar to yeast ratios (ex. 3/7). Light yellow indicates longer development times,
while dark blue indicates more rapid development. Control data are presented on the
left while starvation resistant data are shown on the right.
Results:
• Starvation-selected flies
have higher triglyceride
levels than controls
• Increasing sugar fraction
increases triglyceride
levels
• Longer development
time correlates positively
with triglyceride levels
Results:
• Starvation selected flies
developed more slowly
• Higher sugar fractions of all
populations had increased
development time
Results:
• Protein levels were
consistently higher for
starvation selected flies
but only slightly
• Protein levels
decreased as sugar
fractions increased,
especially in control flies
Yeast (g)Yeast (g)
Sugar(g)
Sugar(g)
Yeast (g)Yeast (g)
Sugar(g)
Sugar(g)
Control Selected
SelectedControl