SlideShare a Scribd company logo
Samples collected and brought back to lab for analysis.
Prepared mTec plates are labeled with date and site
Membrane filtration system is set up
• Sterile filter is placed over suction funnel.
• Starting with the lowest volume samples are filtered through the
membrane to collect the bacteria
Filter is placed on mTec plate and allowed to incubate for 2 hours at
35ᵒC then 44.5ᵒC for 24 hours.
• After 24 hours the number of purple colonies are counted, averaged,
and each dilution multiplied to get CFU/100mL
Introduction
Method
Escherichia coli levels at Lake Herrick and Parvo Pond
AJ Shockley and Keri Lydon
UGAqua Team: Mary Baxter, Chris Gowen, Aaron Moon
UGAqua, Environmental Health Science University of Georgia, Athens Georgia, 30602
Future Research
Figure 2. Levels of E. coli at Lake Herrick on dry and rainy days. Average CFU/100mL of water +/- S.D. from 3 samples at 3 sampling sites per day on the days listed.
Average E. coli levels at both the beach and bridge sites of Lake Herrick are below the EPA limit. The highest levels of E. coli were observed on 10/15/14 during a rain event. At the beach site E. coli
levels reach 1620.0 CFU/100mL nearly quadrupling the EPA limit of 410 CFU/100mL. Had samples been taken at the bridge site a spike in E. coli would have been observed. This is because during and
after rain events water flows over impervious and pervious surfaces picking up pollutants and sediments which are deposited into the waterway.
Figure 3. Levels of E. coli at Parvo Pond on dry days. Average CFU/100mL of water +/- S.D. from 3 samples from 1 sampling site per day on the days listed.
Average E. coli levels are higher at Parvo Pond than those of Lake Herrick. A spike in E. coli levels is observed at the 2nd sampling site at Parvo Pond because this area has little cover from brush
and shrubs while the 1st and 3rd are insulated by plant life reducing the amount of loose sediment and access by animals. The 1st site is the only site with levels below the EPA limit. This can be
attributed to the presence of plant cover as well as a layer of thick mud along the shoreline which traps sediments and reduces access by animals.
1. Morphis, C., McCalum, C., Keys, L., Ammons, J., Respress, J., and Tilghman, L. (2014). Restoring Lake Herrick:
Information for Improved Water Quality and Enhanced Recreational Value. Georgia: Univeristy of Georgia.
http://www.rivercenter.uga.edu/publications/pdf/lake_herrick_report_final.pdf
2. Ishii, S. and Sadowsky, M. (2008). Escherichia coli in the Environment: Implication for Water Quality and Human
Health. Minnesota: University of Minnesota. https://www.jstage.jst.go.jp/article/jsme2/23/2/23_2_101/_pdf
3. Fisher, D., Dillard, A., Usery, E., Steiner, J. and Neely, C. (2001). Water Quality in the Headwaters of the Upper
Oconee Watershed. Georgia: University of Georgia.
https://smartech.gatech.edu/bitstream/handle/1853/43796/FisherD-01.pdf
4. Little, E., Eggert, S., Wenner, D., Rasmussen, T., Conners, D., and Fisher, D. (2007). Results from Six Years of
Community-Based Volunteer Water Quality Monitoring By the Upper Oconee Watershed Network. Georgia:
University of Georgia. http://www.gwri.gatech.edu/sites/default/files/files/docs/2007/6.2.4.pdf
Works Cited
Discussion
Results
•The UGA Office of Sustainability seeks to reopen Lake Herrick for recreational use. Before this is
possible diagnostic analysis must be conducted to determine what other contaminants are present in
the lake. In the past the Upper Oconee Watershed Network has conducted tests for turbidity,
conductivity, and nutrient levels, similar tests are needed for Lake Herrick and Parvo Pond in order to
fully understand the extent of impairment in these water bodies.4
•Determine the sources on contamination in Parvo Pond and identify to what extent contaminants
present in Parvo are affecting Lake Herrick.
•Raise awareness to local community about preserving water quality by fostering a sense of
stewardship toward the Lake Herrick and Parvo Pond. Encourage picking up litter and pet droppings
along with responsible water usage.
On average Lake Herrick and Parvo Pond have relatively low E. coli levels but spike beyond
the EPA limit during rain events. Levels at the bridge site tend to by higher than those at the
beach because the bridge is closer to areas of input (Parvo Pond, nearby roadways, and
storm drains). Also the beach is nearest to an area of output which feeds into the Oconee.
Another source of contamination is wild animal and pet feces especially at Parvo Pond.
Efforts to promote water quality within the watershed include: Repairing and building of new
infrastructure and pipes as well as research and public outreach.
A special thanks to Keri Lydon organizing UGAqua and for applying for the Office of Sustainability grant which provided
funding for this project. The UGAqua members who worked on this project include: Mary Baxter, Chris Gowen and Aaron
Moon.
Acknowledgements
Lake Herrick and Parvo Pond
Lake Herrick is a 15 acre engineered recreational lake that feeds into the North Oconee River and is
located on the southern part of campus adjacent to the intramural fields. Parvo Pond is a small pond
surrounded by a dog park which feeds into Lake Herrick. Though located within a forest area both sites
are deeply influenced by surrounding urbanized areas (nearby parking lots and roadways).1
Recreational Risk and Fecal
Indicators
In the interest of preserving water
quality the EPA has established a list
of criteria known as the Recreational
Water Quality Criteria (RWQC) to
access and reduce recreational risk.
Recreational risk is the number of
people out of 1000 exposed
individuals who will become ill due
to that exposure. The RWQC lists the
allowable amounts of fecal
indicators, enterococci and E.coli, in
order to reduce recreational risk.2
These bacteria are used because
their presence in recreational waters
is indicative of fecal contamination,
a hazard to human health.
Status of Lake Herrick and Parvo Pond
Lake Herrick was originally established for recreation and research but in 2001 swimming and
boating was banned to the public and the beach area closed.1 Though levels of E.coli are below the
RWQC maximum allowable level of 410 CFU (Coliform Forming Units) per 100 mL the water is seen
as unsafe for recreational use. Parvo Pond faces similar issues but is far more impaired by algae,
organic material and other contaminants.3
Image 5. Parvo Pond during a dry day at ~9:00AM Image 6. Drainage pipe at Parvo Pond that feeds into Lake
Herrick.
Figure1. Map of the Oconee Forest Park with highlighted locations of Lake
Herrick and Parvo Pond.
Photo credit: http://warnell.forestry.uga.edu/ofp/maps.html

More Related Content

What's hot

SEASONAL VARIATION IN PHYSICO-CHEMICAL PARAMETERS OF SURFACE WATER AND GROUND...
SEASONAL VARIATION IN PHYSICO-CHEMICAL PARAMETERS OF SURFACE WATER AND GROUND...SEASONAL VARIATION IN PHYSICO-CHEMICAL PARAMETERS OF SURFACE WATER AND GROUND...
SEASONAL VARIATION IN PHYSICO-CHEMICAL PARAMETERS OF SURFACE WATER AND GROUND...
Ijrdt Journal
 
Suzanne Bricker's Oyster Restoration Workshop Presentation
Suzanne Bricker's Oyster Restoration Workshop PresentationSuzanne Bricker's Oyster Restoration Workshop Presentation
Suzanne Bricker's Oyster Restoration Workshop Presentation
Chesapeake Bay Foundation
 
EPA Marine Phytoplankton Fact Sheet
EPA Marine Phytoplankton Fact SheetEPA Marine Phytoplankton Fact Sheet
EPA Marine Phytoplankton Fact Sheet
Environmental Protection Agency, Ireland
 
EPA Lake Monitoring Aquatic Plants Fact Sheet
EPA Lake Monitoring Aquatic Plants Fact SheetEPA Lake Monitoring Aquatic Plants Fact Sheet
EPA Lake Monitoring Aquatic Plants Fact Sheet
Environmental Protection Agency, Ireland
 
EPA River Monitoring Fact Sheet
EPA River Monitoring Fact SheetEPA River Monitoring Fact Sheet
EPA River Monitoring Fact Sheet
Environmental Protection Agency, Ireland
 
Organizing for Clean and Affordable Water
Organizing for Clean and Affordable WaterOrganizing for Clean and Affordable Water
Organizing for Clean and Affordable Water
Healthy Lakes, Healthy Lives
 
EPA Lake Monitoring Fact Sheet
EPA Lake Monitoring Fact SheetEPA Lake Monitoring Fact Sheet
EPA Lake Monitoring Fact Sheet
Environmental Protection Agency, Ireland
 
Stress of Environmental Pollution on Zooplanktons and theirComparative Studi...
	Stress of Environmental Pollution on Zooplanktons and theirComparative Studi...	Stress of Environmental Pollution on Zooplanktons and theirComparative Studi...
Stress of Environmental Pollution on Zooplanktons and theirComparative Studi...
theijes
 
EPA Marine Monitoring Fact Sheet
EPA Marine Monitoring Fact SheetEPA Marine Monitoring Fact Sheet
EPA Marine Monitoring Fact Sheet
Environmental Protection Agency, Ireland
 
Moscicki_David_CV_20160823
Moscicki_David_CV_20160823Moscicki_David_CV_20160823
Moscicki_David_CV_20160823David Moscicki
 
Wakarusa Wetlands
Wakarusa Wetlands Wakarusa Wetlands
Wakarusa Wetlands
Gala Korniyenko
 
Examples of ideas for the training
Examples of ideas for the trainingExamples of ideas for the training
Examples of ideas for the trainingAhmed Tarek Fahmy
 
Acidification Limnology Lit Review
Acidification Limnology Lit ReviewAcidification Limnology Lit Review
Acidification Limnology Lit ReviewJorge Gomez
 
River Woods Start
River Woods StartRiver Woods Start
River Woods Start
Laura Amatulli
 

What's hot (20)

20110228.sun yangbo
20110228.sun yangbo20110228.sun yangbo
20110228.sun yangbo
 
SEASONAL VARIATION IN PHYSICO-CHEMICAL PARAMETERS OF SURFACE WATER AND GROUND...
SEASONAL VARIATION IN PHYSICO-CHEMICAL PARAMETERS OF SURFACE WATER AND GROUND...SEASONAL VARIATION IN PHYSICO-CHEMICAL PARAMETERS OF SURFACE WATER AND GROUND...
SEASONAL VARIATION IN PHYSICO-CHEMICAL PARAMETERS OF SURFACE WATER AND GROUND...
 
Suzanne Bricker's Oyster Restoration Workshop Presentation
Suzanne Bricker's Oyster Restoration Workshop PresentationSuzanne Bricker's Oyster Restoration Workshop Presentation
Suzanne Bricker's Oyster Restoration Workshop Presentation
 
EPA Marine Phytoplankton Fact Sheet
EPA Marine Phytoplankton Fact SheetEPA Marine Phytoplankton Fact Sheet
EPA Marine Phytoplankton Fact Sheet
 
EPA Lake Monitoring Aquatic Plants Fact Sheet
EPA Lake Monitoring Aquatic Plants Fact SheetEPA Lake Monitoring Aquatic Plants Fact Sheet
EPA Lake Monitoring Aquatic Plants Fact Sheet
 
EPA River Monitoring Fact Sheet
EPA River Monitoring Fact SheetEPA River Monitoring Fact Sheet
EPA River Monitoring Fact Sheet
 
Technical Summary
Technical SummaryTechnical Summary
Technical Summary
 
Aquatic biological monitoring, richard hunt
Aquatic biological monitoring, richard huntAquatic biological monitoring, richard hunt
Aquatic biological monitoring, richard hunt
 
Organizing for Clean and Affordable Water
Organizing for Clean and Affordable WaterOrganizing for Clean and Affordable Water
Organizing for Clean and Affordable Water
 
EPA Lake Monitoring Fact Sheet
EPA Lake Monitoring Fact SheetEPA Lake Monitoring Fact Sheet
EPA Lake Monitoring Fact Sheet
 
Stream Ecology
Stream EcologyStream Ecology
Stream Ecology
 
Stress of Environmental Pollution on Zooplanktons and theirComparative Studi...
	Stress of Environmental Pollution on Zooplanktons and theirComparative Studi...	Stress of Environmental Pollution on Zooplanktons and theirComparative Studi...
Stress of Environmental Pollution on Zooplanktons and theirComparative Studi...
 
EPA Marine Monitoring Fact Sheet
EPA Marine Monitoring Fact SheetEPA Marine Monitoring Fact Sheet
EPA Marine Monitoring Fact Sheet
 
CV
CVCV
CV
 
Moscicki_David_CV_20160823
Moscicki_David_CV_20160823Moscicki_David_CV_20160823
Moscicki_David_CV_20160823
 
Wakarusa Wetlands
Wakarusa Wetlands Wakarusa Wetlands
Wakarusa Wetlands
 
Examples of ideas for the training
Examples of ideas for the trainingExamples of ideas for the training
Examples of ideas for the training
 
PosterSutherland_Midwest
PosterSutherland_MidwestPosterSutherland_Midwest
PosterSutherland_Midwest
 
Acidification Limnology Lit Review
Acidification Limnology Lit ReviewAcidification Limnology Lit Review
Acidification Limnology Lit Review
 
River Woods Start
River Woods StartRiver Woods Start
River Woods Start
 

Similar to Poster

Impact Of Increased Nutrient Input On Coral Reefs On Bonaire And Curacao
Impact Of Increased Nutrient Input On Coral Reefs On Bonaire And CuracaoImpact Of Increased Nutrient Input On Coral Reefs On Bonaire And Curacao
Impact Of Increased Nutrient Input On Coral Reefs On Bonaire And Curacao
Mark W. Wieggers MSc.
 
A STUDY ON THE IMPACT OF POLLUTION IN BELLANDUR LAKE DUE TO URBANIZATION
A STUDY ON THE IMPACT OF POLLUTION IN BELLANDUR LAKE DUE TO URBANIZATIONA STUDY ON THE IMPACT OF POLLUTION IN BELLANDUR LAKE DUE TO URBANIZATION
A STUDY ON THE IMPACT OF POLLUTION IN BELLANDUR LAKE DUE TO URBANIZATION
Amartya Jha
 
PosterUSCResearchSymposium2013_6
PosterUSCResearchSymposium2013_6PosterUSCResearchSymposium2013_6
PosterUSCResearchSymposium2013_6Elaine Krebs
 
MMR AFCEE Brochure 2010
MMR AFCEE Brochure 2010MMR AFCEE Brochure 2010
MMR AFCEE Brochure 2010R. J. Cannata
 
Belize Poster with current and DO temp.pptx
Belize Poster with current and DO temp.pptxBelize Poster with current and DO temp.pptx
Belize Poster with current and DO temp.pptxShannon Dexter
 
Comments on adding microbeads to Schedule 1 of CEPA 1999 – September 30, 2015
Comments on adding microbeads to Schedule 1 of CEPA 1999 – September 30, 2015Comments on adding microbeads to Schedule 1 of CEPA 1999 – September 30, 2015
Comments on adding microbeads to Schedule 1 of CEPA 1999 – September 30, 2015
LOWaterkeeper
 
Freshwater Matters June2014
Freshwater Matters June2014Freshwater Matters June2014
Freshwater Matters June2014
Lancaster University
 
jurnal gilang.pptx
jurnal gilang.pptxjurnal gilang.pptx
jurnal gilang.pptx
RezaAndrea1
 
Eric final AGUA research project poster
Eric final AGUA research project posterEric final AGUA research project poster
Eric final AGUA research project posterEric Rivas
 
CA Ocean Plan 2013 Update: SHELL New Fecal Bacteria Standards
CA Ocean Plan 2013 Update: SHELL New Fecal Bacteria StandardsCA Ocean Plan 2013 Update: SHELL New Fecal Bacteria Standards
CA Ocean Plan 2013 Update: SHELL New Fecal Bacteria StandardsBeth Alexander
 
WQRJC-D-12-00047
WQRJC-D-12-00047WQRJC-D-12-00047
WQRJC-D-12-00047Guy Gilron
 
Laguna Lake Health Risk Assesment ACTA carcinogenic arsenic_released_feb2015
Laguna Lake Health Risk Assesment ACTA carcinogenic arsenic_released_feb2015Laguna Lake Health Risk Assesment ACTA carcinogenic arsenic_released_feb2015
Laguna Lake Health Risk Assesment ACTA carcinogenic arsenic_released_feb2015
Berean Guide
 
SCANU B129829-Final Project Report
SCANU B129829-Final Project ReportSCANU B129829-Final Project Report
SCANU B129829-Final Project ReportSimona Scanu
 
3.Environmental variability at a marine cage culture.pdf
3.Environmental variability at a marine cage culture.pdf3.Environmental variability at a marine cage culture.pdf
3.Environmental variability at a marine cage culture.pdf
earambulm3
 

Similar to Poster (20)

Final EHS 428 Poster
Final EHS 428 PosterFinal EHS 428 Poster
Final EHS 428 Poster
 
Impact Of Increased Nutrient Input On Coral Reefs On Bonaire And Curacao
Impact Of Increased Nutrient Input On Coral Reefs On Bonaire And CuracaoImpact Of Increased Nutrient Input On Coral Reefs On Bonaire And Curacao
Impact Of Increased Nutrient Input On Coral Reefs On Bonaire And Curacao
 
A STUDY ON THE IMPACT OF POLLUTION IN BELLANDUR LAKE DUE TO URBANIZATION
A STUDY ON THE IMPACT OF POLLUTION IN BELLANDUR LAKE DUE TO URBANIZATIONA STUDY ON THE IMPACT OF POLLUTION IN BELLANDUR LAKE DUE TO URBANIZATION
A STUDY ON THE IMPACT OF POLLUTION IN BELLANDUR LAKE DUE TO URBANIZATION
 
Report
ReportReport
Report
 
PosterUSCResearchSymposium2013_6
PosterUSCResearchSymposium2013_6PosterUSCResearchSymposium2013_6
PosterUSCResearchSymposium2013_6
 
MMR AFCEE Brochure 2010
MMR AFCEE Brochure 2010MMR AFCEE Brochure 2010
MMR AFCEE Brochure 2010
 
Belize Poster with current and DO temp.pptx
Belize Poster with current and DO temp.pptxBelize Poster with current and DO temp.pptx
Belize Poster with current and DO temp.pptx
 
ES_Kokanee_poster_final
ES_Kokanee_poster_finalES_Kokanee_poster_final
ES_Kokanee_poster_final
 
Comments on adding microbeads to Schedule 1 of CEPA 1999 – September 30, 2015
Comments on adding microbeads to Schedule 1 of CEPA 1999 – September 30, 2015Comments on adding microbeads to Schedule 1 of CEPA 1999 – September 30, 2015
Comments on adding microbeads to Schedule 1 of CEPA 1999 – September 30, 2015
 
Freshwater Matters June2014
Freshwater Matters June2014Freshwater Matters June2014
Freshwater Matters June2014
 
REU2016_FinalPaper
REU2016_FinalPaperREU2016_FinalPaper
REU2016_FinalPaper
 
SummerInTheOzarks
SummerInTheOzarksSummerInTheOzarks
SummerInTheOzarks
 
jurnal gilang.pptx
jurnal gilang.pptxjurnal gilang.pptx
jurnal gilang.pptx
 
Eric final AGUA research project poster
Eric final AGUA research project posterEric final AGUA research project poster
Eric final AGUA research project poster
 
CA Ocean Plan 2013 Update: SHELL New Fecal Bacteria Standards
CA Ocean Plan 2013 Update: SHELL New Fecal Bacteria StandardsCA Ocean Plan 2013 Update: SHELL New Fecal Bacteria Standards
CA Ocean Plan 2013 Update: SHELL New Fecal Bacteria Standards
 
WQRJC-D-12-00047
WQRJC-D-12-00047WQRJC-D-12-00047
WQRJC-D-12-00047
 
Laguna Lake Health Risk Assesment ACTA carcinogenic arsenic_released_feb2015
Laguna Lake Health Risk Assesment ACTA carcinogenic arsenic_released_feb2015Laguna Lake Health Risk Assesment ACTA carcinogenic arsenic_released_feb2015
Laguna Lake Health Risk Assesment ACTA carcinogenic arsenic_released_feb2015
 
Stewardship Station
Stewardship StationStewardship Station
Stewardship Station
 
SCANU B129829-Final Project Report
SCANU B129829-Final Project ReportSCANU B129829-Final Project Report
SCANU B129829-Final Project Report
 
3.Environmental variability at a marine cage culture.pdf
3.Environmental variability at a marine cage culture.pdf3.Environmental variability at a marine cage culture.pdf
3.Environmental variability at a marine cage culture.pdf
 

Poster

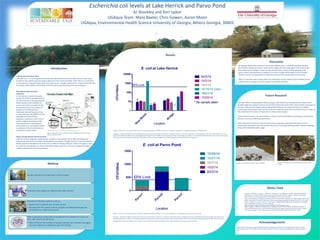
  • 1. Samples collected and brought back to lab for analysis. Prepared mTec plates are labeled with date and site Membrane filtration system is set up • Sterile filter is placed over suction funnel. • Starting with the lowest volume samples are filtered through the membrane to collect the bacteria Filter is placed on mTec plate and allowed to incubate for 2 hours at 35ᵒC then 44.5ᵒC for 24 hours. • After 24 hours the number of purple colonies are counted, averaged, and each dilution multiplied to get CFU/100mL Introduction Method Escherichia coli levels at Lake Herrick and Parvo Pond AJ Shockley and Keri Lydon UGAqua Team: Mary Baxter, Chris Gowen, Aaron Moon UGAqua, Environmental Health Science University of Georgia, Athens Georgia, 30602 Future Research Figure 2. Levels of E. coli at Lake Herrick on dry and rainy days. Average CFU/100mL of water +/- S.D. from 3 samples at 3 sampling sites per day on the days listed. Average E. coli levels at both the beach and bridge sites of Lake Herrick are below the EPA limit. The highest levels of E. coli were observed on 10/15/14 during a rain event. At the beach site E. coli levels reach 1620.0 CFU/100mL nearly quadrupling the EPA limit of 410 CFU/100mL. Had samples been taken at the bridge site a spike in E. coli would have been observed. This is because during and after rain events water flows over impervious and pervious surfaces picking up pollutants and sediments which are deposited into the waterway. Figure 3. Levels of E. coli at Parvo Pond on dry days. Average CFU/100mL of water +/- S.D. from 3 samples from 1 sampling site per day on the days listed. Average E. coli levels are higher at Parvo Pond than those of Lake Herrick. A spike in E. coli levels is observed at the 2nd sampling site at Parvo Pond because this area has little cover from brush and shrubs while the 1st and 3rd are insulated by plant life reducing the amount of loose sediment and access by animals. The 1st site is the only site with levels below the EPA limit. This can be attributed to the presence of plant cover as well as a layer of thick mud along the shoreline which traps sediments and reduces access by animals. 1. Morphis, C., McCalum, C., Keys, L., Ammons, J., Respress, J., and Tilghman, L. (2014). Restoring Lake Herrick: Information for Improved Water Quality and Enhanced Recreational Value. Georgia: Univeristy of Georgia. http://www.rivercenter.uga.edu/publications/pdf/lake_herrick_report_final.pdf 2. Ishii, S. and Sadowsky, M. (2008). Escherichia coli in the Environment: Implication for Water Quality and Human Health. Minnesota: University of Minnesota. https://www.jstage.jst.go.jp/article/jsme2/23/2/23_2_101/_pdf 3. Fisher, D., Dillard, A., Usery, E., Steiner, J. and Neely, C. (2001). Water Quality in the Headwaters of the Upper Oconee Watershed. Georgia: University of Georgia. https://smartech.gatech.edu/bitstream/handle/1853/43796/FisherD-01.pdf 4. Little, E., Eggert, S., Wenner, D., Rasmussen, T., Conners, D., and Fisher, D. (2007). Results from Six Years of Community-Based Volunteer Water Quality Monitoring By the Upper Oconee Watershed Network. Georgia: University of Georgia. http://www.gwri.gatech.edu/sites/default/files/files/docs/2007/6.2.4.pdf Works Cited Discussion Results •The UGA Office of Sustainability seeks to reopen Lake Herrick for recreational use. Before this is possible diagnostic analysis must be conducted to determine what other contaminants are present in the lake. In the past the Upper Oconee Watershed Network has conducted tests for turbidity, conductivity, and nutrient levels, similar tests are needed for Lake Herrick and Parvo Pond in order to fully understand the extent of impairment in these water bodies.4 •Determine the sources on contamination in Parvo Pond and identify to what extent contaminants present in Parvo are affecting Lake Herrick. •Raise awareness to local community about preserving water quality by fostering a sense of stewardship toward the Lake Herrick and Parvo Pond. Encourage picking up litter and pet droppings along with responsible water usage. On average Lake Herrick and Parvo Pond have relatively low E. coli levels but spike beyond the EPA limit during rain events. Levels at the bridge site tend to by higher than those at the beach because the bridge is closer to areas of input (Parvo Pond, nearby roadways, and storm drains). Also the beach is nearest to an area of output which feeds into the Oconee. Another source of contamination is wild animal and pet feces especially at Parvo Pond. Efforts to promote water quality within the watershed include: Repairing and building of new infrastructure and pipes as well as research and public outreach. A special thanks to Keri Lydon organizing UGAqua and for applying for the Office of Sustainability grant which provided funding for this project. The UGAqua members who worked on this project include: Mary Baxter, Chris Gowen and Aaron Moon. Acknowledgements Lake Herrick and Parvo Pond Lake Herrick is a 15 acre engineered recreational lake that feeds into the North Oconee River and is located on the southern part of campus adjacent to the intramural fields. Parvo Pond is a small pond surrounded by a dog park which feeds into Lake Herrick. Though located within a forest area both sites are deeply influenced by surrounding urbanized areas (nearby parking lots and roadways).1 Recreational Risk and Fecal Indicators In the interest of preserving water quality the EPA has established a list of criteria known as the Recreational Water Quality Criteria (RWQC) to access and reduce recreational risk. Recreational risk is the number of people out of 1000 exposed individuals who will become ill due to that exposure. The RWQC lists the allowable amounts of fecal indicators, enterococci and E.coli, in order to reduce recreational risk.2 These bacteria are used because their presence in recreational waters is indicative of fecal contamination, a hazard to human health. Status of Lake Herrick and Parvo Pond Lake Herrick was originally established for recreation and research but in 2001 swimming and boating was banned to the public and the beach area closed.1 Though levels of E.coli are below the RWQC maximum allowable level of 410 CFU (Coliform Forming Units) per 100 mL the water is seen as unsafe for recreational use. Parvo Pond faces similar issues but is far more impaired by algae, organic material and other contaminants.3 Image 5. Parvo Pond during a dry day at ~9:00AM Image 6. Drainage pipe at Parvo Pond that feeds into Lake Herrick. Figure1. Map of the Oconee Forest Park with highlighted locations of Lake Herrick and Parvo Pond. Photo credit: http://warnell.forestry.uga.edu/ofp/maps.html

Editor's Notes

  1. http://warnell.forestry.uga.edu/ofp/maps.html http://wrrb.ca/content/fish-camp-wekweeti http://pubs.usgs.gov/fs/2012/3146/ http://www.ucl.ac.uk/towers-lab/labmembers