Copyright # 2010by John Wiley & Sons, Inc. All rights reserved
Published by John Wiley & Sons, Inc., Hoboken, New Jersey
Published simultaneously in Canada
No part of this publication may be reproduced, stored in a retrieval system, or transmitted in any form or by any
means, electronic, mechanical, photocopying, recording, scanning, or otherwise, except as permitted under
Section 107 or 108 of the 1976 United States Copyright Act, without either the prior written permission of the
Publisher, or authorization through payment of the appropriate per-copy fee to the Copyright Clearance Center,
Inc., 222 Rosewood Drive, Danvers, MA 01923, (978) 750-8400, fax (978) 750-4470, or on the web at www.
copyright.com. Requests to the Publisher for permission should be addressed to the Permissions Department,
John Wiley & Sons, Inc., 111 River Street, Hoboken, NJ 07030, (201) 748-6011, fax (201) 748-6008, or online
at http://www.wiley.com/go/permission.
Limit of Liability/Disclaimer of Warranty: While the publisher and author have used their best efforts in
preparing this book, they make no representations or warranties with respect to the accuracy or completeness
of the contents of this book and specifically disclaim any implied warranties of merchantability or fitness for a
particular purpose. No warranty may be created or extended by sales representatives or written sales materials.
The advice and strategies contained herein may not be suitable for your situation. You should consult with a
professional where appropriate. Neither the publisher nor author shall be liable for any loss of profit or any
other commercial damages, including but not limited to special, incidental, consequential, or other damages.
For general information on our other products and services or for technical support, please contact our Customer
Care Department within the United States at (800) 762-2974, outside the United States at (317) 572-3993 or
fax (317) 572-4002.
Wiley also publishes its books in a variety of electronic formats. Some content that appears in print may not be
available in electronic formats. For more information about Wiley products, visit our web site at www.wiley.com.
Library of Congress Cataloging-in-Publication Data:
Ponniah, Paulraj.
Data warehousing fundamentals for IT professionals / Paulraj Ponniah.—2nd ed.
p. cm.
Previous ed. published under title: Data warehousing fundamentals.
Includes bibliographical references and index.
ISBN 978-0-470-46207-2 (cloth)
1. Data warehousing. I. Ponniah, Paulraj. Data warehousing fundamentals. II. Title.
QA76.9.D37P66 2010
005.740
5—dc22
2009041789
Printed in the United States of America
10 9 8 7 6 5 4 3 2 1
CONTENTS
PREFACE xxv
PART 1OVERVIEW AND CONCEPTS 1
1 THE COMPELLING NEED FOR DATA WAREHOUSING 3
CHAPTER OBJECTIVES / 3
ESCALATING NEED FOR STRATEGIC INFORMATION / 4
The Information Crisis / 6
Technology Trends / 6
Opportunities and Risks / 8
FAILURES OF PAST DECISION-SUPPORT SYSTEMS / 9
History of Decision-Support Systems / 10
Inability to Provide Information / 10
OPERATIONAL VERSUS DECISION-SUPPORT SYSTEMS / 11
Making the Wheels of Business Turn / 12
Watching the Wheels of Business Turn / 12
Different Scope, Different Purposes / 12
DATA WAREHOUSING—THE ONLY VIABLE SOLUTION / 13
A New Type of System Environment / 13
Processing Requirements in the New Environment / 14
Strategic Information from the Data Warehouse / 14
vii
11.
DATA WAREHOUSE DEFINED/ 15
A Simple Concept for Information Delivery / 15
An Environment, Not a Product / 15
A Blend of Many Technologies / 16
THE DATA WAREHOUSING MOVEMENT / 17
Data Warehousing Milestones / 17
Initial Challenges / 18
EVOLUTION OF BUSINESS INTELLIGENCE / 18
BI: Two Environments / 19
BI: Data Warehousing and Analytics / 19
CHAPTER SUMMARY / 20
REVIEW QUESTIONS / 20
EXERCISES / 21
2 DATA WAREHOUSE: THE BUILDING BLOCKS 23
CHAPTER OBJECTIVES / 23
DEFINING FEATURES / 24
Subject-Oriented Data / 24
Integrated Data / 25
Time-Variant Data / 26
Nonvolatile Data / 27
Data Granularity / 28
DATA WAREHOUSES AND DATA MARTS / 29
How Are They Different? / 29
Top-Down Versus Bottom-Up Approach / 29
A Practical Approach / 31
ARCHITECTURAL TYPES / 32
Centralized Data Warehouse / 32
Independent Data Marts / 32
Federated / 33
Hub-and-Spoke / 33
Data-Mart Bus / 34
OVERVIEW OF THE COMPONENTS / 34
Source Data Component / 34
Data Staging Component / 37
Data Storage Component / 39
Information Delivery Component / 40
Metadata Component / 41
Management and Control Component / 41
viii CONTENTS
12.
METADATA IN THEDATA WAREHOUSE / 41
Types of Metadata / 42
Special Significance / 42
CHAPTER SUMMARY / 42
REVIEW QUESTIONS / 43
EXERCISES / 43
3 TRENDS IN DATA WAREHOUSING 45
CHAPTER OBJECTIVES / 45
CONTINUED GROWTH IN DATA WAREHOUSING / 46
Data Warehousing has Become Mainstream / 46
Data Warehouse Expansion / 47
Vendor Solutions and Products / 48
SIGNIFICANT TRENDS / 50
Real-Time Data Warehousing / 50
Multiple Data Types / 50
Data Visualization / 52
Parallel Processing / 54
Data Warehouse Appliances / 56
Query Tools / 56
Browser Tools / 57
Data Fusion / 57
Data Integration / 58
Analytics / 59
Agent Technology / 59
Syndicated Data / 60
Data Warehousing and ERP / 60
Data Warehousing and KM / 61
Data Warehousing and CRM / 63
Agile Development / 63
Active Data Warehousing / 64
EMERGENCE OF STANDARDS / 64
Metadata / 65
OLAP / 65
WEB-ENABLED DATA WAREHOUSE / 66
The Warehouse to the Web / 67
The Web to the Warehouse / 67
The Web-Enabled Configuration / 69
CHAPTER SUMMARY / 69
CONTENTS ix
13.
REVIEW QUESTIONS /69
EXERCISES / 70
PART 2 PLANNING AND REQUIREMENTS 71
4 PLANNING AND PROJECT MANAGEMENT 73
CHAPTER OBJECTIVES / 73
PLANNING YOUR DATA WAREHOUSE / 74
Key Issues / 74
Business Requirements, Not Technology / 76
Top Management Support / 77
Justifying Your Data Warehouse / 77
The Overall Plan / 78
THE DATA WAREHOUSE PROJECT / 79
How is it Different? / 79
Assessment of Readiness / 81
The Life-Cycle Approach / 81
THE DEVELOPMENT PHASES / 83
Adopting Agile Development / 84
THE PROJECT TEAM / 85
Organizing the Project Team / 85
Roles and Responsibilities / 86
Skills and Experience Levels / 87
User Participation / 88
PROJECT MANAGEMENT CONSIDERATIONS / 90
Guiding Principles / 91
Warning Signs / 92
Success Factors / 92
Anatomy of a Successful Project / 93
Adopt a Practical Approach / 94
CHAPTER SUMMARY / 96
REVIEW QUESTIONS / 96
EXERCISES / 97
5 DEFINING THE BUSINESS REQUIREMENTS 99
CHAPTER OBJECTIVES / 99
DIMENSIONAL ANALYSIS / 100
Usage of Information Unpredictable / 100
Dimensional Nature of Business Data / 101
Examples of Business Dimensions / 102
x CONTENTS
14.
INFORMATION PACKAGES—A USEFULCONCEPT / 103
Requirements Not Fully Determinate / 104
Business Dimensions / 105
Dimension Hierarchies and Categories / 106
Key Business Metrics or Facts / 107
REQUIREMENTS GATHERING METHODS / 109
Types of Questions / 110
Arrangement of Questions / 111
Interview Techniques / 111
Adapting the JAD Methodology / 113
Using Questionnaires / 115
Review of Existing Documentation / 115
REQUIREMENTS DEFINITION: SCOPE AND CONTENT / 116
Data Sources / 117
Data Transformation / 117
Data Storage / 117
Information Delivery / 118
Information Package Diagrams / 118
Requirements Definition Document Outline / 118
CHAPTER SUMMARY / 119
REVIEW QUESTIONS / 119
EXERCISES / 120
6 REQUIREMENTS AS THE DRIVING FORCE FOR
DATA WAREHOUSING 121
CHAPTER OBJECTIVES / 121
DATA DESIGN / 122
Structure for Business Dimensions / 123
Structure for Key Measurements / 124
Levels of Detail / 125
THE ARCHITECTURAL PLAN / 125
Composition of the Components / 126
Special Considerations / 127
Tools and Products / 129
DATA STORAGE SPECIFICATIONS / 131
DBMS Selection / 132
Storage Sizing / 132
INFORMATION DELIVERY STRATEGY / 133
Queries and Reports / 134
Types of Analysis / 134
Information Distribution / 135
CONTENTS xi
15.
Real Time InformationDelivery / 135
Decision Support Applications / 135
Growth and Expansion / 136
CHAPTER SUMMARY / 136
REVIEW QUESTIONS / 136
EXERCISES / 137
PART 3 ARCHITECTURE AND INFRASTRUCTURE 139
7 ARCHITECTURAL COMPONENTS 141
CHAPTER OBJECTIVES / 141
UNDERSTANDING DATA WAREHOUSE ARCHITECTURE / 141
Architecture: Definitions / 142
Architecture in Three Major Areas / 142
DISTINGUISHING CHARACTERISTICS / 143
Different Objectives and Scope / 144
Data Content / 144
Complex Analysis and Quick Response / 145
Flexible and Dynamic / 145
Metadata-Driven / 146
ARCHITECTURAL FRAMEWORK / 146
Architecture Supporting Flow of Data / 146
The Management and Control Module / 147
TECHNICAL ARCHITECTURE / 148
Data Acquisition / 149
Data Storage / 152
Information Delivery / 154
ARCHITECTURAL TYPES / 156
Centralized Corporate Data Warehouse / 156
Independent Data Marts / 156
Federated / 159
Hub-and-Spoke / 159
Data-Mart Bus / 160
CHAPTER SUMMARY / 160
REVIEW QUESTIONS / 160
EXERCISES / 161
8 INFRASTRUCTURE AS THE FOUNDATION FOR
DATA WAREHOUSING 163
CHAPTER OBJECTIVES / 163
xii CONTENTS
16.
INFRASTRUCTURE SUPPORTING ARCHITECTURE/ 164
Operational Infrastructure / 165
Physical Infrastructure / 165
HARDWARE AND OPERATING SYSTEMS / 166
Mainframes / 167
Open System Servers / 168
NT Servers / 168
Platform Options / 168
Server Hardware / 177
DATABASE SOFTWARE / 181
Parallel Processing Options / 182
Selection of the DBMS / 184
COLLECTION OF TOOLS / 184
Architecture First, Then Tools / 186
Data Modeling / 186
Data Extraction / 187
Data Transformation / 187
Data Loading / 187
Data Quality / 187
Queries and Reports / 187
Dashboards / 187
Scorecards / 187
Online Analytical Processing (OLAP) / 188
Alert Systems / 188
Middleware and Connectivity / 188
Data Warehouse Administration / 188
DATA WAREHOUSE APPLIANCES / 188
Evolution of DW Appliances / 189
Benefits of DW Appliances / 190
CHAPTER SUMMARY / 191
REVIEW QUESTIONS / 191
EXERCISES / 192
9 THE SIGNIFICANT ROLE OF METADATA 193
CHAPTER OBJECTIVES / 193
WHY METADATA IS IMPORTANT / 193
A Critical Need in the Data Warehouse / 195
Why Metadata Is Vital for End-Users / 198
Why Metadata Is Essential for IT / 199
Automation of Warehousing Tasks / 200
Establishing the Context of Information / 202
CONTENTS xiii
17.
METADATA TYPES BYFUNCTIONAL AREAS / 203
Data Acquisition / 204
Data Storage / 205
Information Delivery / 206
BUSINESS METADATA / 207
Content Overview / 207
Examples of Business Metadata / 208
Content Highlights / 209
Who Benefits? / 209
TECHNICAL METADATA / 209
Content Overview / 210
Examples of Technical Metadata / 210
Content Highlights / 211
Who Benefits? / 211
HOW TO PROVIDE METADATA / 212
Metadata Requirements / 212
Sources of Metadata / 214
Challenges for Metadata Management / 215
Metadata Repository / 215
Metadata Integration and Standards / 217
Implementation Options / 218
CHAPTER SUMMARY / 219
REVIEW QUESTIONS / 220
EXERCISES / 220
PART 4 DATA DESIGN AND DATA PREPARATION 223
10 PRINCIPLES OF DIMENSIONAL MODELING 225
CHAPTER OBJECTIVES / 225
FROM REQUIREMENTS TO DATA DESIGN / 225
Design Decisions / 226
Dimensional Modeling Basics / 226
E-R Modeling Versus Dimensional Modeling / 230
Use of CASE Tools / 232
THE STAR SCHEMA / 232
Review of a Simple STAR Schema / 232
Inside a Dimension Table / 234
Inside the Fact Table / 236
The Factless Fact Table / 238
Data Granularity / 238
xiv CONTENTS
18.
STAR SCHEMA KEYS/ 239
Primary Keys / 239
Surrogate Keys / 240
Foreign Keys / 240
ADVANTAGES OF THE STAR SCHEMA / 241
Easy for Users to Understand / 241
Optimizes Navigation / 242
Most Suitable for Query Processing / 243
STARjoin and STARindex / 244
STAR SCHEMA: EXAMPLES / 244
Video Rental / 244
Supermarket / 244
Wireless Phone Service / 244
Auction Company / 244
CHAPTER SUMMARY / 246
REVIEW QUESTIONS / 247
EXERCISES / 247
11 DIMENSIONAL MODELING: ADVANCED TOPICS 249
CHAPTER OBJECTIVES / 249
UPDATES TO THE DIMENSION TABLES / 250
Slowly Changing Dimensions / 250
Type 1 Changes: Correction of Errors / 251
Type 2 Changes: Preservation of History / 252
Type 3 Changes: Tentative Soft Revisions / 253
MISCELLANEOUS DIMENSIONS / 255
Large Dimensions / 255
Rapidly Changing Dimensions / 256
Junk Dimensions / 258
THE SNOWFLAKE SCHEMA / 259
Options to Normalize / 259
Advantages and Disadvantages / 260
When to Snowflake / 262
AGGREGATE FACT TABLES / 262
Fact Table Sizes / 264
Need for Aggregates / 266
Aggregating Fact Tables / 266
Aggregation Options / 271
FAMILIES OF STARS / 272
Snapshot and Transaction Tables / 273
Core and Custom Tables / 274
CONTENTS xv
19.
Supporting Enterprise ValueChain or Value Circle / 274
Conforming Dimensions / 275
Standardizing Facts / 276
Summary of Family of STARS / 277
CHAPTER SUMMARY / 277
REVIEW QUESTIONS / 278
EXERCISES / 278
12 DATA EXTRACTION, TRANSFORMATION, AND LOADING 281
CHAPTER OBJECTIVES / 281
ETL OVERVIEW / 282
Most Important and Most Challenging / 282
Time Consuming and Arduous / 283
ETL REQUIREMENTS AND STEPS / 284
Key Factors / 285
DATA EXTRACTION / 286
Source Identification / 287
Data Extraction Techniques / 287
Evaluation of the Techniques / 294
DATA TRANSFORMATION / 295
Data Transformation: Basic Tasks / 296
Major Transformation Types / 297
Data Integration and Consolidation / 299
Transformation for Dimension Attributes / 301
How to Implement Transformation / 301
DATA LOADING / 302
Applying Data: Techniques and Processes / 303
Data Refresh Versus Update / 306
Procedure for Dimension Tables / 306
Fact Tables: History and Incremental Loads / 307
ETL SUMMARY / 308
ETL Tool Options / 308
Reemphasizing ETL Metadata / 309
ETL Summary and Approach / 310
OTHER INTEGRATION APPROACHES / 311
Enterprise Information Integration (EII) / 311
Enterprise Application Integration (EAI) / 312
CHAPTER SUMMARY / 313
REVIEW QUESTIONS / 313
EXERCISES / 314
xvi CONTENTS
20.
13 DATA QUALITY:A KEY TO SUCCESS 315
CHAPTER OBJECTIVES / 315
WHY IS DATA QUALITY CRITICAL? / 316
What Is Data Quality? / 316
Benefits of Improved Data Quality / 319
Types of Data Quality Problems / 320
DATA QUALITY CHALLENGES / 323
Sources of Data Pollution / 323
Validation of Names and Addresses / 325
Costs of Poor Data Quality / 325
DATA QUALITY TOOLS / 326
Categories of Data Cleansing Tools / 327
Error Discovery Features / 327
Data Correction Features / 327
The DBMS for Quality Control / 327
DATA QUALITY INITIATIVE / 328
Data Cleansing Decisions / 329
Who Should Be Responsible? / 330
The Purification Process / 333
Practical Tips on Data Quality / 334
MASTER DATA MANAGEMENT (MDM) / 335
MDM Categories / 335
MDM Benefits / 335
MDM and Data Warehousing / 336
CHAPTER SUMMARY / 336
REVIEW QUESTIONS / 336
EXERCISES / 337
PART 5 INFORMATION ACCESS AND DELIVERY 339
14 MATCHING INFORMATION TO THE CLASSES OF USERS 341
CHAPTER OBJECTIVES / 341
INFORMATION FROM THE DATA WAREHOUSE / 342
Data Warehouse Versus Operational Systems / 342
Information Potential / 344
User–Information Interface / 347
Industry Applications / 348
WHO WILL USE THE INFORMATION? / 349
Classes of Users / 349
CONTENTS xvii
21.
What They Need/ 352
How to Provide Information / 354
INFORMATION DELIVERY / 356
Queries / 357
Reports / 358
Analysis / 359
Applications / 359
INFORMATION DELIVERY TOOLS / 360
The Desktop Environment / 360
Methodology for Tool Selection / 361
Tool Selection Criteria / 364
Information Delivery Framework / 365
INFORMATION DELIVERY: SPECIAL TOPICS / 366
Business Activity Monitoring (BAM) / 366
Dashboards and Scorecards / 367
CHAPTER SUMMARY / 371
REVIEW QUESTIONS / 371
EXERCISES / 372
15 OLAP IN THE DATA WAREHOUSE 373
CHAPTER OBJECTIVES / 373
DEMAND FOR ONLINE ANALYTICAL PROCESSING / 374
Need for Multidimensional Analysis / 374
Fast Access and Powerful Calculations / 375
Limitations of Other Analysis Methods / 377
OLAP is the Answer / 379
OLAP Definitions and Rules / 379
OLAP Characteristics / 382
MAJOR FEATURES AND FUNCTIONS / 382
General Features / 383
Dimensional Analysis / 383
What Are Hypercubes? / 386
Drill Down and Roll Up / 390
Slice and Dice or Rotation / 392
Uses and Benefits / 393
OLAP MODELS / 393
Overview of Variations / 394
The MOLAP Model / 394
The ROLAP Model / 395
ROLAP Versus MOLAP / 397
xviii CONTENTS
22.
OLAP IMPLEMENTATION CONSIDERATIONS/ 398
Data Design and Preparation / 399
Administration and Performance / 401
OLAP Platforms / 402
OLAP Tools and Products / 402
Implementation Steps / 403
Examples of Typical Implementations / 404
CHAPTER SUMMARY / 404
REVIEW QUESTIONS / 405
EXERCISES / 405
16 DATA WAREHOUSING AND THE WEB 407
CHAPTER OBJECTIVES / 407
WEB-ENABLED DATA WAREHOUSE / 408
Why the Web? / 408
Convergence of Technologies / 410
Adapting the Data Warehouse for the Web / 411
The Web as a Data Source / 412
Clickstream Analysis / 413
WEB-BASED INFORMATION DELIVERY / 414
Expanded Usage / 414
New Information Strategies / 416
Browser Technology for the Data Warehouse / 418
Security Issues / 419
OLAP AND THE WEB / 420
Enterprise OLAP / 420
Web-OLAP Approaches / 420
OLAP Engine Design / 421
BUILDING A WEB-ENABLED DATA WAREHOUSE / 421
Nature of the Data Webhouse / 422
Implementation Considerations / 423
Putting the Pieces Together / 424
Web Processing Model / 426
CHAPTER SUMMARY / 426
REVIEW QUESTIONS / 426
EXERCISES / 427
17 DATA MINING BASICS 429
CHAPTER OBJECTIVES / 429
WHAT IS DATA MINING? / 430
CONTENTS xix
23.
Data Mining Defined/ 431
The Knowledge Discovery Process / 432
OLAP Versus Data Mining / 435
Some Aspects of Data Mining / 436
Data Mining and the Data Warehouse / 438
MAJOR DATA MINING TECHNIQUES / 439
Cluster Detection / 440
Decision Trees / 443
Memory-Based Reasoning / 444
Link Analysis / 445
Neural Networks / 447
Genetic Algorithms / 448
Moving into Data Mining / 450
DATA MINING APPLICATIONS / 452
Benefits of Data Mining / 453
Applications in CRM (Customer Relationship Management) / 454
Applications in the Retail Industry / 455
Applications in the Telecommunications Industry / 456
Applications in Biotechnology / 457
Applications in Banking and Finance / 459
CHAPTER SUMMARY / 459
REVIEW QUESTIONS / 459
EXERCISES / 460
PART 6 IMPLEMENTATION AND MAINTENANCE 461
18 THE PHYSICAL DESIGN PROCESS 463
CHAPTER OBJECTIVES / 463
PHYSICAL DESIGN STEPS / 464
Develop Standards / 464
Create Aggregates Plan / 465
Determine the Data Partitioning Scheme / 465
Establish Clustering Options / 466
Prepare an Indexing Strategy / 466
Assign Storage Structures / 466
Complete Physical Model / 467
PHYSICAL DESIGN CONSIDERATIONS / 467
Physical Design Objectives / 467
From Logical Model to Physical Model / 469
xx CONTENTS
24.
Physical Model Components/ 469
Significance of Standards / 470
PHYSICAL STORAGE / 473
Storage Area Data Structures / 473
Optimizing Storage / 473
Using RAID Technology / 476
Estimating Storage Sizes / 477
INDEXING THE DATA WAREHOUSE / 477
Indexing Overview / 477
B-Tree Index / 479
Bitmapped Index / 481
Clustered Indexes / 482
Indexing the Fact Table / 482
Indexing the Dimension Tables / 483
PERFORMANCE ENHANCEMENT TECHNIQUES / 483
Data Partitioning / 483
Data Clustering / 484
Parallel Processing / 484
Summary Levels / 485
Referential Integrity Checks / 485
Initialization Parameters / 485
Data Arrays / 486
CHAPTER SUMMARY / 486
REVIEW QUESTIONS / 486
EXERCISES / 487
19 DATA WAREHOUSE DEPLOYMENT 489
CHAPTER OBJECTIVES / 489
DATA WAREHOUSE TESTING / 490
Front-End / 490
ETL Testing / 490
MAJOR DEPLOYMENT ACTIVITIES / 491
Complete User Acceptance / 491
Perform Initial Loads / 492
Get User Desktops Ready / 493
Complete Initial User Training / 494
Institute Initial User Support / 495
Deploy in Stages / 495
CONSIDERATIONS FOR A PILOT / 497
When is a Pilot Data Mart Useful? / 497
CONTENTS xxi
25.
Types of PilotProjects / 498
Choosing the Pilot / 500
Expanding and Integrating the Pilot / 501
SECURITY / 502
Security Policy / 502
Managing User Privileges / 502
Password Considerations / 503
Security Tools / 504
BACKUP AND RECOVERY / 504
Why Back Up the Data Warehouse? / 505
Backup Strategy / 505
Setting up a Practical Schedule / 506
Recovery / 507
CHAPTER SUMMARY / 508
REVIEW QUESTIONS / 508
EXERCISES / 509
20 GROWTH AND MAINTENANCE 511
CHAPTER OBJECTIVES / 511
MONITORING THE DATA WAREHOUSE / 512
Collection of Statistics / 512
Using Statistics for Growth Planning / 514
Using Statistics for Fine-Tuning / 514
Publishing Trends for Users / 515
USER TRAINING AND SUPPORT / 515
User Training Content / 516
Preparing the Training Program / 516
Delivering the Training Program / 518
User Support / 519
MANAGING THE DATA WAREHOUSE / 520
Platform Upgrades / 521
Managing Data Growth / 521
Storage Management / 522
ETL Management / 522
Data Model Revisions / 523
Information Delivery Enhancements / 523
Ongoing Fine-Tuning / 524
CHAPTER SUMMARY / 524
REVIEW QUESTIONS / 525
EXERCISES / 525
xxii CONTENTS
26.
ANSWERS TO SELECTEDEXERCISES 527
APPENDIX A: PROJECT LIFE CYCLE STEPS AND CHECKLISTS 531
APPENDIX B: CRITICAL FACTORS FOR SUCCESS 535
APPENDIX C: GUIDELINES FOR EVALUATING VENDOR SOLUTIONS 537
APPENDIX D: HIGHLIGHTS OF VENDORS AND PRODUCTS 539
APPENDIX E: REAL-WORLD EXAMPLES OF BEST PRACTICES 549
REFERENCES 555
GLOSSARY 557
INDEX 565
CONTENTS xxiii
28.
PREFACE
THIS BOOK ISFOR YOU
Are you an information technology professional watching, with great interest, the massive
unfolding and spreading of the data warehouse movement during the past decade? Are
you contemplating a move into this fast-growing area of opportunity? Are you a systems ana-
lyst, programmer, data analyst, database administrator, project leader, or software engineer
eager to grasp the fundamentals of data warehousing? Do you wonder how many different
books you may have to study to learn the underlying principles and the current practices? Are
you lost in the maze of the literature and products on the subject? Do you wish for a single
publication on data warehousing, clearly and specifically designed for IT professionals? Do
you need a textbook that helps you learn the fundamentals in sufficient depth? If you
answered “yes” to any of the above, this book is written specially for you.
This is the one definitive book on data warehousing clearly intended for IT professionals.
The organization and presentation of the book are specially tuned for IT professionals. This
book does not presume to target anyone and everyone remotely interested in the subject for
some reason or another, but is written to address the specific needs of IT professionals like
you. It does not tend to emphasize certain aspects and neglect other critical ones. The book
takes you over the entire spectrum of data warehousing.
As a veteran IT professional with wide and intensive industry experience, as a successful
database and data warehousing consultant for many years, and as one who teaches data ware-
housing fundamentals in the college classroom and at public seminars, I have come to
appreciate the precise needs of IT professionals. In every chapter I have incorporated
these requirements of the IT community.
xxv
29.
THE SCENARIO
Why havecompanies rushed into data warehousing? Why is there a tremendous surge in
interest? Data warehousing is no longer a purely novel idea just for research and experimen-
tation. It has become a mainstream phenomenon. True, the data warehouse is not in every
doctor’s office yet, but neither is it confined to only high-end businesses. More than half
of all U.S. companies and a large percentage of worldwide businesses have made a commit-
ment to data warehousing.
In every industry across the board, from retail chain stores to financial institutions, from
manufacturing enterprises to government departments, and from airline companies to utility
businesses, data warehousing has revolutionized the way people perform business analysis
and make strategic decisions. Every company that has a data warehouse is realizing the enor-
mous benefits translated into positive results at the bottom line. These companies, now incor-
porating Web-based technologies, are enhancing the potential for greater and easier delivery
of vital information.
Over the past decade, a large number of vendors have flooded the market with numerous
data warehousing products. Vendor solutions and products run the gamut of data warehous-
ing and business intelligence—data modeling, data acquisition, data quality, data analysis,
metadata, information delivery, and so on. The market is large, mature, and continues
to grow.
CHANGED ROLE OF IT
In this scenario, information technology departments of all progressive companies have
perceived a radical change in their roles. IT is no longer required to create every report
and present every screen for providing information to the end-users. IT is now charged
with the building of information delivery systems and letting the end-users themselves
retrieve information in innovative ways for analysis and decision making. Data warehousing
and business intelligence environments are proving to be just that type of successful infor-
mation delivery system.
IT professionals responsible for building data warehouses had to revise their mindsets
about building applications. They had to understand that a data warehouse is not a one-
size-fits-all proposition. First, they had to get a clear understanding about data extraction
from source systems, data transformations, data staging, data warehouse architecture, infra-
structure, and the various methods of information delivery. In short, IT professionals, like
you, must get a strong grip on the fundamentals of data warehousing.
WHAT THIS BOOK CAN DO FOR YOU
The book is comprehensive and detailed. You will be able to study every significant topic in
planning, requirements, architecture, infrastructure, design, data preparation, information
delivery, deployment, and maintenance. The book is specially designed for IT professionals;
you will be able to follow the presentation easily because it is built upon the foundation of
your background as an IT professional, your knowledge, and the technical terminology fam-
iliar to you. It is organized logically, beginning with an overview of concepts, moving on to
planning and requirements, then to architecture and infrastructure, on to data design, then to
xxvi PREFACE
30.
information delivery, andconcluding with deployment and maintenance. This progression is
typical of what you are most familiar with in your IT experience and day-to-day work.
The book provides an interactive learning experience. It is not just a one-way lecture. You
participate through the review questions and exercises at the end of each chapter. For each
chapter, the objectives at the beginning set the theme and the summary at the end highlights
the topics covered. You can relate each concept and technique presented in the book to the
data warehousing industry and marketplace. You will benefit from the substantial number of
industry examples. Although intended as a first course on the fundamentals, this book pro-
vides sufficient coverage of each topic so that you can comfortably proceed to the next step of
specialization for specific roles in a data warehouse project.
Featuring all the significant topics in appropriate measure, this book is eminently suitable
as a textbook for serious self-study, a college course, or a seminar on the essentials. It
provides an opportunity for you to become a data warehouse expert.
ENHANCEMENTS IN THIS SECOND EDITION
This greatly enhanced edition captures the developments and changes in the data warehous-
ing landscape during the past nearly ten years. The underlying purposes and principles of
data warehousing have remained the same. However, we notice definitive changes in the
details, some finer aspects, and in product innovations. Although this edition succeeds in
incorporating all the significant revisions, I have been careful not to disturb the overall logi-
cal arrangement and sequencing of the chapters.
The term “business intelligence” has gained a lot more currency. Many practitioners now
consider data warehousing to refer to populating the warehouse with data, and business intel-
ligence to refer to using the warehouse data. Data warehousing has made inroads into areas
such as Customer Relationship Management, Enterprise Application Integration, Enterprise
Information Integration, Business Activity Monitoring, and so on. The size of corporate data
warehouses has been rising higher and higher. Some progressive businesses have reaped
enormous benefits from data warehouses that are almost in the 500 terabyte range (five
times the size of the U.S. Library of Congress archive). The benefits from data warehouses
are no longer limited to a selected core of executives, managers, and analysts. Pervasive data
warehousing has become the operative principle, providing access and usage to staff at mul-
tiple levels. Information delivery through traditional reports and queries is being replaced by
interactive dashboards and scorecards.
More specifically, among topics on recent trends and changes, this enhanced edition
includes the following:
† Evolution of business intelligence
† Real-time business intelligence
† Data warehouse appliances
† Data warehouse: architectural types
† Data visualization enhancements
† Enterprise application integration (EAI)
† Enterprise information integration (EII)
† Agile data warehouse development
PREFACE xxvii
31.
† Data warehousingand KM (knowledge management)
† Data warehousing and ERP (enterprise resource planning)
† Data warehousing and CRM (customer relationship management)
† Improved requirements gathering methods
† Business activity monitoring (BAM)
† Interactive information delivery through dashboards and scorecards
† Additional STAR schema examples
† Master data management
† Examples of typical OLAP (online analytical processing) implementations
† Data mining applications
† Web clickstream analysis
† Highlights of vendors and products
† Real-world examples of best practices
ACKNOWLEDGMENTS
I wish to acknowledge my indebtedness and to express my gratitude to the authors listed in
the reference section at the end of the book. Their insights and observations have helped me
cover every topic adequately.
I must also express my appreciation to my students and professional colleagues. My inter-
actions with them have enabled me to shape this textbook according to the needs of IT
professionals.
My special thanks are due to the wonderful staff and editors at Wiley, my publishers, who
have worked with me and supported me for more than a decade in the publication and pro-
motion of my books.
PAULRAJ PONNIAH, PH.D.
Milltown, New Jersey
October 2009
xxviii PREFACE
CHAPTER 1
THE COMPELLINGNEED FOR DATA
WAREHOUSING
CHAPTER OBJECTIVES
† Understand the desperate need for strategic information
† Recognize the information crisis at every enterprise
† Distinguish between operational and informational systems
† Learn why all past attempts to provide strategic information failed
† Clearly see why data warehousing is the viable solution
† Understand business intelligence for an enterprise
As an information technology (IT) professional, you have worked on computer
applications as an analyst, programmer, designer, developer, database administrator, or
project manager. You have been involved in the design, implementation, and maintenance
of systems that support day-to-day business operations. Depending on the industries
you have worked in, you must have been involved in applications such as order processing,
general ledger, inventory, human resources, payroll, in-patient billing, checking accounts,
insurance claims, and so on.
These applications are important systems that run businesses. They process orders, main-
tain inventory, keep the accounting books, service the clients, receive payments, and process
claims. Without these computer systems, no modern business can survive. Companies
started building and using these systems in the 1960s and have become completely depen-
dent on them. As an enterprise grows larger, hundreds of computer applications are needed
to support the various business processes. These applications are effective in what they are
designed to do. They gather, store, and process all the data needed to successfully perform
the daily routine operations. They provide online information and produce a variety of
reports to monitor and run the business.
Data Warehousing Fundamentals for IT Professionals, Second Edition. By Paulraj Ponniah
Copyright # 2010 John Wiley & Sons, Inc.
3
35.
In the 1990s,as businesses grew more complex, corporations spread globally, and
competition became fiercer, business executives became desperate for information to stay
competitive and improve the bottom line. The operational computer systems did provide
information to run the day-to-day operations but what the executives needed were different
kinds of information that could be used readily to make strategic decisions. The decision
makers wanted to know which geographic regions to focus on, which product lines to
expand, and which markets to strengthen. They needed the type of information with proper
content and format that could help them make such strategic decisions. We may call this
type of information strategic information as different from operational information. The
operational systems, important as they were, could not provide strategic information.
Businesses, therefore, were compelled to turn to new ways of getting strategic information.
Data warehousing is a new paradigm specifically intended to provide vital strategic
information. In the 1990s, organizations began to achieve competitive advantage by building
data warehouse systems. Figure 1-1 shows a sample of strategic areas where data warehous-
ing had already produced results in different industries.
At the outset, let us now examine the crucial question: why do enterprises really need data
warehouses? This discussion is important because unless we grasp the significance of this
critical need, our study of data warehousing will lack motivation. So, please pay close
attention.
ESCALATING NEED FOR STRATEGIC INFORMATION
While we discuss the clamor by enterprises for strategic information, we need to look at the
prevailing information crisis that was holding them back, as well as the technology trends of
the past few years that are working in our favor, enabling us to provide strategic information.
Our discussion of the need for strategic information will not be complete unless we study
the opportunities provided by strategic information and the risks facing a company without
such information.
Who needs strategic information in an enterprise? What exactly do we mean by strategic
information? The executives and managers who are responsible for keeping the enterprise
Retail
Customer Loyalty
Market Planning
Financial
Risk Management
Fraud Detection
Airlines
Route Profitability
Yield Management
Manufacturing
Cost Reduction
Logistics Management
Utilities
Asset Management
Resource Management
Government
Manpower Planning
Cost Control
Organizations achieve competitive advantage:
Figure 1-1 Organizations’ use of data warehousing.
4 THE COMPELLING NEED FOR DATA WAREHOUSING
36.
competitive need informationto make proper decisions. They need information to formulate
the business strategies, establish goals, set objectives, and monitor results.
Here are some examples of business objectives:
† Retain the present customer base
† Increase the customer base by 15% over the next 5 years
† Improve product quality levels in the top five product groups
† Gain market share by 10% in the next 3 years
† Enhance customer service level in shipments
† Bring three new products to market in 2 years
† Increase sales by 15% in the North East Division
For making decisions about these objectives, executives and managers need information
for the following purposes: to get in-depth knowledge of their company’s operations, review
and monitor key performance indicators and note how these affect one another, keep track of
how business factors change over time, and compare their company’s performance relative
to the competition and to industry benchmarks. Executives and managers need to focus their
attention on customers’ needs and preferences, emerging technologies, sales and marketing
results, and quality levels of products and services. The types of information needed to make
decisions in the formulation and execution of business strategies and objectives are broad-
based and encompass the entire organization. All these types of essential information may
be combined under the broad classification called strategic information.
Strategic information is not for running the day-to-day operations of the business. It is
not intended to produce an invoice, make a shipment, settle a claim, or post a withdrawal
from a bank account. Strategic information is far more important for the continued health
and survival of the corporation. Critical business decisions depend on the availability of
proper strategic information in an enterprise. Figure 1-2 lists the desired characteristics of
strategic information.
INTEGRATED
DATA INTEGRITY
ACCESSIBLE
CREDIBLE
TIMELY
Must have a single, enterprise-wide view.
Information must be accurate and must
conform to business rules.
Easily accessible with intuitive access
paths, and responsive for analysis.
Every business factor must have one and
only one value.
Information must be available within the
stipulated time frame.
Figure 1-2 Characteristics of strategic information.
ESCALATING NEED FOR STRATEGIC INFORMATION 5
37.
The Information Crisis
Youmay be working in the IT department of a large conglomerate or you may be part of a
medium-sized company. Whatever may be the size of your company, think of all the various
computer applications in your company. Think of all the databases and the quantities of data
that support the operations of your company. How many years’ worth of customer data is
saved and available? How many years’ worth of financial data is kept in storage? Ten
years? Fifteen years? Where is all this data? On one platform? In legacy systems? In
client/server applications?
We are faced with two startling facts: (1) organizations have lots of data, (2) information
technology resources and systems are not effective at turning all that data into useful strategic
information. Over the past two decades, companies have accumulated tons and tons of
data about their operations. Mountains of data exist. Information is said to double every
18 months.
If we have such huge quantities of data in our organizations, why can’t our executives and
managers use this data for making strategic decisions? Lots and lots of information exists.
Why then do we talk about an information crisis? Most companies are faced with an infor-
mation crisis not because of lack of sufficient data, but because the available data is not
readily usable for strategic decision making. These large quantities of data are very useful
and good for running the business operations but hardly amenable for use in making
decisions about business strategies and objectives.
Why is this so? First, the data of an enterprise is spread across many types of incompatible
structures and systems. Your order processing system might have been developed 25 years
ago and is still running on an old mainframe. Possibly, some of the data may still be on
VSAM files. Your later credit assignment and verification system might be on a client/
server platform and the data for this application might be in relational tables. The data in
a corporation resides in various disparate systems, multiple platforms, and diverse structures.
The more technology your company has used in the past, the more disparate the data of
your company will be. But, for proper decision making on overall corporate strategies and
objectives, we need information integrated from all systems.
Data needed for strategic decision making must be in a format suitable for easy analysis to
spot trends. Executives and managers need to look at trends over time and steer their com-
panies in the proper direction. The tons of available operational data cannot be readily used
to discern trends. Operational data is event-driven. You get snapshots of transactions that
happen at specific times. You have data about units of sale of a single product in a specific
order on a given date to a certain customer. In the operational systems, you do not readily
have the trends of a single product over the period of a month, a quarter, or a year.
For strategic decision making, executives and managers must be able to review data from
different business viewpoints. For example, they must be able to review and analyze sales
quantities by product, salesperson, district, region, and customer groups. Can you think of
operational data being readily available for such analysis? Operational data is not directly
suitable for review from different viewpoints.
Technology Trends
Those of us who have worked in the information technology field for two or three decades
have witnessed the breathtaking changes that have taken place. First, the name of the com-
puter department in an enterprise went from “data processing” to “management information
6 THE COMPELLING NEED FOR DATA WAREHOUSING
38.
systems,” then to“information systems,” and more recently to “information technology.”
The entire spectrum of computing has undergone tremendous changes. The computing
focus itself has changed over the years. Old practices could not meet new needs. Screens
and preformatted reports are no longer adequate to meet user requirements.
Over the years, the price of MIPS (million instructions per second) is continuing to
decline, digital storage is costing less and less, and network bandwidth is increasing as its
price decreases. Specifically, we have seen explosive changes in these critical areas:
† Computing technology
† Human–machine interface
† Processing options
Figure 1-3 illustrates these waves of explosive growth.
What is our current position in the technology revolution? Hardware economics and min-
iaturization allow a workstation on every desk and provide increasing power at reducing
costs. New software provides easy-to-use systems. Open systems architecture creates
cooperation and enables the use of multivendor software. Improved connectivity, network-
ing, and the Internet open up interaction with an enormous number of systems and databases.
All of these improvements in technology are meritorious. These have made computing
faster, cheaper, and widely available. But what is their relevance to the escalating need
for strategic information? Let us understand how the current state of the technology is
conducive to providing strategic information.
Providing strategic information requires collection of large volumes of corporate data and
storing it in suitable formats. Technology advances in data storage and reduction in storage
costs readily accommodate data storage needs for strategic decision-support systems.
Analysts, executives, and managers use strategic information interactively to analyze and
spot business trends. The user will ask a question and get the results, then ask another ques-
tion, look at the results, and ask yet another question. This interactive process continues.
Tremendous advances in interface software make such interactive analysis possible.
1960 1970 1980 1990 2000 2010
Computing Technology
Processing Options
Human/Machine Interface
Mainframe Mini PCs/Networking Client/Server
Voice
GUI
Punch Card Video Display
Batch Online Networked
Figure 1-3 Explosive growth of information technology.
ESCALATING NEED FOR STRATEGIC INFORMATION 7
39.
Processing large volumesof data and providing interactive analysis requires extra computing
power. The explosive increase in computing power and its lower costs make provision of
strategic information feasible. What we could not accomplish a few years earlier for provid-
ing strategic information is now possible with the current advanced stage of information
technology.
Opportunities and Risks
We have looked at the information crisis that exists in every enterprise and grasped that in
spite of lots of operational data in the enterprise, data suitable for strategic decision
making is not available. Yet, the current state of the technology can make it possible to pro-
vide strategic information. While we are still discussing the escalating need for strategic
information by companies, let us ask some basic questions. What are the opportunities avail-
able to companies resulting from the possible use of strategic information? What are the
threats and risks resulting from the lack of strategic information available in companies?
Here are some examples of the opportunities made available to companies through the
use of strategic information:
† A business unit of a leading long-distance telephone carrier empowers its sales person-
nel to make better business decisions and thereby capture more business in a highly
competitive, multibillion-dollar market. A Web-accessible solution gathers internal
and external data to provide strategic information.
† Availability of strategic information at one of the largest banks in the United States with
assets in the $250 billion range allows users to make quick decisions to retain their
valued customers.
† In the case of a large health management organization, significant improvements in
health care programs are realized, resulting in a 22% decrease in emergency room
visits, 29% decrease in hospital admissions for asthmatic children, potentially sight-
saving screenings for hundreds of diabetics, improved vaccination rates, and more
than 100,000 performance reports created annually for physicians and pharmacists.
† At one of the top five U.S. retailers, strategic information combined with Web-enabled
analysis tools enables merchants to gain insights into their customer base, manage
inventories more tightly, and keep the right products in front of the right people at
the right place at the right time.
† A community-based pharmacy that competes on a national scale with more than 800
franchised pharmacies coast to coast gains in-depth understanding of what customers
buy, resulting in reduced inventory levels, improved effectiveness of promotions and
marketing campaigns, and improved profitability for the company.
† A large electronics company saves millions of dollars a year because of better manage-
ment of inventory.
On the other hand, consider the following cases where risks and threats of failures existed
before strategic information was made available for analysis and decision making:
† With an average fleet of about 150,000 vehicles, a nationwide car rental company can
easily get into the red at the bottom line if fleet management is not effective. The fleet is
the biggest cost in that business. With intensified competition, the potential for failure
is immense if the fleet is not managed effectively. Car idle time must be kept to an
8 THE COMPELLING NEED FOR DATA WAREHOUSING
40.
absolute minimum. Inattempting to accomplish this, failure to have the right class of
car available in the right place at the right time, all washed and ready, can lead to
serious loss of business.
† For a world-leading supplier of systems and components to automobile and light truck
equipment manufacturers, serious challenges faced included inconsistent data compu-
tations across nearly 100 plants, inability to benchmark quality metrics, and time-
consuming manual collection of data. Reports needed to support decision making
took weeks. It was never easy to get company-wide integrated information.
† For a large utility company that provided electricity to about 25 million consumers in
five mid-Atlantic states in the United States, deregulation could result in a few winners
and lots of losers. Remaining competitive and perhaps even just surviving depended on
centralizing strategic information from various sources, streamlining data access, and
facilitating analysis of the information by the business units.
FAILURES OF PAST DECISION-SUPPORT SYSTEMS
Assume a specific scenario. The marketing department in your company has been concerned
about the performance of the West Coast region and the sales numbers from the monthly
report this month are drastically low. The marketing vice president is agitated and wants
to get some reports from the IT department to analyze the performance over the past two
years, product by product, and compared to monthly targets. He wants to make quick stra-
tegic decisions to rectify the situation. The CIO wants your boss to deliver the reports as soon
as possible. Your boss runs to you and asks you to stop everything and work on the reports.
There are no regular reports from any system to give the marketing department what they
want. You have to gather the data from multiple applications and start from scratch. Does
this sound familiar?
At one time or another in your career in information technology, you must have been
exposed to situations like this. Sometimes, you may be able to get the information required
for such ad hoc reports from the databases or files of one application. Usually this is not so.
You may have to go to several applications, perhaps running on different platforms in your
company environment, to get the information. What happens next? The marketing depart-
ment likes the ad hoc reports you have produced. But now they would like reports in a
different format, containing more information that they did not think of originally. After
the second round, they find that the contents of the reports are still not exactly what
they wanted. They may also find inconsistencies among the data obtained from different
applications.
The fact is that for nearly two decades or more, IT departments have been attempting to
provide information to key personnel in their companies for making strategic decisions.
Sometimes an IT department could produce ad hoc reports from a single application. In
most cases, the reports would need data from multiple systems, requiring the writing of
extract programs to create intermediary files that could be used to produce the ad hoc reports.
Most of these attempts by IT in the past ended in failure. The users could not clearly define
what they wanted in the first place. Once they saw the first set of reports, they wanted more
data in different formats. The chain continued. This was mainly because of the very nature
of the process of making strategic decisions. Information needed for strategic decision
making has to be available in an interactive manner. The user must be able to query online,
get results, and query some more. The information must be in a format suitable for analysis.
FAILURES OF PAST DECISION-SUPPORT SYSTEMS 9
41.
In order toappreciate the reasons for the failure of IT to provide strategic information
in the past, we need to consider how IT was attempting to do this all these years. Let us,
therefore, quickly run through a brief history of decision support systems.
History of Decision-Support Systems
Depending on the size and nature of the business, most companies have gone through the
following stages of attempts to provide strategic information for decision making.
Ad hoc Reports. This was the earliest stage. Users, especially from marketing and
finance, would send requests to IT for special reports. IT would write special pro-
grams, typically one for each request, and produce the ad hoc reports.
Special Extract Programs. This stage was an attempt by IT to anticipate somewhat the
types of reports that would be requested from time to time. IT would write a suite
of programs and run the programs periodically to extract data from the various appli-
cations. IT would create and keep the extract files to fulfill any requests for special
reports. For any reports that could not be run off the extracted files, IT would write
individual special programs.
Small Applications. In this stage, IT formalized the extract process. IT would create
simple applications based on the extracted files. The users could stipulate the par-
ameters for each special report. The report printing programs would print the infor-
mation based on user-specific parameters. Some advanced applications would also
allow users to view information through online screens.
Information Centers. In the early 1970s, some major corporations created what were
called information centers. The information center typically was a place where
users could go to request ad hoc reports or view special information on screens.
These were predetermined reports or screens. IT personnel were present at these
information centers to help the users to obtain the desired information.
Decision-Support Systems. In this stage, companies began to build more sophisticated
systems intended to provide some semblance of strategic information. Again, similar
to the earlier attempts, these systems were supported by extracted files. The systems
were menu-driven and provided online information and also the ability to print special
reports. Many such decision-support systems were for marketing.
Executive Information Systems. This was an attempt to bring strategic information to the
executive desktop. The main criteria were simplicity and ease of use. The system
would display key information every day and provide the ability to request simple,
straightforward reports. However, only preprogrammed screens and reports were
available. After seeing the total countrywide sales, if the executive wanted to see
the analysis by region, by product, or by another dimension, it was not possible
unless such breakdowns were already preprogrammed. This limitation caused frustra-
tion and executive information systems did not last long in many companies.
Inability to Provide Information
Every one of the past attempts at providing strategic information to decision makers was
unsatisfactory. Figure 1-4 depicts the inadequate attempts by IT to provide strategic
information. As IT professionals, we are all familiar with the situation.
10 THE COMPELLING NEED FOR DATA WAREHOUSING
42.
Here are someof the factors relating to the inability to provide strategic information:
† IT receives too many ad hoc requests, resulting in a large overload. With limited
resources, IT is unable to respond to the numerous requests in a timely fashion.
† Requests are too numerous; they also keep changing all the time. The users need more
reports to expand and understand the earlier reports.
† The users find that they get into the spiral of asking for more and more supplementary
reports, so they sometimes adapt by asking for every possible combination, which only
increases the IT load even further.
† The users have to depend on IT to provide the information. They are not able to access
the information themselves interactively.
† The information environment ideally suited for strategic decision making has to be
very flexible and conducive for analysis. IT has been unable to provide such an
environment.
OPERATIONAL VERSUS DECISION-SUPPORT SYSTEMS
Is there an underlying reason for the failure of all the previous attempts by IT to provide
strategic information? What has IT been doing all along? The fundamental reason for
the inability to provide strategic information is that we have been trying all along to provide
strategic information from the operational systems. These operational systems such as order
processing, inventory control, claims processing, outpatient billing, and so on are not
designed or intended to provide strategic information. If we need the ability to provide
strategic information, we must get the information from altogether different types of systems.
Only specially designed decision support systems or informational systems can provide
strategic information. Let us understand why.
THE FAMILIAR
MERRY-GO-ROUND
(4–6 weeks)
User needs
information
User requests
reports from IT
IT places
request on
backlog
IT creates ad
hoc queries
IT sends
requested
reports
User hopes
to find the
right
answers
Figure 1-4 Inadequate attempts by IT to provide strategic information.
OPERATIONAL VERSUS DECISION-SUPPORT SYSTEMS 11
43.
Making the Wheelsof Business Turn
Operational systems are online transaction processing (OLTP) systems. These are the sys-
tems that are used to run the day-to-day core business of the company. They are the so-
called bread-and-butter systems. Operational systems make the wheels of business turn
(see Fig. 1-5). They support the basic business processes of the company. These systems
typically get the data into the database. Each transaction processes information about a
single entity such as a single order, a single invoice, or a single customer.
Watching the Wheels of Business Turn
On the other hand, specially designed and built decision-support systems are not meant to
run the core business processes. They are used to watch how the business runs, and then
make strategic decisions to improve the business (see Fig. 1-6).
Decision-support systems are developed to get strategic information out of the database,
as opposed to OLTP systems that are designed to put the data into the database. Decision-
support systems are developed to provide strategic information.
Different Scope, Different Purposes
Therefore, we find that in order to provide strategic information we need to build informa-
tional systems that are different from the operational systems we have been building to run
the basic business. It will be worthless to continue to dip into the operational systems for
Get the information out
Watching the wheels of business turn
Show me the top-selling products
Show me the problem regions
Tell me why (drill down)
Let me see other data (drill across)
Show the highest margins
Alert me when a district sells below target
Figure 1-6 Decision-support systems.
Get the data in
Making the wheels of business turn
Take an order
Process a claim
Make a shipment
Generate an invoice
Receive cash
Reserve an airline seat
Figure 1-5 Operational systems.
12 THE COMPELLING NEED FOR DATA WAREHOUSING
44.
strategic information aswe have been doing in the past. As companies face fiercercompetition
and businesses become more complex, continuing the past practices will only lead to disaster.
We need to design and build informational systems
† That serve different purposes
† Whose scopes are different
† Whose data content is different
† Where the data usage patterns are different
† Where the data access types are different
Figure 1-7 summarizes the differences between the traditional operational systems and
the newer informational systems that need to be built.
DATA WAREHOUSING—THE ONLY VIABLE SOLUTION
At this stage of our discussion, we now realize that we do need different types of decision-
support systems to provide strategic information. The type of information needed for stra-
tegic decision making is different from that available from operational systems. We need
a new type of system environment for the purpose of providing strategic information for
analysis, discerning trends, and monitoring performance.
Let us examine the desirable features and processing requirements of this new type of
system environment. Let us also consider the advantages of this type of system environment
designed for strategic information.
A New Type of System Environment
The desired features of the new type of system environment are:
† Database designed for analytical tasks
† Data from multiple applications
† Easy to use and conducive to long interactive sessions by users
How are they different?
Current values
Optimized for
transactions
High
Read, update, delete
Predictable, repetitive
Sub-seconds
Large number
Archived, derived,
summarized
Optimized for complex
queries
Medium to low
Read
Ad hoc, random, heuristic
Several seconds to minutes
Relatively small number
Data Content
Data Structure
Access Frequency
Access Type
Usage
Response Time
Users
OPERATIONAL INFORMATIONAL
Figure 1-7 Operational and informational systems.
DATA WAREHOUSING—THE ONLY VIABLE SOLUTION 13
45.
† Read-intensive datausage
† Direct interaction with the system by the users without IT assistance
† Content updated periodically and stable
† Content to include current and historical data
† Ability for users to run queries and get results online
† Ability for users to initiate reports
Processing Requirements in the New Environment
Most of the processing in the new environment for strategic information will have to be
analytical. There are at least four levels of analytical processing requirements:
1. Running of simple queries and reports against current and historical data.
2. Ability to perform “what if” analysis in many different ways.
3. Ability to query, step back, analyze, and then continue the process to any desired
length.
4. Ability to spot historical trends and apply them in future interactive processes.
Strategic Information from the Data Warehouse
This new system environment that users desperately need to obtain strategic information
happens to be the new paradigm of data warehousing. Beginning with the late 1980s and
into the 1990s enterprises began building such system environments. This new environment,
known as the data warehouse environment, is kept separate from the system environment that
supports the routine day-to-day operations. The data warehouse essentially has become the
source of strategic information for the enterprise to enable strategic decision making. The
data warehouse has proved to be the only viable solution. We have clearly seen that solutions
based on the data extracted from operational systems have all been totally unsatisfactory.
Figure 1-8 shows the general overview of the data warehouse as the source of strategic
information for the enterprise.
OPERATIONAL
SYSTEMS
DATA
WAREHOUSE
Data Transformation
(Basic
business
processes)
Extraction, cleansing, aggregation
Key Measurements/
Business Dimensions
OPERATIONAL
DATA
STRATEGIC
INFORMATION
Figure 1-8 General overview of the data warehouse.
14 THE COMPELLING NEED FOR DATA WAREHOUSING
46.
At a highlevel of interpretation, the data warehouse contains critical metrics of the
business processes stored along business dimensions. For example, a data warehouse
might contain units of sales, by product, day, customer group, sales district, sales region,
and promotion. Here the business dimensions are product, day, customer group, sales district,
sales region, and sales promotion type. Unit sales represent the metrics being measured across
products, days, customer groups, sales districts, sales regions, and sales promotion types.
From where does the data warehouse get its data? The data is derived from the operational
systems that support the basic business processes of the organization. In between the oper-
ational systems and the data warehouse, there is a data staging area. In this staging area, the
operational data is cleansed and transformed into a form suitable for placement in the data
warehouse for easy retrieval.
DATA WAREHOUSE DEFINED
We have reached the strong conclusion that data warehousing is the only viable solution
for providing strategic information. We arrived at this conclusion based on the functions
of the new system environment called the data warehouse. So, let us try to come up with
a functional definition of the data warehouse.
The data warehouse is an informational environment that:
† Provides an integrated and total view of the enterprise.
† Makes the enterprise’s current and historical information easily available for strategic
decision making.
† Makes decision-support transactions possible without hindering operational systems.
† Renders the organization’s information consistent.
† Presents a flexible and interactive source of strategic information.
A Simple Concept for Information Delivery
In the final analysis, data warehousing is a simple concept. It is born out of the need for stra-
tegic information and isthe result of the search fora new way to provide such information. The
methods of the previous decades using the operational computing environment were unsatis-
factory. The new concept is not to generate fresh data, but to make use of the large volumes of
existing data and to transform it into forms suitable for providing strategic information.
The data warehouse exists to answer questions users have about the business, the perform-
ance of the various operations, the business trends, and about what can be done to improve
the business. The data warehouse exists to provide business users with direct access to data,
to provide a single unified version of the key performance indicators, to record the past accu-
rately, and to provide the ability for viewing the data from many different perspectives. In
short, the data warehouse is there to support decisional processes.
Data warehousing is really a simple concept: Take all the data you already have in the
organization, clean and transform it, and then provide useful strategic information. What
could be simpler than that?
An Environment, Not a Product
A data warehouse is not a single software or hardware product you purchase to provide stra-
tegic information. It is, rather, a computing environment where users can find strategic
DATA WAREHOUSE DEFINED 15
47.
information, an environmentwhere users are put directly in touch with the data they need to
make better decisions. It is a user-centric environment.
Let us summarize the characteristics of this new computing environment called the data
warehouse:
† An ideal environment for data analysis and decision support
† Fluid, flexible, and interactive
† 100% user-driven
† Very responsive and conducive to the ask–answer–ask again pattern
† Provides the ability to discover answers to complex, unpredictable questions
A Blend of Many Technologies
Let us reexamine the basic concept of data warehousing. The basic concept of data ware-
housing is:
† Take all the data from the operational systems.
† Where necessary, include relevant data from outside, such as industry benchmark
indicators.
† Integrate all the data from the various sources.
† Remove inconsistencies and transform the data.
† Store the data in formats suitable for easy access for decision making.
Different technologies are, therefore, needed to support these functions. Figure 1-9 shows
how a data warehouse is a blend of the many technologies needed for the various functions.
OPERATIONAL
SYSTEMS
DATA
WAREHOUSE
Data Transformation
(Basic business
processes)
Extraction, cleansing, aggregation
Key Measurements/
Business Dimensions
Executives/Managers/
Analysts
Data Modeling
Data
Acquisition
Data Quality
Data Manage-
ment
Metadata
Management
Analysis
Administration
Development
Tools
Applications
Storage
Management
BLEND OF TECHNOLOGIES
OPERATIONAL
DATA STRATEGIC
INFORMATION
Figure 1-9 The data warehouse: a blend of technologies.
16 THE COMPELLING NEED FOR DATA WAREHOUSING
48.
Although many technologiesare in use, they all work together in a data warehouse. The
end result is the creation of a new computing environment for the purpose of providing the
strategic information every enterprise needs desperately.
THE DATA WAREHOUSING MOVEMENT
As enterprises began to realize the effectiveness of data warehousing, more and more organ-
izations jumped on the bandwagon and data warehousing began to spread at a rapid rate. First
the large companies that were able to quickly afford the outlay of resources began to launch
data warehousing projects. Medium-sized companies also entered the data warehousing
arena. Soon several businesses began to reap the benefits provided by data warehousing.
Much research began to be focused on this new phenomenon. Many vendors began to
offer hardware and software products to support the different functions within the data
warehouse.
Prior to the data warehousing concept with an architectural model for the movement of
data from operational systems to decision support environments, companies attempted mul-
tiple decision-support environments within their organizations. This had to be done with
enormous costs fraught with large amounts of data redundancies and inconsistencies.
Each decision-support environment was intended to serve specific groups of users for lim-
ited purposes. The adoption of data warehousing changed all of this. Similar to industrial
warehouses, data warehouses are intended for large-scale collection and storage of corporate
data to provide strategic information for the overall needs. Just as products stored in industrial
warehouses are distributed to retail stores or marts, data stored in data warehouses may be
channeled to data marts for specific users.
Data Warehousing Milestones
As data warehousing gained acceptance during the 1980s and 1990s, we may trace some
of the highlights of the movement. Listed below are the significant milestones during the
initial phase of the movement:
† 1983—Teradata introduces a database management system (DBMS) designed for
decision-support systems.
† 1988—The article An Architecture for a Business and Information Systems introducing
the term “business data warehouse” is published by Barry Devlin and Paul Murphy in
the IBM Systems Journal.
† 1990—Red Brick Systems introduces Red Brick Warehouse, a DBMS specifically for
data warehousing.
† 1991—Bill Inmon publishes his book Building the Data Warehouse (he is generally
considered the father of data warehousing).
† 1991—Prism Solutions introduces Prism Warehouse Manager software for developing
a data warehouse.
† 1995—The Data Warehousing Institute, a premier institution that promotes data ware-
housing is founded. (This institution has since emerged as the leading voice in the data
warehousing and business intelligence arena providing education, research, and
support.)
THE DATA WAREHOUSING MOVEMENT 17
49.
† 1996—Ralph Kimballpublishes a seminal book The Data Warehousing Toolkit. (He is
among the top authorities in the field of data warehousing and decision support
systems.)
† 1997—Oracle 8, with support for STAR schema queries, is released.
Initial Challenges
As the adoption of data warehousing by organizations continued, even those companies that
implemented data warehouses faced significant challenges that promoted a moderate shift
from the original implementations. Here is a list of the key challenges that had to be
overcome:
† Customers had become more sophisticated and savvy, pressing for greater service,
improved quality, and innovative customization.
† Government deregulation of industries exposed companies to fiercer competition and
the need for leaner operation.
† Expansion of globalization opened the arena for competitors, more in number and
greater in power.
† New privacy regulations created the need to revise methods of collection and use of
information.
† Improper architecture of some initial data warehousing systems produced fragmented
views of corporate data and tended to produce disparate information silos.
† Query, reporting, and analysis tools provided to the users in the early data warehousing
environments for self-service proved to be too complex and overwhelming for use by
the users themselves.
† The promises of early data warehouse environments to provide user-friendly tools for
the masses remained unfulfilled.
EVOLUTION OF BUSINESS INTELLIGENCE
The initial challenges following the adoption of early data warehousing systems forced com-
panies to take a second look at providing decision support. Companies began to perceive that
the goal of decision-support systems is twofold: transformation of data to information; deri-
vation of knowledge from information. Each of these two aspects needs to be emphasized
and strengthened appropriately to provide the necessary results. Business intelligence for
an organization requires two environments, one to concentrate on transformation of data
into information and the other to deal with transformation of information into knowledge.
Business intelligence (BI), therefore, is a broad group of applications and technologies.
First, the term refers to the systems and technologies for gathering, cleansing, consolidating,
and storing corporate data. Next, business intelligence relates to the tools, techniques, and
applications for analyzing the stored data. The Gartner Group popularized BI as an umbrella
term to include concepts and methods to improve business decision making by fact-based
support systems. The Data Warehousing Institute compares BI to a data refinery. Similar
to an oil refinery, a BI setting takes data as the raw material, collects it, refines it, and
processes it into several information products.
18 THE COMPELLING NEED FOR DATA WAREHOUSING
50.
BI: Two Environments
Whenyou consider all that BI encompasses, you may view BI for an enterprise as composed
of two environments:
Data to Information. In this environment data from multiple operational systems are
extracted, integrated, cleansed, transformed and stored as information in specially
designed repositories.
Information to Knowledge. In this environment analytical tools are made available to
users to access and analyze the information content in the specially designed reposi-
tories and turn information into knowledge.
BI: Data Warehousing and Analytics
As some of the early challenges indicated, sufficient and separate attention needs to be given
to the two environments that BI encompasses. In today’s businesses, extraction, consolida-
tion, transformation, and storing of data as strategic information is a formidable task. Again,
using this information with sophisticated tools for proper decision making is equally chal-
lenging. Therefore, the trend is to consider these as two distinct environments for corporate
BI. Vendors also tend to specialize in tools appropriate for these two distinct environments.
However, the two environments are complementary and need to work together.
Figure 1-10 shows the two complementary environments, the data warehousing environ-
ment, which transforms data into information, and the analytical environment, which pro-
duces knowledge from information. As we proceed from chapter to chapter, we will keep
expanding and intensifying our discussion of these two environments.
OPERATIONAL
SYSTEMS
DATA WAREHOUSE
Extract
Integrate
Cleanse
Transform
INFORMATION
Data
Information
USERS
Query
Analyze
Report
Perform
Knowledge
Figure 1-10 BI: data warehousing and analytical environments.
EVOLUTION OF BUSINESS INTELLIGENCE 19
51.
CHAPTER SUMMARY
† Companiesare desperate for strategic information to counter fiercer competition,
extend market share, and improve profitability.
† In spite of tons of data accumulated by enterprises over the past decades, every enter-
prise is caught in the middle of an information crisis. Information needed for strategic
decision making is not readily available.
† All the past attempts by IT to provide strategic information have been failures. This was
mainly because IT has been trying to provide strategic information from operational
systems.
† Informational systems are different from the traditional operational systems.
Operational systems are not designed for strategic information.
† We need a new type of computing environment to provide strategic information. The
data warehouse promises to be this new computing environment.
† Data warehousing is the viable solution. There is a compelling need for data warehous-
ing in every enterprise.
† The challenges faced in early data warehouse implementations led the movement
towards maturity.
† The notion of business intelligence for an enterprise has evolved as an umbrella con-
cept embracing data warehousing and analytics to transform data into information and
information into knowledge.
REVIEW QUESTIONS
1. What do we mean by strategic information? For a commercial bank, name five types of
strategic objectives.
2. Do you agree that a typical retail store collects huge volumes of data through its oper-
ational systems? Name three types of transaction data likely to be collected by a retail
store in large volumes during its daily operations.
3. Examine the opportunities that can be provided by strategic information for a medical
center. Can you list five such opportunities?
4. Why were all the past attempts by IT to provide strategic information failures? List three
concrete reasons and explain.
5. Describe five differences between operational systems and informational systems.
6. Why are operational systems not suitable for providing strategic information? Give three
specific reasons and explain.
7. Name six characteristics of the computing environment needed to provide strategic
information.
8. What types of processing take place in a data warehouse? Describe.
9. A data warehouse is an environment, not a product. Discuss.
20 THE COMPELLING NEED FOR DATA WAREHOUSING
52.
10. Data warehousingis the only viable means to resolve the information crisis and to
provide strategic information. List four reasons to support this assertion and explain
them.
EXERCISES
1. Match the columns:
1. information crisis
2. strategic information
3. operational systems
4. information center
5. data warehouse
6. order processing
7. executive information
8. data staging area
9. extract programs
10. information technology
A. OLTP applications
B. produce ad hoc reports
C. explosive growth
D. despite lots of data
E. data cleaned and transformed
F. users go to get information
G. used for decision making
H. environment, not product
I. for day-to-day operations
J. simple, easy to use
2. The current trends in hardware/software technology make data warehousing feasible.
Explain with some examples how exactly technology trends do help.
3. You are the IT director of a nationwide insurance company. Write a memo to the execu-
tive vice president explaining the types of opportunities that can be realized with readily
available strategic information.
4. For an airline company, how can strategic information increase the number of frequent
flyers? Discuss giving specific details.
5. You are a senior analyst in the IT department of a company manufacturing automobile
parts. The marketing VP is complaining about the poor response by IT in providing
strategic information. Draft a proposal to him introducing the concept of business
intelligence and how data warehousing and analytics as part of business intelligence
for your company would be the optimal solution.
EXERCISES 21
54.
CHAPTER 2
DATA WAREHOUSE:THE BUILDING
BLOCKS
CHAPTER OBJECTIVES
† Review formal definitions of a data warehouse
† Discuss the defining features
† Distinguish between data warehouses and data marts
† Review the evolved architectural types
† Study each component or building block that makes up a data warehouse
† Introduce metadata and highlight its significance
As we have seen in the last chapter, data warehousing has evolved as part of business intelli-
gence for the enterprise. In the data warehouse you integrate and transform enterprise data
into information suitable for strategic decision making. You take all the historic data from
the various operational systems, combine this internal data with any relevant data from out-
side sources, and pull them together. You resolve any conflicts in the way data resides in
different systems and transform the integrated data content into a format suitable for provid-
ing information to the various classes of users. Finally, you supplement with information
delivery methods.
In order to set up this information delivery system, you need different components or
building blocks. These building blocks are arranged together in the most optimal way to
serve the intended purpose. They are arranged in a suitable architecture. Before we get
into the individual components and their arrangement in the overall architecture, let us
first look at some fundamental features of the data warehouse.
Bill Inmon (1996, p. 33), considered to be the father of data warehousing as noted in the
previous chapter, provides the following definition: “A Data Warehouse is a subject
oriented, integrated, nonvolatile, and time variant collection of data in support of manage-
ment’s decisions.”
Data Warehousing Fundamentals for IT Professionals, Second Edition. By Paulraj Ponniah
Copyright # 2010 John Wiley & Sons, Inc.
23
55.
Sean Kelly, anotherleading data warehousing practitioner, defines the data warehouse in
the following way. The data in the data warehouse is:
Separate
Available
Integrated
Time stamped
Subject oriented
Nonvolatile
Accessible
DEFINING FEATURES
Let us examine some of the key defining features of the data warehouse based on these defi-
nitions. What about the nature of the data in the data warehouse? How is this data different
from the data in any operational system? Why does it have to be different? How is the data
content in the data warehouse used?
Subject-Oriented Data
In operational systems, we store data by individual applications. In the data sets for an order
processing application, we keep the data for that particular application. These data sets pro-
vide the data for all the functions for entering orders, checking stock, verifying customer’s
credit, and assigning the order for shipment. But these data sets contain only the data that is
needed for those functions relating to this particular application. We will have some data sets
containing data about individual orders, customers, stock status, and detailed transactions,
but all of these are structured around the processing of orders.
Similarly, for a banking institution, data sets for a consumer loans application contain data
for that particular application. Data sets for other distinct applications for checking accounts
and savings accounts relate to those specific applications. Again, in an insurance company,
different data sets support individual applications such as automobile insurance, life insur-
ance, and workers’ compensation insurance.
In every industry, data sets are organized around individual applications to support those
particular operational systems. These individual data sets have to provide data for the specific
applications to perform the specific functions efficiently. Therefore, the data sets for each
application need to be organized around that specific application.
In striking contrast, in the data warehouse, data is stored by real-world business subjects or
events, not byapplications. The data in a datawarehouse is organized in such away that all the
datasetsrelatingtothesame real-world business subjectoreventistiedtogether.Wehavesaid
that data is linked and stored by business subjects. Well, what are business subjects? Business
subjects differ from enterprise to enterprise. These are the subjects critical for the enterprise.
For a manufacturing company, sales, shipments, and inventory are critical business subjects.
For a retail store, sales at the check-out counter would be a critical business subject.
Figure 2-1 distinguishes between how data is stored in operational systems and in the
data warehouse. In the operational systems shown, data for each application is organized
separately by application: order processing, consumer loans, customer billing, accounts
24 DATA WAREHOUSE: THE BUILDING BLOCKS
56.
receivable, claims processing,and savings accounts. For example, claims is a critical
business subject for an insurance company. Claims under automobile insurance policies
are processed in the auto insurance application. Claims data for automobile insurance is
organized in that application. Similarly, claims data for workers’ compensation insurance
is organized in the workers’ comp insurance application. But in the data warehouse for an
insurance company, data about claims is organized around the subject of claims and not
by individual applications of auto insurance and workers’ comp.
In a data warehouse, there is no application flavor. The data in a data warehouse cuts
across applications.
Integrated Data
For proper decision making, you need to pull together all the relevant data from the various
applications. The data in the data warehouse comes from several operational systems. Source
data reside in different databases, files, and data segments. These are disparate applications,
so the operational platforms and operating systems could be different. The file layouts, char-
acter code representations, and field naming conventions all could be different.
In addition to data from internal operational systems, for many enterprises, data from out-
side sources is likely to be very important. Companies such as Metro Mail, A. C. Nielsen, and
IRI specialize in providing vital data on a regular basis. Your data warehouse may need data
from such sources. This is one more variation in the mix of source data for a data warehouse.
Figure 2-2 illustrates a simple process of data integration for a banking institution. Here
the data fed into the subject area of account in the data warehouse comes from three different
operational applications. Even within just three applications, there could be several vari-
ations. Naming conventions could be different; attributes for data items could be different.
The account number in the savings account application could be eight bytes long, but only
six bytes in the checking account application.
Before the data from various disparate sources can be usefully stored in a data warehouse,
you have to remove the inconsistencies. You have to standardize the various data elements
In the data warehouse, data is not stored by operational
applications, but by business subjects.
Order
Processing
Consumer
Loans
Customer
Billing
Accounts
Receivable
Claims
Processing
Savings
Accounts
Sales Product
Claims Policy
Account
Customer
Operational Applications Data Warehouse Subjects
Figure 2-1 The data warehouse is subject oriented.
DEFINING FEATURES 25
57.
and make sureof the meanings of data names in each source application. Before moving the
data into the data warehouse, you have to go through a process of transformation, consolida-
tion, and integration of the source data.
Here are some of the items that would need to standardized and made consistent:
† Naming conventions
† Codes
† Data attributes
† Measurements
Time-Variant Data
For an operational system, the stored data contains the current values. In an accounts recei-
vable system, the balance is the current outstanding balance in the customer’s account. In an
order entry system, the status of an order is the current status of the order. In a consumer loans
application, the balance amount owed by the customer is the current amount. Of course, we
store some past transactions in operational systems, but, essentially, operational systems
reflect current information because these systems support day-to-day current operations.
On the other hand, the data in the data warehouse is meant for analysis and decision
making. If a user is looking at the buying pattern of a specific customer, the user needs
data not only about the current purchase, but on the past purchases as well. When a user
wants to find out the reason for the drop in sales in the North East division, the user
needs all the sales data for that division over a period extending back in time. When an ana-
lyst in a grocery chain wants to promote two or more products together, that analyst wants
sales of the selected products over a number of past quarters.
A data warehouse, because of the very nature of its purpose, has to contain historical data,
not just current values. Data is stored as snapshots over past and current periods. Changes to
data are tracked and recorded so that, if necessary, reports can be produced to show changes
over time. Every data structure in the data warehouse contains the time element. You will
find historical snapshots of the operational data in the data warehouse. This aspect of the
data warehouse is quite significant for both the design and the implementation phases.
Data inconsistencies are removed; data from diverse
operational applications is integrated.
Savings
Account
Loans
Account
Checking
Account
DATA WAREHOUSE SUBJECTS
Subject
= Account
DATA
FROM
APPLICATIONS
Figure 2-2 The data warehouse is integrated.
26 DATA WAREHOUSE: THE BUILDING BLOCKS
58.
For example, ina data warehouse containing units of sale, the quantity stored in each file
record or table row relates to a specific time element. Depending on the level of the details in
the data warehouse, the sales quantity in a record may relate to a specific date, week, month,
or quarter.
The time-variant nature of the data in a data warehouse
† Allows for analysis of the past
† Relates information to the present
† Enables forecasts for the future
Nonvolatile Data
Data extracted from the various operational systems and pertinent data obtained from outside
sources are transformed, integrated, and stored in the data warehouse. The data in the data
warehouse is not intended for running of the day-to-day business. When you want to process
the next order received from a customer, you do not look into the data warehouse to find the
current stock status. The operational order entry application is meant for that purpose. In the
data warehouse, you keep the extracted stock status data as snapshots over time. You do not
update the data warehouse every time you process a single order.
Data from the operational systems are moved into the data warehouse at specific intervals.
Depending on the requirements of the business, these data movements take place twice a day,
once a day, once a week, or maybe once in two weeks. In fact, in a typical data warehouse,
data movements to different data sets may take place at different frequencies. The changes to
the attributes of the products may be moved once a week. Any revisions to geographical
setup may be moved once a month. The units of sales may be moved once a day. You
plan and schedule the data movements or data loads based on the requirements of your users.
As illustrated in Fig. 2-3, every business transaction does not update the data in the data
warehouse. The business transactions update the operational system databases in real time.
We add, change, or delete data from an operational system as each transaction happens but do
not usually update the data in the data warehouse. You do not delete the data in the data
Usually the data in the data warehouse
is not updated or deleted.
Operational System Applications Decision Support Systems
OLTP
DATABASES
DATA
WAREHOUSE
Read
Add / Change / Delete
Read
LOADS
Figure 2-3 The data warehouse is nonvolatile.
DEFINING FEATURES 27
59.
warehouse in realtime. Once the data is captured and committed in the data warehouse, you
do not run individual transactions to change the data there. Data updates are commonplace in
an operational database; not so in a data warehouse. The data in a data warehouse is not as
volatile as the data in an operational database is. The data in a data warehouse is primarily for
query and analysis.
Data Granularity
In an operational system, data is usually kept at the lowest level of detail. In a point-of-sale
system for a grocery store, the units of sale are captured and stored at the level of units of a
product per transaction at the check-out counter. In an order entry system, the quantity
ordered is captured and stored at the level of units of a product per order received from
the customer. Whenever you need summary data, you add up the individual transactions.
If you are looking for units of a product ordered this month, you read all the orders entered
for the entire month for that product and add up. You do not usually keep summary data in an
operational system.
When a user queries the data warehouse for analysis, he or she usually starts by looking at
summary data. The user may start with total sale units of a product in an entire region. Then
the user may want to look at the breakdown by states in the region. The next step may be the
examination of sale units by the next level of individual stores. Frequently, the analysis
begins at a high level and moves down to lower levels of detail.
In a data warehouse, therefore, you find it efficient to keep data summarized at different
levels. Depending on the query, you can then go to the particular level of detail and
satisfy the query. Data granularity in a data warehouse refers to the level of detail. The
lower the level of detail, the finer is the data granularity. Of course, if you want to keep
data in the lowest level of detail, you have to store a lot of data in the data warehouse.
You will have to decide on the granularity levels based on the data types and the expected
system performance for queries. Figure 2-4 shows examples of data granularity in a typical
data warehouse.
Data granularity refers to the level of detail. Depending on the
requirements, multiple levels of detail may be present. Many data
warehouses have at least dual levels of granularity.
Daily Detail
Account
Activity Date
Amount
Deposit/Withdrawal
Monthly Summary
Account
Month
Number of transactions
Withdrawals
Deposits
Beginning Balance
Ending Balance
Quarterly Summary
Account
Quarter
Number of transactions
Withdrawals
Deposits
Beginning Balance
Ending Balance
THREE DATA LEVELS IN A BANKING DATA WAREHOUSE
Figure 2-4 Data granularity.
28 DATA WAREHOUSE: THE BUILDING BLOCKS
60.
DATA WAREHOUSES ANDDATA MARTS
Those who had been following the literature on data warehouses in the early years of the sub-
ject no doubt came across the terms “data warehouse” and “data mart.” Many who were new
to this paradigm were confused about these terms. Some authors and vendors used the two
terms synonymously. Some made distinctions that were not clear enough. At this point, it
would be worthwhile for us to examine these two terms and take our position.
Writing in a leading trade magazine in 1998, the early days of data warehousing, Bill
Inmon stated, “The single most important issue facing the IT manager this year is whether
to build the data warehouse first or the data mart first.” This statement is somewhat true even
today. Let us examine this statement and tackle the definitions.
Before deciding to build a data warehouse for your organization, you need to ask the fol-
lowing basic and fundamental questions and address the relevant issues:
† Top-down or bottom-up approach?
† Enterprise-wide or departmental?
† Which first—data warehouse or data mart?
† Build pilot or go with a full-fledged implementation?
† Dependent or independent data marts?
These are critical issues requiring careful examination and planning.
Should you look at the big picture of your organization, take a top-down approach, and
build a mammoth data warehouse? Or, should you adopt a bottom-up approach, look at the
individual local and departmental requirements, and build bite-size departmental data marts?
Should you build a large data warehouse and then let that repository feed data into local,
departmental data marts? On the other hand, should you build individual local data marts,
and combine them to form your overall data warehouse? Should these local data marts be
independent of one another? Or should they be dependent on the overall data warehouse
for data feed? Should you build a pilot data mart? These are crucial questions.
How Are They Different?
Let us take a close look at Fig. 2-5. Here are the two different basic approaches: (1) overall
data warehouse feeding dependent data marts, and (2) several departmental or local data
marts combining into a data warehouse. In the first approach, you extract data from the oper-
ational systems; you then transform, clean, integrate, and keep the data in the data warehouse.
So, which approach is best in your case, the top-down or the bottom-up approach? Let us
examine these two approaches carefully.
Top-Down Versus Bottom-Up Approach
Top-Down Approach Bill Inmon is one of the leading proponents of the top-down
approach. He has defined a data warehouse as a centralized repository for the entire enter-
prise. In this approach the data in the data warehouse is stored at the lowest level of granu-
larity based on a normalized data model. In the Inmon vision the data warehouse is at the
center of the “Corporate Information Factory” (CIF) providing the logical framework for
delivering business intelligence to the enterprise. Business operations provide data to
DATA WAREHOUSES AND DATA MARTS 29
61.
drive the CIF.The centralized data warehouse would feed the dependent data marts that may
be designed based on a dimensional data model.
The advantages of this approach are:
† A truly corporate effort, an enterprise view of data
† Inherently architected, not a union of disparate data marts
† Single, central storage of data about the content
† Centralized rules and control
† May see quick results if implemented with iterations
The disadvantages are:
† Takes longer to build even with an iterative method
† High exposure to risk of failure
† Needs high level of cross-functional skills
† High outlay without proof of concept
This is the big-picture approach in which you build the overall, big, enterprise-wide data
warehouse. Here you do not have a collection of fragmented islands of information. The data
warehouse is large and integrated. This approach, however, would take longer to build and
has a high risk of failure. If you do not have experienced professionals on your team, this
approach could be hazardous. Also, it will be difficult to sell this approach to senior manage-
ment and sponsors. They are not likely to see results soon enough.
Bottom-Up Approach Ralph Kimball, another leading author and expert practitioner
in data warehousing, is a proponent of the approach that has come to be known as the
bottom-up approach. Kimball (1996) envisions the corporate data warehouse as a collection
of conformed data marts. The key consideration is the conforming of the dimensions among
the separate data marts. In this approach data marts are created first to provide analytical and
reporting capabilities for specific business subjects based on the dimensional data model.
DATA WAREHOUSE
Corporate/Enterprise-wide
Union of all data marts
Data received from staging area
Queries on presentation resource
Structure for corporate view of
data
Organized on E-R model
DATA MART
Departmental
A single business process
STARjoin (facts & dimensions)
Technology optimal for data
access and analysis
Structure to suit the
departmental view of data
Figure 2-5 Data warehouse versus data mart.
30 DATA WAREHOUSE: THE BUILDING BLOCKS
62.
Data marts containdata at the lowest level of granularity and also as summaries depending
on the needs for analysis. These data marts are joined or “unioned” together by conforming
the dimensions. We will discuss this process of conforming the dimensions in great detail in
subsequent chapters.
The advantages of this approach are:
† Faster and easier implementation of manageable pieces
† Favorable return on investment and proof of concept
† Less risk of failure
† Inherently incremental; can schedule important data marts first
† Allows project team to learn and grow
The disadvantages are:
† Each data mart has its own narrow view of data
† Permeates redundant data in every data mart
† Perpetuates inconsistent and irreconcilable data
† Proliferates unmanageable interfaces
In this bottom-up approach, you build your departmental data marts one by one. You
would set a priority scheme to determine which data marts you must build first. The most
severe drawback of this approach is data fragmentation. Each independent data mart will
be blind to the overall requirements of the entire organization.
A Practical Approach
In order to formulate an approach for your organization, you need to examine what exactly
your organization wants. Is your organization looking for long-term results or fast data marts
for only a few subjects for now? Does your organization want quick, proof-of-concept,
throw-away implementations? Or, do you want to look into some other practical approach?
Although the top-down and the bottom-up approaches each have their own advantages
and drawbacks, a compromise approach accommodating both views appears to be practical.
In this approach we do not lose sight of the overall big picture for the entire enterprise. We
base our planning on this overall big picture. This aspect is from the top-down approach.
Then we adopt the principles of the bottom-up approach and build the conformed data
marts based on a priority scheme. The steps in this practical approach are as follows:
1. Plan and define requirements at the overall corporate level
2. Create a surrounding architecture for a complete warehouse
3. Conform and standardize the data content
4. Implement the data warehouse as a series of supermarts, one at a time
In this practical approach, you go to the basics and determine what exactly your organiz-
ation wants in the long term. The key to this approach is that you first plan at the enterprise
level. You gather requirements at the overall level. You establish the architecture for the
complete warehouse. Then you determine the data content for each supermart. Supermarts
DATA WAREHOUSES AND DATA MARTS 31
63.
are carefully architecteddata marts. You implement these supermarts, one at a time. Before
implementation, you make sure that the data content among the various supermarts are con-
formed in terms of data types, field lengths, precision, and semantics. A certain data element
must mean the same thing in every supermart. This will avoid spread of disparate data across
several data marts.
A data mart, in this practical approach, is a logical subset of the complete data warehouse,
a sort of pie-wedge of the whole data warehouse. A data warehouse, therefore, is a conformed
union of all data marts. Individual data marts are targeted to particular business groups in the
enterprise, but the collection of all the data marts form an integrated whole, called the enter-
prise data warehouse.
When we refer to data warehouses and data marts in our discussions here, we use the
meanings as understood in this practical approach. For us, a data warehouse means a collec-
tion of the constituent data marts.
ARCHITECTURAL TYPES
We have now reviewed the basic definitions and features of data warehouses and data marts
and completed a significant discussion of them. We have established our position on what
the terms data warehouse and data mart mean to us. Now we are almost ready to examine
the individual components.
Over the years, in practice, several arrangements of data warehouses and data marts have
evolved based on the individual requirements of organizations. Before we proceed to study
the individual components within a data warehouse, let us briefly discuss the leading archi-
tectural types and note how individual data marts feature in these architectural types. For
each of these architectural types we will indicate how data is stored in the data warehouse
and the relationships between the data warehouse and the data marts. Figure 2-6 illustrates
each of these architectural types.
Centralized Data Warehouse
This architectural type takes into account the enterprise-level information requirements. An
overall infrastructure is established. Atomic level normalized data at the lowest level of gran-
ularity is stored in the third normal form. Occasionally, some summarized data is included.
Queries and applications access the normalized data in the central data warehouse. There are
no separate data marts.
Independent Data Marts
This architectural type evolves in companies where the organizational units develop
their own data marts for their own specific purposes. Although each data mart serves the par-
ticular organizational unit, these separate data marts do not provide “a single version of the
truth.” The data marts are independent of one another. As a result, these different data
marts are likely to have inconsistent data definitions and standards. Such variances hinder
analysis of data across data marts. For example, if there are two independent data marts,
one for sales and the other for shipments, although sales and shipments are related subjects,
the independent data marts would make it difficult to analyze sales and shipments data
together.
32 DATA WAREHOUSE: THE BUILDING BLOCKS
64.
Federated
Some companies getinto data warehousing with an existing legacy of an assortment of
decision-support structures in the form of operational systems, extracted datasets, primitive
data marts, and so on. For such companies, it may not be prudent to discard all that huge
investment and start from scratch. The practical solution is a federated architectural type
where data may be physically or logically integrated through shared key fields, overall
global metadata, distributed queries, and such other methods. In this architectural type,
there is no one overall data warehouse.
Hub-and-Spoke
This is the Inmon Corporate Information Factory approach. Similar to the centralized data
warehouse architecture, here too is an overall enterprise-wide data warehouse. Atomic
data in the third normal form is stored in the centralized data warehouse. The major and
useful difference is the presence of dependent data marts in this architectural type.
Dependent data marts obtain data from the centralized data warehouse. The centralized
data warehouse forms the hub to feed data to the data marts on the spokes. The dependent
data marts may be developed for a variety of purposes: departmental analytical needs,
specialized queries, data mining, and so on. Each dependent dart mart may have normalized,
denormalized, summarized, or dimensional data structures based on individual require-
ments. Most queries are directed to the dependent data marts although the centralized data
warehouse may itself be used for querying. This architectural type results from adopting a
top-down approach to data warehouse development.
Source Data Data Staging Data Storage Information Delivery
CENTRALIZED
INDEPENDENT
DATA MARTS
FEDERATED
HUB-AND-
SPOKE
DATA-MART
BUS
Figure 2-6 Data warehouse architectural types.
ARCHITECTURAL TYPES 33
65.
Data-Mart Bus
This isthe Kimbal conformed supermarts approach. You begin with analyzing requirements
for a specific business subject such as orders, shipments, billings, insurance claims, car ren-
tals, and so on. You build the first data mart (supermart) using business dimensions and
metrics. These business dimensions will be shared in the future data marts. The principal
notion is that by conforming dimensions among the various data marts, the result would
be logically integrated supermarts that will provide an enterprise view of the data. The
data marts contain atomic data organized as a dimensional data model. This architectural
type results from adopting an enhanced bottom-up approach to data warehouse development.
OVERVIEW OF THE COMPONENTS
Having reviewed a few typical ways of organizing data warehouses and data marts, we are
now ready to launch a general discussion of the components of the data warehouse.
When we build an operational system such as order entry, claims processing, or savings
account, we put together several components to make up the system. The front-end com-
ponent consists of the GUI (graphical user interface) to interface with the users for data
input. The data storage component includes the database management system, such as
Oracle, Informix, or Microsoft SQL Server. The display component is the set of screens
and reports for the users. The data interfaces and the network software form the connectivity
component. Depending on the information requirements and the framework of our organiz-
ation, we arrange these components in the most optimum way.
Architecture is the proper arrangement of the components. You build a data warehouse
with software and hardware components. To suit the requirements of your organization
you arrange these building blocks in a certain way for maximum benefit. You may want
to lay special emphasis on one component; you may want to bolster up another component
with extra tools and services. All of this depends on your circumstances.
Figure 2-7 shows the basic components of a typical warehouse. You see the Source Data
component shown on the left. The Data Staging component serves as the next building
block. In the middle, you see the Data Storage component that manages the data warehouse
data. This component not only stores and manages the data, it also keeps track of the data by
means of the metadata repository. The Information Delivery component shown on the right
consists of all the different ways of making the information from the data warehouse avail-
able to the users.
Whether you build a data warehouse for a large manufacturing company on the Fortune
500 list, a leading grocery chain with stores all over the country, or a global banking insti-
tution, the basic components are the same. Each data warehouse is put together with the same
building blocks. The essential difference for each organization is in the way these building
blocks are arranged. The variation is in the manner in which some of the blocks are made
stronger than others in the architecture.
We will now take a closer look at each of the components. At this stage, we want to know
what the components are and how each fits into the architecture. We also want to review
specific issues relating to each particular component.
Source Data Component
Source data coming into the data warehouse may be grouped into four broad categories, as
discussed here.
34 DATA WAREHOUSE: THE BUILDING BLOCKS
66.
Production Data Thiscategory of data comes from the various operational systems of
the enterprise. These normally include financial systems, manufacturing systems, systems
along the supply chain, and customer relationship management systems. Based on the infor-
mation requirements in the data warehouse, you choose segments of data from the different
operational systems. While dealing with this data, you come across many variations in the
data formats. You also notice that the data resides on different hardware platforms. Further,
the data is supported by different database systems and operating systems. This is data
from many vertical applications.
In operational systems, information queries are narrow. You query an operational system
for information about specific instances of business objects. You may want just the name
and address of a single customer. Or, you may need the orders placed by a single customer
in a single week. Or, you may just need to look at a single invoice and the items billed on
that single invoice. In operational systems, you do not have broad queries. You do not query
the operational system in unexpected ways. The queries are all predictable. Again, you do
not expect a particular query to run across different operational systems. What does all of
thismean?Simplythis:thereisnoconformanceofdataamongthevariousoperationalsystems
of an enterprise. A term like an account may have different meanings in different systems.
The significant and disturbing characteristic of production data is disparity. Your great
challenge is to standardize and transform the disparate data from the various production sys-
tems, convert the data, and integrate the pieces into useful data for storage in the data ware-
house. It is really the integration of these various sources that provide the value to the data in
the data warehouse.
Internal Data In every organization, users keep their “private” spreadsheets, documents,
customer profiles, and sometimes even departmental databases. This is the internal data,
parts of which could be useful in a data warehouse.
Architecture is the proper arrangement of the components.
Data Warehouse
DBMS
Data Marts
Multi-
dimensional
DBs
External
Production
Report/Query
OLAP
Data Mining
Source Data
Internal
Archived
Data Staging
Data Storage
Metadata
Management & Control
Information Delivery
Figure 2-7 Data warehouse: building blocks or components.
OVERVIEW OF THE COMPONENTS 35
67.
If your organizationdoes business with customers on a one-to-one basis and the con-
tribution of each customer to the bottom line is significant, then detailed customer profiles
with ample demographics are important in a data warehouse. Profiles of individual custo-
mers become very important for consideration. When your account representatives talk to
their assigned customers or when your marketing department wants to make specific offer-
ings to individual customers, you need the details. Although much of this data may be
extracted from production systems, a lot of it is held by individuals and departments in
their private files.
You cannot ignore the internal data held in private files in your organization. It is a col-
lective judgment call on how much of the internal data should be included in the data ware-
house. The IT department must work with the user departments to gather the internal data.
Internal data adds additional complexity to the process of transforming and integrating
the data before it can be stored in the data warehouse. You have to determine strategies
for collecting data from spreadsheets, find ways of taking data from textual documents,
and tie into departmental databases to gather pertinent data from those sources. Again,
you may want to schedule the acquisition of internal data. Initially, you may want to limit
yourself to only some significant portions before going live with your first data mart.
Archived Data Operational systems are primarily intended to run the current business. In
every operational system, you periodically take the old data and store it in archived files. The
circumstances in your organization dictate how often and which portions of the operational
databases are archived for storage. Some data is archived after a year. Sometimes data is left
in the operational system databases for as long as five years. Much of the archived data comes
from old legacy systems that are nearing the end of their useful lives in organizations.
Many different methods of archiving exist. There are staged archival methods. At the first
stage, recent data is archived to a separate archival database that may still be online. At the
second stage, the older data is archived to flat files on disk storage. At the next stage, the
oldest data is archived to tape cartridges or microfilm and even kept off-site.
As mentioned earlier, a data warehouse keeps historical snapshots of data. You essentially
need historical data for analysis over time. For getting historical information, you look into
your archived data sets. Depending on your data warehouse requirements, you have to
include sufficient historical data. This type of data is useful for discerning patterns and ana-
lyzing trends.
External Data Most executives depend on data from external sources for a high percen-
tage of the information they use. They use statistics relating to their industry produced by
external agencies and national statistical offices. They use market share data of competitors.
They use standard values of financial indicators for their business to check on their
performance.
For example, the data warehouse of a car rental company contains data on the current pro-
duction schedules of the leading automobile manufacturers. This external data in the data
warehouse helps the car rental company plan for its fleet management.
The purposes served by such external data sources cannot be fulfilled by the data avail-
able within your organization itself. The insights gleaned from your production data and your
archived data are somewhat limited. They give you a picture based on what you are doing or
have done in the past. In order to spot industry trends and compare performance against other
organizations, you need data from external sources.
36 DATA WAREHOUSE: THE BUILDING BLOCKS
68.
Usually, data fromoutside sources do not conform to your formats. You have to devise
ways to convert data into your internal formats and data types. You have to organize the data
transmissions from the external sources. Some sources may provide information at regular,
stipulated intervals. Others may give you the data on request. You need to accommodate the
variations.
Data Staging Component
After you have extracted data from various operational systems and from external sources,
you have to prepare the data for storing in the data warehouse. The extracted data coming
from several disparate sources needs to be changed, converted, and made ready in a
format that is suitable to be stored for querying and analysis.
Three major functions need to be performed for getting the data ready. You have to extract
the data, transform the data, and then load the data into the data warehouse storage. These
three major functions of extraction, transformation, and preparation for loading take place
in a staging area. The data staging component consists of a workbench for these functions.
Data staging provides a place and an area with a set of functions to clean, change, combine,
convert, deduplicate, and prepare source data for storage and use in the data warehouse.
Why do you need a separate place or component to perform the data preparation? Can you
not move the data from the various sources into the data warehouse storage itself and then
prepare the data? When we implement an operational system, we are likely to pick up
data from different sources, move the data into the new operational system database, and
run data conversions. Why can’t this method work for a data warehouse? The essential
difference here is this: in a data warehouse you pull in data from many source operational
systems. Remember that data in a data warehouse is subject-oriented and cuts across oper-
ational applications. A separate staging area, therefore, is a necessity for preparing data
for the data warehouse. Occasionally, particularly with old legacy systems, you may need
a separate literal staging area. What you have in this literal staging area would be literal
copies of source system content but in a more convenient environment (such as an
ODBC accessible relational database). This literal staging area then acts as a surrogate for
the particular source systems.
Now that we have clarified the need for a separate data staging component, let us under-
stand what happens in data staging. We will now briefly discuss the three major functions
that take place in the staging area.
Data Extraction This function has to deal with numerous data sources. You have to
employ the appropriate technique for each data source. Source data may be from different
source machines in diverse data formats. Part of the source data may be in relational database
systems. Some data may be on other legacy network and hierarchical data models. Many data
sources may still be in flat files. You may want to include data from spreadsheets and local
departmental data sets. Data extraction may become quite complex.
Tools are available on the market for data extraction. You may want to consider using
outside tools suitable for certain data sources. For the other data sources, you may want to
develop in-house programs to do the data extraction. Purchasing outside tools may entail
high initial costs. In-house programs, on the other hand, may mean ongoing costs for devel-
opment and maintenance.
After you extract the data, where do you keep the data for further preparation? You may
perform the extraction function in the legacy platform itself if that approach suits your
OVERVIEW OF THE COMPONENTS 37
69.
framework. More frequently,data warehouse implementation teams extract the source into a
separate physical environment from which moving the data into the data warehouse would be
easier. In the separate environment, you may extract the source data into a group of flat files,
or a data-staging relational database, or a combination of both.
Data Transformation In every system implementation, data conversion is an important
function. For example, when you implement an operational system such as a magazine sub-
scription application, you have to initially populate your database with data from the prior
system records. You may be converting over from a manual system. Or, you may be
moving from a file-oriented system to a modern system supported with relational database
tables. In either case, you will convert the data from the prior systems. So, what is so different
for a data warehouse? How is data transformation for a data warehouse more involved than
for an operational system?
Again, as you know, data for a data warehouse comes from many disparate sources. If data
extraction for a data warehouse poses great challenges, data transformation presents even
greater challenges. Another factor in the data warehouse is that the data feed is not just an
initial load. You will have to continue to pick up the ongoing changes from the source sys-
tems. Any transformation tasks you set up for the initial load will be adapted for the ongoing
revisions as well.
You perform a number of individual tasks as part of data transformation. First, you clean
the data extracted from each source. Cleaning may just be correction of misspellings, or may
include resolution of conflicts between state codes and zip codes in the source data, or may
deal with providing default values for missing data elements, or elimination of duplicates
when you bring in the same data from multiple source systems.
Standardization of data elements forms a large part of data transformation. You standar-
dize the data types and field lengths for same data elements retrieved from the various
sources. Semantic standardization is another major task. You resolve synonyms and homo-
nyms. When two or more terms from different source systems mean the same thing, you
resolve the synonyms. When a single term means many different things in different
source systems, you resolve the homonym.
Data transformation involves many forms of combining pieces of data from the different
sources. You combine data from a single source record or related data elements from many
source records. On the other hand, data transformation also involves purging source data that
is not useful and separating out source records into new combinations. Sorting and merging
of data takes place on a large scale in the data staging area.
In many cases, the keys chosen for the operational systems are field values with built-in
meanings. For example, the product key value may be a combination of characters indicating
the product category, the code of the warehouse where the product is stored, and some code
to show the production batch. Primary keys in the data warehouse cannot have built-in mean-
ings. We will discuss this further in Chapter 10. Data transformation also includes the assign-
ment of surrogate keys derived from the source system primary keys.
A grocery chain point-of-sale operational system keeps the unit sales and revenue
amounts by individual transactions at the check-out counter at each store. But in the data
warehouse, it may not be necessary to keep the data at this detailed level. You may want
to summarize the totals by product at each store for a given day and keep the summary
totals of the sale units and revenue in the data warehouse storage. In such cases, the data
transformation function would include appropriate summarization.
38 DATA WAREHOUSE: THE BUILDING BLOCKS
70.
When the datatransformation function ends, you have a collection of integrated data that
is cleaned, standardized, and summarized. You now have data ready to load into each data set
in your data warehouse.
Data Loading Two distinct groups of tasks form the data loading function. When you
complete the design and construction of the data warehouse and go live for the first time,
you do the initial loading of the data into the data warehouse storage. The initial load
moves large volumes of data using up substantial amounts of time. As the data warehouse
starts functioning, you continue to extract the changes to the source data, transform the
data revisions, and feed the incremental data revisions on an ongoing basis. Figure 2-8 illus-
trates the common types of data movements from the staging area to the data warehouse
storage.
Data Storage Component
The data storage for the data warehouse is a separate repository. The operational systems of
your enterprise support the day-to-day operations. These are online transaction processing
applications. The data repositories for the operational systems typically contain only the cur-
rent data. Also, these data repositories contain the data structured in highly normalized for-
mats for fast and efficient processing. In contrast, in the data repository for a data warehouse,
you need to keep large volumes of historical data for analysis. Further, you have to keep the
data in the data warehouse in structures suitable for analysis, and not for quick retrieval of
individual pieces of information. Therefore, the data storage for the data warehouse is
kept separate from the data storage for operational systems.
In your databases supporting operational systems, the updates to data happen as trans-
actions occur. These transactions hit the databases in a random fashion. How and when
the transactions change the data in the databases is not completely within your control.
The data in the operational databases could change from moment to moment. When your
This function is time-consuming
Initial load moves very large volumes of data
The business conditions determine the refresh cycles
Base data load
Quarterly refresh
Monthly refresh
Yearly refresh
Daily refresh
Data
Sources
DATA
WAREHOUSE
Figure 2-8 Data movements to the data warehouse.
OVERVIEW OF THE COMPONENTS 39
71.
analysts use thedata in the data warehouse for analysis, they need to know that the data is
stable and that it represents snapshots at specified periods. As they are working with the
data, the data storage must not be in a state of continual updating. For this reason, the
data warehouses are “read-only” data repositories.
Generally, the database in your data warehouse must be open. Depending on your require-
ments, you are likely to use tools from multiple vendors. The data warehouse must be open to
different tools. Most of the data warehouses employ relational database management
systems.
Many data warehouses also employ multidimensional database management systems.
Data extracted from the data warehouse storage is aggregated in many ways and the summary
data is kept in the multidimensional databases (MDDBs). Such multidimensional database
systems are usually proprietary products.
Information Delivery Component
Who are the users that need information from the data warehouse? The range is fairly com-
prehensive. The novice user comes to the data warehouse with no training and, therefore,
needs prefabricated reports and preset queries. The casual user needs information once in
a while, not regularly. This type of user also needs prepackaged information. The business
analyst looks for ability to do complex analysis using the information in the data warehouse.
The power user wants to be able to navigate throughout the data warehouse, pick up inter-
esting data, format his or her own queries, drill through the data layers, and create custom
reports and ad hoc queries.
In order to provide information to the wide community of data warehouse users, the infor-
mation delivery component includes different methods of information delivery. Figure 2-9
shows the different information delivery methods. Ad hoc reports are predefined reports pri-
marily meant for novice and casual users. Provision for complex queries, multidimensional
(MD) analysis, and statistical analysis cater to the needs of the business analysts and power
users. Information fed into executive information systems (EIS) is meant for senior
Data
Warehouse
Data Marts
Ad hoc reports
EIS feed
Statistical Analysis
MD Analysis
Complex queries
Online
Intranet
Internet
E-Mail
Data Mining
Information
Delivery
Component
Figure 2-9 Information delivery component.
40 DATA WAREHOUSE: THE BUILDING BLOCKS
72.
executives and high-levelmanagers. Some data warehouses also provide data to data-mining
applications. Data-mining applications are knowledge discovery systems where the mining
algorithms help you discover trends and patterns from the usage of your data.
In your data warehouse, you may include several information delivery mechanisms. Most
commonly, you provide for online queries and reports. The users will enter their requests
online and will receive the results online. You may set up delivery of scheduled reports
through e-mail or you may make adequate use of your organization’s intranet for information
delivery. Recently, information delivery over the Internet has been gaining ground.
Metadata Component
Metadata in a data warehouse is similar to the data dictionary or the data catalog in a database
management system. In the data dictionary, you keep the information about the logical data
structures, the information about the files and addresses, the information about the indexes,
and so on. The data dictionary contains data about the data in the database.
Similarly, the metadata component is the data about the data in the data warehouse. This
definition is a commonly used definition. We need to elaborate on this definition. Metadata
in a data warehouse is similar to a data dictionary, but much more than a data dictionary.
Later, in a separate section in this chapter, we will devote more time to the discussion of
metadata. Here, for the sake of completeness, we just want to list metadata as one of the
components of the data warehouse architecture.
Management and Control Component
This component of the data warehouse architecture sits on top of all the other components.
The management and control component coordinates the services and activities within the
data warehouse. This component controls the data transformation and the data transfer
into the data warehouse storage. On the other hand, it moderates the information delivery
to the users. It works with the database management systems and enables data to be properly
stored in the repositories. It monitors the movement of data into the staging area and from
there into the data warehouse storage itself.
The management and control component interacts with the metadata component to
perform the management and control functions. As the metadata component contains infor-
mation about the data warehouse itself, the metadata is the source of information for the
management module.
METADATA IN THE DATA WAREHOUSE
Think of metadata as the Yellow Pagesw
of your town. Do you need information about the
stores in your town, where they are, what their names are, and what products they specialize
in? Go to the Yellow Pages. The Yellow Pages is a directory with data about the institutions
in your town. Almost in the same manner, the metadata component serves as a directory of
the contents of your data warehouse.
Because of the importance of metadata in a data warehouse, we have set apart all of
Chapter 9 for this topic. At this stage, we just want to get an introduction to the topic and
highlight that metadata is a key architectural component of the data warehouse.
METADATA IN THE DATA WAREHOUSE 41
73.
Types of Metadata
Metadatain a data warehouse fall into three major categories:
† Operational metadata
† Extraction and transformation metadata
† End-user metadata
Operational Metadata As you know, data for the data warehouse comes from several
operational systems of the enterprise. These source systems contain different data structures.
The data elements selected for the data warehouse have various field lengths and data types.
In selecting data from the source systems for the data warehouse, you split records, combine
parts of records from different source files, and deal with multiple coding schemes and field
lengths. When you deliver information to the end-users, you must be able to tie that back to
the original source data sets. Operational metadata contain all of this information about the
operational data sources.
Extraction and Transformation Metadata Extraction and transformation metadata
contain data about the extraction of data from the source systems, namely, the extraction fre-
quencies, extraction methods, and business rules for the data extraction. Also, this category
of metadata contains information about all the data transformations that take place in the data
staging area.
End-User Metadata The end-user metadata is the navigational map of the data ware-
house. It enables the end-users to find information from the data warehouse. The end-user
metadata allows the end-users to use their own business terminology and look for infor-
mation in those ways in which they normally think of the business.
Special Significance
Why is metadata especially important in a data warehouse?
† First, it acts as the glue that connects all parts of the data warehouse.
† Next, it provides information about the contents and structures to the developers.
† Finally, it opens the door to the end-users and makes the contents recognizable in their
own terms.
CHAPTER SUMMARY
† Defining features of the data warehouse are: separate, subject-oriented, integrated,
time-variant, and nonvolatile.
† You may use a top-down approach and build a large, comprehensive, enterprise data
warehouse, or you may use a bottom-up approach and build small, independent,
42 DATA WAREHOUSE: THE BUILDING BLOCKS
74.
departmental data marts.In spite of some advantages, both approaches have serious
shortcomings.
† A viable practical approach is to build conformed data marts, which together form the
corporate data warehouse.
† Data warehouse building blocks or components are source data, data staging, data
storage, information delivery, metadata, and management and control.
† In a data warehouse, metadata is especially significant because it acts as the glue
holding all the components together and serves as a roadmap for the end-users.
REVIEW QUESTIONS
1. Name at least six characteristics or features of a data warehouse.
2. Why is data integration required in a data warehouse, more so than in an operational
application?
3. Every data structure in the data warehouse contains the time element. Why?
4. Explain data granularity and how it is applicable to the data warehouse.
5. How are the top-down and bottom-up approaches for building a data warehouse differ-
ent? List the major types of architectures and highlight the features of any two of these.
6. What are the various data sources for the data warehouse?
7. Why do you need a separate data staging component?
8. Under data transformation, list five different functions you can think of.
9. Name any six different methods for information delivery.
10. What are the three major types of metadata in a data warehouse? Briefly mention the
purpose of each type.
EXERCISES
1. Match the columns:
1. nonvolatile data
2. dual data granularity
3. dependent data mart
4. disparate data
5. decision support
6. data staging
7. data mining
8. metadata
9. operational systems
10. internal data
A. roadmap for users
B. subject-oriented
C. knowledge discovery
D. private spreadsheets
E. application flavor
F. because of multiple sources
G. details and summary
H. read-only
I. workbench for data integration
J. data from main data warehouse
EXERCISES 43
75.
2. A datawarehouse is subject-oriented. What would be the major critical business subjects
for the following companies?
a. an international manufacturing company
b. a local community bank
c. a domestic hotel chain
3. You are the data analyst on the project team building a data warehouse for an insurance
company. List the possible data sources from which you will bring the data into your data
warehouse. State your assumptions.
4. For an airlines company, identify three operational applications that would feed into the
data warehouse. What would be the data load and refresh cycles?
5. Prepare a table showing all the potential users and information delivery methods for a data
warehouse supporting a large national grocery chain.
44 DATA WAREHOUSE: THE BUILDING BLOCKS
76.
CHAPTER 3
TRENDS INDATA WAREHOUSING
CHAPTER OBJECTIVES
† Review the continued growth in data warehousing
† Learn how data warehousing has become mainstream
† Discuss several major trends, one by one
† Grasp the need for standards and review the progress
† Understand Web-enabled data warehouse
In the previous chapters, we have seen why business intelligence along with the underlying
data warehouses is essential for enterprises of all sizes in all industries. We have reviewed
how businesses are reaping major benefits from data warehousing. We have also discussed
the building blocks of a data warehouse. You now have a fairly good idea of the features and
functions of the basic components and a reasonable definition of data warehousing. You
have understood that it is a fundamentally simple concept; at the same time, you know it
is also a blend of many technologies. Several business and technological drivers have
moved data warehousing forward in the past few years.
Before we proceed further, we are at the point where we want to ask some relevant ques-
tions. What is the current scenario and state of the market? What businesses have adopted
data warehousing? What are the technological advances? In short, what are the significant
trends?
Are you wondering if it is too early in our discussion of the subject to talk about trends?
The usual practice is to include a chapter on future trends towards the end, almost as an after-
thought. The reader typically glosses over the discussion on future trends. This chapter is not
so much like looking into the crystal ball for possible future happenings; we want to deal
with the important trends that are happening now.
Data Warehousing Fundamentals for IT Professionals, Second Edition. By Paulraj Ponniah
Copyright # 2010 John Wiley & Sons, Inc.
45
77.
It is importantfor you to keep the knowledge about current trends as a backdrop in your
mind as you continue the in-depth study of the subject. When you gather the informational
requirements for your data warehouse, you need to be aware of current trends. When you get
into the design phase, you need to be cognizant of the trends. When you implement your data
warehouse, you need to ensure that your data warehouse is in line with the trends. Knowledge
of trends is important and necessary even at a fairly early stage of your study.
In this chapter, we will touch upon most of the major trends. You will understand how and
why data warehousing continues to grow and become more and more pervasive. We will dis-
cuss trends in vendor solutions and products. We will relate data warehousing with other
technological phenomena such as the Internet and the World Wide Web. Wherever more
detailed discussions are necessary, we will revisit some of the trends in later chapters.
CONTINUED GROWTH IN DATA WAREHOUSING
Data warehousing is no longer a purely novel idea for study and experimentation. It has
become mainstream. True, the data warehouse is not in every dentist’s office yet, but neither
is it confined only to high-end businesses. More than half of all U.S. companies have made a
commitment to data warehousing. About 90% of multinational companies have data ware-
houses or are planning to implement data warehouses in the next few months.
In every industry across the board, from retail chain stores to financial institutions, from
manufacturing enterprises to government departments, from airline companies to pharma-
ceuticals, data warehousing has revolutionized the way people perform business analysis
and make strategic decisions. Every company that has a data warehouse continues to realize
enormous benefits that get translated into positive results at the bottom line. Many of these
companies, incorporating Web-based technologies, have enhanced the potential for greater
and easier delivery of vital information.
Even during the first few years of data warehousing in the late 1990s, hundreds of vendors
had flooded the market with numerous products. Vendor solutions and products run the
gamut of data warehousing: data modeling, data acquisition, data quality, data analysis,
metadata, and so on. A buyer’s guide published by the Data Warehousing Institute at that
time featured no fewer than 105 leading products. The market is huge and continues to
grow in revenue dollars.
Data Warehousing has Become Mainstream
In the early stages, four significant factors drove many companies to move into data
warehousing:
† Fierce competition
† Government deregulation
† Need to revamp internal processes
† Imperative for customized marketing
Telecommunications, banking, and retail were the first industries to adopt data ware-
housing. That was largely because of government deregulation in telecommunications
and banking. Retail businesses moved into data warehousing because of fiercer competition.
Utility companies joined the group as that sector was deregulated. The next wave of
46 TRENDS IN DATA WAREHOUSING
78.
businesses to getinto data warehousing consisted of companies in financial services, health
care, insurance, manufacturing, pharmaceuticals, transportation, and distribution.
Today, telecommunications and financial services continue to lead in data warehouse
spending. As much as 15% of technology budgets in these industries is spent on data ware-
housing. Companies in these industries collect large volumes of transaction data. Data ware-
housing is able to transform such large volumes of data into strategic information useful for
decision making.
At present, data warehouses exist in every conceivable industry. Figure 3-1 lists the indus-
tries in the order of the average salaries paid to data warehousing professionals. In 2008,
pharmaceuticals was at the top of the list, with the highest average salary.
In the early stages of data warehousing, it was, for the most part, used exclusively by
global corporations. It was expensive to build a data warehouse and the tools were not
quite adequate. Only large companies had the resources to spend on the new paradigm.
Now we have begun to see a strong presence of data warehousing in medium-sized and
smaller companies, which are now able to afford the cost of building data warehouses or
buying turnkey data marts. Take a look at the database management systems (DBMSs) you
have been using in the past. You will find that the database vendors have now added features
to assist you in building data warehouses using these DBMSs. Packaged solutions have also
become less expensive and operating systems robust enough to support data warehousing
functions.
Data Warehouse Expansion
Although earlier data warehouses concentrated on keeping summary data for high-level
analysis, we now see larger and larger data warehouses being built by different businesses.
Now companies have the ability to capture, cleanse, maintain, and use the vast amounts of
data generated by their business transactions. The quantities of data kept in data warehouses
continue to swell to the terabyte range. Data warehouses storing several terabytes of data are
not uncommon in retail and telecommunications.
For example, take the telecommunications industry. A telecommunications company
generates hundreds of millions of call-detail transactions in a year. For promoting the
Manufacturing (non-computer)
Telecommunications
Healthcare
Retail/wholesale/distribution
Insurance
Education
Government (state/local)
117
112
107
105
105
103
103
Pharmaceuticals
Consulting/professional
Software/Internet
Government (federal)
Financial Services
Media/entertainment/publishing
Computer manufacturing
100
98
98
92
90
85
82
Source: 2008 Data Warehousing Salary Survey by the Data Warehousing Institute
Annual average salary in $ 000
Figure 3-1 Industries using data warehousing.
CONTINUED GROWTH IN DATA WAREHOUSING 47
79.
proper products andservices, the company needs to analyze these detailed transactions. The
data warehouse for the company has to store data at the lowest level of detail.
Similarly, consider a retail chain with hundreds of stores. Every day, each store generates
many thousands of point-of-sale transactions. Again, another example is a company in the
pharmaceutical industry that processes thousands of tests and measurements for getting
product approvals from the government. Data warehouses in these industries tend to be
very large.
Finally, let us look at the potential size of a typical Medicaid fraud control unit of a large
state. This organization is exclusively responsible for investigating and prosecuting health
care fraud arising out of billions of dollars spent on Medicaid in that state. The unit also
has to prosecute cases of patient abuse in nursing homes and monitor fraudulent billing prac-
tices by physicians, pharmacists, and other health care providers and vendors. Usually there
are several regional offices. A fraud scheme detected in one region must be checked against
all other regions. Can you imagine the size of the data warehouse needed to support such a
fraud control unit? There could be many terabytes of data.
Vendor Solutions and Products
As an information technology professional, you are familiar with database vendors and data-
base products. In the same way, you are familiar with most of the operating systems and their
vendors. How many leading database vendors are there? How many leading vendors of oper-
ating systems are there? A handful? The number of database and operating system vendors
pales in comparison with data warehousing products and vendors. There are hundreds of data
warehousing vendors and thousands of data warehousing products and solutions.
In the beginning, the market was filled with confusion and vendor hype. Every vendor,
small or big, that had any product remotely connected to data warehousing jumped on the
bandwagon. Data warehousing meant what each vendor defined it to be. Each company posi-
tioned its own products as the proper set of data warehousing tools. Data warehousing was a
new concept for many of the businesses that adopted it. These businesses were at the mercy
of the marketing hype of the vendors.
Over the past decade, the situation has improved tremendously. The market is reaching
maturity, to the extent of producing off-the-shelf packages and becoming increasingly
stable. Figure 3-2 shows the current state of the data warehousing market as compared to
how the market was in the beginning stages.
What do we normally see in any maturing market? We expect to find a process of con-
solidation. And that is exactly what is taking place in the data warehousing market. Data
warehousing vendors are merging to form stronger and more viable companies. Some
major players in the industry are extending the range of their solutions by acquisition of
other companies. Some vendors are positioning suites of products, their own or ones from
groups of other vendors, piecing them together as integrated data warehousing solutions.
Now the traditional database companies are also in the data warehousing market. They
have begun to offer data warehousing solutions built around their database products. On
the one hand, data extraction and transformation tools are packaged with the database
management system. On the other hand, inquiry and reporting tools are enhanced for data
warehousing. Some database vendors take the enhancement further by offering sophisti-
cated products such as data mining tools.
With so many vendors and products, how can we classify the vendors and products, and
thereby make sense of the market? It is best to separate the market broadly into two distinct
48 TRENDS IN DATA WAREHOUSING
80.
Vendor
hype
Proliferation
of tools
Confusing
definitions
Lack of
standards
Vendor
consolidations
Product
Sophistication
New
Technologies
(OLAP,etc.)
Web-
enabled
solutions
DW market in beginning stages
(state of flux)
DW market currently
(more mature and stable)
Vendor/
Product
Specialization
Open
Source
BI/DW
Adminitrative
Tools
Infrastructure
Tools
Figure 3-2 Status of the data warehousing market.
Source: The Data Warehousing Institute
Administration & Operations: System/network administration, backup/restore, disaster recovery,
performance/usage management, capacity planning, security, database management
Analytics: Business Activity Monitoring, Query/Reporting, OLAP, Forecasting, Data Mining,
Dashboards/Scorecards, Visualization, Text Analysis, Analytic Application Development
BI Services: Analytic Service Providers (ASP), BI Software, Consultants, Systems Integrators,
Industry Associations/Consortia, Research
Data Integration: Business Process Management, Data Profiling/Cleaning/Conversion/Movement,
Data Mapping/Transformation, Master Data Management, Metadata Management
DW Design: Data Analysis, Data Modeling (Dimensional Modeling/Entity-Relationship Modeling),
Data Warehousing Toolset
Information Delivery: Broadcasting, Collaboration, Content Management, Document
Management, Enterprise Information Portals, Wireless Data Analysis
Infrastructure: Data Accelerators, Data Warehouse Appliances, Database Management Systems,
Multidimensional Databases, Servers, Storage Management Systems
Open Source BI/DW: Business Intelligence, Data Integration, Databases, Consultants, Systems
Integrators
Figure 3-3 Categories of products and services.
CONTINUED GROWTH IN DATA WAREHOUSING 49
81.
groups. The firstgroup consists of data warehouse vendors and products catering to the needs
of corporate data warehouses in which all enterprise data is integrated and transformed. This
segment has been referred to as the market for strategic data warehouses. This segment
accounts for about a quarter of the total market. The second segment is more loose and dis-
persed, consisting of departmental data marts, fragmented database marketing systems, and a
wide range of decision support systems. Specific vendors and products dominate each
segment.
We may also look at the list of products in another way. Figure 3-3 shows a list of the types
of data warehouse and business intelligence products and services, categorized based on the
features and functions they perform.
SIGNIFICANT TRENDS
Some experts feel that, until now, technology has been driving data warehousing. These
experts declare that we are now beginning to see important progress in software. In the
next few years, data warehousing is expected make big strides in software, especially for
optimizing queries, indexing very large tables, enhancing SQL, improving data com-
pression, and expanding dimensional modeling.
Let us separate out the significant trends and discuss each briefly. Be prepared to visit
each trend, one by one—each has a serious impact on data warehousing. As we walk through
each trend, try to grasp its significance and be sure that you perceive its relevance to your
company’s data warehouse. Be prepared to answer the question: What must you do to
take advantage of the trend in your data warehouse?
Real-Time Data Warehousing
Business intelligence systems and the supporting data warehouses have been used mainly for
strategic decision making. The data warehouse was kept separate from operational systems.
Recently industry momentum is swinging towards using business intelligence for tactical
decision making for day-to-day business operations. Data warehousing is progressing
rapidly to the point that real-time data warehousing is the focus of senior executives.
Traditional data warehousing is passive, providing historical trends, whereas real-time
data warehousing is dynamic, providing the most up-to-date view of the business in real
time. A real-time data warehouse gets refreshed continuously, with almost zero latency.
Real-time information delivery increases productivity tremendously by sharing infor-
mation with more people. Companies are, therefore, coming under a lot of pressure to
provide information, in real time, to everyone connected to critical business processes.
However, extraction, transformation, and integration of data for real-time data warehousing
have several challenges. We will discuss these in detail in a later chapter.
Multiple Data Types
When you build the first iteration of your data warehouse, you may include just numeric
data. But soon you will realize that including structured numeric data alone is not enough.
Be prepared to consider other data types as well.
Traditionally, companies included structured data, mostly numeric, in their data
warehouses. From this point of view, decision support systems were divided into two
50 TRENDS IN DATA WAREHOUSING
82.
camps: data warehousingdealt with structured data, knowledge management involved
unstructured data. This distinction is being blurred. For example, most marketing data con-
sists of structured data in the form of numeric values. Marketing data also contains unstruc-
tured data in the form of images. Let us say a decision maker is performing an analysis to find
the top-selling product types. The decision maker arrives at a specific product type in the
course of the analysis. He or she would now like to see images of the products in that
type to make further decisions. How can this be made possible? Companies are realizing
there is a need to integrate both structured and unstructured data in their data warehouses.
What are the types of data we call unstructured data? Figure 3-4 shows the different types
of data that need to be integrated in the data warehouse to support decision making more
effectively.
Let us now turn to the progress made in the industry for including some of the types of
unstructured data. You will gain an understanding of what must be done to include these data
types in your data warehouse.
Adding Unstructured Data Some vendors are addressing the inclusion of unstruc-
tured data, especially text and images, by treating such multimedia data as just another
data type. These are defined as part of the relational data and stored as binary large objects
(BLOBs) up to 2 GB in size. User-defined functions (UDFs) are used to define these as user-
defined types (UDTs).
Not all BLOBs can be stored simply as another relational data type. For example, a video
clip would require a server supporting delivery of multiple streams of video at a given rate
and synchronization with the audio portion. For this purpose, specialized servers are being
provided.
1234567
8901234
5678901
2345678
9012345
abcdefg
hijklmno
pqrstuv
wxyzabc
defghijk
unstructured
Data Warehouse
Repository
Structured Numeric
Structured Text
Unstructured Document
Image Spatial
Video
Audio
Figure 3-4 Multiple data types in a data warehouse.
SIGNIFICANT TRENDS 51
83.
Searching Unstructured DataYou have enhanced your data warehouse by adding
unstructured data. Is there anything else you need to do? Of course, without the ability to
search unstructured data, integration of such data is of little value. Vendors are now provid-
ing new search engines to find the information the user needs from unstructured data. Query
by image content is an example of a search mechanism for images. The product allows you to
preindex images based on shapes, colors, and textures. When more than one image fits the
search argument, the selected images are displayed one after the other.
For free-form text data, retrieval engines preindex the textual documents to allow searches
by words, character strings, phrases, wild cards, proximity operators, and Boolean operators.
Some engines are powerful enough to substitute corresponding words and search. A search
with a word mouse will also retrieve documents containing the word mice.
Searching audio and video data directly is still in the research stage. Usually, these are
described with free-form text, and then searched using textual search methods that are cur-
rently available.
Spatial Data Consider one of your important users, maybe the marketing director, being
online and performing an analysis using your data warehouse. The marketing director runs a
query: show me the sales for the first two quarters for all products compared to last year in
store XYZ. After reviewing the results, he or she thinks of two other questions. What is the
average income of people living in the neighborhood of that store? What is the average driv-
ing distance for those people to come to the store? These questions may be answered only if
you include spatial data in your data warehouse.
Adding spatial data will greatly enhance the value of your data warehouse. Address, street
block, city quadrant, county, state, and zone are examples of spatial data. Vendors have begun
to addressthe need to include spatial data. Some database vendors are providing spatial exten-
ders to their products using SQL extensions to bring spatial and business data together.
Data Visualization
When a user queries your data warehouse and expects to see results only in the form of output
lists or spreadsheets, your data warehouse is already outdated. You need to display results in
the form of graphics and charts as well. Every user now expects to see the results of a query
shown as charts. Visualization of data in the result sets boosts the process of analysis for the
user, especially when the user is looking for trends over time. Data visualization helps the
user to interpret query results quickly and easily.
Major Visualization Trends In the last few years, three major trends have shaped the
direction of data visualization software.
More Chart Types. Most data visualizations are in the form of some standard chart type.
The numerical results are converted into a pie chart, a scatter plot, or another chart
type. Now the list of chart types supported by data visualization software has grown
much longer.
Interactive Visualization. Visualizations are no longer static. Dynamic chart types are
themselves user interfaces. Your users can review a result chart, manipulate it, and
then see newer views online.
Visualization of Complex and Large Result Sets. Your users can view a simple series of
numeric result points as a rudimentary pie or bar chart. But newer visualization soft-
ware can visualize thousands of result points and complex data structures.
52 TRENDS IN DATA WAREHOUSING
84.
Figure 3-5 summarizesthese major trends. See how the technologies are maturing,
evolving, and emerging.
Visualization Types Visualization software now supports a large array of chart types.
Gone are the days of simple line graphs. The current needs of users vary enormously.
Business users demand pie and bar charts. Technical and scientific users need scatter
plots and constellation graphs. Analysts looking at spatial data need maps and other three-
dimensional representations. In the last few years, major trends have shaped the direction
of data visualization software.
Advanced Visualization Techniques The most remarkable advance in visualization
techniques is the transition from static charts to dynamic interactive presentations.
Chart Manipulation. A user can rotate a chart or dynamically change the chart type to get
a clearer view of the results. With complex visualization types such as constellation
and scatter plots, a user can select data points with a mouse and then move the
points around to clarify the view.
Drill Down. The visualization first presents the results at the summary level. The user can
then drill down the visualization to display further visualizations at subsequent levels
of detail.
Advanced Interaction. These techniques provide a minimally invasive user interface. The
user simply double clicks a part of the visualization and then drags and drops represen-
tations of data entities. Or the user simply right clicks and chooses options from a menu.
Visual query is the most advanced of user interaction features. For example, the user
may see the outlying data points in a scatter plot, then select a few of them with the
mouse and ask for a brand new visualization of just those selected points. The data
visualization software generates the appropriate query from the selection, submits
the query to the database, and then displays the results in another representation.
Small data sets to large, complex structures
Static
to
Dynamic
Visualiza
tion
Drill
Down
Printed
Reports
Basic
Interaction
Online
Displays
Advanced
Interaction
Visual
Query
M
ATURING
EVOLVING
EMERGING
Enterprise
Charting
Systems
Basic
Charting
Embedded
Charting
Presentation
Graphics
Scientific
Chart Types
Multiple Link
Charts
Massive
Data Sets
Simple
Numeric
Series
Realtime
Data Feed
Multidimensional
Data Series
Unstructured
Text Data
Neural Data
Figure 3-5 Data visualization trends.
SIGNIFICANT TRENDS 53
85.
Dashboards and ScorecardsWithin the past few years many companies have
adopted dashboards and scorecards as their preferred method of viewing performance infor-
mation. In a certain sense, these means of obtaining information represent the culmination of
business intelligence. Executives and managers, who need to monitor performance metrics,
like digital dashboards that allow them to visualize the metrics as in speedometers, ther-
mometers, or traffic lights. A dashboard informs users about what is happening; a scorecard
informs users how well it is happening.
Dashboards monitor and measure processes. A dashboard provides real-time information
like the dashboard in an automobile, enabling drivers to check current speed, engine temp-
erature, fluid level, and so on. Dashboards are linked directly to real-time systems that cap-
ture events as they happen. Dashboards warn users with alerts or exception conditions.
Industry vendors have improved dashboards to a very large extent and made them interactive
and comprehensive.
Scorecards track progress compared to objectives. A scorecard displays periodic snap-
shots of performance viewed against an organization’s strategic objectives and targets.
Users select key performance indicators and have the progress displayed on the scorecards.
Parallel Processing
You know that the data warehouse is a user-centric and query-intensive environment. Your
users will constantly be executing complex queries to perform all types of analyses. Each
query would need to read large volumes of data to produce result sets. Analysis, usually per-
formed interactively, requires the execution of several queries, one after the other, by each
user. If the data warehouse is not tuned properly for handling large, complex, simultaneous
queries efficiently, the value of the data warehouse will be lost. Performance is of primary
importance.
The other functions for which performance is crucial are the functions of loading data and
creating indexes. Because of large volumes, loading of data can be slow. Indexing in a data
warehouse is usually elaborate because of the need to access the data in many different ways.
Because of large numbers of indexes, index creation can also be slow.
How do you speed up query processing, data loading, and index creation? A very effec-
tive way to do this is to use parallel processing. Both hardware configurations and software
techniques go hand in hand to accomplish parallel processing. A task is divided into smaller
units and these smaller units are executed concurrently.
Parallel Processing Hardware Options In a parallel processing environment, you
will find these characteristics: multiple CPUs, memory modules, one or more server
nodes, and high-speed communication links between interconnected nodes.
Essentially, you can choose from three architectural options. Figure 3-6 indicates the three
options and their comparative merits. Note the advantages and disadvantages so that you
may choose the proper option for your data warehouse.
Parallel Processing Software Implementation You may choose the appropriate
parallel processing hardware configuration for your data warehouse. Hardware alone
would be worthless if the operating system and the database software cannot make use of
the parallel features of the hardware. You will have to ensure that the software can allocate
units of a larger task to the hardware components appropriately.
54 TRENDS IN DATA WAREHOUSING
86.
Parallel processing softwaremust be capable of performing the following steps:
† Analyzing a large task to identify independent units that can be executed in parallel
† Identifying which of the smaller units must be executed one after the other
† Executing the independent units in parallel and the dependent units in the proper
sequence
† Collecting, collating, and consolidating the results returned by the smaller units
Database vendors usually provide two options for parallel processing: parallel server
option and parallel query option. You may purchase each option separately. Depending
on the provisions made by the database vendors, these options may be used with one or
more of the parallel hardware configurations.
The parallel server option allows each hardware node to have its own separate database
instance, and enables all database instances to access a common set of underlying database
files. The parallel query option supports key operations such as query processing, data load-
ing, and index creation.
Implementing a data warehouse without parallel processing options is almost unthinkable
in the current state of the technology. In summary, you will realize the following significant
advantages when you adopt parallel processing in your data warehouse:
† Performance improvement for query processing, data loading, and index creation
† Scalability, allowing the addition of CPUs and memory modules without changes to
the existing application
CPU CPU CPU CPU CPU
CPU CPU CPU CPU CPU CPU
CPU CPU
Shared Memory
Shared Disks
Common Bus
Shared Disks
Shared
Memory
Common High Speed Bus Node
Shared
Memory
MEM MEM MEM
Disk Disk Disk
CLUSTER
MPP
SMP
Node
Figure 3-6 Hardware options for parallel processing.
SIGNIFICANT TRENDS 55
87.
† Fault toleranceso that the database is available even when some of the parallel
processors fail
† A single logical view of the database even though the data may reside on the disks
of multiple nodes
Data Warehouse Appliances
In the previous section we discussed how adoption of parallel processing has become a
necessity in a data warehouse environment. More recently companies are realizing that
fully adopting business intelligence could make or break the business. Vast quantities
need to be retrieved for the decision-making process. Timeliness and depth of analysis
have become crucial. Terabyte-sized data warehouses have become common.
Until recently vendors and users have handled this rapid growth in database size and com-
plexity in analysis with very expensive and constant upgrading of hardware and software.
Now it is becoming clearer that existing infrastructures are unable to handle the continued
growth. The objective is to find a new approach to data warehousing infrastructure that is
flexible, expandable, and specifically applicable to an organization. The result is the
advent of data warehouse appliances.
The data warehouse appliance is designed specifically to take care of the workload of
business intelligence. It is built with hardware and software components specifically archi-
tected for this purpose. Through its architecture, a data warehouse appliance integrates hard-
ware, storage, and DBMS into one unified device. It combines the best elements of SMP and
MPP to enable queries to be processed in the most optimal manner. Appliances from most
vendors are designed to interface seamlessly with standardized applications and tools avail-
able on the business intelligence market.
A data warehouse appliance is quite scalable. Because all parts of the appliance, hardware
and software, come from the same vendor, it is designed to be homogeneous and reliable. For
the administrator, a data warehouse appliance provides simplicity because of its integrated
nature.
Data warehouse appliances are already supporting data warehouse and business intelli-
gence deployments at major corporations. This is especially true in telecommunications
and retail where data volumes are enormous and queries and analysis more complex and
demanding.
Query Tools
In a data warehouse, if there is one set of functional tools that is most significant, it is the set
of query tools. The success of your data warehouse depends on your query tools. Because of
this, data warehouse vendors have improved query tools during the past few years.
We will discuss query tools in greater detail in Chapter 14. At this stage, just note the
following functions for which vendors have greatly enhanced their query tools.
† Flexible presentation—Easy to use and able to present results online and in reports, in
many different formats.
† Aggregate awareness—Able to recognize the existence of summary or aggregate tables
and automatically route queries to the summary tables when summarized results are
desired.
† Crossing subject areas—Able to cross over from one subject data mart to another
automatically.
56 TRENDS IN DATA WAREHOUSING
88.
† Multiple heterogeneoussources—Capable of accessing heterogeneous data sources on
different platforms.
† Integration—Able to integrate query tools for online queries, batch reports, and data
extraction for analysis, and provide seamless interface to go from one type of output
to another.
† Overcoming SQL limitations—Able to provide SQL extensions to handle requests that
cannot usually be done through standard SQL.
Browser Tools
Here we are using the term “browser” in a generic sense, not limiting it to Web browsers.
Your users will be running queries against your data warehouse. They will be generating
reports from your data warehouse. They will be performing these functions directly and
not with the assistance of someone like you in IT. This is expected to be one of the major
advantages of the data warehouse approach.
If the users have to go to the data warehouse directly, they need to know what information
is available there. Users need good browser tools to browse through the informational meta-
data and search to locate the specific pieces of information they want to receive. Similarly,
when you are part of the IT team to develop your company’s data warehouse, you need to
identify the data sources, the data structures, and the business rules. You also need good
browser tools to browse through the information about the data sources. Here are some
recent trends in enhancements to browser tools:
† Tools are extensible to allow definition of any type of data or informational object.
† Open APIs (application program interfaces) are included.
† Several types of browsing functions, including navigation through hierarchical group-
ings, are provided.
† Users are able to browse the catalog (data dictionary or metadata), find an informational
object of interest, and proceed further to launch the appropriate query tool with the
relevant parameters.
† Web browsing and search techniques are available to browse through the information
catalogs.
Data Fusion
A data warehouse is a place where data from numerous sources is integrated to provide a uni-
fied view of the enterprise. Data may come from the various operational systems running on
multiple platforms, where it may be stored in flat files or in databases supported by different
DBMSs. In addition to internal sources, data from external sources is also included in the
data warehouse. In the data warehouse repository, you may also find various types of unstruc-
tured data in the form of documents, images, audio, and video.
In essence, various types of data from multiple disparate sources need to be integrated or
fused together and stored in the data warehouse. Data fusion is a technology dealing with the
merging of data from disparate sources. It has a wider scope and includes real-time merging
of data from instruments and monitoring systems. Serious research is being conducted in the
technology of data fusion. The principles and techniques of data fusion technology have a
direct application in data warehousing.
SIGNIFICANT TRENDS 57
89.
Data fusion notonly deals with the merging of data from various sources, it also has
another application in data warehousing. In present-day warehouses, we tend to collect
data in astronomical proportions. The more information stored, the more difficult it is to
find the right information at the right time. Data fusion technology is expected to address
this problem also.
By and large, data fusion is still in the realm of research. Vendors are not rushing to pro-
duce data fusion tools yet. At this stage, all you need to do is to keep your eyes open and
watch for developments.
Data Integration
In the previous section we touched upon the need for and challenges of combining data from
disparate sources in a data warehouse. Integrating disparate data has been a challenge for data
warehouse developers. This task is not becoming any easier given the data explosion in most
businesses. Data integration has become a top priority and challenge for many companies. In
this section we will consider the trends for integration being adopted in progressive
organizations.
Data integration is not just confined to data warehousing projects, but is also important for
companies to develop an enterprise-wide strategy for integration. The Data Warehousing
Institute conducted a study on data integration approaches across the board. They noticed
that large organizations are leaning towards an enterprise-wide integration architecture
while medium-sized companies are dealing with data integration primarily from a business
intelligence viewpoint.
Integration is viewed in a few different ways: Enterprise Information Integration (EII),
Enterprise Application Integration (EAI), and so on. In general, integration can be brought
about at four different levels in an information technology system: data integration, appli-
cation integration, business process integration, and user interaction integration. An inte-
gration architecture must incorporate all these different levels.
Data Integration. The objective is to provide a single, unified view of the business data
scattered across the various systems in an organization. This unified view may be a
physical one that has been combined and consolidated from multiple disparate sources
into a single repository such as a data warehouse or an operational data store. On the
other hand, this may a virtual federated view of disparate data pulled together dynami-
cally at the time of data access. Another technique for data integration is the straight-
forward approach of merging data from one database to another, for example, merging
customer data from a CRM database into a manufacturing system database.
Application Integration. Here the objective is to provide a unified view of business appli-
cations used in the organization. The flow of transactions, messages, and data between
applications is controlled and managed to obtain a unified view.
Business Process Integration. The objective is to provide a unified view of the organiz-
ation’s business processes. This type of integration is achieved through business pro-
cess design tools and business process management tools.
User Interaction Integration. The objective is to provide users with a single, personal-
ized interface to the business processes and data for performing their organizational
functions. This type of integration fosters data sharing and user collaboration. An
enterprise portal is an example of a technique for user interaction integration.
58 TRENDS IN DATA WAREHOUSING
90.
Analytics
Data warehousing andbusiness intelligence is all about analysis of data. During the past few
years, vendors have made tremendous strides in providing effective tools for analysis.
Companies are concentrating on two areas of analysis more than others.
Multidimensional Analysis Today, every data warehouse environment provides for
multidimensional analysis. This is becoming an integral part of the information delivery
system of the data warehouse. Provision of multidimensional analysis to your users simply
means that they will be able to analyze business measurements in many different ways.
Multidimensional analysis is also synonymous with online analytical processing (OLAP).
Because of the enormous importance of OLAP, we will discuss this topic in greater detail
in Chapter 15. At this stage, just note that vendors have made tremendous progress in OLAP
tools. Now vendor products are evaluated to a large extent by the strength of their OLAP
components.
Predictive Analytics Already many organizations are reaping tremendous benefits by
using predictive analytics in their business intelligence environment. Predictive analytics
assist the organizations greatly by improving their understanding of their customer beha-
viors, by optimizing their business processes, by enabling them to anticipate problems
before they arise, and by helping them to recognize opportunities well ahead of time.
Agent Technology
A software agent is a program that is capable of performing a predefined programmable task
on behalf of the user. For example, on the Internet, software agents can be used to sort and
filter out e-mail according to rules defined by the user. Within the data warehouse, software
agents are beginning to be used to alert users to predefined business conditions. They are also
beginning to be used extensively in conjunction with data mining and predictive modeling
techniques. Some vendors specialize in alert system tools. You should definitely consider
software agent programs for your data warehouse.
As the size of data warehouses continues to grow, agent technology gets applied more and
more. Let us say your marketing analyst needs to use your data warehouse at specific, invari-
able intervals to identify threat and opportunity conditions that can offer business advantages
to the enterprise. The analyst has to run several queries and perform multilevel analysis to
find these conditions. Such conditions are exception conditions. So the analyst has to step
through very intense iterative analysis. Some threat and opportunity conditions may be dis-
covered only after long periods of iterative analysis. This takes up a lot of the analyst’s time,
perhaps on a daily basis.
Whenever a threat or opportunity condition is discovered through elaborate analysis, it
makes sense to describe the event to a software agent program. This program will then auto-
matically signal to the analyst every time that condition is encountered in the future. This is
the very essence of agent technology.
Software agents may even be used for routine monitoring of business performance. Your
CEO may want to be notified every time the corporate-wide sales fall below the monthly
targets, three months in a row. A software agent program may be used to alert him or her
every time this condition happens. Your marketing VP may want to know every time the
monthly sales promotions in all the stores are successful. Again, a software agent program
may be used for this purpose.
SIGNIFICANT TRENDS 59
91.
Syndicated Data
The valueof the data content is derived not only from the internal operational systems, but
from suitable external data as well. With the escalating growth of data warehouse implemen-
tations, the market for syndicated data is expanding rapidly.
Examples of traditional suppliers of syndicated data are A. C. Nielsen and Information
Resources, Inc. for retail data and Dun & Bradstreet and Reuters for financial and economic
data. Some of the earlier data warehouses incorporated syndicated data from such traditional
suppliers to enrich the data content.
Now data warehouse developers are looking at a host of new suppliers dealing with many
other types of syndicated data. The more recent data warehouses receive demographic, psy-
chographic, market research, and other kinds of useful data from new suppliers. Syndicated
data is becoming big business.
Data Warehousing and ERP
Look around to see what types of applications companies have been implementing in the
last few years. You will observe a predominant phenomenon. Many businesses are adopting
ERP (enterprise resource planning) application packages offered by major vendors like SAP,
Baan, JD Edwards, and PeopleSoft. The ERP market is huge, crossing the $50 billion mark.
Why are companies rushing into ERP applications? Most companies are plagued by
numerous disparate applications that cannot present a single unified view of the corporate
information. Many of the legacy systems are totally outdated. Reconciliation of data retrieved
from various systems to produce meaningful and correct information is extremely difficult
and, at some large corporations, almost impossible. Some companies were looking for
alternative ways to circumvent the enormous undertaking of making old legacy systems
Y2K-compliant. ERP vendors seemingly came to the rescue of such companies.
Data in ERP Packages A remarkable feature of an ERP package is that it supports
practically every phase of the day-to-day business of an enterprise, from inventory control
to customer billing, from human resources to production management, from product costing
to budgetary control. Because of this feature, ERP packages are huge and complex. The ERP
applications collect and integrate lots of corporate data. As these are proprietary applications,
the large volumes of data are stored in proprietary formats available for access only through
programs written in proprietary languages. Usually, thousands of relational database tables
arc needed to support all the various functions.
Integrating ERP and Data Warehouse In the 1990s and beyond, when ERP was
introduced, this grand solution promised to bring about the integrated corporate data repo-
sitories companies were looking for. Because all data was cleansed, transformed, and inte-
grated in one place, the appealing vision was that decision making and action taking could
take place from one integrated environment. Soon companies implementing ERP realized
that the thousands of relational database tables, designed and normalized for running the
business operations, were not at all suitable for providing strategic information. Moreover,
ERP data repositories lacked data from external sources and from other operational systems
in the company. If your company has ERP or is planning to acquire ERP, you need to
consider the integration of ERP with data warehousing.
60 TRENDS IN DATA WAREHOUSING
92.
Integration Options Corporationsintegrating ERP and the data warehouse initiatives
usually adopt one of three options shown in Figure 3-7. ERP vendors have begun to comp-
lement their packages with data warehousing solutions. Companies adopting option 1
implement the data warehousing solution of the ERP vendor with currently available func-
tionality and await enhancements. The downside to this approach is that you may be waiting
forever for the enhancements. In option 2, companies implement customized data ware-
houses and use third-party tools to extract data from the ERP datasets. Retrieving and loading
data from proprietary ERP datasets is not easy. Option 3 is a hybrid approach that combines
the functionalities provided by the vendor’s data warehouse with additional functionalities
from third-party tools.
You need to examine these three approaches carefully and pick the one most suitable for
your corporation.
Data Warehousing and KM
If 1998 marked the resurgence of ERP systems, 1999 marked the genesis of knowledge man-
agement (KM) systems in many corporations. Since then, into the 2000s, KM caught on very
rapidly. Operational systems deal with data; informational systems such as data warehouses
empower users by capturing, integrating, storing, and transforming the data into useful infor-
mation for analysis and decision making. Knowledge management takes this to a higher
level. It completes the process by providing users with knowledge to use the right infor-
mation, at the right time, and at the right place,
Knowledge is actionable information. What do we mean by knowledge management? It is
a systematic process for capturing, integrating, organizing, and communicating knowledge
accumulated by employees. It is a vehicle to share corporate knowledge so that employees
Other
Operational
Systems
External
Data
ERP
System
ERP Data
Warehouse
OPTION 1 OPTION 2 OPTION 3
ERP Data
Warehouse “as is”
Custom-developed
Data Warehouse
Hybrid: ERP Data
Warehouse enhanced
with 3rd party tools
Other
Operational
Systems
External
Data
Custom
Data
Warehouse
ERP
System
Other
Operational
Systems
External
Data
ERP
System
Enhanced
ERP Data
Warehouse
Figure 3-7 ERP and data warehouse integration options.
SIGNIFICANT TRENDS 61
93.
may be moreeffective and productive in their work. Where does the knowledge exist in a
corporation? Corporate procedures, documents, reports analyzing exception conditions,
objects, math models, what-if cases, text streams, video clips—all of these and many
more such instruments contain corporate knowledge.
A knowledge management system must store all such knowledge in a knowledge repo-
sitory, sometimes called a knowledge warehouse. A data warehouse contains structured
information; a knowledge warehouse holds unstructured information. Therefore, a knowl-
edge management framework must have tools for searching and retrieving unstructured
information.
As a data warehouse developer, what are your concerns about knowledge management?
Take a specific corporate scenario. Let us say sales have dropped in the south central region.
Your marketing VP is able to discern this from your data warehouse by running some queries
and doing some preliminary analysis. The vice president does not know why the sales are
down, but things will begin to clear up if, just at that time, he or she has access to a document
prepared by an analyst explaining why the sales are low and suggesting remedial action. That
document contains the pertinent knowledge, although this is a simplistic example. The VP
needs numeric information, but something more as well.
Knowledge, stored in a free unstructured format, must be linked to the sales results to pro-
vide context to the sales numbers from the data warehouse. With technological advances in
organizing, searching, and retrieval of unstructured data, more knowledge philosophy will
enter into data warehousing. Figure 3-8 shows how you can extend your data warehouse
to include retrievals from the knowledge repository that is part of the knowledge manage-
ment framework of your company.
Now, in the above scenario, the VP can get the information about the drop in sales from
the data warehouse and then retrieve the relevant analyst’s document from the knowledge
repository. Knowledge obtained from the knowledge management system can provide
Integrated Data Warehouse—Knowledge Repository
Data
Warehouse
Knowledge
Repository
K
R
Q
u
e
r
y
C
o
n
s
t
r
u
c
t
o
r
USER QUERY
KR QUERY
DW QUERY RESULTS
RESULTS
Figure 3-8 Integration of KM and the data warehouse.
62 TRENDS IN DATA WAREHOUSING
94.
context to theinformation received from the data warehouse to understand the story behind
the numbers.
Data Warehousing and CRM
Fiercer competition has forced many companies to pay greater attention to retaining custo-
mers and winning new ones. Customer loyalty programs have become the norm. Companies
are moving away from mass marketing to one-on-one marketing. Customer focus has
become the watchword. Concentration on customer experience and customer intimacy has
become the key to better customer service. More and more companies are embracing custo-
mer relationship management (CRM) systems. A number of leading vendors offer turnkey
CRM solutions that promise to enable one-on-one service to customers.
When your company is gearing up to be more attuned to high levels of customer service,
what can you, as a data warehouse architect, do? If you already have a data warehouse, how
must you readjust it? If you are building a new data warehouse, what are the factors for
special emphasis? You will have to make your data warehouse more focused on the custo-
mer. You will have to make your data warehouse CRM-ready, not an easy task by any means.
In spite of the difficulties, the payoff from a CRM-ready data warehouse is substantial.
Your data warehouse must hold details of every transaction at every touchpoint with each
customer. This means every unit of every sale of every product to every customer must be
gathered in the data warehouse repository. You need not only sales data in detail but also
details of every other type of encounter with each customer. In addition to summary data,
you have to load every encounter with every customer into the data warehouse. Atomic or
detailed data provides maximum flexibility for the CRM-ready data warehouse. Making
your data warehouse CRM-ready will increase the data volumes tremendously. Fortunately,
today’s technology facilitates large volumes of atomic data to be placed across multiple
storage management devices that can be accessed through common data warehouse tools.
To make your data warehouse CRM-ready, you have to enhance some other functions
also. For customer-related data, cleansing and transformation functions are more involved
and complex. Before taking the customer name and address records to the data warehouse,
you have to parse unstructured data to eliminate duplicates, combine them to form distinct
households, and enrich them with external demographic and psychographic data. These
are major efforts. Traditional data warehousing tools are not quite suited for the specialized
requirements of customer-focused applications.
Agile Development
During the 1990s more and more organizations began to realize the problems encountered
while adopting traditional methods of software development. The development methodo-
logy had been too structured, linear, and inflexible. Project delays and budget overruns
became common and troublesome. Organizations suffered far-reaching consequences.
Development efforts took too long and became too expensive. Users and stakeholders got
frustrated. Ongoing feuds among groups in the development team resulted in rampant pol-
itical maneuvers. Important issues slipped through the cracks. A radical new way of
approaching software development was immediately called for.
Answering the clarion call for reformation, in February 2001 an initial group of 17
methodologists met in the city of Snowbird, Utah, and formed the Agile Software Develop-
ment Alliance (briefly known as the Agile Alliance). The agile software development
SIGNIFICANT TRENDS 63
95.
methodology was born.This group did not consist of professionals with exactly the same
skills and background; the group spanned a panel of professionals with varied backgrounds
and experience levels. They met with one primary goal: to dramatically improve the software
development effort.
The initial members of the Agile Alliance agreed on a bold manifesto that enumerates
preferential and underlying themes for successful software development: people and inter-
actions, usable software, user collaboration, and acceptance of change. Agile software deve-
lopment is based on a set of well-defined principles and practices. It is not a set of software
tools and mechanisms for software development.
Today, many organizations have embraced the principles and practices of agile develop-
ment and have realized remarkable success in their software projects. More recently compa-
nies have begun to apply agile development to data warehousing and business intelligence
projects. In later chapters, we will discuss this further.
Active Data Warehousing
So far we have discussed a number of significant trends that are very relevant to what you
need to bear in mind while building your data warehouse. Why not end our discussion of
the significant trends with a bang? Let us look at what is known as active data warehousing.
What do you think of opening your data warehouse to 30,000 users worldwide, consisting
of employees, customers, and business partners, in addition to allowing about 15 million
users public access to the information every day? What do you think about making it a
24-7 continuous service delivery environment with 99.9% availability? Your data ware-
house quickly becomes mission-critical instead of just being strategic. You are into active
data warehousing.
This is what one global company has accomplished with an active data warehouse. The
company operates in more than 60 countries, manufactures in more than 40 countries, con-
ducts research in nearly 30 countries, and sells over 50,000 products in 200 countries. The
advantages of opening up the data warehouse to outside parties other than employees are
enormous. Suppliers work with the company on improved demand planning and supply
chain management; the company and its distributors cooperate on planning between diffe-
rent sales strategies; customers make expeditious purchasing decisions. The active data ware-
house truly provides one-on-one service to customers and business partners.
EMERGENCE OF STANDARDS
Think back to our discussion in Chapter 1 of the data warehousing environment as a blend of
many technologies. A combination of multiple types of technologies is needed for building a
data warehouse. The range is wide: data modeling, data extraction, data transformation, data-
base management systems, control modules, alert system agents, query tools, analysis tools,
report writers, and so on.
Now in a hot industry such as data warehousing, there is no scarcity of vendors and pro-
ducts. In each of the multitude of technologies supporting the data warehouse, numerous
vendors and products exist. The implication is that when you build your data warehouse,
many choices are available to you to create an effective solution with the best-of-breed pro-
ducts. That is the good news. However, the bad news is that when you try to use multivendor
products, the result could also be total confusion and chaos. These multivendor products
have to cooperate and work together in your data warehouse.
64 TRENDS IN DATA WAREHOUSING
96.
Unfortunately, there areno elaborate and established standards for the various products to
exchange information and function together. When you use the database product from one
vendor, the query and reporter tool from another vendor, and the OLAP (online analytical
processing) product from yet another vendor, these three products have no standard
method for exchanging data. Standards are especially critical in two areas: metadata inter-
change and OLAP functions.
Metadata is like the total roadmap to the information contained in a data warehouse.
Each product adds to the total metadata content; each product needs to use metadata created
by the other products. Metadata is like the glue that holds all the functional pieces together.
No modern data warehouse is complete without OLAP functionality. Without OLAP, you
cannot provide your users full capability to perform multidimensional analysis, to view the
information from many perspectives, and to execute complex calculations. OLAP is crucial.
In the following sections, we will review the progress made so far in establishing
standards in these two significant areas. Although much progress has been made, as of
the late 2000s, we have not achieved fully adopted standards in either of the areas.
Metadata
Two separate bodies have been working on standards for metadata, the Meta Data Coalition
and the Object Management Group.
The Meta Data Coalition (MDC) was formed as a consortium of about 50 vendors and
interested parties in October 1995 to launch a metadata standards initiative. The coalition
worked on a standard known as the Open Information Model (OIM). Microsoft joined the
coalition in December 1998 and became a staunch supporter along with some other leading
vendors. In July 1999, the Meta Data Coalition accepted the Open Information Model as the
standard and began to work on extensions. In November 1999, the coalition was driving new
key initiatives. However, in November 2000, Meta Data Coalition discontinued its indepen-
dent operations and merged with the Object Management Group. This paved the way for
a unified standard combining the results of the efforts of two independent bodies.
The Object Management Group (OMG) comprised another group of vendors, including
Oracle, IBM, Hewlett-Packard, Sun, and Unisys, which sought metadata standards through
the Object Management Group, a larger, established forum dealing with a wider array of
standards in object technology. In June 2000, the Object Management Group unveiled the
Common Warehouse Metamodel (CWM) as the standard for metadata interchange for
data warehousing.
In April 2000, the Meta Data Coalition and the Object Management Group announced
that they would cooperate in reaching consensus on a single standard. This goal was realized
in November 2000 when both bodies merged. As most corporate data is managed with tools
from Oracle, IBM, and Microsoft, cooperation between the two camps was all the more
critical. Since the merger, OMG has worked on integrating the Meta Data Coalition’s
OIM into its CWM.
OLAP
The OLAP Council was established in January 1995 as a customer advocacy group to
serve as an industry guide. Membership and participation are open to interested organiz-
ations. In early 2000 the council included 16 general members, mainly vendors of OLAP
products.
EMERGENCE OF STANDARDS 65
97.
Over the years,the council has worked on OLAP standards for the Multi-Dimensional
Application Programmers Interface (MDAPI) and has come up with revisions. Figure 3-9
shows a timeline of the earlier activities of the council.
Several OLAP vendors, platform vendors, consultants, and system integrators had indi-
cated their support for MDAPI 2.0. OLAP membership dwindled and soon the council
was reborn as the Analytical Solutions Forum (ASF). In practice, MDAPI 2.0 never really
got adopted by any substantial group of vendors. It appears the OLAP Council and its
successor ASF have been long forgotten.
WEB-ENABLED DATA WAREHOUSE
We all know that the single most remarkable phenomenon that has impacted computing and
communication during the last few years is the Internet. At every major industry conference
and in every trade journal, most of the discussions relate to the Internet and the World Wide
Web in one way or another.
Starting with a meager number of just four host computer systems in 1969, the Internet
swelled to gigantic proportions, with nearly 95 million hosts by 2000. It is still growing
exponentially. The number of World Wide Web sites escalated to nearly 26 million by
2000. Nearly 150 million global users get on the Internet. Making full use of the ever-
popular Web technology, numerous companies have built Intranets and Extranets to reach
their employees, customers, and business partners. The Web has become the universal infor-
mation delivery system.
We are also aware of how the Internet has fueled the tremendous growth of electronic
commerce in recent years. Annual volume of business-to-business e-commerce exceeds
JAN 1995
MAR 1996
MAY 1996
JUL 1996
SEP 1996
MAY 1997
JAN 1998
NOV 1998
JAN 1999
OLAP Council established
APR 1996
Business Objects company joins the Council
The Council releases first benchmark
IBM joins the Council
IQ Software company joins the Council
Council releases MDAPI
NCR joins the Council
Council “re-born” as the Analytical Solutions Forum (ASF)
Council announces Oracle-led, read-only MDAPI 2.0
Council releases Enhanced Analytical Processing benchmark
Council outlines areas of focus (2007 – Council/ASF defunct)
Figure 3-9 OLAP Council: activities timeline.
66 TRENDS IN DATA WAREHOUSING
98.
$300 billion andtotal e-commerce will soon pass the $1 trillion mark. No business can
compete or survive without a Web presence. The number of companies conducting business
over the Internet had grown to 400,000 by 2003.
As a data warehouse professional, what are the implications for you? Clearly, you
have to tap into the enormous potential of the Internet and Web technology for en-
hancing the value of your data warehouse. Also, you need to recognize the significance
of e-commerce and enhance your warehouse to support and expand your company’s
e-business.
You have to transform your data warehouse into a Web-enabled data warehouse. On the
one hand, you have to bring your data warehouse to the Web, and, on the other hand, you
need to bring the Web to your data warehouse. In the next two subsections, we will discuss
these two distinct aspects of a Web-enabled data warehouse.
The Warehouse to the Web
In early implementations, the corporate data warehouse was intended for managers, execu-
tives, business analysts, and a few other high-level employees as a tool for analysis and
decision making. Information from the data warehouse was delivered to this group of
users in a client-server environment. But today’s data warehouses are no longer confined
to a select group of internal users. Under present conditions, corporations need to increase
the productivity of all the members in the corporation’s value chain. Useful information
from the corporate data warehouse must be provided not only to employees but also to cus-
tomers, suppliers, and all other business partners.
So in today’s business climate, you need to open your data warehouse to the entire com-
munity of users in the value chain, and perhaps also to the general public. This is a tall order.
How can you accomplish this requirement to serve information to thousands of users in
24-7 mode? How can you do this without incurring exorbitant costs for information
delivery? The Internet, along with Web technology, is the answer. The Web will be your
primary information delivery mechanism.
This new delivery method will radically change the ways your users will retrieve, analyze,
and share information from your data warehouse. The components of your information
delivery will be different. The Internet interface will include a browser, search engine,
push technology, home page, information content, hypertext links, and downloaded Java
or ActiveX applets.
When you bring your data warehouse to the Web, from the point of view of the users, the
key requirements are: self-service data access, interactive analysis, high availability and per-
formance, zero-administration client (thin client technology such as Java applets), tight
security, and unified metadata.
The Web to the Warehouse
Bringing the Web to the warehouse essentially involves capturing the clickstream of all the
visitors to your company’s Web site and performing all the traditional data warehousing
functions. And you must accomplish this, near real-time, in an environment that has now
come to be known as the data Webhouse. Your effort will involve extraction, transformation,
and loading of the clickstream data to the Webhouse repository. You will have to build
dimensional schemas from the clickstream data and deploy information delivery systems
from the Webhouse.
WEB-ENABLED DATA WAREHOUSE 67
99.
Clickstream data trackshow people proceeded through your company’s Web site, what
triggers purchases, what attracts people, and what makes them come back. Clickstream
data enables analysis of several key measures, including:
† Customer demand
† Effectiveness of marketing promotions
† Effectiveness of affiliate relationship among products
† Demographic data collection
† Customer buying patterns
† Feedback on Web site design
A clickstream Webhouse may be the single most important tool for identifying, prioritiz-
ing, and retaining e-commerce customers. The Webhouse can produce the following useful
information:
† Site statistics
† Visitor conversions
† Ad metrics
† Referring partner links
† Site navigation resulting in orders
† Site navigation not resulting in orders
† Pages that are session killers
Warehouse
Repository
Webhouse
Repository
General Public
Customers Business Partners
Employees
Clickstream Data,
Requests through
Extranets
Results through
Extranets
The Web
Simplified
View of Web-
enabled Data
Warehouse
Figure 3-10 Web-enabled data warehouse.
68 TRENDS IN DATA WAREHOUSING
100.
† Relationships betweencustomer profiles and page activities
† Best customer and worst customer analysis
The Web-Enabled Configuration
Figure 3-10 indicates an architectural configuration for a Web-enabled data warehouse.
Notice the presence of the essential functional features of a traditional data warehouse. In
addition to the data warehouse repository holding the usual types of information, the
Webhouse repository contains clickstream data.
The convergence of the Web and data warehousing is of supreme importance to every
corporation doing business in the twenty-first century. Because of its critical significance,
we will discuss this topic in much greater detail in Chapter 16.
CHAPTER SUMMARY
† Data warehousing has become mainstream with the spread of high-volume data ware-
houses and the rapid increase in the number of vendor products.
† To be effective, modern data warehouses need to store multiple types of data: structured
and unstructured, including documents, images, audio, and video.
† Data visualization deals with displaying information in several types of visual forms:
text, numerical arrays, spreadsheets, charts, graphs, and so on. Tremendous progress
has been made in data visualization, including information through dashboards and
scorecards.
† Data warehouse performance may be improved by using parallel processing with
appropriate hardware and software options. Many companies are opting for data ware-
house appliances.
† It is critical to adapt data warehousing to work with ERP packages, knowledge man-
agement, and customer relationship systems.
† The data warehousing industry is seriously seeking agreed-upon standards for metadata
and OLAP. The end is perhaps in sight.
† Web-enabling the data warehouse means using the Web for information delivery and
integrating the clickstream data from the corporate Web site for analysis. The conver-
gence of data warehousing and Web technology is crucial to every business in the
twenty-first century.
REVIEW QUESTIONS
1. State any three factors that indicate the continued growth in data warehousing and
business intelligence. Can you think of some examples?
2. Why do data warehouses continue to grow in size, storing huge amounts of data? Give
any three reasons.
3. Why is it important to store multiple types of data in the data warehouse? Give
examples of some nonstructured data likely to be found in the data warehouse of a
health management organization (HMO).
4. What is meant by data fusion? Where does it fit in data warehousing?
REVIEW QUESTIONS 69
101.
5. Describe fourtypes of charts you are likely to see in the delivery of information from a
data mart supporting the finance department.
6. What is your understanding of data warehouse appliances? List some of the benefits of
data warehouse appliances.
7. Explain what is meant by agent technology? How can this technology be used in a data
warehouse?
8. Describe any one of the options available to integrate ERP with data warehousing.
9. What is CRM? How can you make your data warehouse CRM-ready?
10. What do we mean by a Web-enabled data warehouse? Describe three of its functional
features.
EXERCISES
1. Indicate if true or false:
A. Data warehousing helps in customized marketing.
B. It is as important to include unstructured data as structured data in a data warehouse.
C. Dynamic charts are themselves user interfaces.
D. MPP is a shared-memory parallel hardware configuration.
E. ERP systems may be substituted for data warehouses.
F. Most of a corporation’s knowledge base contains unstructured data.
G. The traditional data transformation tools are quite adequate for a CRM-ready data
warehouse.
H. Metadata standards facilitate deploying a combination of best-of-breed products.
I. MDAPI is a data fusion standard.
J. A Web-enabled data warehouse stores only the clickstream data captured at the
corporation’s Web site.
2. As the senior analyst on the data warehouse project of a large retail chain, you are res-
ponsible for improving data visualization of the output results. Make a list of your
recommendations.
3. Explain how and why parallel processing can improve performance for data loading and
index creation.
4. Discuss three specific ways in which agent technology may be used to enhance the value
of the data warehouse in a large manufacturing company.
5. Your company is in the business of renting DVDs and video tapes. The company has
recently entered into e-business and the senior management wants to make the existing
data warehouse Web-enabled. List and describe any three of the major tasks required
for satisfying the management’s directive.
70 TRENDS IN DATA WAREHOUSING
CHAPTER 4
PLANNING ANDPROJECT MANAGEMENT
CHAPTER OBJECTIVES
† Review the essentials of planning for a data warehouse
† Distinguish between data warehouse projects and OLTP system projects
† Learn how to adapt the life cycle approach for a data warehouse project
† Introduce agile development methodology for DW projects
† Discuss project team organization, roles, and responsibilities
† Consider the warning signs and success factors
As soon as you read the title of this chapter, you might hasten to conclude that this is a
chapter intended for the project manager or the project coordinator. If you are not already
a project manager or planning to be one in the near future, you might be inclined to just
skim through the chapter. That would be a mistake. This chapter is very much designed
for all IT professionals, irrespective of their roles in data warehousing projects. It will
show you how best you can fit into your specific role in a project. If you want to be part
of a team that is passionate about building a successful data warehouse, you need the details
presented in this chapter. So please read on.
First read the following confession.
Consultant So, your company is into data warehousing? How many data marts do
you have?
Project Manager Eleven.
Consultant That’s great. But why so many?
Project Manager Ten mistakes.
Data Warehousing Fundamentals for IT Professionals, Second Edition. By Paulraj Ponniah
Copyright # 2010 John Wiley & Sons, Inc.
73
105.
Although this conversationis a bit exaggerated, according to industry experts, more than
50% of data warehouse projects are considered failures. In many cases, the project is not
completed and the system is not delivered. In a few cases, the project somehow gets com-
pleted but the data warehouse turns out to be a data basement. The project is improperly
sized and architected. The data warehouse is not aligned with the business. Projects get
abandoned in midstream.
Several factors contribute to the failures. When your company gets into data warehousing
for the first time, the project will involve many organizational changes. At the present time,
the emphasis is on enterprise-wide information analysis. Until now, each department and
each user “owned” its data and was concerned with a set of its “own” computer systems.
Data warehousing has changed all of that and made managers, data owners, and end-users
uneasy. You are likely to uncover problems with the production systems as you build the
data warehouse.
PLANNING YOUR DATA WAREHOUSE
More than any other factor, improper planning and inadequate project management tend to
result in failures. First and foremost, determine if your company really needs a data ware-
house. Is it really ready for one? You need to develop criteria for assessing the value
expected from your data warehouse. Your company has to decide on the type of data ware-
house to be built and where to keep it. You have to ascertain where the data is going to
come from and even whether you have all the needed data. You have to establish who
will be using the data warehouse, how they will use it, and at what times.
We will discuss the various issues related to the proper planning for a data warehouse.
You will learn how a data warehouse project differs from the types of projects you were
involved with in the past. We will study the guidelines for making your data warehouse
project a success.
Key Issues
Planning for your data warehouse begins with a thorough consideration of the key issues.
Answers to the key questions are vital for proper planning and successful completion of
the project. Therefore, let us consider the pertinent issues, one by one.
Value and Expectations Some companies jump into data warehousing and business
intelligence projects without assessing the value to be derived from their proposed data ware-
house. Of course, first you have to be sure that, given the culture and the current requirements
of your company, a data warehouse is the most viable solution. After you have established
the suitability of this solution, only then can you begin to enumerate the benefits and value
propositions. Will your data warehouse help the executives and managers to do better plan-
ning and make better decisions? Is it going to improve the bottom line? Is it going to increase
market share? If so, by how much? What are the expectations? What does the management
want to accomplish through the data warehouse? As part of the overall planning process,
make a list of realistic benefits and expectations. This is the starting point.
Risk Assessment Planners generally associate project risks with the cost of the project.
If the project fails, how much money will go down the drain? But the assessment of risks is
74 PLANNING AND PROJECT MANAGEMENT
106.
more than calculatingthe loss from the project costs. What are the risks faced by the
company without the benefits derivable from a data warehouse? What losses are likely to
be incurred? What opportunities are likely to be missed? Risk assessment is broad and
relevant to each business. Use the culture and business conditions of your company to
assess the risks. Include this assessment as part of your planning document.
Top-Down or Bottom-Up In Chapter 2, we discussed the top-down and bottom-up
approaches for building a data warehouse. The top-down approach is to start at the
enterprise-wide data warehouse, and possibly build it iteratively. Then data from the overall,
large enterprise-wide data warehouse flows into departmental and subject data marts. On the
other hand, the bottom-up approach is to start by building individual data marts, one by one.
The conglomerate of these data marts will make up the enterprise data warehouse.
We looked at the pros and cons of the two methods. We also discussed a practical
approach of going bottom-up, but making sure that the individual data marts are conformed
to one another so that they can be viewed as a whole. For this practical approach to be
successful, you have to first plan and define requirements at the overall corporate level.
You have to weigh these options as they apply to your company. Do you have the large
resources needed to build a corporate-wide data warehouse first and then deploy the indi-
vidual data marts? This option may also take more time for implementation and delay the
realization of potential benefits. But this option, by its inherent approach, will ensure a
fully unified view of the corporate data.
It is possible that your company would be satisfied with quick deployment of a few data
marts for specific reasons. At this time, it may be important to just quickly react to some
market forces or ward off some fierce competitor. There may not be time to build an overall
data warehouse. Or, you may want to examine and adopt the practical approach of conformed
datamarts.Whateverapproachyourcompanydesirestoadopt, scrutinize theoptionscarefully
and make the choice. Document the implications of the choice in the planning document.
Build or Buy This is a major issue for all organizations. No one builds a data warehouse
totally from scratch by in-house programming. There is no need to reinvent the wheel every
time. A wide and rich range of third-party tools and solutions are available. After nearly a
decade of the data warehousing movement the market has matured, with suitable tools for
data warehousing and business intelligence. The real question is how much of your data
marts should you build yourselves? How much of these may be composed of ready-made
solutions? What type of mix and match must be done?
In a data warehouse, there is a large range of functions. Do you want to write more in-
house programs for data extraction and data transformation? Do you want to use in-house
programs for loading the data warehouse storage? Do you want to use vendor tools com-
pletely for information delivery and business intelligence? You retain control over the
functions wherever you use in-house software. On the other hand, the buy option could
lead to quick implementation if managed effectively.
Be wary of the marts-in-the-box or the 15-minute data marts. There are no silver bullets
out there. The bottom line is to do your homework and find the proper balance between
in-house and vendor software. Do this at the planning stage itself.
Single Vendor or Best-of-Breed Vendors come in a variety of categories. There are
multiple vendors and products catering to the many functions of the data warehouse. So what
are the options? How should you decide? Two major options are: to use the products of a
PLANNING YOUR DATA WAREHOUSE 75
107.
single vendor, orto use products from more than one vendor, selecting appropriate tools.
Choosing a single vendor solution has a few advantages:
† High level of integration among the tools
† Constant look and feel
† Seamless cooperation among components
† Centrally managed information exchange
† Negotiable overall price
This approach will naturally enable your data warehouse to be well integrated and func-
tion coherently. However, only a few vendors such as IBM and NCR offer fully integrated
solutions.
Reviewing this specific option further, here are the major advantages of the best-of-breed
solution that combines products from multiple vendors:
† You can build an environment to fit your organization.
† There is no need to compromise between database and support tools.
† You can select products best suited for the specific function.
With the best-of-breed approach, compatibility among the tools from the different ven-
dors could become a serious problem. If you are taking this route, make sure the selected
tools are proven to be compatible. In this case, the staying power of individual vendors is
crucial. Also, you will have less bargaining power with regard to individual products and
may incur higher overall expense. Make a note of the recommended approach: have one
vendor for the database and the information delivery functions, and pick and choose other
vendors for the remaining functions. However, the multivendor approach is not advisable
if your environment is not heavily technical.
Business Requirements, Not Technology
Let business requirements drive your data warehouse, not technology. Although this seems
so obvious, you would not believe how many data warehouse projects grossly violate this
maxim. Many data warehouse developers are interested in putting pretty pictures on the
user’s screen and pay little attention to the real requirements. They like to build snappy
systems exploiting the depths of technology and merely demonstrating their prowess in
harnessing the power of technology.
Remember, data warehousing is not about technology, it is about solving users’ need for
strategic information. Do not plan to build the data warehouse before understanding the
requirements. Start by focusing on what information is needed and not on how to provide
the information. Do not emphasize the tools. Tools and products come and go. The basic
structure and the architecture to support the user requirements are more important.
So before making the overall plan, conduct a preliminary survey of requirements. How do
you do that? No details are necessary at this stage. No in-depth probing is needed. Just try to
understand the overall requirements of the users. Your intention is to gain a broad under-
standing of the business. The outcome of this preliminary survey will help you formulate
the overall plan. It will be crucial to set the scope of the project. Also, it will assist you in
prioritizing and determining the rollout plan for individual data marts. For example, you
76 PLANNING AND PROJECT MANAGEMENT
108.
may have toplan on rolling out the marketing data mart first, the finance mart next, and only
then consider the human resources one.
What types of information must you gather in the preliminary survey? At a minimum,
obtain general information on the following from each group of users:
† Mission and functions of each user group
† Computer systems used by the group
† Key performance indicators
† Factors affecting success of the user group
† Who the customers are and how they are classified
† Types of data tracked for the customers, individually and as groups
† Products manufactured or sold
† Categorization of products and services
† Locations where business is conducted
† Levels at which profits are measured—per customer, per product, per district
† Levels of cost details and revenue
† Current queries and reports for strategic information
As part of the preliminary survey, include a source system audit. Even at this stage, you
must have a fairly good idea from where the data is going to be extracted for the data ware-
house. Review the architecture of the source systems. Find out about the relationships among
the data structures. What is the quality of the data? What documentation is available? What
are the possible mechanisms for extracting the data from the source systems? Your overall
plan must contain information about the source systems.
Top Management Support
No major initiative in a company can succeed without support from senior management.
This is very true in the case of the company’s data warehouse project. The project must
have the full support of the top management right from day one.
No other venture unifies the information view of the entire corporation as the corpor-
ation’s data warehouse does. The entire organization is involved and positioned for strategic
advantage. No one department or group can sponsor the data warehousing initiative in a
company.
Make sure you have a sponsor from the highest levels of management to keep the focus.
The data warehouse must often satisfy conflicting requirements. The sponsor must wield his
or her influence to arbitrate and to mediate. In most companies that launch data warehouses,
the CEO is also directly interested in its success. In some companies, a senior executive
outside of IT becomes the primary sponsor. This person, in turn, nominates some of the
senior managers to be actively involved in the day-to-day progress of the project.
Whenever the project encounters serious setbacks, the sponsor jumps in to resolve the issues.
Justifying Your Data Warehouse
Even if your company is a medium-sized company, when everything is accounted for, the
total investment in your data warehouse could run to a few million dollars. A rough
PLANNING YOUR DATA WAREHOUSE 77
109.
breakdown of thecosts is as follows: hardware, 31%; software, including the DBMS, 24%;
staff and system integrators, 35%; administration, 10%. How do you justify the total cost by
balancing the risks against the benefits, both tangible and intangible? How can you calculate
the ROI and ROA? How can you make a business case?
It is not easy. Real benefits may not be known until after your data warehouse is built and
put to use fully. Your data warehouse will allow users to run queries and analyze the vari-
ables in many different ways. Your users can run what-if analysis by moving into several
hypothetical scenarios and make strategic decisions. They will not be limited in the ways
in which they can query and analyze. Who can predict what queries and analysis they
might run, what significant decisions they will be able to make, and how beneficially
these decisions will impact the bottom line?
Many companies are able to introduce data warehousing without a full cost-justification
analysis. Here the justification is based mainly on intuition and potential competitive press-
ures. In these companies, the top management is able to readily recognize the benefits of data
integration, improved data quality, user autonomy in running queries and analyses, and the
ease of information accessibility. If your company is such a company, good luck to you.
Do some basic justification and jump into the project with both feet in.
Not every company’s top management is so easy to please. In many companies, some
type of formal justification is required. We want to present the typical approaches taken
for justifying the data warehouse project. Review these examples and pick the approach
that is closest to what will work in your organization. Here are some sample approaches
for preparing the justification:
1. Calculate the current technology costs to produce the applications and reports sup-
porting strategic decision making. Compare this with the estimated costs for the
data warehouse and find the ratio between the current costs and proposed costs. See
if this ratio is acceptable to senior management.
2. Calculate the business value of the proposed data warehouse with the estimated dollar
values for profits, dividends, earnings growth, revenue growth, and market share
growth. Review this business value expressed in dollars against the data warehouse
costs and come up with the justification.
3. Do the full-fledged exercise. Identify all the components that will be affected by the
proposed data warehouse and those that will affect the data warehouse. Start with
the cost items, one by one, including hardware purchase or lease, vendor software,
in-house software, installation and conversion, ongoing support, and maintenance
costs. Then put a dollar value on each of the tangible and intangible benefits, including
cost reduction, revenue enhancement, and effectiveness in the business community.
Go further to do a cash flow analysis and calculate the ROI.
The Overall Plan
The seed for a data warehousing initiative gets sown in many ways. The initiative may
get ignited simply because the competition has a data warehouse. Or the CIO makes a rec-
ommendation to the CEO or some other senior executive proposes a data warehouse as the
solution for the information problems in a company. In some cases, a senior executive was
exposed to the idea at a conference or seminar. Whatever may be the reason for your com-
pany to think about data warehousing, the real initiative begins with a well-thought-out
78 PLANNING AND PROJECT MANAGEMENT
110.
formal plan thatsets the direction, tone, and goals of the initiative. The plan lays down the
motivation and the incentives. It considers the various options and reasons out the selection
process. The plan discusses the type of data warehouse and enumerates the expectations.
This is not a detailed project plan. It is an overall plan to lay the foundation, to recognize
the need, and to authorize a formal project.
Figure 4-1 lists the types of content to be included in the formal overall plan. Review the
list carefully and adapt it for your data warehouse initiative.
THE DATA WAREHOUSE PROJECT
As an IT professional, you have worked on application projects before. You know what goes
on in these projects and are aware of the methods needed to build the applications from
planning through implementation. You have been part of the analysis, the design, the pro-
gramming, or the testing phases. If you have functioned as a project manager or a team
leader, you know how projects are monitored and controlled. A project is a project. If you
have seen one IT project, have you not seen them all?
The answer is not a simple yes or no. Data warehouse projects are different from projects
building the transaction processing systems. If you are new to data warehousing, your first
data warehouse project will reveal the major differences. We will discuss these differences
and also consider ways to react to them. We will also ask a basic question about the readiness
of the IT and user departments to launch a data warehouse project. How about the traditional
system development life cycle (SDLC) approach? Can we use this approach to data ware-
house projects as well? If so, what are the development phases in the life cycle?
How is it Different?
Let us understand why data warehouse projects are distinctive. You are familiar with
application projects for OLTP systems. A comparison with an OLTP application project
will help us recognize the differences.
INTRODUCTION
MISSION STATEMENT
SCOPE
GOALS & OBJECTIVES
KEY ISSUES & OPTIONS
VALUES & EXPECTATIONS
JUSTIFICATION
EXECUTIVE SPONSORSHIP
IMPLEMENTATION STRATEGY
TENTATIVE SCHEDULE
PROJECT AUTHORIZATION
Figure 4-1 Overall plan for data warehousing initiative.
THE DATA WAREHOUSE PROJECT 79
111.
Try to describea data warehouse in terms of major functional pieces. First you have the
data acquisition component. Next is the data storage component. Finally, there is the infor-
mation delivery component. At a very general level, a data warehouse is made up of these
three broad components. You will notice that a data warehouse project differs from a project
on OLTP application in each of these three functional areas. Let us go over the differences.
Figure 4-2 lists the differences and also describes them.
Data warehousing is a new paradigm. We almost expect a data warehouse project to be
different from an OLTP system project. We can accept the differences. But more important
is the discussion of the consequences of the differences. What must you do about the dif-
ferences? How should the project phases be changed and enhanced to deal with them?
The following suggestions address the differences:
† Consciously recognize that a data warehouse project has broader scope, tends to be
more complex, and involves many different technologies.
† Allow for extra time and effort for newer types of activities.
† Do not hesitate to find and use specialists wherever in-house talent is not available. A
data warehouse project has many out-of-the-ordinary tasks.
† Metadata in a data warehouse is so significant that it needs special treatment throughout
the project. Pay extra attention to building the metadata framework properly.
† Typically, you will be using a few third-party tools during the development and for
ongoing functioning of the data warehouse. In your project schedule, plan to include
time for the evaluation and selection of tools.
† Allow ample time to build and complete the infrastructure.
DATA ACQUISITION DATA STORAGE INFO. DELIVERY
Large number of sources
Many disparate sources
Different computing
platforms
Outside sources
Huge initial load
Ongoing data feeds
Data replication
considerations
Difficult data integration
Complex data
transformations
Data cleansing
Several user types
Queries stretched to limits
Multiple query types
Web-enabled
Multidimensional analysis
OLAP functionality
Metadata management
Interfaces to DSS apps.
Feed into Data Mining
Multi-vendor tools
Storage of large data
volumes
Rapid growth
Need for parallel
processing
Data storage in staging area
Multiple index types
Several index files
Storage of newer data types
Archival of old data
Compatibility with tools
RDBMS & MDDBMS
Data Warehouse: Distinctive Features and Challenges for Project Management
Figure 4-2 Differences between a data warehouse project and one on OLTP application.
80 PLANNING AND PROJECT MANAGEMENT
112.
† Include enoughtime for the architecture design.
† Involve the users in every stage of the project. Data warehousing could be completely
new to both IT and the users in your company. A joint effort is imperative.
† Allow sufficient time for training the users in the query and reporting tools.
† Because of the large number of tasks in a data warehouse project, parallel development
tracks are absolutely necessary. Be prepared for the challenges of running parallel
tracks in the project life cycle.
Assessment of Readiness
Let us say you have justified the data warehouse project and received the approval and
blessing of the top management. You have an overall plan for the data warehousing initiative.
You have grasped the key issues and understood how a data warehouse project is different
and what you have to do to handle the differences. Are you then ready to jump into the
preparation of a project plan and get moving swiftly?
Not yet. You need to do a formal readiness assessment. Normally, to many of the project
team members and to almost all of the users, data warehousing would be a brand new con-
cept. A readiness assessment and orientation is important. Which person does the readiness
assessment? The project manager usually does it with the assistance of an outside expert.
By this time, the project manager would already be trained in data warehousing or he or
she may have prior experience. Engage in discussions with the executive sponsor, users,
and potential team members. The objective is to assess their familiarity with data warehous-
ing in general, assess their readiness, and uncover gaps in their knowledge. Prepare a formal
readiness assessment report before the project plan is firmed up.
The readiness assessment report is expected to serve the following purposes:
† Lower the risks of big surprises occurring during implementation
† Provide a proactive approach to problem resolution
† Reassess corporate commitment
† Review and reidentify project scope and size
† Identify critical success factors
† Restate user expectations
† Ascertain training needs
The Life-Cycle Approach
As an IT professional you are all too familiar with the traditional system development life
cycle (SDLC). You know how to begin with a project plan, move into the requirements
analysis phase, then into the design, construction, and testing phases, and finally into the
implementation phase. The life cycle approach accomplishes all the major objectives in
the system development process. It enforces orderliness and enables a systematic approach
to building computer systems. The life cycle methodology breaks down the project complex-
ity and removes any ambiguity with regard to the responsibilities of project team members.
It implies a predictable set of tasks and deliverables.
THE DATA WAREHOUSE PROJECT 81
113.
That the lifecycle approach breaks down the project complexity is reason enough for
this approach to be considered for a data warehouse project. A data warehouse project is
complex in terms of tasks, technologies, and team member roles. But a one-size-fits-all
life cycle approach will not work for a data warehouse project. Adapt the life cycle approach
to the special needs of your data warehouse project. Note that a life cycle for data warehouse
development is not a waterfall method in which one phase ends and cascades into the
next one.
The approach for a data warehouse project has to include iterative tasks going through
cycles of refinement. For example, if one of your tasks in the project is identification of
data sources, you might begin by reviewing all the source systems and listing all the
source data structures. The next iteration of the task is meant to review the data
elements with the users. You move on to the next iteration of reviewing the data elements
with the database administrator and some other IT staff. The next iteration of walking
through the data elements one more time completes the refinements and the task. This
type of iterative process is required for each task because of the complexity and broad
scope of the project.
Remember that the broad functional components of a data warehouse are data acquisition,
data storage, and information delivery. Make sure the phases of your development life cycle
wrap around these functional components. Figure 4-3 shows how to relate the functional
components to SDLC.
As in any system development life cycle, the data warehouse project begins with the
preparation of a project plan. The project plan describes the project, identifies the specific
objectives, mentions the crucial success factors, lists the assumptions, and highlights the
critical issues. The plan includes the project schedule, lists the tasks and assignments, and
provides for monitoring progress. Figure 4-4 provides a sample outline of a data warehouse
project plan.
Project Start
Project End
SYSTEM
PHASES
DEVELOPMENT
LIFE CYCLE
Data
Acquisition Data Storage
Information
Delivery
Figure 4-3 Date warehouse functional components and SDLC.
82 PLANNING AND PROJECT MANAGEMENT
114.
THE DEVELOPMENT PHASES
Inthe previous section, we again referred to the overall functional components of a data
warehouse as data acquisition, data storage, and information delivery. These three functional
components form the general architecture of the data warehouse. There must be the proper
technical infrastructure to support these three functional components. Therefore, when we
formulate the development phases in the life cycle, we have to ensure that the phases include
tasks relating to the three components. The phases must also include tasks to define the archi-
tecture as composed of the three components and to establish the underlying infrastructure
to support the architecture. The design and construction phase for these three components
may run somewhat in parallel.
Refer to Figure 4-5 and notice the three tracks of the development phases. In the devel-
opment of every data warehouse, these tracks are present with varying sets of tasks. You may
change and adapt the tasks to suit your specific requirements. You may want to emphasize
one track more than the others. If data quality is a problem in your company, you need to
pay special attention to the related phase. The figure shows the broad division of the project
life cycle into the traditional phases:
† Project plan
† Requirements definition
† Design
† Construction
† Deployment
† Growth and maintenance
Interwoven within the design and construction phases are the three tracks along with the
definition of the architecture and the establishment of the infrastructure. Each of the boxes
shown in the diagram represents a major activity to be broken down further into individual
INTRODUCTION
PURPOSE
ASSESSMENT OF READINESS
GOALS & OBJECTIVES
STAKEHOLDERS
ASSUMPTIONS
CRITICAL ISSUES
SUCCESS FACTORS
PROJECT TEAM
PROJECT SCHEDULE
DEPLOYMENT DETAILS
Figure 4-4 Sample outline of a data warehouse project plan.
THE DEVELOPMENT PHASES 83
115.
tasks and assignedto the appropriate team members. Use the diagram as a guide for listing
the activities and tasks for your data warehouse project. Although the major activities may
remain the same for most warehouses, the individual tasks within each activity are likely to
vary for your specific data warehouse.
In the following chapters, we will discuss these development activities in greater detail.
When you get to those chapters, you may want to refer back to this diagram.
Adopting Agile Development
In the previous chapter we introduced the use of agile development principles and practices
for software development. This is a recent phenomenon, more recent for data warehouse
development than for other types of applications. Companies are beginning to adopt agile
development for data warehouse and business intelligence projects. Agile development
methodology encourages collaboration among project team members and users, and pro-
motes iterative and incremental development efforts. The entire methodology rests on the
adoption of certain core values, principles, and practices in every aspect of data warehouse
development and implementation.
Core Values. Values that are emphasized include striving for simplicity and not being
bogged down in complexity, providing and obtaining constant feedback on individual
development tasks, fostering free and uninhibited communication, and rewarding
courage to learn from mistakes.
Core Principles. Principles that are followed include encouraging quality, embracing
change, changing incrementally, adopting simplicity, and providing rapid feedback.
Core Practices. Practices that are implemented include creating short releases of appli-
cation components, performing development tasks jointly (“pair programming”),
working the 40-hour work week intensively, not expanding the time for ineffective
pursuits, and having user representatives on site with the project team.
Project
Planning
Requirements
Definition
Design
Construction
Maintenance
Deployme
nt
DATA
STORAGE
DATA
ACQUISITION
INFO.
DELIVERY
ARCHITE
CTURE
INFRAST
RUCTUR
E
Figure 4-5 Data warehouse development phases.
84 PLANNING AND PROJECT MANAGEMENT
116.
Variables. Control variablesthat can be manipulated for trade-offs to achieve results are
time, quality, scope, and cost.
THE PROJECT TEAM
As in any type of project, the success of a data warehouse project rides on the shoulders of
the project team. The best team wins. A data warehouse project is similar to other software
projects in that it is human-intensive. It takes several trained and specially skilled persons
to form the project team. Organizing the project team for a data warehouse project has to
do with matching diverse roles with proper skills and levels of experience. That is not an
easy feat to accomplish.
Two things can break a project: complexity overload and responsibility ambiguity. In a
life cycle approach, the project team minimizes the complexity of the effort by sharing
and performing. When the right person on the team, with the right type of skills and with
the right level of experience, does an individual task, this person is really resolving the
complexity issue.
In a properly constituted project team, each person is given specific responsibilities or a
particular role based on his or her skill and experience level. In such a team, there is no
confusion or ambiguity about responsibilities.
In the following sections, we will discuss the fitting of the team members into suitable
roles. We will also discuss the responsibilities associated with the roles. Further, we will
discuss the skills and experience levels needed for each of these roles. Pay close attention
and learn how to determine project roles for your data warehouse. Also, try to match your
project roles with the responsibilities and tasks in your warehouse project.
Organizing the Project Team
Organizing a project team involves putting the right person in the right job. If you are orga-
nizing and putting together a team to work on an OLTP system development, you know that
the required skills set is of a reasonable size and is manageable. You would need specialized
skills in the areas of project management, requirements analysis, application design, data-
base design, and application testing. But a data warehouse project calls for many other
roles. How then do you fill all these varied roles?
A good starting point is to list all the project challenges and specialized skills needed.
Your list may run like this: planning, defining data requirements, defining types of queries,
data modeling, tools selection, physical database design, source data extraction, data vali-
dation and quality control, setting up the metadata framework, and so on. As the next
step, using your list of skills and anticipated challenges, prepare a list of team roles
needed to support the development work.
Once you have a list of roles, you are ready to assign individual persons to the team roles.
It is not necessary to assign one or more persons to each of the identified roles. If your data
warehouse effort is not large and your company’s resources are meager, try making the
same person wear many hats. In this personnel allocation process, remember that the user
representatives must also be considered as members of the project team. Do not fail to
recognize the users as part of the team and to assign them to suitable roles.
Skills, experience, and knowledge are important for team members. However, attitude,
team spirit, passion for the data warehouse effort, and strong commitment are equally impor-
tant, if not more so. Do not neglect to look for these critical traits.
THE PROJECT TEAM 85
117.
Roles and Responsibilities
Projectteam roles are designated to perform one or more related tasks. In many data ware-
house projects, the team roles are synonymous with the job titles given to the team members.
If you review an OLTP system development project, you will find that the job titles for the
team members are more or less standardized. In the OLTP system project, you will find the
job titles of project manager, business analyst, systems analyst, programmer, data analyst,
database administrator, and so on. However, data warehouse projects are not yet standardized
as far as job tiles go. There still is an element of experimentation and exploration.
So what are the prevailing job titles? Let us first look at the long list shown in Figure 4-6.
Do not be alarmed by the length of the list. Unless your data warehouse is of mammoth
proportions, you will not need all these job titles. This list just indicates the possibilities
and variations. Responsibilities of the same role may be attached to different job titles in
different projects. In many projects, the same team member will fulfill the responsibilities
of more than one role.
Data warehousing authors and practitioners tend to classify roles or job titles in various
ways. They first come up with broad classifications and then include individual job titles
within these classifications. Here are some of the classifications of the roles:
† Staffing for initial development, staffing for testing, staffing for ongoing maintenance,
staffing for data warehouse management
† IT and end-users, then subclassifications within each of the two broad classifications,
followed by further subclassifications
† Front office roles, back office roles
† Coaches, regular lineup, special teams
† Management, development, support
† Administration, data acquisition, data storage, information delivery
Executive Sponsor
Project Director
Project Manager
User Representative Manager
Data Warehouse Administrator
Organizational Change Manager
Database Administrator
Metadata Manager
Business Requirements Analyst
Data Warehouse Architect
Data Acquisition Developer
Data Access Developer
Data Quality Analyst
Data Warehouse Tester
Maintenance Developer
Data Provision Specialist
Business Analyst
System Administrator
Data Migration Specialist
Data Grooming Specialist
Data Mart Leader
Infrastructure Specialist
Power User
Training Leader
Technical Writer
Tools Specialist
Vendor Relations Specialist
Web Master
Data Modeler
Security Architect
Figure 4-6 Job titles in a data warehouse project.
86 PLANNING AND PROJECT MANAGEMENT
118.
In your datawarehouse project, you may want to come up with broad classifications that
are best suited for your environment. How do you come up with the broad classifications?
You will have to reexamine the goals and objectives. You will have to assess the areas in
the development phases that would need special attention. Is data extraction going to be
your greatest challenge? Then support that function with specialized roles. Is your infor-
mation delivery function going to be complex? Then have special project team roles
strong in information delivery. Once you have determined the broad classifications, then
work on the individual roles within each classification. If it is your first data warehouse
project, you may not come up with all the necessary roles up front. Do not be too concerned.
You may keep supporting the project with additional team roles here and there as the project
moves along.
You have read the long list of possible team roles and the ways the roles may be classified.
This may be your first data warehouse project and you may be the one responsible to deter-
mine the team roles for the project. You want to get started and have a basic question: Is there
a standard set of basic roles to get the project rolling? Not really. There is no such standard
set. If you are inclined to follow traditional methodology, follow the classifications of
management, development, and support. If you want to find strengths for the three major
functional areas, then adopt the classifications of data acquisition, data storage, and infor-
mation delivery. You may also find that a combination of these two ways of classifying
would work for your data warehouse.
Despite the absence of a standard set of team roles, we would suggest the following
basic set:
† Executive sponsor
† Project manager
† User liaison manager
† Lead architect
† Infrastructure specialist
† Business analyst
† Data modeler
† Data warehouse administrator
† Data transformation specialist
† Quality assurance analyst
† Testing coordinator
† End-user applications specialist
† Development programmer
† Lead trainer
Figure 4-7 lists the usual responsibilities attached to the suggested set of roles. Review the
descriptions of the responsibilities. Add or modify the descriptions to make them applicable
to the special circumstances of your data warehouse.
Skills and Experience Levels
We discussed the guidelines for determining the broad classifications of the team roles. After
you figure out the classifications relevant to your data warehouse project, you will come up
with the set of team roles appropriate to your situation. We reviewed some examples of
THE PROJECT TEAM 87
119.
typical roles. Theroles may also be called job titles in a project. Moving forward, you will
write down the responsibilities associated with the roles you have established. You have
established the roles and you have listed the responsibilities. Are you then ready to match
the people to fill into these roles? There is one more step needed before you can do that.
To fit into the roles and discharge the responsibilities, the selected persons must have the
right abilities. They should possess suitable skills and the proper work experience. So you
have to come up with a list of skills and experience required for the various roles.
Figure 4-8 describes the skills and experience levels for our sample set of team roles. Use
the descriptions found in the figure as examples to compose the descriptions for the team
roles in your data warehouse project.
It is not easy to find IT professionals to fill all the roles established for your data ware-
house. OLTP systems are ubiquitous. All IT professionals have assumed some role or the
other in an OLTP system project. This is not the case with data warehouse projects. Not
too many professionals have direct hands-on experience in the development of data ware-
houses. Outstanding skills and abilities are in short supply.
If people qualified to work on data warehouse projects are not readily available, what is
your recourse? How can you fill the roles in your project? This is where training becomes
important. Train suitable professionals in data warehousing concepts and techniques. Let
them learn the fundamentals and specialize for the specific roles. In addition to training
your in-house personnel, use external consultants in specific roles for which you are
unable to find people from the inside. However, as a general rule, consultants must not be
used in leading roles. The project manager or the lead administrator must come from
within the organization.
User Participation
In a typical OLTP application, the users interact with the system through GUI screens.
They use the screens for data input and for retrieving information. The users receive any
Executive Sponsor
Direction, support, arbitration.
Project Manager
Assignments, monitoring, control.
User Liaison Manager
Coordination with user groups.
Lead Architect
Architecture design.
Infrastructure Specialist
Infrastructure design/construction.
Business Analyst
Requirements definition.
Data Modeler
Relational and dimensional modeling.
Data Warehouse Administrator
DBA functions.
Data Transformation Specialist
Data extraction, integration, transformation.
Quality Assurance Analyst
Quality control for warehouse data.
Testing Coordinator
Program, system, tools testing.
End-User Applications Specialist
Confirmation of data meanings/relationships.
Development Programmer
In-house programs and scripts.
Lead Trainer
Coordination of User and Team training.
Figure 4-7 Roles and responsibilities of a data warehouse project team.
88 PLANNING AND PROJECT MANAGEMENT
120.
additional information throughreports produced by the system at periodic intervals. If the
users need special reports, they have to get IT involved to write ad hoc programs that are
not part of the regular application.
In striking contrast, user interaction with a data warehouse is direct and intimate. Usually,
there are no or just a few set reports or queries. When the implementation is complete, your
users will begin to use the data warehouse directly with no mediation from IT. There is no
predictability in the types of queries they will be running, the types of reports they will be
requesting, or the types of analysis they will be performing. If there is one major difference
between OLTP systems and data warehousing systems, it is in the usage of the system by
the users.
What is the implication of this major difference in project team composition and data
warehouse development? The implication is extremely consequential. What does this
mean? This means that if the users will be using the data warehouse directly in unforeseen
ways, they must have a strong voice in its development. They must be part of the project team
all the way. More than an OLTP system project, a data warehouse project calls for serious
joint application development (JAD) techniques.
Your data warehouse project will succeed only if appropriate members of the user com-
munity are accepted as team members with specific roles. Make use of their expertise and
knowledge of the business. Tap into their experience in making business decisions.
Actively involve them in the selection of information delivery tools. Seek their help in test-
ing the system before implementation.
Executive Sponsor
Senior level executive, in-depth knowledge of
the business, enthusiasm and ability to moderate
and arbitrate as necessary.
Project Manager
People skills, project management experience,
business and user oriented, ability to be practical
and effective.
User Liaison Manager
People skills, respected in user community,
organization skills, team player, knowledge of
systems from user viewpoint.
Lead Architect
Analytical skills, ability to see the big picture,
expertise in interfaces, knowledge of data
warehouse concepts.
Infrastructure Specialist
Specialist in hardware, operating systems,
computing platforms, experience as operations
staff.
Business Analyst
Analytical skills, ability to interact with users,
sufficient industry experience as analyst.
Data Modeler
Expertise in relational and dimensional
modeling with case tools, experience as data
analyst.
Data Warehouse Administrator
Expert in physical database design and
implementation, experience as relational DBA,
MDDBMS experience a plus.
Data Transformation Specialist
Knowledge of data structures, in-depth knowledge
of source systems, experience as analyst.
Quality Assurance Analyst
Knowledge of data quality techniques, knowledge
of source systems data, experience as analyst.
Testing Coordinator
Familiarity with testing methods and standards,
use of testing tools, knowledge of some data
warehouse information delivery tools, experience as
programmer/analyst.
End-User Applications Specialist
In-depth knowledge of source applications.
Development Programmer
Programming and analysis skills, experience as
programmer in selected language and DBMS.
Lead Trainer
Training skills, experience in IT/User training,
coordination and organization skills.
Figure 4-8 Skills and experience levels required for a data warehouse project team.
THE PROJECT TEAM 89
121.
Figure 4-9 illustrateshow and where in the development process users must be made to
participate. Review each development phase and clearly decide how and where your users
need to participate. This figure relates user participation to stages in the development pro-
cess. Here is a list of a few team roles that users can assume to participate in the development:
† Project sponsor—responsible for supporting the project effort all the way (must be an
executive)
† User department liaison representatives—help IT to coordinate meetings and review
sessions and ensure active participation by the user departments
† Subject area experts—provide guidance in the requirements of the users in specific
subject areas and clarify semantic meanings of business terms used in the enterprise
† Data review specialists—review the data models prepared by IT; confirm the data
elements and data relationships
† Information delivery consultants—examine and test information delivery tools; assist
in the tool selection
† User support technicians—act as the first-level, front-line support for the users in their
respective departments
PROJECT MANAGEMENT CONSIDERATIONS
Your project team was organized, the development phases were completed, the testing was
done, the data warehouse was deployed, and the project was pronounced completed on time
and within budget. Has the effort been successful? In spite of the best intentions of the
Project Planning
Requirements Definition
Design
Construction
Deployment
Maintenance
Provide goals, objectives, expectations, business information during preliminary survey; grant
active top management support; initiate project as executive sponsor.
Actively participate in meetings for defining requirements; identify all source systems; define
metrics for measuring business success, and business dimensions for analysis; define information
needed from data warehouse.
Review dimensional data model, data extraction and transformation design; provide anticipated
usage for database sizing; review architectural design and metadata; participate in tool selection;
review information delivery design.
Actively participate in user acceptance testing; test information delivery tools; validate data
extraction and transformation functions; confirm data quality; test usage of metadata; benchmark
query functions; test OLAP functions; participate in application documentation.
Verify audit trails and confirm initial data load; match deliverables against stated expectations;
arrange and participate in user training; provide final acceptance.
Provide input for enhancements; test and accept enhancements.
Figure 4-9 User participation in data warehouse development.
90 PLANNING AND PROJECT MANAGEMENT
122.
project team, itis likely that the deployed data warehouse turns out to be anything but a data
warehouse. Figure 4-10 shows possible scenarios of failure. How will your data warehouse
turn out in the end?
Effective project management is critical to the success of a data warehouse project. In this
section, we will consider project management issues as they apply especially to data ware-
house projects, review some basic project management principles, and list the possible
success factors. We will review a real-life successful project and examine the reasons for
its success. When all is said and done, you cannot always run your project totally by
the book. Adopt a practical approach that produces results without getting bogged down
in unnecessary drudgery.
Guiding Principles
Having worked on OLTP system projects, you are already aware of some of the guiding
principles of project management—do not give into analysis paralysis, do not allow scope
creep, monitor slippage, keep the project on track, and so on. Although most of those guiding
principles also apply to data warehouse project management, we do not want to repeat them
here. On the other hand, we want to consider some guiding principles that pertain to data
warehouse projects exclusively. At every stage of the project, you have to keep the guiding
principles as a backdrop so that these principles can condition each project management
decision and action. The major guiding principles are:
Sponsorship. No data warehouse project succeeds without strong and committed execu-
tive sponsorship.
Data Basement
Poor quality data
without proper access.
Data Mausoleum
An expensive data
basement with poor
access and
performance.
Data Shack
Pathetic data dump
collapsing even
before completion.
Data Tenement
Built by a legacy
system vendor or an
ignorant consultant
with no idea of
what users want.
Data Cottage
Stand-alone, aloof,
fragmented, island
data mart.
Data Jailhouse
Confined and invisible
data system keeping
data imprisoned so
that users cannot get at
the data.
Figure 4-10 Possible scenarios of failure.
PROJECT MANAGEMENT CONSIDERATIONS 91
123.
Project Manager. Itis a serious mistake to have a project manager who is more technol-
ogy-oriented than user-oriented and business-oriented.
New Paradigm. Data warehousing is new for most companies; innovative project man-
agement methods are essential to deal with the unexpected challenges.
Team Roles. Team roles are not to be assigned arbitrarily; the roles must reflect the needs
of each individual data warehouse project.
Data Quality. Three critical aspects of data in the data warehouse are: quality, quality,
and quality.
User Requirements. Although obvious, user requirements alone form the driving force of
every task on the project schedule.
Building for Growth. Number of users and number of queries increase very quickly after
deployment; data warehouses not built for growth will crumble swiftly.
Project Politics. The first data warehouse project in a company poses challenges and
threats to users at different levels; trying to handle project politics is like walking
the proverbial tightrope, to be trodden with extreme caution.
Realistic Expectations. It is easy to promise the world in the first data warehouse project;
setting expectations at the right and attainable levels is the best course.
Dimensional Data Modeling. A well-designed dimensional data model is a required
foundation and blueprint.
External Data. A data warehouse does not live by internal data alone; data from relevant
external sources is an absolutely necessary ingredient.
Training. Data warehouse user tools are different and new. If the users do not know how
to use the tools, they will not use the data warehouse. An unused data warehouse is a
failed data warehouse.
Warning Signs
As the life cycle of your data warehouse project runs its course and the development phases
are moving along, you must keep a close watch for any warning signs that may spell disaster.
Constantly be looking for any indicators suggesting doom and failure. Some of the warning
signs may just point to inconveniences calling for little action. But there are likely to be other
warning signs indicative of wider problemsthat need corrective action to ensure final success.
Some warning signs may portend serious drawbacks that require immediate remedial action.
Whatever might be the nature of the warning sign, be vigilant and keep a close watch. As
soon as you spot an omen, recognize the potential problem, and take corrective action.
Figure 4-11 presents a list of typical warning signs and suggested corrective action. The
list in the figure is just a collection of examples. In your data warehouse project, you may
find other types of warning signs. Your corrective action for potential problems may be
different depending on your circumstances.
Success Factors
You have followed the tenets of effective project management and your data warehouse is
completed. How do you know that your data warehouse is a success’? Do you need three
or five years to see if you get the ROI (return on investment) proposed in your plan? How
long do you have to wait before you can assert that your data warehouse effort is successful.
Or, are there some immediate signs indicating success?
92 PLANNING AND PROJECT MANAGEMENT
124.
There are somesuch indications of success that can be observed within a short time after
implementation. The following happenings generally indicate success:
† Queries and reports—rapid increase in the number of queries and reports requested
by the users directly from the data warehouse
† Query types—queries becoming more sophisticated
† Active users—steady increase in the number of users
† Usage—users spending more and more time in the data warehouse looking for
solutions
† Turnaround times—marked decrease in the times required for obtaining strategic
information
Figure 4-12 provides a list of key factors for a successful data warehouse project. By no
means is this list an exhaustive compilation of all possible ingredients for success. Nor is it a
magic wand to guarantee success in every situation. You know very well that a good part
of ensuring success depends on your specific project, its definite objectives, and its
unique project management challenges. Therefore, use the list for general guidance.
Anatomy of a Successful Project
No matter how many success factors you review, and no matter how many guidelines you
study, you get a better grasp of the success principles by analyzing the details of what
really made a real-world project a success. We will now do just that. Let us review a case
study of an actual business in which the data warehouse project was a tremendous success.
The Requirements
Definition phase is well
past the target date.
Suffering from “analysis
paralysis.”
Stop the capturing of unwanted
information. Remove any
problems by meeting with users.
Set firm final target date.
Need to write too many
in-house programs.
Selected third party tools
running out of steam.
If there is time and budget, get
different tools. Otherwise
increase programming staff.
WARNING SIGN INDICATION ACTION
Users not cooperating
to provide details of
data.
Possible turf concerns
over data ownership.
Very delicate issue. Work with
executive sponsor to resolve the
issue.
Users not comfortable
with the query tools.
Users not trained
adequately.
First, ensure that the selected
query tool is appropriate. Then
provide additional training.
Continuing problems
with data brought over
to the staging area.
Data transformation and
mapping not complete.
Revisit all data transformation
and integration routines. Ensure
that no data is missing. Include
the user representative in the
verification process.
Figure 4-11 Warning signs for a data warehouse project.
PROJECT MANAGEMENT CONSIDERATIONS 93
125.
The warehouse metthe goals and produced the desired results. Figure 4-13 depicts this
data warehouse, indicating the success factors and benefits. A fictional name is used for
the business.
Adopt a Practical Approach
After the entire project management principles are enunciated, numerous planning methods
are described, and several theoretical nuances are explored, a practical approach is still best
for achieving results. Do not get bogged down in the strictness of the principles, rules, and
methods. Adopt a practical approach to managing the project. Results alone matter; just
being active and running around chasing the theoretical principles will not produce the
desired outcome.
A practical approach is simply a common-sense approach that has a nice blend of practical
wisdom and hard-core theory. While using a practical approach, you are totally results
oriented. You constantly balance the significant activities against the less important ones
and adjust the priorities. You are not driven by technology just for the sake of technology
itself; you are motivated by business requirements.
In the context of a data warehouse project, here are a few tips on adopting a practical
approach:
† Running a project in a pragmatic way means constantly monitoring the deviations and
slippage, and making in-flight corrections to stay the course. Rearrange the priorities
as and when necessary.
† Let project schedules act as guides for smooth workflow and achieving results, not just
to control and inhibit creativity. Please do not try to control each task to the minutest
Ensure continued, long-term, committed support from the executive sponsors.
Up front, establish well-defined, real, and agreed business value from your data
warehouse. Manage user expectations realistically.
Get the users enthusiastically involved throughout the project.
The data extraction, transformation, and loading (ETL) function is the most time-
consuming, labor-intensive activity. Do not under-estimate the time and
effort for this activity.
Remember architecture first, then technology, then tools. Select an architecture
that is right for your environment.
The right query and information tools for the users are extremely critical. Select
the most useful and easy-to-use ones, not the glamorous. Avoid bleeding-
edge technology.
Plan for growth and evolution. Be mindful of performance considerations.
Assign a user-oriented project manager.
Focus the design on queries, not transactions.
Define proper data sources. Only load the data that is needed.
Figure 4-12 Key success factors for a data warehouse project.
94 PLANNING AND PROJECT MANAGEMENT
126.
detail. You willthen only have time to keep the schedules up to date, with less time to
do the real job.
† Review project task dependencies continuously. Minimize wait times for dependent
tasks.
† There really is such a thing as “too much planning.” Do not give into the temptation.
Occasionally, ready–fire–aim may be a worthwhile principle for a practical approach.
† Similarly, too much analysis can produce “analysis paralysis.”
† Avoid “bleeding edge” and unproven technologies. This is very important if the project
is the first data warehouse project in your company.
† Always produce early deliverables as part of the project. These deliverables will sustain
the interest of users and also serve as proof-of-concept systems.
† Build the architecture first, and only then the tools. Do not choose the tools and
then build your data warehouse around the selected tools. Build the architecture
first, based on business requirements, and then pick the tools to support the
architecture.
Review these suggestions and use them appropriately in your data warehouse project.
Especially if this is their first data warehouse project, the users will be interested in quick
and easily noticeable benefits. You will soon find out that they are never interested in
your fanciest project scheduling tool that empowers them to track each task by the hour or
minute. They are satisfied only by results. They are attracted to the data warehouse only
by how useful and easy to use it is.
Business Context
BigCom, Inc., world’s leading supplier of
data, voice, and video communication
technology with more than 300 million
customers and significant recent growth.
Challenges
Limited availability of global information;
lack of common data definitions; critical
business data locked in numerous disparate
applications; fragmented reporting needing
elaborate reconciliation; significant system
downtime for daily backups and updates.
Technology and Approach
Deploy large-scale corporate data
warehouse to provide strategic information
to 1,000 users for making business
decisions; use proven tools from single
vendor for data extraction and building
data marts; query and analysis tool from
another reputable vendor.
Success Factors
Clear business goals; strong executive
support; user departments actively involved;
selection of appropriate and proven tools;
building of proper architecture first;
adequate attention to data integration and
transformation; emphasis on flexibility and
scalability.
Benefits Achieved
True enterprise decision support; improved sales measurement; decreased cost of ownership;
streamlined business processes; improved customer relationship management; reduced IT
development; ability to incorporate clickstream data from company’s Web site.
Figure 4-13 Analysis of a successful data warehouse.
PROJECT MANAGEMENT CONSIDERATIONS 95
127.
CHAPTER SUMMARY
† Whileplanning for your data warehouse, key issues to be considered include setting
proper expectations, assessing risks, deciding between top-down or bottom-up
approaches, choosing from vendor solutions.
† Business requirements, not technology, must drive your project.
† A data warehouse project without the full support of the top management and without
a strong and enthusiastic executive sponsor is doomed to failure from day one.
† Benefits from a data warehouse accrue only after the users put it to full use. Justification
through stiff ROI calculations is not always easy. Some data warehouses are justified
and the projects started by just reviewing the potential benefits.
† A data warehouse project is much different from a typical OLTP system project. The
traditional life cycle approach of application development must be changed and
adapted for the data warehouse project. Also, consider making use of agile develop-
ment methodology.
† Standards for organization and assignment of team roles are still in the experimental
stage in many projects. Modify the roles to match what is important for your project.
† Participation of the users is mandatory for success of the data warehouse project. Users
can participate in a variety of ways.
† Consider the warning signs and success factors: in the final analysis, adopt a practical
approach to build a successful data warehouse.
REVIEW QUESTIONS
1. Name four key issues to be considered while planning for a data warehouse.
2. Explain the difference between the top-down and bottom-up approaches for building
data warehouses. Do you have a preference? If so, why?
3. List three advantages for each of the single-vendor and multivendor solutions.
4. What is meant by a preliminary survey of requirements? List six types of information
you will gather during a preliminary survey.
5. How are data warehouse projects different from OLTP system projects? Describe four
such differences.
6. List and explain any four of the development phases in the life cycle of a data warehouse
project.
7. What do you consider to be a core set of team roles for a data warehouse project?
Describe the responsibilities of three roles from your set.
8. List any three warning signs likely to be encountered in a data warehouse project. What
corrective actions will you need to take to resolve the potential problems indicated
by these three warning signs?
9. Name and describe any five of the success factors in a data warehouse project.
10. What is meant by “taking a practical approach” to the management of a data warehouse
project? Give any two reasons why you think a practical approach is likely to succeed.
96 PLANNING AND PROJECT MANAGEMENT
128.
EXERCISES
1. Match thecolumns:
1. top-down approach
2. single-vendor solution
3. team roles
4. team organization
5. role classifications
6. user support technician
7. executive sponsor
8. project politics
9. active user participation
10. source system structures
A. tightrope walking
B. not standardized
C. requisite for success
D. enterprise data warehouse
E. consistent look and feel
F. front office, back office
G. part of overall plan
H. right person in right role
I. front-line support
J. guide and support project
2. As the recently assigned project manager, you are required to work with the executive
sponsor to write a justification without detailed ROI calculations for the first data ware-
house project in your company. Write a justification report to be included in the planning
document.
3. You are the data transformation specialist for the first data warehouse project in an airlines
company. Prepare a project task list to include all the detailed tasks needed for data extrac-
tion and transformation.
4. Why do you think user participation is absolutely essential for success? As a member of
the recently formed data warehouse team in a banking business, your job is to write a
report on how the user departments can best participate in the development. What specific
responsibilities for the users will you include in your report?
5. As the lead architect for a data warehouse in a large domestic retail store chain, prepare a
list of project tasks relating to designing the architecture. In which development phases
will these tasks be performed?
EXERCISES 97
130.
CHAPTER 5
DEFINING THEBUSINESS
REQUIREMENTS
CHAPTER OBJECTIVES
† Discuss how and why defining requirements is different for a data warehouse
† Understand the role of business dimensions
† Learn about information packages and their use in defining requirements
† Review methods for gathering requirements
† Grasp the significance of a formal requirements definition document
A data warehouse is an information delivery system for business intelligence. It is not about
technology, but about solving users’ problems and providing strategic information to the
user. In the phase of defining requirements, you need to concentrate on what information
the users need, not so much on how you are going to provide the required information.
The actual methods for providing information will come later, not while you are collecting
requirements.
Before we proceed, let us clarify the scope and content of this chapter. In this chapter, we
will focus on determining requirements for what was referred to as the practical approach in
Chapter 2. As we discussed in that chapter, we plan for an enterprise-wide solution; then we
gather requirements for each data mart, subject by subject. These requirements will enable us
to implement conformed data marts, one by one, on a priority basis; eventually to cover the
needs of the entire enterprise.
On the other hand, if the goal is to take a strictly top-down approach and build an
enterprise-wide data warehouse first, determining the requirements will be different from
what is discussed in this chapter. With the purely top-down approach, the data warehouse
will be developed based on the third normal form relational data model. This relational
database will form the data warehouse. In turn this enterprise data warehouse will feed the
Data Warehousing Fundamentals for IT Professionals, Second Edition. By Paulraj Ponniah
Copyright # 2010 John Wiley & Sons, Inc.
99
131.
dependent data marts.However, these dependent data marts will be developed based on the
requirements determination elaborated on in this chapter.
Now, on with our discussion of requirements determination for the data marts—the out-
come ofeither thepractical approach orthederived products ofthepurelytop-downapproach.
Most of the developers of data warehouses come from a background of developing oper-
ational or OLTP (online transactions processing) systems. OLTP systems are primarily data
capture systems. On the other hand, data warehouse systems are information delivery sys-
tems. When you begin to collect requirements for your proposed data warehouse, your mind-
set will have to be different. You have to go from a data capture model to an information
delivery model. This difference will have to show through all phases of the data warehouse
project.
The users also have a different perspective about a data warehouse system. Unlike an
OLTP system, which is needed to run the day-to-day business, no immediate payout is
seen in a decision support system. The users do not immediately perceive a compelling
need to use a decision support system, whereas they cannot refrain from using an operational
system, without which they cannot run their business.
DIMENSIONAL ANALYSIS
In several ways, building a data warehouse is very different from building an operational
system. This becomes notable especially in the requirements gathering phase. Because of
this difference, the traditional methods of collecting requirements that work well for oper-
ational systems cannot be directly applied to data warehouses.
Usage of Information Unpredictable
Let us imagine you are building an operational system for order processing in your company.
For gathering requirements, you interview the users in the order processing department. The
users will list all the functions that need to be performed. They will inform you how they
receive the orders, check stock, verify customers’ credit arrangements, price the order, deter-
mine the shipping arrangements, and route the order to the appropriate warehouse. They will
show you how they would like the various data elements to be presented on the GUI (graphi-
cal user interface) screen for the application. The users will also give you a list of reports they
would need from the order processing application. They will be able to let you know how,
when, and where they would use the application daily.
In providing information about the requirements for an operational system, the users are
able to give you precise details of the required functions, information content, and usage pat-
terns. In striking contrast, for a data warehousing system, the users are generally unable to
define their requirements clearly. They cannot define precisely what information they
really want from the data warehouse, nor can they express how they would like to use the
information or process it.
For most of the users, this could be the very first data warehouse they are being exposed
to. The users are familiar with operational systems because they use these in their daily work,
so they are able to visualize the requirements for other new operational systems. They cannot
relate a data warehouse system to anything they have used before.
If, therefore, the whole process of defining requirements for a data warehouse is so neb-
ulous, how can you proceed as one of the analysts in the data warehouse project? You are in a
100 DEFINING THE BUSINESS REQUIREMENTS
132.
quandary. To beon the safe side, do you then include every piece of data in the data
warehouse you think the users will be able to use? How can you build something the
users are unable to define clearly and precisely?
Initially, you may collect data on the overall business of the organization. You may check
on the industry’s best practices. You may gather some business rules guiding the day-to-day
decision making. You may find out how products are developed and marketed. But these are
generalities and are not sufficient to determine detailed requirements.
Dimensional Nature of Business Data
Fortunately, the situation is not as hopeless as it seems. Even though the users cannot fully
describe what they want in a data warehouse, they can provide you with very important
insights into how they think about the business. They can tell you what measurement
units are important for them. Each user department can let you know how they measure
success in that particular department. The users can give you insights into how they combine
the various pieces of information for strategic decision making.
Managers think of the business in terms of business dimensions. Figure 5-1 shows the
kinds of questions managers are likely to ask for decision making. The figure shows what
questions a typical marketing vice president, a marketing manager, and a financial controller
may ask.
Let us briefly examine these questions. The marketing vice president is interested in
the revenue generated by her new product, but she is not interested in a single number.
She is interested in the revenue numbers by month, in a certain division, by customer demo-
graphics, by sales office, relative to the previous product version, and compared to plan. So
the marketing vice president wants the revenue numbers broken down by month, division,
customer demographics, sales office, product version, and plan. These are her business
dimensions along which she wants to analyze her numbers.
How much did my new product generate
month by month, in the southern division, by customer demographic, by
sales office, relative to the previous version, and compared to plan?
Give me sales statistics
by products, summarized by product categories, daily, weekly, and
monthly, by sale districts, by distribution channels.
Show me expenses
listing actual vs budget, by months, quarters, and annual, by budget line
items, by district, division, summarized for the whole company.
Marketing Manager
Marketing Vice President
Financial Controller
Figure 5-1 Managers think in business dimensions.
DIMENSIONAL ANALYSIS 101
133.
Similarly, for themarketing manager, his business dimensions are product, product cat-
egory, time (day, week, month), sales district, and distribution channel. For the financial con-
troller, the business dimensions are budget line, time (month, quarter, year), district, and
division.
If your users of the data warehouse think in terms of business dimensions for decision
making, you should also think of business dimensions while collecting requirements.
Although the actual proposed usage of a data warehouse could be unclear, the business
dimensions used by the managers for decision making are not nebulous at all. The users
will be able to describe these business dimensions to you. You are not totally lost in the pro-
cess of requirements definition. You can find out about the business dimensions.
Let us try to get a good grasp of the dimensional nature of business data. Figure 5-2 shows
the analysis of sales units along the three business dimensions of product, time, and geogra-
phy. These three dimensions are plotted against three axes of coordinates. You will see that
the three dimensions form a collection of cubes. In each of the small dimensional cubes, you
will find the sales units for that particular slice of time, product, and geographical division. In
this case, the business data of sales units is three dimensional because there are just three
dimensions used in this analysis. If there are more than three dimensions, we extend the con-
cept to multiple dimensions and visualize multidimensional cubes, also called hypercubes.
Examples of Business Dimensions
The concept of business dimensions is fundamental to the requirements definition for a data
warehouse. Therefore, we want to look at some more examples of business dimensions in a
few other cases. Figure 5-3 displays the business dimensions in four different cases.
Let us quickly look at each of these examples. For the supermarket chain, the measure-
ments that are analyzed are the sales units. These are analyzed along four business dimen-
sions. When you are looking for the hypercubes, the sides of such cubes are time, promotion,
product, and store. If you are the marketing manager for the supermarket chain, you would
want your sales broken down by product, at each store, in time sequence, and in relation to
the promotions that take place.
Slices of product
sales information
(units sold)
PRODUCT
TIME
G
E
O
G
R
A
P
H
Y
June
TV Set
Boston
July
Chicago
TV Set
Figure 5-2 Dimensional nature of business data.
102 DEFINING THE BUSINESS REQUIREMENTS
134.
For the insurancecompany, the business dimensions are different and appropriate for that
business. Here you would want to analyze the claims data by agent, individual claim, time,
insured party, individual policy, and status of the claim. The example of the airlines company
shows the dimensions for analysis of frequent flyer data. Here the business dimensions are
time, customer, specific flight, fare class, airport, and frequent flyer status.
The example analyzing shipments for a manufacturing company shows some other
business dimensions. In this case, the business dimensions used for the analysis of ship-
ments are the ones relevant to that business and the subject of the analysis. Here you see
the dimensions of time, ship-to and ship-from locations, shipping mode, product, and any
special deals.
What we find from these examples is that the business dimensions are different and rel-
evant to the industry and to the subject for analysis. We also find the time dimension to be a
common dimension in all examples. Almost all business analyses are performed over time.
INFORMATION PACKAGES—A USEFUL CONCEPT
We will now introduce a novel idea for determining and recording information requirements
for a data warehouse. This concept helps us to give a concrete form to the various insights,
nebulous thoughts, and opinions expressed during the process of collecting requirements.
The information packages, put together while collecting requirements, are very useful for
taking the development of the data warehouse to the next phases.
Supermarket Chain
SALES
UNITS
TIME PROMOTION
PRODUCT
STORE
Manufacturing Company
SHIPMENTS
TIME
CUST SHIP-TO
PRODUCT
DEAL
Insurance Business
CLAIMS
TIME
AGENT
POLICY
STATUS
Airlines Company
FREQUENT
FLYER
FLIGHTS
TIME CUSTOMER
AIRPORT
STATUS
SHIP FROM
SHIP MODE
CLAIM
INSURED PARTY
FLIGHT
FARE CLASS
Figure 5-3 Examples of business dimensions.
INFORMATION PACKAGES—A USEFUL CONCEPT 103
135.
Requirements Not FullyDeterminate
As we have discussed, the users are unable to describe fully what they expect to see in the
data warehouse. You are unable to get a handle on what pieces of information you want
to keep in the data warehouse. You are unsure of the usage patterns. You cannot determine
how each class of users will use the new system. So, when requirements cannot be fully
determined, we need a new and innovative concept to gather and record the requirements.
The traditional methods applicable to operational systems are not adequate in this context.
We cannot start with the functions, screens, and reports. We cannot begin with the data struc-
tures. We have noted that the users tend to think in terms of business dimensions and analyze
measurements along such business dimensions. This is a significant observation and can
form the very basis for gathering information.
The new methodology for determining requirements for a data warehouse system is based
on business dimensions. It flows out of the need of the users to base their analysis on
business dimensions. The new concept incorporates the basic measurements and the
business dimensions along which the users analyze these basic measurements. Using the
new methodology, you come up with the measurements and the relevant dimensions that
must be captured and kept in the data warehouse. You come up with what is known as an
information package for the specific subject.
Let us look at an information package foranalyzing sales for acertain business. Figure 5-4
contains such an information package. The subject here is sales. The measured facts or the
measurements that are of interest for analysis are shown in the bottom section of the package
diagram. In this case, the measurements are actual sales, forecast sales, and budget sales. The
business dimensions along which these measurements are to be analyzed are shown at the
top of the diagram as column headings. In our example, these dimensions are time, location,
product, and demographic age group. Each of these business dimensions contains a hierar-
chy or levels. For example, the time dimension has the hierarchy going from year down to the
level of individual day. The other intermediary levels in the time dimension could be quarter,
Measured Facts: Forecast Sales, Budget Sales, Actual Sales
Time
Periods Locations Products
Age
Groups
Year Country Class Group 1
Dimensions
Information Subject: Sales Analysis
Hierarchies
Figure 5-4 An information package.
104 DEFINING THE BUSINESS REQUIREMENTS
136.
month, and week.These levels or hierarchical components are shown in the information
package diagram.
Your primary goal in the requirements definition phase is to compile information
packages for all the subjects for the data warehouse. Once you have firmed up the infor-
mation packages, you’ll be able to proceed to the other phases.
Essentially, information packages enable you to:
† Define the common subject areas
† Design key business metrics
† Decide how data must be presented
† Determine how users will aggregate or roll up
† Decide the data quantity for user analysis or query
† Decide how data will be accessed
† Establish data granularity
† Estimate data warehouse size
† Determine the frequency for data refreshing
† Ascertain how information must be packaged
Business Dimensions
As we have seen, business dimensions form the underlying basis of the new methodology for
requirements definition. Data must be stored to provide for the business dimensions. The
business dimensions and their hierarchical levels form the basis for all further development
phases. So we want to take a closer look at business dimensions. We should be able to ident-
ify business dimensions and their hierarchical levels. We must be able to choose the proper
and optimal set of dimensions related to the measurements.
We begin by examining the business dimensions for an automobile manufacturer. Let us
say that the goal is to analyze sales. We want to build a data warehouse that will allow the
user to analyze automobile sales in a number of ways. The first obvious dimension is the
product dimension. Again for the automaker, analysis of sales must include analysis by
breaking the sales down by dealers. Dealer, therefore, is another important dimension for
analysis. As an automaker, you would want to know how your sales break down along cus-
tomer demographics. You would want to know who is buying your automobiles and in what
quantities. Customer demographics would be another useful business dimension for analy-
sis. How do the customers pay for the automobiles? What effect does financing for the pur-
chases have on the sales? These questions can be answered by including the method of
payment as another dimension for analysis. What about time as a business dimension?
Almost every query or analysis involves the time element. In summary, we have come up
with the following dimensions for the subject of sales for an automaker: product, dealer,
customer demographic, method of payment, and time.
Let us take one more example. In this case, we want to come up with an information pack-
age for a hotel chain. The subject in this case is hotel occupancy. We want to analyze occu-
pancy of the rooms in the various branches of the hotel chain. We want to analyze the
occupancy by individual hotels and by room types. So, hotel and room type are critical
business dimensions for the analysis. As in the other case, we also need to include the
INFORMATION PACKAGES—A USEFUL CONCEPT 105
137.
time dimension. Inthe hotel occupancy information package, the dimensions to be included
are hotel, room type, and time.
Dimension Hierarchies and Categories
When a user analyzes the measurements along a business dimension, the user usually would
like to see the numbers first in summary and then at various levels of detail. What the user
does here is to traverse the hierarchical levels of a business dimension for getting the details
at various levels. For example, the user first sees the total sales for the entire year. Then the
user moves down to the level of quarters and looks at the sales by individual quarters. After
this, the user moves down further to the level of individual months to look at monthly num-
bers. What we notice here is that the hierarchy of the time dimension consists of the levels of
year, quarter, and month. The dimension hierarchies are the paths for drilling down or rolling
up in our analysis.
Within each major business dimension there are categories of data elements that can also
be useful for analysis. In the time dimension, you may have a data element to indicate
whether a particular day is a holiday. This data element would enable you to analyze by
holidays and see how sales on holidays compare with sales on other days. Similarly, in
the product dimension, you may want to analyze by type of package. The package type
is one such data element within the product dimension. The holiday flag in the time
dimension and the package type in the product dimension do not necessarily indicate hier-
archical levels in these dimensions. Such data elements within the business dimension
may be called categories.
Hierarchies and categories are included in the information packages for each
dimension. Let us go back to the two examples in the previous section and find out which
hierarchical levels and categories must be included for the dimensions. Let us examine
the product dimension. Here, the product is the basic automobile. Therefore, we include
the data elements relevant to product as hierarchies and categories. These would be
model name, model year, package styling, product line, product category, exterior color,
interior color, and first model year. Looking at the other business dimensions for the
auto sales analysis, we summarize the hierarchies and categories for each dimension as
follows:
Product: Model name, model year, package styling, product line, product category,
exterior color, interior color, first model year
Dealer: Dealer name, city, state, single brand flag, date of first operation
Customer Demographics: Age, gender, income range, marital status, household size,
vehicles owned, home value, own or rent
Payment Method: Finance type, term in months, interest rate, agent
Time: Date, month, quarter, year, day of week, day of month, season, holiday flag
Let us go back to the hotel occupancy analysis. We have included three business dimen-
sions. Let us list the possible hierarchies and categories for the three dimensions.
Hotel: Hotel line, branch name, branch code, region, address, city, state, zip code,
manager, construction year, renovation year
106 DEFINING THE BUSINESS REQUIREMENTS
138.
Room Type: Roomtype, room size, number of beds, type of bed, maximum occupants,
suite, refrigerator, kitchenette
Time: Date, day of month, day of week, month, quarter, year, holiday flag
Key Business Metrics or Facts
So far we have discussed the business dimensions in the above two examples. These are the
business dimensions relevant to the users of these two data marts for performing analysis.
The respective users think of their business subjects in terms of these business dimensions
for obtaining information and for doing analysis.
But using these business dimensions, what exactly are the users analyzing? What num-
bers are they analyzing? The numbers the users analyze are the measurements or metrics
that measure the success of their departments. These are the facts that indicate to the users
how their departments are doing in fulfilling their departmental objectives.
In the case of the automaker, these metrics relate to the sales. These are the numbers that
tell the users about their performance in sales. These are numbers about the sale of each indi-
vidual automobile. The set of meaningful and useful metrics for analyzing automobile sales
is as follows:
Actual sale price
MSRP
Options price
Full price
Dealer add-ons
Dealer credits
Dealer invoice
Amount of down payment
Manufacturer proceeds
Amount financed
In the second example of hotel occupancy, the numbers or metrics are different. The
nature of the metrics depends on what is being analyzed. For hotel occupancy, the metrics
would therefore relate to the occupancy of rooms in each branch of the hotel chain. Here is a
list of metrics for analyzing hotel occupancy:
Occupied rooms
Vacant rooms
Unavailable rooms
Number of occupants
Revenue
Now putting it all together, let us discuss what goes into the information package
diagrams for these two examples. In each case, the metrics or facts go into the bottom
section of the information package. The business dimensions will be the column headings.
In each column, you will include the hierarchies and categories for the business dimensions.
Figures 5-5 and 5-6 show the information packages for the two examples we just
discussed.
INFORMATION PACKAGES—A USEFUL CONCEPT 107
139.
Facts: Actual SalePrice, MSRP, Options Price, Full Price, Dealer Add-ons,
Dealer Credits, Dealer Invoice, Down Payment, Proceeds, Finance
Time Product
Payment
Method
Customer
Demo-
graphics
Year
Dimensions
Information Subject: Automaker Sales
Hierarchies/Categories
Quarter
Month
Date
Day of
Week
Day of
Month
Season
Holiday
Flag
Model
Name
Model
Year
Package
Styling
Product
Line
Product
Category
Exterior
Color
Interior
Color
First Year
Finance
Type
Term
(Months)
Interest
Rate
Agent
Dealer
Age
Gender
Income
Range
Marital
Status
House-
hold Size
Vehicles
Owned
Home
Value
Own or
Rent
Dealer
Name
City
State
Single
Brand Flag
Date First
Operation
Figure 5-5 Information package: automaker sales.
Facts: Occupied Rooms, Vacant Rooms, Unavailable Rooms, Number of
Occupants, Revenue
Time Hotel
Room
Type
Year
Dimensions
Information Subject: Hotel Occupancy
Hierarchies/Categories
Quarter
Month
Date
Day of
Week
Day of
Month
Holiday
Flag
Hotel
Line
Branch
Name
Branch
Code
Region
Address
City/State
/Zip
Construction
Year
Renovation
Year
Room
Type
Room
Size
Number
of Beds
Type of
Bed
Max.
Occupants
Suite
Refrigerator
Kichennette
Figure 5-6 Information package: hotel occupancy.
108 DEFINING THE BUSINESS REQUIREMENTS
140.
REQUIREMENTS GATHERING METHODS
Nowthat we have a way of formalizing requirements definition through information package
diagrams, let us discuss the methods for gathering requirements. Remember that a data ware-
house is an information delivery system for providing information for strategic decision
making. It is not a system for running the day-to-day business. Who are the users that can
make use of the information in the data warehouse? Where do you go for getting the
requirements?
Broadly, we can classify the users of the data warehouse as follows:
Senior executives (including the sponsors)
Key departmental managers
Business analysts
Operational system database administrators (DBAs)
Others nominated by the above
Executives will give you a sense of direction and scope for your data warehouse. They
are the ones closely involved in the focused area. The key departmental managers are the
ones who report to the executives in the area of focus. Business analysts are the ones who
prepare reports and analyses for the executives and managers. The operational system
DBAs and IT applications staff will give you information about the data sources for the
warehouse.
What requirements do you need to gather? Here is a broad list:
Data elements: fact classes, dimensions
Recording of data in terms of time
Data extracts from source systems
Business rules: attributes, ranges, domains, operational records
You will have to go to different groups of people in the various departments to gather the
requirements. Three basic techniques are universally adopted for obtaining information from
groups of people: (1) interviews, one-on-one or in small groups; (2) joint application deve-
lopment (JAD) sessions; (3) questionnaires.
One-on-one interviews are the most interactive of the three methods. JAD or group ses-
sions are a little less interactive. Questionnaires are not interactive. An interactive method has
several advantages of getting confirmed information.
A few thoughts about these three basic approaches follow.
Interviews
† Two or three persons at a time
† Easy to schedule
† Good approach when details are intricate
† Some users are comfortable only with one-on-one interviews
† Need good preparation to be effective
† Always conduct pre-interview research
REQUIREMENTS GATHERING METHODS 109
141.
† Establish objectivesfor each interview
† Decide on the question types
† Also encourage users to prepare for the interview
Group Sessions
† Groups of 20 or fewer persons at a time
† Use only after getting a baseline understanding of the requirements
† Not good for initial data gathering
† Use when free flow of ideas is essential
† Useful for confirming requirements
† Efficient when users are scattered across locations
† Need to be very well organized
Questionnaires
† Can gather lots of requirements quickly
† Useful when people to be questioned are widely dispersed
† Good in exploration phase to get overall reactions
† May be used for people whose work schedule is too tight for interviews
† However, questionnaires do not permit interactive responses like interviews
Types of Questions
In all these three different methods of gathering requirements we use questions to elicit infor-
mation. It is, therefore, very important to understand the types of questions that may be used
and the effectiveness of each.
Open-Ended Questions. These open up options for interviewees to respond. The
benefits of using open-ended questions are they put interviewees at ease, allow insights
into values and beliefs, provides exposure to interviewees’ vocabulary, opens up
opportunities for more questioning, and are interesting and spontaneous. Drawbacks
are that they could result in too much unnecessary detail, the risk of losing control
in the interview, they may take too much time, not proportional to the information
gathered.
Closed Questions. These allow limited responses to interviewees. Some closed
questions are bipolar in the sense that these look for “Yes or No” type answers.
Closed questions enable you to save time and get to the point quickly and
easily. Closed questions allow for interviews to be compared, provide control over
the interview and the ability to cover a lot of ground quickly, and are likely to
gather only the relevant information. Drawbacks are the inability to get rich details,
less chance for building trust and rapport between interviewer and interviewee, and
they may become boring and dull.
Probes. These are really follow-up questions. Probes may be used after open-ended or
closed questions. The intention would be to go beyond the initial questions and
answers. Probes are useful in drawing out an interviewee’s point of view.
110 DEFINING THE BUSINESS REQUIREMENTS
142.
Arrangement of Questions
Forinformation gathering using the proper types of questions alone is not enough. You must
be able to arrange the questioning in an effective sequence to suit the audience and the pur-
pose. The following structures for arranging questions are used in practice.
Pyramid Structure. This is an inductive method of arranging the questions. You begin
with very specific closed questions and then expand the topics with open-ended ques-
tions. This structure is useful when the interviewee needs to warm up to the topics
being discussed. Use this structure when general views of the topics are to be extracted
at the end.
Funnel Structure. This is a deductive method. Begin with general open-ended questions
and then narrow the topics with specific, closed questions. This structure is useful
when the interviewee is emotional about the topics under discussion. Use this structure
when gradual levels of details are needed at the end.
Diamond-Shaped Structure. In this case, you warm up the interview with specific closed
questions. You then proceed towards broad, general, open-ended questions. Finally
you narrow the interview and achieve closure with specific closed questions.
Usually, this structure is better than the other two. However, this structure may
lengthen the interview.
Interview Techniques
The interview sessions can use up a good percentage of the project time. Therefore, these
will have to be organized and managed well. Before your project team launches the interview
process, make sure the following major tasks are completed.
† Select and train the project team members conducting the interviews
† Assign specific roles for each team member (lead interviewer/scribe)
† Prepare a list of users to be interviewed and prepare a broad schedule
† List your expectations from each set of interviews
† Complete pre-interview research
† Prepare interview questionnaires
† Prepare the users for the interviews
† Conduct a kick-off meeting of all users to be interviewed
Most of the users you will be interviewing fall into three broad categories: senior execu-
tives, departmental managers/analysts, and IT department professionals. What are the
expectations from interviewing each of these categories? Figure 5-7 shows the baseline
expectations.
Pre-interview research is important for the success of the interviews. Here is a list of some
key research topics:
† History and current structure of the business unit
† Number of employees and their roles and responsibilities
† Locations of the users
REQUIREMENTS GATHERING METHODS 111
143.
† Primary purposeof the business unit in the enterprise
† Relationship of the business unit to the strategic initiatives of the enterprise
† Secondary purposes of the business unit
† Relationship of the business unit to other units and to outside organizations
† Contribution of the business unit to corporate revenues and costs
† The company’s market
† Competition in the market
Some tips on the nature of questions to be asked in the interviews follow.
Current Information Sources Which operational systems generate data about impor-
tant business subject areas? What are the types of computer systems that support these sub-
ject areas? What information is currently delivered in existing reports and online queries?
How about the level of details in the existing information delivery systems?
Subject Areas
Which subject areas are most valuable for analysis?
What are the business dimensions? Do these have natural hierarchies?
What are the business partitions for decision making?
• Organization objectives
• Criteria for measuring success
• Key business issues, current & future
• Problem identification
• Vision and direction for the organization
• Anticipated usage of the DW
• Departmental objectives
• Success metrics
• Factors limiting success
• Key business issues
• Products & Services
• Useful business dimensions for analysis
• Anticipated usage of the DW
Senior Executives Dept. Managers / Analysts
• Key operational source systems
• Current information delivery processes
• Types of routine analysis
• Known quality issues
• Current IT support for information requests
• Concerns about proposed DW
IT Dept. Professionals
Figure 5-7 Expectations from interviews.
112 DEFINING THE BUSINESS REQUIREMENTS
144.
Do the variouslocations need global information or just local information for decision
making? What is the mix?
Are certain products and services offered only in certain areas?
Key Performance Metrics
How is the performance of the business unit currently measured?
What are the critical success factors and how are these monitored?
How do the key metrics roll up?
Are all markets measured in the same way?
Information Frequency
How often must the data be updated for decision making?
What is the time frame?
How does each type of analysis compare the metrics over time?
What is the timeliness requirement for the information in the data warehouse?
As initial documentation for the requirements definition, prepare interview write-ups
using this general outline:
1. User profile
2. Background and objectives
3. Information requirements
4. Analytical requirements
5. Current tools used
6. Success criteria
7. Useful business metrics
8. Relevant business dimensions
Adapting the JAD Methodology
If you are able to gather a lot of baseline data up front from different sources, group sessions
may be a good substitute for individual interviews. In this method, you are able to get a
number of interested users to meet together in group sessions. On the whole, this method
could result in fewer group sessions than individual interview sessions. The overall time
for requirements gathering may prove to be less and, therefore, shorten the project. Also,
group sessions may be more effective if the users are dispersed in remote locations.
Joint application development (JAD) techniques were successfully utilized to gather
requirements for operational systems in the 1980s. Users of computer systems had grown
to be more computer-savvy and their direct participation in the development of applications
proved to be very useful.
As the name implies, JAD is a joint process, with all the concerned groups getting
together for a well-defined purpose. It is a methodology for developing computer
REQUIREMENTS GATHERING METHODS 113
145.
applications jointly bythe users and the IT professionals in a well-structured manner. JAD
centers around discussion workshops lasting a certain number of days under the direction of
a facilitator. Under suitable conditions, the JAD approach may be adapted for building a data
warehouse.
JAD consists of a five-phased approach:
Project definition
Complete high-level interviews
Conduct management interviews
Prepare management definition guide
Research
Become familiar with the business area and systems
Document user information requirements
Document business processes
Gather preliminary information
Prepare agenda for the sessions
Preparation
Create working document from previous phase
Train the scribes
Prepare visual aids
Conduct presession meetings
Set up a venue for the sessions
Prepare a checklist for objectives
JAD sessions
Open with a review of the agenda and purpose
Review assumptions
Review data requirements
Review business metrics and dimensions
Discuss dimension hierarchies and roll-ups
Resolve all open issues
Close sessions with lists of action items
Final document
Convert the working document
Map the gathered information
List all data sources
Identify all business metrics
List all business dimensions and hierarchies
Assemble and edit the document
Conduct review sessions
Get final approvals
Establish procedure to change requirements
114 DEFINING THE BUSINESS REQUIREMENTS
146.
The success ofa project using the JAD approach very much depends on the composition
of the JAD team. The size and mix of the team will vary based on the nature and purpose of
the data warehouse. The typical composition, however, must have pertinent roles present in
the team. For each of the following roles, usually one or more persons are assigned.
Executive sponsor—Person controlling the funding, providing the direction, and empow-
ering the team members
Facilitator—Person guiding the team throughout the JAD process
Scribe—Person designated to record all decisions
Full-time participants—Everyone involved in making decisions about the data warehouse
On-call participants—Persons affected by the project, but only in specific areas
Observers—Persons who would like to sit in on specific sessions without participating in
the decision making
Using Questionnaires
Because using questionnaires is not interactive, questionnaires must be designed with much
care. We note important points relating to significant aspects of administering question-
naires. If properly done, questionnaires may form an important method for gathering require-
ments for your data warehouse.
Type and Choice of Questions. You may use both open-ended and closed questions in a
questionnaire. Choice of language is important. Use the language of the respondents,
not cryptic technical jargon. Be specific, not vague. Keep questions short and precise.
Avoid objectionable, politically incorrect language. Avoid talking down to the respon-
dents. Target the questions to the appropriate respondent group.
Application of Scales. Questionnaires usually contain nominal and interval scales. These
make it easy to respond. Nominal scales are used to classify things. Interval scales are
used for quantitative analysis.
Questionnaire Design. The order of the questions is important. Start the questionnaire
with less controversial, highly important questions. Cluster questions with similar con-
tent. The design must be inviting and pleasing. Allow ample white space. Provide suf-
ficient space for responses. Make it easy to mark or indicate responses while using
scales. Maintain a consistent style.
Administering Questionnaires. Carefully decide on who gets the questionnaire. Ensure
that there are no omissions. Some ways of administering the questionnaires include
at an initial group session, through personal delivery and later collection, self-
administration by respondents, by mail to respondent locations, and electronically
via e-mail.
Review of Existing Documentation
Although most of the requirements gathering will be done through interviews, group ses-
sions, and questionnaires, you will be able to gather useful information from the review of
existing documentation. Review of existing documentation can be done by the project
REQUIREMENTS GATHERING METHODS 115
147.
team without toomuch involvement from the users of the business units. Scheduling of
the review of existing documentation involves only the members of the project team.
Documentation from User Departments What can you get out of the existing
documentation? First, let us look at the reports and screens used by the users in the business
areas that will be using the data warehouse. You need to find out everything about the func-
tions of the business units, the operational information gathered and used by these users,
what is important to them, and whether they use any of the existing reports for analysis.
You need to look at the user documentation for all the operational systems used. You
need to grasp what is important to the users.
The business units usually have documentation on the processes and procedures in those
units. How do the users perform their functions? Review in detail all the processes and pro-
cedures. You are trying to find out what types of analyses the users in these business units are
likely to be interested in. Review the documentation and then augment what you have
learned from the documentation prepared from the interview sessions.
Documentation from IT The documentation from the users and the interviews with the
users will give you information on the metrics used for analysis and the business dimensions
along which the analysis gets done. But from where do you get the data for the metrics and
business dimensions? These will have to come from internal operational systems. You need
to know what is available in the source systems.
Where do you turn for information available in the source systems? This is where the
operational system DBAs and application experts from IT become very important for gath-
ering data. The DBAs will provide you with all the data structures, individual data elements,
attributes, value domains, and relationships among fields and data structures. From the infor-
mation you have gathered from the users, you will then be able to relate the user information
to the source systems as ascertained from the IT personnel.
Work with your DBAs to obtain copies of the data dictionary or data catalog entries for
the relevant source systems. Study the data structures, data fields, and relationships.
Eventually, you will be populating the data warehouse from these source systems, so you
need to understand completely the source data, the source platforms, and the operating
systems.
Now let us turn to the IT application experts. These professionals will give you the
business rules and help you to understand and appreciate the various data elements from
the source systems. You will learn about data ownership, about people responsible for
data quality, and how data is gathered and processed in the source systems. Review the
programs and modules that make up the source systems. Look at the copy books inside
the programs to understand how the data structures are used in the programs.
REQUIREMENTS DEFINITION: SCOPE AND CONTENT
Formal documentation is often neglected in computer system projects. The project team goes
through the requirements definition phase. They conduct the interviews and group sessions.
They review the existing documentation. They gather enough material to support the next
phases in the system development life cycle. But they skip the detailed documentation of
the requirements definition.
116 DEFINING THE BUSINESS REQUIREMENTS
148.
There are severalreasons why you should commit the results of your requirements defi-
nition phase to writing. First of all, the requirements definition document is the basis for the
next phases. If project team members have to leave the project for any reason at all, the pro-
ject will not suffer from people walking away with the knowledge they have gathered. The
formal documentation will also validate your findings when reviewed with the users.
We will come up with a suggested outline for the formal requirements definition docu-
ment. Before that, let us look at the types of information this document must contain.
Data Sources
This piece of information is essential in the requirements definition document. Include all the
details you have gathered about the source systems. You will be using the source system data
in the data warehouse. You will collect the data from these source systems, merge and inte-
grate it, transform the data appropriately, and populate the data warehouse.
Typically, the requirements definition document should include the following
information:
† Available data sources
† Data structures within the data sources
† Location of the data sources
† Operating systems, networks, protocols, and client architectures
† Data extraction procedures
† Availability of historical data
Data Transformation
It is not sufficient just to list the possible data sources. You will list relevant data structures as
possible sources because of the relationships of the data structures with the potential data in
the data warehouse. Once you have listed the data sources, you need to determine how the
source data will have to be transformed appropriately into the type of data suitable to be
stored in the data warehouse.
In your requirements definition document, include details of data transformation. This
will necessarily involve mapping of source data to the data in the data warehouse.
Indicate where the data about your metrics and business dimensions will come from.
Describe the merging, conversion, and splitting that need to take place before moving the
data into the data warehouse.
Data Storage
From your interviews with the users, you would have found out the level of detailed data you
need to keep in the data warehouse. You will have an idea of the number of data marts you
need for supporting the users. Also, you will know the details of the metrics and the business
dimensions.
When you find out about the types of analyses the users will usually do, you can deter-
mine the types of aggregations that must be kept in the data warehouse. This will give you
information about additional storage requirements.
REQUIREMENTS DEFINITION: SCOPE AND CONTENT 117
149.
Your requirements definitiondocument must include sufficient details about storage
requirements. Prepare preliminary estimates on the amount of storage needed for detailed
and summary data. Estimate how much historical and archived data needs to be in the
data warehouse.
Information Delivery
Your requirements definition document must contain the following requirements on infor-
mation delivery to the users:
† Drill-down analysis
† Roll-up analysis
† Drill-through analysis
† Slicing and dicing analysis
† Ad hoc reports
† Online monitoring tools such as dashboards and scorecards
Information Package Diagrams
The presence of information package diagrams in the requirements definition document is
the major and significant difference between operational systems and data warehouse sys-
tems. Remember that information package diagrams are the best approach for determining
requirements for a data warehouse.
The information package diagrams crystallize the information requirements for the data
warehouse. They contain the critical metrics measuring the performance of the business
units, the business dimensions along which the metrics are analyzed, and the details of
how drill-down and roll-up analyses are done.
Spend as much time as needed to make sure that the information package diagrams are
complete and accurate. Your data design for the data warehouse will be totally dependent
on the accuracy and adequacy of the information package diagrams.
Requirements Definition Document Outline
1. Introduction. State the purpose and scope of the project. Include broad project justi-
fication. Provide an executive summary of each subsequent section.
2. General Requirements Descriptions. Describe the source systems reviewed. Include
interview summaries. Broadly state what types of information requirements are needed
in the data warehouse.
3. Specific Requirements. Include details of source data needed. List the data transform-
ation and storage requirements. Describe the types of information delivery methods
needed by the users.
4. Information Packages. Provide as much detail as possible for each information pack-
age. Include this in the form of package diagrams.
5. Other Requirements. Cover miscellaneous requirements such as data extract frequen-
cies, data loading methods, and locations to which information must be delivered.
118 DEFINING THE BUSINESS REQUIREMENTS
150.
6. User Expectations.State the expectations in terms of problems and opportunities.
Indicate how the users expect to use the data warehouse.
7. User Participation and Sign-Off. List the tasks and activities in which the users are
expected to participate throughout the development life cycle.
8. General Implementation Plan. At this stage, give a high-level plan for implementation.
CHAPTER SUMMARY
† Unlike the requirements for an operational system, the requirements for a data ware-
house are quite nebulous.
† Business data is dimensional in nature and the users of the data warehouse think in
terms of business dimensions.
† A requirements definition for the data warehouse can, therefore, be based on business
dimensions such as product, geography, time, and promotion.
† Information packages—a new and useful concept—are the backbone of the require-
ments definition. An information package records the critical measurements or facts
and business dimensions along which the facts are normally analyzed.
† Interviews, group sessions, and questionnaires are standard methods for collecting
requirements.
† Key people to be interviewed or to be included in group sessions are senior executives
(including the sponsors), departmental managers, business analysts, and operational
systems DBAs.
† Review all existing documentation of related operational systems.
† Scope and content of the requirements definition document include data sources, data
transformation, data storage, information delivery, and information package diagrams.
REVIEW QUESTIONS
1. What are the essential differences between defining requirements for operational sys-
tems and for data warehouses?
2. Explain business dimensions. Why and how can business dimensions be useful for
defining requirements for the data warehouse?
3. What data does an information package contain?
4. What are dimension hierarchies? Give three examples.
5. Explain business metrics or facts with five examples.
6. List the types of users who must be interviewed for collecting requirements. What infor-
mation can you expect to get from them?
7. In which situations can JAD methodology be successful for collecting requirements?
8. Why are reviews of existing documents important? What can you expect to get out of
such reviews?
REVIEW QUESTIONS 119
151.
9. Various datasources feed the data warehouse. What are the pieces of information you
need to get about data sources?
10. Name any five major components of the formal requirements definition document.
Describe what goes into each of these components.
EXERCISES
1. Indicate if true or false:
A. Requirements definitions for a sales processing operational system and a sales analy-
sis data warehouse are very similar.
B. Managers think in terms of business dimensions for analysis.
C. Unit sales and product costs are examples of business dimensions.
D. Dimension hierarchies relate to drill-down analysis.
E. Categories are attributes of business dimensions.
F. JAD is a methodology for one-on-one interviews.
G. Questionnaires provide the least interactive method for gathering requirements.
H. The departmental users provide information about the company’s overall direction.
I. Departmental managers are very good sources for information on data structures of
operational systems.
J. Information package diagrams are essential parts of the formal requirements defi-
nition document.
2. You are the vice president of marketing for a nation-wide appliance manufacturer with
three production plants. Describe any three different ways you will tend to analyze
your sales. What are the business dimensions for your analysis?
3. BigBook, Inc. is a large book distributor with domestic and international distribution
channels. The company orders from publishers and distributes publications to all the
leading booksellers. Initially, you want to build a data warehouse to analyze shipments
that are made from the company’s many warehouses. Determine the metrics or facts
and the business dimensions. Prepare an information package diagram.
4. You are on the data warehouse project of AuctionsPlus.com, an Internet auction company
selling upscale works of art. Your responsibility is to gather requirements for sales analy-
sis. Find out the key metrics, business dimensions, hierarchies, and categories. Draw the
information package diagram.
5. Create a detailed outline for the formal requirements definition document for a data
warehouse to analyze product profitability of a large department store chain.
120 DEFINING THE BUSINESS REQUIREMENTS
152.
CHAPTER 6
REQUIREMENTS ASTHE DRIVING
FORCE FOR DATA WAREHOUSING
CHAPTER OBJECTIVES
† Understand why business requirements are the driving force
† Discuss how requirements drive every development phase
† Specifically learn how requirements influence data design
† Review the impact of requirements on architecture
† Note the special considerations for ETL and metadata
† Examine how requirements shape information delivery
In the previous chapter, we discussed the requirements definition phase in detail. You
learned that gathering requirements for a data warehouse is not the same as defining the
requirements for an operational system. We arrived at a new way of creating information
packages to express the requirements. Finally, we put everything together and produced
the requirements definition document.
When you design and develop any system, it is obvious that the system must reflect
exactly what the users need to perform their business processes. They should have the
proper GUI screens, the system must have the correct logic to perform the functions, and
the users must receive the required outputs including screens and reports. Requirements
definition guides the whole process of system design and development.
What about the requirements definition for a data warehouse? If accurate requirements
definition is important for any operational system, it is many times more important for a
data warehouse. Why? The data warehouse environment is an information delivery system
where the users themselves will access the data warehouse repository and create their own
outputs. In an operational system, you provide the users with predefined outputs.
Data Warehousing Fundamentals for IT Professionals, Second Edition. By Paulraj Ponniah
Copyright # 2010 John Wiley & Sons, Inc.
121
153.
It is thereforeextremely important that your data warehouse contains the right elements of
information in the most optimal formats. Your users must be able to find all the strategic
information they would need in exactly the way they want it. They must be able to access
the data warehouse easily, run their queries, get results painlessly, and perform various
types of data analysis without any problems.
In a data warehouse, business requirements of the users form the single and most powerful
driving force. Every task that is performed in every phase in the development of the data
warehouse is determined by the requirements. Every decision made during the design
phase—whether it may be the data design, the design of the architecture, the configuration
of the infrastructure, or the scheme of the information delivery methods—is totally influ-
enced by the requirements. Figure 6-1 depicts this fundamental principle.
Because requirements form the primary driving force for every phase of the development
process, you need to ensure especially that your requirements definition contains adequate
details to support each phase. This chapter particularly highlights a few significant develop-
ment activities and specifies how requirements must guide, influence, and direct these activi-
ties. Why is this kind of special attention necessary? When you gather business requirements
andproducetherequirementsdefinitiondocument,youmustalwaysbearinmindthatwhatyou
are doing in this phase of the project is of immense importance to every other phase. Your
requirements definition will drive every phase of the project, so please pay special attention.
DATA DESIGN
In the data design phase you come up with the data model for the following data repositories:
† The staging area where you transform, cleanse, and integrate the data from the source
systems in preparation for loading into the data warehouse repository
† The data warehouse repository itself
PLANNING
AND
MANAGE-
MENT
DESIGN
Architecture
Infrastructure
Data Acquisition
Data Storage
Information Delivery
MAIN-
TENANCE
DEPLOY-
MENT
CONSTRUCTION
Architecture
Infrastructure
Data Acquisition
Data Storage
Information Delivery
Figure 6-1 Business requirements as the driving force.
122 REQUIREMENTS AS THE DRIVING FORCE FOR DATA WAREHOUSING
154.
If you areadopting the practical approach of building your data warehouse as a conglom-
eration of conformed data marts, your data model at this point will consist of the dimensional
data model for your first set of data marts. On the other hand, your company may decide to
build the large corporate-wide data warehouse first along with the initial data mart fed by the
large data warehouse. In this case, your data model will include both the data model for the
large data warehouse and the data model for the initial data mart.
These data models will form the blueprint for the physical design and implementation of
the data repositories. You will be using these models for communicating among the team
members on what data elements will be available in the data warehouse and how they
will all fit together. You will be walking through these data models with the users to
inform them of the data content and the data relationships. The data models for individual
data marts play a strong and useful role in communication with the users.
Which portions of the requirements definition drive the data design? To understand the
impact of requirements on data design, imagine the data model as a pyramid of data contents
as shown in Figure 6-2. The base of the pyramid represents the data model for the enterprise-
wide data repository and the top half of the pyramid denotes the dimensional data model for
the data marts. What do you need in the requirements definition to build and meld the two
halves of the pyramid? Two basic pieces of information are needed: the source system data
models and the information package diagrams.
The data models of the current source systems will be used for the lower half. Therefore,
ensure that your requirements definition document contains adequate information about the
components and the relationships of the source system data. In the previous chapter, we
discussed information package diagrams in sufficient detail. Please take special care that
the information package diagrams that are part of the requirements definition document
truly reflect the actual business requirements. Otherwise, your data model will not signify
what the users really want to see in the data warehouse.
Structure for Business Dimensions
In the data models for the data marts, the business dimensions along which the users analyze
the business metrics must be featured prominently. In the last chapter, while discussing
RELATIONAL
MODEL
DIMEN-
SIONAL
MODEL
Information
Package
Diagrams
Enterprise
Data
Model
Enterprise Data
Warehouse
Data Marts
(Conformed /
Dependent)
Figure 6-2 Requirements driving the data model.
DATA DESIGN 123
155.
information package diagrams,we reviewed a few examples. In an information package
diagram, the business dimensions are listed as column headings. For example, look at the
business dimensions for Automaker Sales in Figure 6-3, which is a partial reproduction
of the earlier Figure 5-5.
If you create a data model for this data mart, the business dimensions as shown in the
figure must necessarily be included in the model. The usefulness of the data mart is directly
related to the accuracy of the data model. Where does this lead you? It leads you to the
paramount importance of having the appropriate dimensions and the right contents in the
information package diagrams.
Structure for Key Measurements
Key measurements are the metrics or measures that are used for business analysis and moni-
toring. Users measure performance by using and comparing key measurements. For auto-
maker sales, the key measurements include actual sale price, MSRP, options price, full
price, and so on. Users measure their success in terms of the key measurements. They
tend to make calculations and summarizations in terms of such metrics.
In addition to getting query results based on any combination of the dimensions, the facts
or metrics are used for analysis. When your users analyze the sales along the product, time,
and location dimensions, they see the results displayed in the metrics such as sale units,
revenue, cost, and profit margin. In order for the users to review the results in proper key
measurements, you have to guarantee that the information package diagrams you include
as part of the requirements definition contain all the relevant key measurements.
Metrics: Actual Sale Price, MSRP, Options Price, Full Price, Dealer Add-ons,
Dealer Credits, Dealer Invoice, Down Payment
Time Product
Payment
Method
Customer
Demo-
graphics
Year
Dimensions
Information Package Diagram: Automaker Sales
Quarter
Month
Date
Day of
Week
Day of
Month
Season
Holiday
Flag
Model
Name
Model
Year
Package
Styling
Product
Line
Product
Category
Exterior
Color
Interior
Color
First Year
Finance
Type
Term
(Months)
Interest
Rate
Agent
Dealer
Age
Gender
Income
Range
Marital
Status
House-
hold Size
Vehicles
Owned
Home
Value
Own or
Rent
Dealer
Name
City
State
Single
Brand Flag
Date First
Operation
DIMENSIONAL
DATA
MODEL
Figure 6-3 Business dimensions in the data model.
124 REQUIREMENTS AS THE DRIVING FORCE FOR DATA WAREHOUSING
156.
Business dimensions andkey measures form the backbone of the dimensional data
model. The structure of the data model is directly related to the number of business dimen-
sions. The data content of each business dimension forms part of the data model. For
example, if an information package diagram has product, customer, time, and location as
the business dimensions, these four dimensions will be four distinct components in the struc-
ture of the data model. In addition to the business dimensions, the group of key measure-
ments also forms another distinct component of the data model.
Levels of Detail
What else must be reflected in the data model? To answer this question, let us scrutinize
how your users plan to use the data warehouse for analysis. Let us take a specific example.
The senior analyst wants to analyze the sales in the various regions. First he or she starts
with the total countrywide sales by product in this year. Then the next step is to view
total countrywide sales by product in individual regions during the year. Moving on, the
next step is to get a breakdown by quarters. After this step, the user may want to get
comparisons with the budget and with the prior year performance.
What we observe is that in this kind of analysis you need to provide drill-down and roll-up
facilities for analysis. Do you want to keep data at the lowest level of detail? If so, when your
user desires to see countrywide totals for the full year, the system must do the aggregation
during analysis while the user is waiting at the workstation. On the other hand, do you
have to keep the details for displaying data at the lowest levels, and summaries for displaying
data at higher levels of aggregation?
This discussion brings us to another specific aspect of requirements definition as it relates
to the data model. If you need summaries in your data warehouse, then your data model must
include structures to hold details as well as summary data. If you can afford to let the system
sum up on the fly during analysis, then your data model need not have summary structures.
Find out about the essential drill-down and roll-up functions and include enough particulars
about the types of summary and detail levels of data your data warehouse must hold.
THE ARCHITECTURAL PLAN
You know that data warehouse architecture refers to the proper arrangement of the architec-
tural components for maximum benefit. How do you plan your data warehouse architecture?
Basically, every data warehouse is composed of pretty much the same components.
Therefore, when you are planning the architecture, you are not inventing any new com-
ponents to go into your particular warehouse. You are really sizing up each component
for your environment. You are planning how all the components must be knit together so
that they will work as an integrated system.
Before we proceed further, let us recap the major architectural components as discussed
in Chapter 2:
Source data
Production data
Internal data
Archived data
External data
THE ARCHITECTURAL PLAN 125
157.
Data staging
Data extraction
Datatransformation
Data loading
Data storage
Information delivery
Metadata
Management and control
When you plan the overall architecture for your data warehouse, you will be setting the
scope and contents of each of these components. For example, in your company all of the
source data might fortunately reside on a single computing platform and also on a single rela-
tional database. If this were the case, then the data extraction component in the architecture
would be substantially smaller and straightforward. Again, if your company decides on using
just the facilities provided by the DBMS, such as alias definition and comments features, for
metadata storage, then your metadata component would be simple.
Planning the architecture, therefore, involves reviewing each of the components in the
light of your particular context, and setting the parameters. Also, it involves the interfaces
among the various components. How can the management and control module be designed
to coordinate and control the functions of the different components? What is the information
you need to do the planning? How will you know to size up each component and provide the
appropriate infrastructure to support it? Of course, the answer is business requirements. All
the information you need to plan the architecture must come from the requirements defi-
nition. In the following subsections, we will explore the importance of business requirements
for the architectural plan. We will take each component and review how proper requirements
drive the size and content of the data warehouse.
Composition of the Components
Let us review each component and ascertain what exactly is needed in the requirements
definition to plan for the data warehouse architecture. Again, remember that planning for
the architecture involves the determination of the size and content of each component. In
the following list, the bulleted points under each component indicate the type of information
that must be contained in the requirements definition to drive the architectural plan.
† Source Data
Operational source systems
Computing platforms, operating systems, databases, files
Departmental data such as files, documents, and spreadsheets
External data sources
† Data Staging
Data mapping between data sources and staging area data structures
Data transformations
Data cleansing
Data integration
126 REQUIREMENTS AS THE DRIVING FORCE FOR DATA WAREHOUSING
158.
† Data Storage
Sizeof extracted and integrated data
DBMS features
Growth potential
Centralized for enterprise data warehouse
Data marts—conformed, dependent, independent, federated
† Information Delivery
Types and number of users
Types of queries and reports
Classes of analysis
Dashboards/scorecards
Data mining operations
Front-end DSS applications
† Metadata
Operational metadata
ETL (data extraction, transformation, and loading) metadata
End-user metadata
Metadata storage
† Management and Control
Data loading
External sources
Alert systems
End-user information delivery
Figure 6-4 provides a useful summary of the architectural components driven by require-
ments. The figure indicates the impact of business requirements on the data warehouse
architecture.
Special Considerations
Having reviewed the impact of requirements on the architectural components in some detail,
we now turn our attention to a few functions that deserve special consideration. We need to
bring out these special considerations because if these are missed in the requirements defi-
nition, serious consequences will follow. When you are in the requirements definition phase,
you have to pay special attention to these factors.
Data Extraction, Transformation, and Loading (ETL) The activities that relate to
ETL in a data warehouse are by far the most time-consuming and human-intensive. Special
recognition of the extent and complexity of these activities in the requirements will go a long
way in easing the pain while setting up the architecture. If you are planning for real time data
warehousing, then ETL functions need special attention. Techniques must be adopted for
real time data extraction, rapid transformation and integration of data, and updates to the
data warehouse in real time with near-zero latency. Let us separate out the functions and
state the special considerations needed in the requirements definition.
THE ARCHITECTURAL PLAN 127
159.
Data Extraction Clearlyidentify all the internal data sources. Specify all the computing
platforms and source files from which the data is to be extracted. If you are going to include
external data sources, determine the compatibility of your data structures with those of the
outside sources. Also indicate the methods for data extraction.
Data Transformation Many types of transformation functions are needed before data can
be mapped and prepared for loading into the data warehouse repository. These functions
include input selection, separation of input structures, normalization and denormalization
of source structures, aggregation, conversion, resolving of missing values, and conversions
of names and addresses. In practice, this turns out to be a long and complex list of functions.
Examine each data element planned to be stored in the data warehouse against the source
data elements and ascertain the mappings and transformations.
Data Loading Define the initial load. Determine how often each major group of data must
be kept up-to-date in the data warehouse. How much of the updates will be nightly updates?
Does your environment warrant more than one update cycle in a day? How are the changes
going to be captured in the source systems? Define how the daily, weekly, and monthly
updates will be initiated and carried out. If your plan includes real time data warehousing,
specify the method for real time updates.
Data Quality Bad data leads to bad decisions. No matter how well you tune your data
warehouse, and no matter how adeptly you provide for queries and analysis functions to
the users, if the data quality of your data warehouse is suspect, the users will quickly lose
confidence and flee the data warehouse. Even simple discrepancies can result in serious
repercussions while making strategic decisions with far-reaching consequences. Data quality
Management & Control
Source Data
Data Staging
Data Storage
I
n
f
o
r
m
a
t
i
o
n
D
e
l
i
v
e
r
y
Metadata
Figure 6-4 Impact of requirements on architecture.
128 REQUIREMENTS AS THE DRIVING FORCE FOR DATA WAREHOUSING
160.
in a datawarehouse is sacrosanct. Therefore, right in the early phase of requirements defi-
nition, identify potential sources of data pollution in the source systems. Also, be aware
of all the possible types of data quality problems likely to be encountered in your operational
systems. Note the following tips.
Data Pollution Sources
System conversions and migrations
Heterogeneous systems integration
Inadequate database design of source systems
Data aging
Incomplete information from customers
Input errors
Internationalization/localization of systems
Lack of data management policies/procedures
Types of Data Quality Problems
Dummy values in source system fields
Absence of data in source system fields
Multipurpose fields
Cryptic data
Contradicting data
Improper use of name and address lines
Violation of business rules
Reused primary keys
Nonunique identifiers
Metadata You already know that metadata in a data warehouse is not merely data dic-
tionary entries. Metadata in a data warehouse is much more than details that can be carried
in a data dictionary or data catalog. Metadata acts as a glue to tie all the components together.
When data moves from one component to another, that movement is governed by the
relevant portion of metadata. When a user queries the data warehouse, metadata acts as
the information resource to connect the query parameters with the database components.
Earlier, we had categorized the metadata in a data warehouse into three groups: oper-
ational, data extraction and transformation, and end-user. Figure 6-5 displays the impact
of business requirements on the metadata architectural component.
It is needless to reiterate the significance of the metadata component. Study the figure and
apply it to your data warehouse project. For each type of metadata, figure out how much
detail would be necessary in your requirements definition. Have sufficient detail to enable
vital decisions such as choosing the type of metadata repository and reckoning whether
the repository must be centralized or distributed.
Tools and Products
When tools are mentioned in the data warehousing context, you probably think only of
end-user tools. Many people do so. But for building and maintaining your data warehouse,
you need many types of tools to support the various components of the architecture.
THE ARCHITECTURAL PLAN 129
161.
As we discussthe impact of requirements on the data warehouse architecture in this sec-
tion, we want to bring up the subject of tools and products for two reasons. First, require-
ments do not directly impact the selection of tools. Do not select the tools based on
requirements and then adjust the architecture to suit the tools. This is like putting the cart
before the horse. Design the data warehouse architecture and then look for the proper
tools to support the architecture. A specific tool, ideally suited for the functions in one
data warehouse, may be a complete misfit in another data warehouse. That is because the
architectures are different. What do we mean by the statement that the architectures are
different? Although the architectural components are generally the same in both data ware-
houses, the scope, size, content, and the make-up of each component are not the same.
The second reason for mentioning tools and products is this. While collecting require-
ments to plan the architecture, sometimes you may feel constrained to make the architecture
suit the requirements. You may think that you will not be able to design the type of archi-
tecture dictated by the requirements because appropriate tools to support that type of archi-
tecture may not be available. Please note that there are numerous production-worthy tools
available in the market. We want to point out that once your architectural design is com-
pleted, you can obtain the most suitable third-party tools and products.
In general, tools are available for the following functions:
† Data Extraction and Transformation
Middleware
Data extraction
Data transformation
Data quality assurance
Load image creation
† Warehouse Storage
Data marts
Meta data
OPERATIONAL
Source system data
structures, External
data formats
EXTRACTION /
TRANSFORMATION
Data cleansing,
conversion, integration
END-USER
Querying, reporting,
Analysis, OLAP,
Special Apps.
DATA
WAREHOUSE
METADATA
BUSINESS
REQUIREMENTS
Figure 6-5 Impact of requirements on metadata.
130 REQUIREMENTS AS THE DRIVING FORCE FOR DATA WAREHOUSING
162.
† Information Access/Delivery
Reportwriters
Query processors
Alert systems
Dashboards
Scorecards
DSS applications
Data mining
DATA STORAGE SPECIFICATIONS
If your company is adopting the top-down approach of developing the data warehouse, then
you have to define the storage specifications for
† The data staging area
† The overall corporate data warehouse
† Each of the dependent data marts, beginning with the first
† Any multidimensional databases for OLAP
Alternatively, if your company opts for the bottom-up approach, you need specifica-
tions for
† The data staging area
† Each of the conformed data marts, beginning with the first
† Any multidimensional databases for OLAP
Typically, the overall corporate data warehouse will be based on the relational model sup-
ported by a relational database management system (RDBMS). The data marts are usually
structured on the dimensional model implemented using an RDBMS. Many vendors offer
proprietary multidimensional database systems (MDDBs). Specification for your MDDB
will be based on your choice of vendor. The extent and sophistication of the staging area
depends on the complexity and breadth of data transformation, cleansing, and conversion.
The staging area may just be a bunch of flat files or, at the other extreme, a fully developed
relational database.
Whatever your choice of the database management system may be, that system will have
to interact with back-end and front-end tools. The back-end tools are the products for data
transformation, data cleansing, and data loading. The front-end tools relate to information
delivery to the users. If you are trying to find the best tools to suit your environment, the
chances are these tools may not be from the same vendors who supplied the database pro-
ducts. Therefore, one important criterion for the database management system is that the
system must be open. It must be compatible with the chosen back-end and front-end
tools. More recently many composite data warehouse appliance products are available.
These are integrated hardware/software bundles.
So what are we saying about the impact of business requirements on the data storage
specifications? Business requirements determine how robust and how open the database
DATA STORAGE SPECIFICATIONS 131
163.
systems must be.While defining requirements, bear in mind their influence on data storage
specifications and collect all the necessary details about the back-end and the front-end
architectural components.
We will next examine the impact of business requirements on the selection of the DBMS
and on estimating storage for the data warehouse.
DBMS Selection
In the requirements definition phase, when you are interviewing the users and having formal
meetings with them, you are not particularly discussing the type of DBMS to be selected.
However, many of the user requirements affect the selection of the proper DBMS. The rela-
tional DBMS products on the market are usually bundled with a set of tools for processing
queries, writing reports, interfacing with other products, and so on. Your choice of the
DBMS may be conditioned by its tool kit component. And the business requirements are
likely to determine the type of tool kit component needed. Broadly, the following elements
of business requirements affect the choice of the DBMS:
Level of User Experience. If the users are totally inexperienced with database systems,
the DBMS must have features to monitor and control runaway queries. On the other
hand, if many of your users are power users, then they will be formulating their own
queries. In this case, the DBMS must support an easy SQL-type language interface.
Types of Queries. The DBMS must have a powerful optimizer if most of the queries are
complex and produce large result sets. Alternatively, if there is an even mix of simple
and complex queries, there must be some sort of query management in the database
software to balance the query execution.
Need for Openness. The degree of openness depends on the back-end and front-end
architectural components and those, in turn, depend on the business requirements.
Data Loads. The data volumes and load frequencies determine the strengths in the areas
of data loading, recovery, and restart.
Metadata Management. If your metadata component does not have to be elaborate, then
a DBMS with an active data dictionary may be sufficient. Let your requirements defi-
nition reflect the type and extent of the metadata framework.
Data Repository Locations. Is your data warehouse going to reside in one central
location, or is it going to be distributed? The answer to this question will establish
whether the selected DBMS must support distributed databases.
Data Warehouse Growth. Your business requirements definition must contain infor-
mation on the estimated growth in the number of users, and in the number and com-
plexity of queries. The growth estimates will have a direct relation to how the selected
DBMS supports scalability.
Storage Sizing
How big will your data warehouse be? How much storage will be needed for all the data repo-
sitories? What is the total storage size? Answers to these questions will impact the type and
size of the storage medium. How do you find answers to these questions? Again, it goes back
to business requirements. In the requirements definition, you must have enough information
to answer these questions.
132 REQUIREMENTS AS THE DRIVING FORCE FOR DATA WAREHOUSING
164.
Let us summarize.You need to estimate the storage sizes for the following in the
requirements definition phase:
Data Staging Area. Calculate storage estimates for the data staging area of the overall
corporate data warehouse from the sizes of the source system data structures for
each business subject. Figure the data transformations and mapping into your calcu-
lation. For the data marts, initially estimate the staging area storage based on the
business dimensions and metrics for the first data mart.
Overall Corporate Data Warehouse. Estimate the storage size based on the data struc-
tures for each business subject. You know that data in the data warehouse is stored
by business subjects. For each business subject, list the various attributes, estimate
their field lengths, and arrive at the calculation for the storage needed for that subject.
Data Marts—Conformed, Independent, Dependent, or Federated. While defining
requirements, you create information diagrams. A set of these diagrams constitutes
a data mart. Each information diagram contains business dimensions and their attri-
butes. The information diagram also holds the metrics or business measurements
that are meant for analysis. Use the details of the business dimensions and business
measures found in the information diagrams to estimate the storage size for the data
marts. Begin with your first data mart.
Multidimensional Databases. These databases support OLAP or multidimensional
analysis. How much online analytical processing (OLAP) is necessary for your users?
The corporate data warehouse or the individual conformed or dependent data mart
supplies the data for the multidimensional databases. Work out the details of OLAP
planned for your users and then use those details to estimate storage for these multi-
dimensional databases.
INFORMATION DELIVERY STRATEGY
The impact of business requirements on the information delivery mechanism in a data ware-
house is straightforward. During the requirements definition phase, users tell you what infor-
mation they want to retrieve from the data warehouse. You record these requirements in the
requirements definition document. You then provide all the desired features and content in
the information delivery component. Does this sound simple and straightforward? Although
the impact appears to be straightforward and simple, there are several issues to be considered.
Many different aspects of the requirements impact various elements of the information
delivery component in different ways.
The composition of the user community that is expected to use the business intelligence
from the data warehouse affects the information delivery strategy. Are most of the potential
users of the data warehouse power users and analysts? Then the information strategy must be
slanted toward providing potent analytical tools. Are many of the users expecting to receive
preformatted reports and to run precomposed queries? Then query and reporting facilities in
the information delivery component must be strengthened.
The broad areas of the information delivery component directly impacted by business
requirements are:
† Queries and reports
† Types of analysis
INFORMATION DELIVERY STRATEGY 133
165.
† Information distribution
†Real time information delivery
† Decision support applications
† Growth and expansion
Figure 6-6 shows the impact of business requirements on information delivery.
A data warehouse exists for one reason and one reason alone—to provide strategic infor-
mation to users. Information delivery tops the list of architectural components. Most of the
other components are transparent to the users, but they see and experience what is made
available to them in the information delivery component. The importance of business
requirements relating to information delivery cannot be overemphasized.
The following subsections contain some valuable tips for requirements definition in order
to make the highly significant information delivery component effective and useful. Study
these carefully.
Queries and Reports
Find out who will be using predefined queries and preformatted reports. Get the specifica-
tions. Also, get the specifications for the production and distribution frequency for the
reports. How many users will be running the predefined queries? How often? The second
type of queries is not a set of predefined ones. In this case, the users formulate their own
queries and they themselves run the queries. Also in this class is the set of reports in
which the users supply the report parameters and print fairly sophisticated reports them-
selves. Get as many details of this type of queries and this type of report sets as you can.
Power users may run complex queries, most of the time as part of an interactive analysis
session. Apart from analysis, do your power users need the ability to run single complex
queries? Find out.
Types of Analysis
Most data warehouse and business intelligence environments provide several features to run
interactive sessions and perform complex data analysis. Analysis encompassing drill-down
Queries / Reports
Special Apps.
OLAP
Real-Time Info.
Complex queries
Online
Intranet
Internet
Data Mining
Information
Delivery
Component
BUSINESS
REQUIREMENTS
REQUIREMENTS
DEFINITION
ON
Users,
Locations,
Queries,
Reports,
Analysis
Figure 6-6 Impact of business requirements on information delivery.
134 REQUIREMENTS AS THE DRIVING FORCE FOR DATA WAREHOUSING
166.
and roll-up methodsis fairly common. Review with your users all the types of analysis they
would like to perform. Get information on the anticipated complexity of the types of
analysis.
In addition to the analysis performed directly on the data marts, most of today’s data ware-
house and business intelligence environments equip users with OLAP. Using the OLAP
facilities, users can perform multidimensional analysis and obtain multiple views of the
data from multidimensional databases. This type of analysis is called slicing and dicing.
Estimate the nature and extent of the drill-down and roll-up facilities to be provided for.
Determine how much slicing and dicing has to be made available.
Most of today’s business intelligence environments provide information through dash-
boards and scorecards. So, your information requirements must include details about the
composition of these two means of information delivery. Users may work with dashboards
interactively and perform various types of analysis.
Information Distribution
Where are your users? Are they in one location? Are they in one local site connected by a
local area network (LAN)? Are they spread out on a wide area network (WAN)? These fac-
tors determine how information must be distributed to your users. Clearly indicate these
details in the requirements definition.
In many companies, users get access to information through the corporate intranet. Web-
based technologies are used. If this is the case in your company, Web-based technologies
must be incorporated into the information delivery component. Let your requirements defi-
nition be explicit about these factors.
Real Time Information Delivery
If your data warehouse is configured to be a real time data warehouse where data updates are
carried out in real time or near real time, then your information requirements must have
special considerations for real time information delivery. Real time information delivery
right away implies more information with more people. Your data warehouse must enable
people with the information they need to make critical decisions all day, every day, and
must deliver this information in a way that is cost effective. To meet this challenge, you
must be able to deploy information delivery systems to very large numbers of people
across the enterprise, rapidly and at a low cost of ownership. You must be able to provide
information, in real time, to everyone who impacts key business processes: employees, man-
agement, suppliers, partners, and customers. How do you do this? Collect the details in the
requirements gathering phase.
The following factors need special considerations in your requirements definition:
delivery of information to people the way they want it—in the most commonly used formats,
e-mail, Web pages, Excel, PDF, and word-processing documents; implementation of a
personalized and organized approach to business intelligence that delivers information
broadly throughout the enterprise; use of Web-based technology to meet the ever-growing
demands for strategic information.
Decision Support Applications
These are specialized applications designed to support individual groups of users for specific
purposes. An executive information system provides decision support to senior executives.
INFORMATION DELIVERY STRATEGY 135
167.
A data miningapplication is a special-purpose system to discover new patterns of relation-
ships and predictive possibilities. We will discuss data mining in more detail in Chapter 17.
The data warehouse supplies data for these decision support applications. Sometimes the
design and development of these ad hoc applications are outside the scope of the data ware-
house project. The only connection with the data warehouse is the feeding of the data from
the data warehouse repository.
Whatever may be the development strategy for the specialized decision support appli-
cations in your company, make sure that the requirements definition spells out the details.
If the data warehouse will be used just for data feeds, define the data elements and the
data movement frequencies.
Growth and Expansion
Let us say your data warehouse is deployed. You have provided your users with the ability to
run queries, print reports, perform analysis, use OLAP for complex analysis, and feed the
specialized applications with data. The information delivery component is complete and
working well. Is that then the end of the effort? Yes, maybe just for the first iteration.
The information delivery component continues to grow and expand. It continues to grow
in the number and complexity of queries and reports. It expands in the enhancements to each
part of the component. In your original requirements definition you need to anticipate the
growth and expansion. Enough details about the growth and expansion can influence the
proper design of the information delivery component, so collect enough details to estimate
the growth and enhancements.
CHAPTER SUMMARY
† Accurate requirements definition in a data warehouse project is many times more
important than in other types of projects. Clearly understand the impact of business
requirements on every development phase.
† Business requirements condition the outcome of the data design phase.
† Every component of the data warehouse architecture is strongly influenced by the
business requirements.
† In order to provide data quality, identify the data pollution sources, the prevalent types
of quality problems, and the means to eliminate data corruption early in the require-
ments definition phase itself.
† Data storage specifications, especially the selection of the DBMS, are determined by
business requirements. Make sure you collect enough relevant details during the
requirements phase.
† Business requirements strongly influence the information delivery mechanism.
Requirements define how, when, and where the users will receive information from
the data warehouse.
REVIEW QUESTIONS
1. “In a data warehouse, business requirements of the users form the single and most
powerful driving force.” Do you agree? If you do, state four reasons why. If not, is
there any other such driving force?
136 REQUIREMENTS AS THE DRIVING FORCE FOR DATA WAREHOUSING
168.
2. How doaccurate information diagrams turn into sound data models for your data marts?
Explain briefly.
3. Name five architectural components that are strongly impacted by business require-
ments. Explain the impact of business requirements on any one of those five
components.
4. What is the impact of requirements on the selection of vendor tools and products? Do
requirements directly determine the choice of tools?
5. List any four aspects of information delivery that are directly impacted by business
requirements. For two of those aspects, describe the impact.
6. How do business requirements affect the choice of DBMS? Describe any three of the
ways in which the selection of DBMS is affected.
7. What are MDDBs? What types of business requirements determine the use of MDDBs
in a data warehouse?
8. How do requirements affect the choice of the metadata framework? Explain very briefly.
9. What types of user requirements dictate the granularity or the levels of detail in a data
warehouse?
10. How do you estimate the storage size? What factors determine the size?
EXERCISES
1. Match the columns:
1. information package diagrams
2. need for drill-down
3. data transformations
4. data sources
5. data aging
6. sophisticated analysis
7. simple and complex queries
8. data volume
9. specialized DSS
10. corporate data warehouse
A. determine data extraction
B. provide OLAP
C. provide data feed
D. influences load management
E. query management in DBMS
F. low levels of data
G. larger staging area
H. influence data design
I. possible pollution source
J. data staging design
2. It is a known fact that data quality in the source systems is poor in your company. You are
assigned to be the data quality assurance specialist on the project team. Describe what
details you will include in the requirements definition document to address the data
quality problem.
3. As the analyst responsible for data loads and data refreshes, describe all the details you
will look for and document during the requirements definition phase.
4. You are the manager for the data warehouse project at a retail chain with stores all across
the country and users in every store. How will you ensure that all the details necessary to
EXERCISES 137
169.
decide on theDBMS are gathered during the requirements phase? Write a memo to the
senior analyst directly responsible to coordinate the requirements definition phase.
5. You are the query tools specialist on the project team for a manufacturing company with
the primary users based in the main office. These power users need sophisticated tools for
analysis. How will you determine what types of information delivery methods are
needed? What kinds of details are to be gathered in the requirements definition phase?
138 REQUIREMENTS AS THE DRIVING FORCE FOR DATA WAREHOUSING
CHAPTER 7
ARCHITECTURAL COMPONENTS
CHAPTEROBJECTIVES
† Understand data warehouse architecture
† Learn about the architectural components
† Review the distinguishing characteristics of data warehouse architecture
† Examine how the architectural framework supports the flow of data
† Comprehend what technical architecture means
† Study the functions and services of the architectural components
† Revisit the five major architectural types
UNDERSTANDING DATA WAREHOUSE ARCHITECTURE
In Chapter 2, you were introduced to the building blocks of the data warehouse. At that
stage, we quickly looked at the list of components and reviewed each very briefly. In
Chapter 6, we revisited the data warehouse architecture and established that the business
requirements form the principal driving force for all design and development, including
the architectural plan.
In this chapter, we want to review the data warehouse architecture from different per-
spectives. You will study the architectural components in the order in which they enable
the flow of data from the sources as business intelligence to the end-users. Then you will
be able to look at each area of the architecture and examine the functions, procedures, and
features in that area. That discussion will lead you into the technical architecture in those
architectural areas.
Data Warehousing Fundamentals for IT Professionals, Second Edition. By Paulraj Ponniah
Copyright # 2010 John Wiley & Sons, Inc.
141
173.
Architecture: Definitions
The structurethat brings all the components of a data warehouse together is known as the
architecture. For example, take the case of the architecture of a school building. The archi-
tecture of the building is not just the visual style. It includes the various classrooms, offices,
library, corridors, gymnasiums, doors, windows, roof, and a large number of other such
components. When all of these components are brought and placed together, the structure
that ties all of the components together is the architecture of the school building. If you
can extend this comparison to a data warehouse, the various components of the data ware-
house together form the architecture of the data warehouse.
While building the school building, let us say that the builders were told to make the class-
rooms large. So they made the classrooms larger but eliminated the offices altogether, thus
constructing the school building with a faulty architecture. What went wrong with the archi-
tecture? For one thing, all the necessary components were not present. Probably, the arrange-
ment of the remaining components was also not right. Correct architecture is critical for the
success of your data warehouse. Therefore, in this chapter, we will take another close look at
data warehouse architecture.
In your data warehouse, architecture includes a number of factors. Primarily, it includes
the integrated data that is the centerpiece. The architecture includes everything that is needed
to prepare the data and store it. On the other hand, it also includes all the means for delivering
information from your data warehouse. The architecture is further composed of the rules,
procedures, and functions that enable your data warehouse to work and fulfill the business
requirements. Finally, the architecture is made up of the technology that empowers your
data warehouse.
What is the general purpose of the data warehouse architecture? The architecture provides
the overall framework for developing and deploying your data warehouse; it is a comprehen-
sive blueprint. The architecture defines the standards, measurements, general design, and
support techniques.
Architecture in Three Major Areas
As you already know, the three major areas in the data warehouse are:
† Data acquisition
† Data storage
† Information delivery
In Chapter 2, we identified the following major building blocks of the data warehouse:
† Source data
† Data staging
† Data storage
† Information delivery
† Metadata
† Management and control
Figure 7-1 groups these major architectural components into the three areas. In this
chapter, we will study the architecture as it relates to these three areas. In each area, we
142 ARCHITECTURAL COMPONENTS
174.
will consider thesupporting architectural components. Each of the components has
definite functions and provides specific services. We will probe these functions and services
and also examine the underlying technical architecture of the individual components in
these three areas.
Because of the importance of the architectural components, you will also receive
additional details in later chapters. For now, for the three data warehouse areas, let us
concentrate on the functions, services, and technical architecture in these major areas as
highlighted in Figure 7-1.
DISTINGUISHING CHARACTERISTICS
As an IT professional, when you were involved in the development of an OLTP system such
as order processing or inventory control, or sales reporting, were you considering an architec-
ture foreach system? Although the term architecture is not usually mentioned in the context of
operational systems, nevertheless, an underlying architecture does exist for these systems as
well. For example, the architectural considerations for such a system would include the file
conversions, initial population of the database, methods for data input, information delivery
through online screens, and the entire suite of online and batch reporting. But for such systems
we do not deal with architectural considerations in much detail. The data warehouse is differ-
ent and distinctive in that it compels us to consider architecture in elaborate detail.
Data warehouse architecture is wide, complex, and expansive. In a data warehouse,
the architecture consists of distinct components. The architecture has distinguishing
Data
Warehouse DBMS
Data Marts
MDDB
External
Production
Report/Query
OLAP
Data Mining
Source Data
Internal
Archived
Data Staging
Data Storage
Metadata
Management & Control
Information Delivery
D
A
T
A
A
C
Q
U
IS
IT
IO
N
D
A
T
A
S
T
O
R
A
G
E
IN
F
O
R
M
A
T
IO
N
D
E
L
IV
E
R
Y
Figure 7-1 Architectural components in the three major areas.
DISTINGUISHING CHARACTERISTICS 143
175.
characteristics worth consideringin detail. Before moving on to discuss the architectural
framework itself, let us review the distinguishing characteristics of data warehouse
architecture.
Different Objectives and Scope
The architecture has to support the requirements for providing strategic information.
Strategic information is markedly different from information obtained from operational sys-
tems. When you provide information from an operational application, the information con-
tent and quantity per user session is limited. As an example, at a particular time, the user is
interested only in information about one customer and all the related orders. From a data
warehouse, however, the user is interested in obtaining large result sets. An example of a
large result set from your data warehouse is all sales for the year broken down by quarters,
products, and sales regions.
Primarily, therefore, the data warehouse architecture must have components that will
work to provide data to the users in large volumes in a single session. Basically, the
extent to which a decision support system is different from an operational system directly
translates into just one essential principle: a data warehouse must have a different and
more elaborate architecture.
Defining the scope for a data warehouse is also difficult. How do you scope an operational
system? You consider the group of users, the range of functions, the data repository, and the
output screens and reports. For a data warehouse with the architecture as the blueprint, what
are all the factors you must consider for defining the scope?
There are several sets of factors to consider. First, you must consider the number and
extent of the data sources. How many legacy systems are you going to extract the data
from? What are the external sources? Are you planning to include departmental files, spread-
sheets, and private databases? What about including the archived data? Scope of the archi-
tecture may again be measured in terms of the data transformations and integration functions.
In a data warehouse, data granularity and data volumes are also important considerations.
Yet another serious consideration is the impact of the data warehouse on the existing oper-
ational systems. Because of the data extractions, comparisons, and reconciliation, you have
to determine how much negative impact the data warehouse will have on the performance of
operational systems. When will your batch extracts be run and how will they affect the pro-
duction source systems? On the other hand, if yours is going to be a real time data warehouse,
data capture functions will become elaborate and complex.
Data Content
The “read-only” data in the data warehouse sits in the middle as the primary component in
the architecture. In an operational system, although the database is important, it is not as
important as the data repository in a data warehouse. Before data is brought into your data
warehouse and stored as read-only data, a number of functions must be performed. These
exhaustive and critical functions do not compare with the data conversion that happens in
an operational system.
In your data warehouse, you keep data integrated from multiple sources. After extracting
the data, which by itself is an elaborate process, you transform the data, cleanse it, and inte-
grate it in a staging area. Only then do you move the integrated data into the data warehouse
repository as read-only data. Operational data is not “read-only” data.
144 ARCHITECTURAL COMPONENTS
176.
Further, your datawarehouse architecture must support the storing of data grouped
by business subjects, not grouped by applications as in the case of operational systems.
The data in your data warehouse does not represent a snapshot containing the values of
the variables as they are at the current time. This is different and distinct from most
operational systems.
When we mention historical data stored in the data warehouse, we are talking about very
high data volumes. Most companies opt to keep data going back 10 years in the data ware-
house. Some companies want to keep even more, if the data is available. This is another
reason why the data warehouse architecture must support high data volumes.
Complex Analysis and Quick Response
Your data warehouse architecture must support complex analysis of the strategic information
by the users. Information retrieval processes in an operational system dwindle in complexity
when compared to the use of information from a data warehouse. Most of the online infor-
mation retrieval during a session by a user in a data warehouse is interactive analysis. A user
does not run an isolated query, go away from the data warehouse, and come back much later
for the next single query. A session by the user is continuous and lasts a long time because
the user usually starts with a query at a high level, reviews the result set, initiates the next
query looking at the data in a slightly different way, and so on.
Your data warehouse architecture must, therefore, support variations for providing analy-
sis. Users must be able to drill down, roll up, slice and dice data, and play with “what-if”
scenarios. Users must have the capability to review the result sets in different output options.
Users are no longer content with textual result sets or results displayed in tabular formats.
Every result set in tabular format must be translated into graphical charts.
Provision of strategic information is meant for making rapid decisions and to deal with
situations quickly. For example, let us say your vice president of marketing wants to quickly
discover the reasons for the drop in sales for three consecutive weeks in the central region and
make prompt decisions to remedy the situation. Your data warehouse must give him or her
the tools and information for a quick response to the problem.
Your data warehouse architecture must make it easy to make strategic decisions quickly.
There must be appropriate components in the architecture to support quick response by the
users to deal with situations by using the information provided by your data warehouse.
If your data warehouse supports real time information retrieval, the architecture has to
expand to accommodate real time data capture and the ability to obtain strategic information
in real time to make on-the-spot decisions. Real time data warehousing means delivery of
information to a larger number of users both inside and outside the organization.
Flexible and Dynamic
Especially in the case of the design and development of a data warehouse, you do not know
all business requirements up front. Using the technique for creating information packages,
you are able to assess most of the requirements and dimensionally model the data require-
ments. Nevertheless, the missing parts of the requirements show up after your users begin
to use the data warehouse. What is the implication of this? You have to make sure your
data warehouse architecture is flexible enough to accommodate additional requirements as
and when they surface.
DISTINGUISHING CHARACTERISTICS 145
177.
Additional requirements surfaceto include the missed items in the business requirements.
Moreover, business conditions themselves change. In fact, they keep on changing. Changing
business conditions call for additional business requirements to be included in the data ware-
house. If the data warehouse architecture is designed to be flexible and dynamic, then your
data warehouse can cater to the supplemental requirements as and when they arise.
Metadata-Driven
As the data moves from the source systems to the end-users as useful, strategic information,
metadata surrounds the entire movement. The metadata component of the architecture holds
data about every phase of the movement, and, in a certain sense, guides the data movement.
In an operational system, there is no component that is equivalent to metadata in a data
warehouse. The data dictionary of the DBMS of the operational system is just a faint
shadow of the metadata in a data warehouse. So, in your data warehouse architecture, the
metadata component interleaves with and connects the other components. Metadata in a
data warehouse is so important that we have dedicated Chapter 9 to a discussion of metadata.
ARCHITECTURAL FRAMEWORK
Earlier in a previous section of this chapter, we grouped the architectural components as
building blocks in the three distinct areas of data acquisition, data storage, and information
delivery. In each of these broad areas of the data warehouse, the architectural components
serve specific purposes.
Architecture Supporting Flow of Data
Now we want to associate the components as forming a framework to condition and enable
the flow of data from beginning to end. As you know very well, data that finally reaches the
end-user as useful strategic information begins as disparate data elements in the various data
sources. This collection of data from the various sources moves to the staging area. What
happens next? The extracted data goes through a detailed preparation process in the staging
area before it is sent forward to the data warehouse to be properly stored. From the data ware-
house storage, data transformed into useful information is retrieved by the users or delivered
to the user desktops as required. In a basic sense, what then is data warehousing? Do you
agree that data warehousing just means taking all the necessary source data, preparing it, stor-
ing it in suitable formats, and then delivering useful information to the end-users?
Figure 7-2 shows the flow of data from beginning to end and also highlights the architec-
tural components enabling the flow of data as the data moves along.
Let us now follow the flow of the data and identify the architectural components. Some of
the architectural components govern the flow of data from beginning to end. The manage-
ment and control module is one such component. This module touches every step along
the data movement path.
What happens at critical points of the flow of data? What are the architectural com-
ponents, and how do these components enable the data flow?
At the Data Source Here the internal and external data sources form the source data
architectural component. Source data governs the extraction of data for preparation and sto-
rage in the data warehouse. The data staging architectural component governs the transform-
ation, cleansing, and integration of data.
146 ARCHITECTURAL COMPONENTS
178.
In the DataWarehouse Repository The data storage architectural component
includes the loading of data from the staging area and also storing the data in suitable formats
for information delivery. The metadata architectural component is also a storage mechanism
to contain data about the data at every point of the flow of data from beginning to end.
At the User End The information delivery architectural component includes dependent
data marts, special multidimensional databases, and a full range of query and reporting
facilities, including dashboards and scorecards.
The Management and Control Module
This architectural component is an overall module managing and controlling the entire data
warehouse environment. It is an umbrella component working at various levels and covering
all the operations. This component has two major functions: first to constantly monitor all the
ongoing operations, and next to step in and recover from problems when things go wrong.
Figure 7-3 shows how the management component relates to and manages all of the data
warehouse operations.
At the outset in your data warehouse, you have operations relating to data acquisition.
These include extracting data from the source systems either for full refresh or for incremen-
tal loads. Moving the data into the staging area and performing the data transformation
functions is also part of data acquisition. The management architectural component manages
and controls these data acquisition functions, ensuring that extracts and transformations are
carried out correctly and in a timely fashion.
The management module also manages backing up significant parts of the data ware-
house and recovering from failures. Management services include monitoring the growth
Data
Warehouse DBMS
Data Marts
MDDB
External
Production
Report/Query
OLAP
Data Mining
Source Data
Internal
Archived
Data Staging
Data Storage
Metadata
Management & Control
Information Delivery
Figure 7-2 Architectural framework supporting the flow of data.
ARCHITECTURAL FRAMEWORK 147
179.
and periodically archivingdata from the data warehouse. This architectural component
also governs data security and provides authorized access to the data warehouse. Also, the
management component interfaces with the end-user information delivery component to
ensure that information delivery is carried out properly.
Only a few tools specially designed for data warehouse administration arc presently avail-
able. Generally, data warehouse administrators perform the functions of the management
and control component by using the tools available in the data warehouse DBMS.
TECHNICAL ARCHITECTURE
We have already reviewed the various components of the data warehouse architecture in a
few different ways. First, we grouped the components into the three major areas of data
acquisition, data storage, and information delivery. Then, we explored the distinguishing
characteristics of the data warehouse architecture. We examined the architecture and high-
lighted the distinguishing characteristics of the data warehouse architecture in comparison
with that of any operational system. We also traced the flow of data through the data ware-
house and linked individual architectural components to stations along the passage of data.
You now have a good grasp of how we have applied the term architecture to the data ware-
house. We have indicated that each component of the architecture is there to perform a set
of definite functions and provide a group of specific services. When all the components
perform their predefined functions and provide the required services, then the whole archi-
tecture supports the data warehouse to fulfill the goals and business requirements.
Data
Warehouse DBMS
Data Marts
MDDB
External
Production
Report/Query
OLAP
Data Mining
Source Data
Internal
Archived
Data Staging
Data Storage
Metadata
MANAGEMENT & CONTROL
Information Delivery
Figure 7-3 The management and control component.
148 ARCHITECTURAL COMPONENTS
180.
We denote thetechnical architecture of a data warehouse as the complete set of functions
and services provided within its component structures. The technical architecture also
includes the procedures and rules that are required to perform the functions and provide
the services. The technical architecture also encompasses the data stores needed for each
component to provide the services.
Let us now make another significant distinction. The architecture is not the set of tools
needed to perform the functions and provide the services. When we refer to the data extrac-
tion function within one of the architectural components, we are simply mentioning the func-
tion itself and the various tasks associated with that function. Also, we are relating the data
store for the staging area to the data extraction function because extracted data is moved to the
staging area. Notice that there is no mention of any tools for performing the function. Where
do the tools fit in? What are the tools for extracting the data? What are tools in relation to the
architecture? Tools are the means to implement the technical architecture. That is why you
must remember that architecture comes first and the tools follow.
You will be selecting the tools most appropriate for the architecture of your data ware-
house. Let us take a very simple, perhaps unrealistic, example. Suppose the only data
source for your data warehouse is just four tables from a single centralized relational data-
base. If so, what is the extent and scope of the data source component? What is the magnitude
of the data extraction function? They are extremely limited. Do you then need sophisticated
third-party tools for data extraction? Obviously not. Taking the other extreme position, sup-
pose your data sources consist of databases and files from 50 or more legacy systems running
on multiple platforms at remote sites. In this case, your data source architectural component
and the data extraction function have a very broad and complex scope. You certainly need to
augment your in-house effort with proper data extraction tools from vendors.
In the remaining sections of this chapter, we will consider the technical architecture of the
components. We will discuss and elaborate on the types of functions, services, procedures,
and data stores that are relevant to each architectural component. These are guidelines. You
have to take these guidelines and review and adapt them for establishing the architecture for
your data warehouse. When you establish the architecture for your data warehouse, you will
prepare the architectural plan that will include all the components. The plan will also state in
detail the extent and complexity of all the functions, services, procedures, and data stores
related to each architectural component. The architectural plan will serve as a blueprint
for the design and development of the data warehouse. It will also serve as a master checklist
for your tool selection.
Let us now consider the technical architecture in each of the three major areas of the data
warehouse.
Data Acquisition
This area covers the entire process of extracting data from the data sources, moving all the
extracted data to the staging area, and preparing the data for loading into the data warehouse
repository. The two major architectural components identified earlier as part of this area are
source data and data staging. The functions and services in this area relate to these two
architectural components. The variations in the data sources have a direct impact on the
extent and scope of the functions and services.
What happens in this area is of great importance in the development of your data ware-
house. The processes of data extraction, transformation, and loading are time-consuming,
human-intensive, and very important. Chapter 12 treats these processes in great depth.
TECHNICAL ARCHITECTURE 149
181.
However, at thistime, we will deal with these in sufficient length for you to place all the
architectural components in proper perspective. Figure 7-4 summarizes the technical archi-
tecture for data acquisition.
Data Flow
Flow In the data acquisition area, the data flow begins at the data sources and pauses at the
staging area. After transformation and integration, the data is ready for loading into the data
warehouse repository.
Data Sources For the majority of data warehouses, the primary data source consists of the
enterprise’s operational systems. In many organizations, some operational systems are still
legacy systems. Legacy data resides on hierarchical or network databases. You have to
use the appropriate fourth generation language of the particular DBMS to extract data
from these databases. However, most of the recent operational systems run on the client/
server architecture. Usually, these systems are supported by relational DBMSs. Here you
may use an SQL-based language for extracting data.
A fairly large number of companies have adopted ERP (enterprise resource planning) sys-
tems. ERP data sources provide an advantage in that the data from these sources is already
consolidated and integrated. There could, however, be a few drawbacks to using ERP data
sources. You will have to use the ERP vendor’s proprietary tool for data extraction. Also,
most of the ERP offerings contain very large numbers of source data tables.
For including data from outside sources, you will have to create temporary files to hold the
data received from the outside sources. After reformatting and rearranging the data elements,
you will have to move the data to the staging area.
External
Production
Source Data
Internal
Archived
Data Staging
Management & Control
Metadata
Relational DB
or Flat Files
Intermediary
Flat Files
DATA EXTRACTION
DATA STAGING
DATA TRANSFORMATION
Figure 7-4 Data acquisition: technical architecture.
150 ARCHITECTURAL COMPONENTS
182.
Intermediary Data StoresAs data gets extracted from the data sources, it moves through
temporary files. Sometimes, extracts of homogeneous data from several source applications
are pulled into separate temporary files and then merged into another temporary file before
moving it to the staging area.
The opposite process is also common. From each application, one or two large flat files
are created and then divided into smaller files and merged appropriately before moving the
data to the staging area. Typically, the general practice is to use flat files to extract data from
operational systems.
Staging Area This is the place where all the extracted data is put together and prepared for
loading into the data warehouse. The staging area is like an assembly plant or a construction
area. In this area, you examine each extracted file, review the business rules, perform the var-
ious data transformation functions, sort and merge data, resolve inconsistencies, and cleanse
the data. When the data is finally prepared either for an enterprise-wide data warehouse or
one of the conformed data marts, the data temporarily resides in the staging area repository
waiting to be loaded into the data warehouse repository.
In many data warehouses, data in the staging area is kept in sequential or flat files. These
flat files, however, contain the fully integrated and cleansed data in appropriate formats ready
for loading. Typically, these files are in the formats that could be loaded by the utility tools of
the data warehouse RDBMS. Now more and more staging area data repositories are becom-
ing relational databases. The data in such staging areas are retained for longer periods.
Although extracts for loading may be easily obtained from relational databases with
proper indexes, creating and maintaining these relational databases involves overhead for
index creation and data migration from the source systems.
The staging area may contain data at the lowest grain to populate tables containing
business measurements. It is also common for aggregated data to be kept in the staging
area for loading. The other types of data kept in the staging area relate to business dimensions
such as product, time, sales region, customer, and promotional schemes.
Functions and Services The list of functions and services in this section relates to
the data acquisition area and is broken down into three groups. This is a general list. It
does not indicate the extent or complexity of each function or service. For the technical archi-
tecture of your data warehouse, you have to determine the content and complexity of each
function or service.
List of Functions and Services
Data Extraction
Select data sources and determine the types of filters to be applied to individual sources.
Generate automatic extract files from operational systems using replication and other
techniques.
Create intermediary files to store selected data to be merged later.
Transport extracted files from multiple platforms.
Provide automated job control services for creating extract files.
Reformat input from outside sources.
Reformat input from departmental data files, databases, and spreadsheets.
TECHNICAL ARCHITECTURE 151
183.
Generate common applicationcodes for data extraction.
Resolve inconsistencies for common data elements from multiple sources.
Data Transformation
Map input data to data for data warehouse repository.
Clean data, deduplicate, and merge/purge.
Denormalize extracted data structures as required by the dimensional model of the data
warehouse.
Convert data types.
Calculate and derive attribute values.
Check for referential integrity.
Aggregate data as needed.
Resolve missing values.
Consolidate and integrate data.
Data Staging
Provide backup and recovery for staging area repositories.
Sort and merge files.
Create files as input to make changes to dimension tables.
If data staging storage is a relational database, create and populate database.
Preserve audit trail to relate each data item in the data warehouse to input source.
Resolve and create primary and foreign keys for load tables.
Consolidate datasets and create flat files for loading through DBMS utilities.
If staging area storage is a relational database, extract load files.
Data Storage
This covers the process of loading the data from the staging area into the data warehouse
repository. All functions for transforming and integrating the data are completed in the
data staging area. The prepared data in the data warehouse is like the finished product that
is ready to be stacked in an industrial warehouse.
Even before loading data into the data warehouse, metadata, which is another component
of the architecture, is already active. During the data extraction and data transformation
stages themselves, the metadata repository gets populated. Figure 7-5 shows a summarized
view of the technical architecture for data storage.
Data Flow
Flow For data storage, the data flow begins at the data staging area. The transformed and
integrated data is moved from the staging area to the data warehouse repository.
If the data warehouse is an enterprise-wide data warehouse being built in a top-down
fashion, then there could be movements of data from the enterprise-wide data warehouse
repository to the repositories of the dependent data marts. Alternatively, if the data ware-
house is a conglomeration of conformed data marts being built in a bottom-up manner,
then the data movements stop with the appropriate conformed data marts.
152 ARCHITECTURAL COMPONENTS
184.
Data Groups Prepareddata waiting in the data staging area fall into two groups. The first
group is the set of files or tables containing data for a full refresh. This group of data is usually
meant for the initial loading of the data warehouse. Occasionally, some data warehouse
tables may be refreshed fully.
The other group of data is the set of files or tables containing ongoing incremental loads.
Most of these relate to nightly loads. Some incremental loads of dimension data may be
performed at less frequent intervals.
The Data Repository Almost all of today’s data warehouse databases are relational
databases. All the power, flexibility, and ease of use capabilities of the RDBMS become
available for the processing of data.
Functions and Services The general list of functions and services given in this section
is for your guidance. The list relates to the data storage area and covers the broad functions
and services. This is a general list. It does not indicate the extent or complexity of each func-
tion or service. For the technical architecture of your data warehouse, you have to determine
the content and complexity of each function or service.
List of Functions and Services
† Load data for full refreshes of data warehouse tables.
† Perform incremental loads at regular prescribed intervals.
† Support loading into multiple tables at the detailed and summarized levels.
† Optimize the loading process.
Data Marts
Data Storage
Management & Control
Metadata
Relational DB
E-R Model
Relational DB
Dimensional Model
INCREMENTAL
LOAD
BACKUP/
RECOVERY
FULL REFRESH
DATA ARCHIVAL
SECURITY
Figure 7-5 Data storage: technical architecture.
TECHNICAL ARCHITECTURE 153
185.
† Provide automatedjob control services for loading the data warehouse.
† Provide backup and recovery for the data warehouse database.
† Provide security.
† Monitor and fine-tune the database.
† Periodically archive data from the database according to preset conditions.
Information Delivery
This area spans a broad spectrum of methods for making information available to users. For
your users, the information delivery component is the data warehouse. They do not come into
contact with the other components directly. For the users, the strength of your data ware-
house architecture is mainly concentrated in the robustness and flexibility of the information
delivery component.
The information delivery component makes it easy for the users to access the information
either directly from the enterprise-wide data warehouse, from the dependent data marts, or
from the set of conformed data marts. Most of the information access in a data warehouse
is through online queries and interactive analysis sessions. Nevertheless, your data ware-
house will also be producing regular and ad hoc reports.
Almost all modern data warehouses provide for online analytical processing (OLAP). In
this case, the primary data warehouse feeds data to proprietary multidimensional databases
(MDDBs) where summarized data is kept as multidimensional cubes of information.
The users perform complex multidimensional analysis using the information cubes in the
MDDBs. Refer to Figure 7-6 for a summarized view of the technical architecture for
information delivery.
Report/Query
OLAP
Data Mining
Information Delivery
Management & Control
Metadata
QUERY OPTIMIZATION
Multidimensional
Database
Temporary Result
Sets
Standard Reporting
Data Stores
QUERY GOVERNMENT
CONTENT BROWSE
SECURITY CONTROL
SELF-SERVICE REPORT
GENERATION
Figure 7-6 Information delivery: technical architecture.
154 ARCHITECTURAL COMPONENTS
186.
Data Flow
Flow Forinformation delivery, the data flow begins at the enterprise-wide data warehouse
and the dependent data marts when the design is based on the top-down technique. When the
design follows the bottom-up method, the data flow starts at the set of conformed data marts.
Generally, data transformed into information flows to user desktops during query sessions.
Also, information printed on regular or ad hoc reports reaches the users. Sometimes, the
result sets from individual queries or reports are held in proprietary data stores of the
query or reporting tool vendors. The stored information may be put to faster repeated use.
Recently progressive organizations implement dashboards and scorecards as part of
information delivery. Dashboards are real time or near real time information display devices.
Data flows to the dashboards in real time from the data warehouse.
In many data warehouses, data also flows into specialized downstream decision support
applications such as executive information systems (EIS) and data mining. The other more
common flow of information is to proprietary multidimensional databases for OLAP.
Service Locations In your information delivery component, you may provide query
services from the user desktop, from an application server, or from the database itself.
This will be one of the critical decisions for your architecture design.
For producing regular or ad hoc reports you may want to include a comprehensive
reporting service. This service will allow users to create and run their own reports. It will
also provide for standard reports to be run at regular intervals.
Data Stores For information delivery, you may consider the following intermediary data
stores:
† Proprietary temporary stores to hold results of individual queries and reports for
repeated use
† Data stores for standard reporting
† Data stores for dashboards
† Proprietary multidimensional databases
Functions and Services Review the general list of functions and services given below
and use it as a guide to establish the information delivery component of your data warehouse
architecture. The list relates to information delivery and covers the broad functions and
services. Again, this is a general list. It does not indicate the extent or complexity of each
function or service. For the technical architecture of your data warehouse, you have to
determine the content and complexity of each function or service.
† Provide security to control information access.
† Monitor user access to improve service and for future enhancements.
† Allow users to browse data warehouse content.
† Simplify access by hiding internal complexities of data storage from users.
† Automatically reformat queries for optimal execution.
† Enable queries to be aware of aggregate tables for faster results.
† Govern queries and control runaway queries.
TECHNICAL ARCHITECTURE 155
187.
† Provide self-servicereport generation for users, consisting of a variety of flexible
options to create, schedule, and run reports.
† Store result sets of queries and reports for future use.
† Provide multiple levels of data granularity.
† Provide event triggers to monitor data loading.
† Make provision for the users to perform complex analysis through online analytical
processing (OLAP).
† Enable data feeds to downstream, specialized decision support systems such as EIS and
data mining.
In this chapter we have looked at the data warehouse architecture and the components from
various points of view. We discussed the architecture as it relates to the three major areas of
data acquisition, data storage, and information delivery. Then we considered the overall
architectural framework and focused on how the architecture supports the flow of data.
We reviewed the management and control component in the architecture.
Our coverage detailed the technical architecture in each of the three major areas. In each of
these three areas, we studied the architecture in relation to the data flow and listed the func-
tions and services. All of this discussion has provided you with a strong and clear under-
standing of data warehouse architectural components, their arrangement, and their functions.
ARCHITECTURAL TYPES
In Chapter 2, we introduced five common and major types of architecture. As indicated ear-
lier, these types essentially differ in the way data is integrated and stored and also in the way
“data warehouses” and “data marts” are related.
At this point, we would like to revisit these architectural types so that you may view our
entire discussion of architecture in this chapter and see how it would apply to each of these
five common types of architecture. Note the arrangement and linkage of the “data ware-
house” and “data marts” in each case wherever applicable. Also, notice how the architectural
arrangements facilitate the intended data flows as discussed earlier in this chapter.
Centralized Corporate Data Warehouse
In this architecture type, a centralized enterprise data warehouse is present. There are no data
marts, whether dependent or independent. Therefore all information delivery is from the
centralized data warehouse.
See Figure 7-7 for a high-level overview of the components. Note the flow of data from
source systems to staging area, then to the normalized central data warehouse, and thereafter
to end-users as business intelligence.
Independent Data Marts
In this architecture type, the data warehouse is really a collection of unconnected, disparate
data marts, each serving a specific department or purpose. These data marts in such organ-
izations usually evolve over time without any overall planning. Each data mart delivers
information to its own group of users.
156 ARCHITECTURAL COMPONENTS
188.
See Figure 7-8for a high-level overview of the components. Note the flow of data from
source systems to staging area, then to the various independent data marts, and thereafter
to individual groups of end-users as business intelligence. In many cases, data staging
functions and movement to each data mart may be carried out separately.
MDDB
External
Production
Report/Query
OLAP
Data Mining
Source Data
Internal
Archived
Data Staging
Data Storage
Metadata
Management & Control
Centralized DW
Relational Model
normalized (details
& summaries)
Information Delivery
Figure 7-7 Overview of the components of a centralized data warehouse.
Departmental
Data
Report/Query
Source Data
Data Staging
Data Storage
Metadata
Management & Control
Information Delivery
Independent Data Marts
Relational/Dimensional
Models
Figure 7-8 Overview of the components of independent data marts.
ARCHITECTURAL TYPES 157
189.
Report/Query
Data Storage
Metadata
Management &Control
Information Delivery
Federated Data Structures
Relational/Dimensional Models
Decision Support
Applications
Loosely
integrated
logically/
physically
Figure 7-9 Overview of the components of a federated data warehouse.
MDDB
External
Production
Report/Query
OLAP
Data Mining
Source Data
Internal
Archived
Data Staging
Data Storage
Metadata
Management & Control
Relational Model
normalized (details
& summaries)
Centralized DW
Dependent Data Marts
Data Storage
Dimensional Model
Information Delivery
Figure 7-10 Overview of the components of a hub-and-spoke type of data warehouse.
158 ARCHITECTURAL COMPONENTS
190.
Federated
This architecture typeappears to be similar to the type with independent data marts. But
there is one big difference. In the federated architectural type, common data elements
in the various data marts and even data warehouses that compose the federation are inte-
grated physically or logically. The goal is to strive for a single version of truth for the organ-
ization; a centralized enterprise data warehouse is present. There are no data marts, whether
dependent or independent. Therefore all information delivery is from the centralized data
warehouse.
See Figure 7-9 for a high-level overview of the components. Note the flow of data
from the federation of data marts, data warehouses, and other sources to the end-users as
business intelligence. In between, logical or physical integration of common data elements
takes place.
Hub-and-Spoke
In this architecture type, a centralized enterprise data warehouse is present. In addition,
there are data marts that depend on the enterprise data warehouse for data feed.
Information delivery can, therefore, be both from the centralized data warehouse and the
dependent data marts.
See Figure 7-10 for a high-level overview of the components. Note the flow of data
from source systems to the staging area, then to the normalized central data warehouse,
and thereafter to end-users as business intelligence from both the central data warehouse
and the dependent data marts.
MDDB
External
Production
Report/Query
OLAP
Data Mining
Source Data
Internal
Archived
Data Staging
Metadata
Management & Control
Information Delivery
Conformed Data Marts
Data Storage
Dimensional Model
Figure 7-11 Overview of the components of a data-mart bus.
ARCHITECTURAL TYPES 159
191.
Data-Mart Bus
In thisarchitecture type, no distinct, single data warehouse exists. The collection of all the
data marts form the data warehouse because the data marts are conformed “super-marts”
because the business dimensions and measured facts are conformed and linked among
the data marts. All information delivery is from the conglomeration of the conformed data
marts. These data marts may serve the entire enterprise, not just single departments.
See Figure 7-11 for a high-level overview of the components. Note the flow of data
from source systems to staging area, then to the various conformed data marts, thereafter
to end-users as business intelligence from the conformed data marts.
CHAPTER SUMMARY
† Architecture is the structure that brings all the components together.
† Data warehouse architecture consists of distinct components with the read-only data
repository as the centerpiece.
† A few typical data warehouse architectural types are in use at various organizations.
Broadly these types reflect how data is stored and made available—centrally as the
single enterprise data warehouse database or as a collection cohesive data marts.
† The architectural components support the functioning of the data warehouse in the
three major areas of data acquisition, data storage, and information delivery.
† Data warehouse architecture is wide, complex, expansive, and has several distinguish-
ing characteristics.
† The architectural framework enables the flow of data from the data sources at one end
to the user’s desktop at the other.
† The technical architecture of a data warehouse is the complete set of functions and
services provided within its components. It includes the procedures and rules
needed to perform the functions and to provide the services. It encompasses the data
stores needed for each component to provide the services.
† The flow of data from the source systems to end-users as business intelligence depends
on the architectural type.
REVIEW QUESTIONS
1. What is your understanding of data warehouse architecture? Describe in one or two
paragraphs.
2. What are the three major areas in the data warehouse? Is this a logical division? If so,
why do you think so? Relate the architectural components to the three major areas.
3. Name four distinguishing characteristics of data warehouse architecture. Describe each
briefly.
4. Trace the flow of data through the data warehouse from beginning to end.
5. For information delivery, what is the difference between top-down and bottom-up
approaches to data warehouse implementation?
6. In which architectural component does OLAP fit? What is the function of OLAP?
160 ARCHITECTURAL COMPONENTS
192.
7. Define thetechnical architecture of the data warehouse. How does it relate to the
individual architectural components?
8. List five major functions and services in the data storage area.
9. What are the types of storage repositories in the data staging area?
10. List four major functions and services for information delivery. Describe each briefly.
EXERCISES
1. Indicate if true or false:
A. Data warehouse architecture is just an overall guideline. It is not a blueprint for the
data warehouse.
B. In a data warehouse, the metadata component is unique, with no truly matching
component in operational systems,
C. Normally, data flows from the data warehouse repository to the data staging area.
D. The management and control component does not relate to all operations in a data
warehouse.
E. Technical architecture simply means the vendor tools.
F. SQL-based languages are used to extract data from hierarchical databases.
G. Sorts and merges of files are common in the staging area.
H. MDDBs are generally relational databases.
I. Sometimes, results of individual queries are held in temporary data stores for repeated
use.
J. Downstream specialized applications are fed directly from the source data com-
ponent.
2. You have been recently promoted to administrator for the data warehouse of a nationwide
automobile insurance company. You are asked to prepare a checklist for selecting a
proper vendor tool to help you with the data warehouse administration. Make a list of
the functions in the management and control component of your data warehouse archi-
tecture. Use this list to derive the tool-selection checklist.
3. As the senior analyst responsible for data staging, you are responsible for the design of the
data staging area. If your data warehouse gets input from several legacy systems on mul-
tiple platforms, and also regular feeds from two external sources, how will you organize
your data staging area? Describe the data repositories you will have for data staging.
4. You are the data warehouse architect for a leading national department store chain. The
data warehouse has been up and running for nearly a year. Now the management has
decided to provide power users with OLAP facilities. How will you alter the information
delivery component of your data warehouse architecture? Make realistic assumptions and
proceed.
5. You recently joined as the data extraction specialist on the data warehouse project team
developing a conformed data mart for a local but progressive pharmacy. Make a detailed
list of functions and services for data extraction, data transformation, and data staging.
EXERCISES 161
194.
CHAPTER 8
INFRASTRUCTURE ASTHE
FOUNDATION FOR DATA WAREHOUSING
CHAPTER OBJECTIVES
† Understand the distinction between architecture and infrastructure
† Find out how the data warehouse infrastructure supports its architecture
† Gain an insight into the components of the physical infrastructure
† Review hardware and operating systems for the data warehouse
† Study parallel processing options as applicable to the data warehouse
† Discuss the server options in detail
† Learn how to select the DBMS
† Review the types of tools needed for the data warehouse
† Study the concept and use of data warehouse appliances
What is data warehouse infrastructure in relation to its architecture? What is the distinction
between architecture and infrastructure? In what ways are they different? Why do we have to
study the two separately?
In the previous chapter, we discussed data warehouse architecture in detail. We looked at
the various architectural components and studied them by grouping them into the three major
areas of the data warehouse, namely, data acquisition, data storage, and information delivery.
You learned the elements that composed the technical architecture of each architectural
component. You also reviewed the prevalent distinct architectural types and how flow of
data is supported in each type.
In this chapter, let us find out what infrastructure means and what it includes. We will
discuss each part of the data warehouse infrastructure. You will understand the significance
Data Warehousing Fundamentals for IT Professionals, Second Edition. By Paulraj Ponniah
Copyright # 2010 John Wiley & Sons, Inc.
163
195.
of infrastructure andmaster the techniques for creating the proper infrastructure for your data
warehouse.
INFRASTRUCTURE SUPPORTING ARCHITECTURE
Consider the architectural components. For example, let us take the technical architecture of
the data staging component. This part of the technical architecture for your data warehouse
does a number of things. First of all, it indicates that there is a section of the architecture rel-
evant to data staging. Then it notes that this section of the architecture contains an area where
data is staged before it is loaded into the data warehouse repository. Next, it denotes that this
section of the architecture performs certain functions and provides specific services in the
data warehouse. Among others, the functions and services include data transformation
and data cleansing.
Let us now ask a few questions. Where exactly is the data staging area? What are the
specific files and databases? How do the functions get performed? What enables the services
to be provided? What is the underlying base? What is the foundational structure?
Infrastructure is the foundation supporting the architecture. Figure 8-1 expresses this fact
in a simple manner.
What are the various elements needed to support the architecture? The foundational infra-
structure includes many elements. First, it consists of the basic computing platform. The plat-
form includes all the required hardware and the operating system. Next, the database
management system (DBMS) is an important element of the infrastructure. All other
types of software and tools are also part of the infrastructure. What about the people and
the procedures that make the architecture come alive? Are these also part of the infrastruc-
ture? In a sense, they are.
Data warehouse infrastructure includes all the foundational elements that enable the archi-
tecture to be implemented. In summary, the infrastructure includes several elements such as
server hardware, operating system, network software, database software, the LAN and WAN,
vendor tools for every architectural component, people, procedures, and training.
Data
Acquisi-
tion
Data
Storage
Information
Access
Data Warehouse Architecture
Figure 8-1 Infrastructure supporting architecture.
164 INFRASTRUCTURE AS THE FOUNDATION FOR DATA WAREHOUSING
196.
The elements ofthe data warehouse infrastructure may be classified into two categories:
operational infrastructure and physical infrastructure. This distinction is important because
elements in each category are different in their nature and features compared to those in
the other category. First, we will go over the elements that may be grouped as operational
infrastructure. The physical infrastructure is much wider and more fundamental.
After gaining a basic understanding of the elements of the physical architecture, we will
spend a large portion of this chapter examining specific elements in greater detail.
Operational Infrastructure
To understand operational infrastructure, let us once again take the example of data staging.
One part of the foundational infrastructure refers to the computing hardware and the related
software. You need the hardware and software to perform the data staging functions and
render the appropriate services. You need software tools to perform data transformations.
You need software to create the output files. You need disk hardware to place the data in
the staging area files. But what about the people involved in performing these functions?
What about the business rules and procedures for the data transformations? What about
the management software to monitor and administer the data transformation tasks?
Operational infrastructure to support each architectural component consists of
† People
† Procedures
† Training
† Management software
These are not the people and procedures needed for developing the data warehouse. These
are needed to keep the data warehouse going. These elements are as essential as the hardware
and software that keep the data warehouse running. They support the management of the data
warehouse and maintain its efficiency.
Data warehouse developers pay a lot of attention to the hardware and system software
elements of the infrastructure. It is right to do so. But operational infrastructure is often neg-
lected. Even though you may have the right hardware and software, your data warehouse
needs the operational infrastructure in place for proper functioning. Without appropriate
operational infrastructure, your data warehouse is likely to just limp along and cease to be
effective. Pay attention to the details of your operational infrastructure.
Physical Infrastructure
Let us begin with a diagram. Figure 8-2 highlights the major elements of the physical infra-
structure. What do you see in the diagram? As you know, every system, including your
data warehouse, must have an overall platform on which to reside. Essentially, the platform
consists of the basic hardware components, the operating system with its utility software, the
network, and the network software. Along with the overall platform is the set of tools that run
on the selected platform to perform the various functions and services of individual archi-
tectural components.
We will examine the elements of physical infrastructure in the next few sections.
Decisions about the hardware top the list of decisions you have to make about the
INFRASTRUCTURE SUPPORTING ARCHITECTURE 165
197.
infrastructure of yourdata warehouse. Hardware decisions are not easy. You have to consider
many factors. You have to ensure that the selected hardware will support the entire data ware-
house architecture.
Perhaps we can go back to our mainframe days and get some helpful hints. As newer
models of the corporate mainframes were announced and as we ran out of steam on the cur-
rent configuration, we stuck to two principles. First, we leveraged as much of the existing
physical infrastructure as possible. Next, we kept the infrastructure as modular as possible.
When needs arose and when newer versions became available at cheaper prices, we
unplugged an existing component and plugged in the replacement.
In your data warehouse, try to adopt these two principles. You already have the hardware
and operating system components in your company supporting the current operations, How
much of this can you use for your data warehouse? How much extra capacity is available?
How much disk space can be spared for the data warehouse repository? Find answers to
these questions.
Applying the modular approach, can you add more processors to the server hardware?
Explore if you can accommodate the data warehouse by adding more disk or other storage
units. Take an inventory of individual hardware components. Check which of these com-
ponents needs to be replaced with more potent versions. Also, make a list of the additional
components that have to be procured and plugged in.
HARDWARE AND OPERATING SYSTEMS
Hardware and operating systems make up the computing environment for your data ware-
house. All the data extraction, transformation, integration, and staging jobs run on the
selected hardware under the chosen operating system. When you transport the consolidated
and integrated data from the staging area to your data warehouse repository, you make use
of the server hardware and the operating system software. When the queries are initiated
from the client workstations, the server hardware, in conjunction with the database software,
executes the queries and produces the results.
Here are some general guidelines for hardware selection, not entirely specific to hardware
for the data warehouse.
Hardware
Network
Software
DBMS
Operating
System
DATA
ACQUISITION
TOOLS
DATA
STAGING
TOOLS
INFO.
DELIVERY
TOOLS
COMPUTING PLATFORM
Figure 8-2 Physical infrastructure.
166 INFRASTRUCTURE AS THE FOUNDATION FOR DATA WAREHOUSING
198.
Scalability. Ensure thatyour selected hardware can be scaled up when your data ware-
house grows in terms of the number of users, the number of queries, and the complex-
ity of the queries.
Support. Vendor support is crucial for hardware maintenance. Make sure that the support
from the hardware vendor is at the highest possible level.
Vendor Reference. It is important to check vendor references with other sites using hard-
ware from this vendor. You do not want to be caught with your data warehouse being
down because of hardware malfunctions when the CEO wants some critical analysis to
be completed.
Vendor Stability. Check on the stability and staying power of the vendor.
Next let us quickly consider a few general criteria for the selection of the operating
system. First of all, the operating system must be compatible with the hardware. A list of cri-
teria follows.
Scalability. Again, scalability is first on the list because this is one common feature of
every data warehouse. Data warehouses grow, and they grow very fast. Along with
the hardware and database software, the operating system must be able to support
the increase in the number of users and applications.
Security. When multiple client workstations access the server, the operating system must
be able to protect each client and associated resources. The operating system must
provide each client with a secure environment.
Reliability. The operating system must be able to protect the environment from appli-
cation malfunctions.
Availability. This is a corollary to reliability. The computing environment must continue
to be available after abnormal application terminations.
Preemptive Multitasking. The server hardware must be able to balance the allocation of
time and resources among the multiple tasks. Also, the operating system must be able
to let a higher priority task preempt or interrupt another task as and when needed.
Use a Multithreaded Approach. The operating system must be able to service multiple
requests concurrently by distributing threads to multiple processors in a multiproces-
sor hardware configuration. This feature is very important because multiprocessor
configurations are architectures of choice in a data warehouse environment.
Memory Protection. Again, in a data warehouse environment, large numbers of queries
are common. That means that multiple queries will be executing concurrently.
A memory protection feature in an operating system prevents one task from violating
the memory space of another.
Having reviewed the requirements for hardware and operating systems in a data ware-
house environment, let us try to narrow down the choices. What are the possible options?
Review the following list of three common options.
Mainframes
† Leftover hardware from legacy applications
† Primarily designed for OLTP and not for decision support applications
HARDWARE AND OPERATING SYSTEMS 167
199.
† Not costeffective for data warehousing
† Not easily scalable
† Rarely used for data warehousing; only used when too much spare resources are
available for smaller data marts
Open System Servers
† UNIX servers, the choice medium for most data warehouses
† Generally robust
† Adapted for parallel processing
NT Servers
† Support medium-sized data warehouses
† Limited parallel processing capabilities
† Cost-effective for medium-sized and small data warehouses
Platform Options
Let us now turn our attention to the computing platforms that are needed to perform the sev-
eral functions of the various components of the data warehouse architecture. A computing
platform is the set of hardware components, the operating system, the network, and the net-
work software. Whether it is a function of an OLTP system or a decision support system like
the data warehouse, the function has to be performed on a computing platform.
Before we get into a deeper discussion of platform options, let us get back to the functions
and services of the architectural components in the three major areas. Here is a quick sum-
mary recap:
Data Acquisition: data extraction, data transformation, data cleansing, data integration,
and data staging.
Data Storage: data loading, archiving, and data management.
Information Delivery: report generation, query processing, and complex analysis.
We will now discuss platform options in terms of the functions in these three areas. Where
should each function be performed? On which platforms? How could you optimize the
functions?
Single Platform Option This is the most straightforward and simplest option for imple-
menting the data warehouse architecture. In this option, all functions from the back-end data
extraction to the front-end query processing are performed on a single computing platform.
This was perhaps the earliest approach, when developers were implementing data ware-
houses on existing mainframes, minicomputers, or single UNIX-based servers.
Because all operations in the data acquisition, data storage, and information delivery
areas take place on the same platform, this option hardly ever encounters any compatibility
or interface problems. The data flows smoothly from beginning to end without any
platform-to-platform conversions. No middleware is needed. All tools work in a single
computing environment.
168 INFRASTRUCTURE AS THE FOUNDATION FOR DATA WAREHOUSING
200.
In many companies,legacy systems are still running on mainframes or minicomputers.
Some of these companies have migrated to UNIX-based servers and others have moved
over to ERP systems in client/server environments. Most legacy systems still reside on main-
frames, minis, or UNIX-based servers. What is the relationship of the legacy systems to the
data warehouse? Remember, the legacy systems contribute the major part of the data ware-
house data. If these companies wish to adopt a single-platform solution, that platform of
choice has to be a mainframe, mini, or a UNIX-based server.
If the situation in your company warrants serious consideration of the single-platform
option, then analyze the implications before making a decision. The single-platform solution
appears to be an ideal option. If so, why are not many companies adopting this option now?
Let us examine the reasons.
Legacy Platform Stretched to Capacity In many companies, the existing legacy com-
puting environment may have been around for many years and be already fully stretched to
capacity. The environment may be at a point where it can no longer be upgraded further to
accommodate your data warehouse.
Nonavailability of Tools Software tools form a large part of the data warehouse infra-
structure. You will clearly grasp this fact from the last few subsections of this chapter.
Most of the tools provided by the numerous data warehouse vendors do not support the main-
frame or minicomputer environment. Without the appropriate tools in the infrastructure,
your data warehouse will fall apart.
Multiple Legacy Platforms Although we have surmised that the legacy mainframe or
minicomputer environment may be extended to include data warehousing, the practical
fact points to a different situation. In most corporations, a combination of a few mainframe
systems, an assortment of minicomputer applications, and a smattering of the newer
PC-based systems exist side by side. The path most companies have taken is from main-
frames to minis and then to PCs. Figure 8-3 highlights the typical configuration.
If your corporation is one of the typical enterprises, what can you do about a single-
platform solution? Not much. With such a conglomeration of disparate platforms, a single-
platform option having your data warehouse alongside all the other applications is just not
tenable.
Company’s Migration Policy This is another important consideration. You very well
know the varied benefits of the client/server architecture for computing. You are also
aware of the fact that every company has been changing to embrace this computing paradigm
by moving the applications from the mainframe and minicomputer platforms. In most com-
panies, the policy on the usage of information technology does not permit the perpetuation of
the old platforms. If your company has a similar policy, then you will not be permitted to add
another significant system such as your data warehouse on the old platforms.
Hybrid Option After examining the legacy systems and the more modern applications in
your corporation, it is most likely that you will decide that a single-platform approach is not
workable for your data warehouse. This is the conclusion most companies come to. On the
other hand, if your company falls in the category where the legacy platform will accommo-
date your data warehouse, then, by all means, take the approach of a single-platform solution.
Again, the single-platform solution, if feasible, is an easier solution.
HARDWARE AND OPERATING SYSTEMS 169
201.
For the restof us who are not that fortunate, we have to consider other options. Let us
begin with data extraction, the first major operation, and follow the flow of data until it is
consolidated into load images and waiting in the staging area. We will now step through
the data flow and examine the platform options.
Data Extraction In any data warehouse, it is best to perform the data extraction function
from each source system on its own computing platform. If your telephone sales data resides
in a minicomputer environment, create extract files on the minicomputer itself for telephone
sales. If your mail order application executes on the mainframe using an IMS database, then
create the extract files for mail orders on the mainframe platform. It is rarely prudent to copy
all the mail order database files to another platform and then do the data extraction.
Initial Reformatting and Merging After creating the raw data extracts from the various
sources, the extracted files from each source are reformatted and merged into a smaller
number of extract files. Verification of the extracted data against source system reports
and reconciliation of input and output record counts take place in this step. Just like the
extraction step, it is best to do this step of initial merging of each set of source extracts on
the source platform itself.
Preliminary Data Cleansing In this step, you verify the extracted data from each data
source for any missing values in individual fields, supply default values, and perform
basic edits. This is another step for the computing platform of the source system itself.
However, in some data warehouses, this type of data cleansing happens after the data
from all sources are reconciled and consolidated. In either case, the features and conditions
of data from your source systems dictate when and where this step must be performed for
your data warehouse.
MINI
UNIX
MAINFRAME
Figure 8-3 Multiple platforms in a typical corporation.
170 INFRASTRUCTURE AS THE FOUNDATION FOR DATA WAREHOUSING
202.
Transformation and ConsolidationThis step comprises all the major data transform-
ation and integration functions. Usually, you will use transformation software tools for
this purpose. Where is the best place to perform this step? Obviously, not in any individual
legacy platform. You perform this step on the platform where your staging area resides.
Validation and Final Quality Check This step of final validation and quality check is a
strong candidate for the staging area. You will arrange for this step to happen on that
platform.
Creation of Load Images This step creates load images for individual database files of
the data warehouse repository. This step almost always occurs in the staging area and, there-
fore, on the platform where the staging area resides.
Figure 8-4 summarizes the data acquisition steps and the associated platforms. You will
notice the options for the steps. Relate this to your own corporate environment and determine
where the data acquisition steps must take place.
Options for the Staging Area In the discussion of the data acquisition steps, we have
highlighted the optimal computing platform for each step. You will notice that the key steps
happen in the staging area. This is the place where all data for the data warehouse come
together and get prepared. What is the ideal platform for the staging area? Let us repeat
that the platform most suitable for your staging area depends on the status of your source
platforms. Nevertheless, let us explore the options for placing the staging area and come
up with general guidelines. These will help you decide. Figure 8-5 shows the different
MAINFRAME
MINI
UNIX
UNIX or
OTHER
SOURCE DATA PLATFORMS STAGING AREA PLATFORM
Data Extraction
Initial
Reformatting/Merging
Preliminary Data
Cleansing
Preliminary Data
Cleansing
Transformation/
Consolidation
Validation/Quality
Check
Load Image Creation
Figure 8-4 Platforms for data acquisition.
HARDWARE AND OPERATING SYSTEMS 171
203.
options for thestaging area. Study the figure and follow the amplification of the options
given in the subsections below.
In One of the Legacy Platforms If most of your legacy data sources are on the same
platform and if extra capacity is readily available, then consider keeping your data staging
area in that legacy platform. In this option, you will save time and effort in moving the
data across platforms to the staging area.
On the Data Storage Platform This is the platform on which the data warehouse DBMS
runs and the database exists. When you keep your data staging area on this platform, you will
realize all the advantages for applying the load images to the database. You may even be able
to eliminate a few intermediary substeps and apply data directly to the database from some of
the consolidated files in the staging area.
On a Separate Optimal Platform You may review your data source platforms, examine
the data warehouse storage platform, and then decide that none of these platforms are really
suitable for your staging area. It is likely that your environment needs complex data trans-
formations. It is possible that you need to work through your data thoroughly to cleanse
and prepare it for your data warehouse. In such circumstances, you need a separate platform
to stage your data before loading to the database.
Here are some distinct advantages of a separate platform for data staging:
† You can optimize the separate platform for complex data transformations and data
cleansing. What do we mean by this? You can gear up the neutral platform with all
the necessary tools for data transformation, data cleansing, and data formatting.
MINI
UNIX
UNIX or
OTHER
SOURCE DATA
PLATFORMS
DATA STORAGE
PLATFORM
UNIX or
OTHER
SEPARATE
PLATFORM
Option 3
Option 2
Option 1
STAGING
AREA
STAGING
AREA
STAGING
AREA
Figure 8-5 Platform options for the staging area.
172 INFRASTRUCTURE AS THE FOUNDATION FOR DATA WAREHOUSING
204.
† While theextracted data is being transformed and cleansed in the data staging area, you
need to keep the entire data content and ensure that nothing is lost on the way. You may
want to think of some tracking file or table to contain tracking entries. A separate
environment is most conducive for managing the movement of data.
† We talked about the possibility of having specialized tools to manipulate the data in the
staging area. If you have a separate computing environment for the staging area, you
could easily have people specifically trained on these tools running the separate com-
puting equipment.
Data Movement Considerations On whichever computing platforms the individual
steps of data acquisition and data storage happen, data has to move across platforms.
Depending on the source platforms in your company and the choice of the platform for
data staging and data storage, you have to provide for data transportation across different
platforms.
Review the following options. Figure 8-6 summarizes the standard options. You may find
that a single approach alone is not sufficient. Do not hesitate to have a balanced combination
of the different approaches. In each data movement across two computing platforms, choose
the option that is most appropriate for that environment. Brief explanations of the standard
options follow.
Shared Disk This method goes back to the mainframe days. Applications running in
different partitions or regions were allowed to share data by placing the common data on
a shared disk. You may adapt this method to pass data from one step to another for data
MAINFRAME
MINI
UNIX
UNIX or
OTHER
SOURCE PLATFORM TARGET PLATFORM
Option 1 - Shared Disk
Option 2 - Mass Transmission
Option 3 - Real-time Connection
Option 4 - Manual Methods
High Volume Data
Figure 8-6 Data movement options.
HARDWARE AND OPERATING SYSTEMS 173
205.
acquisition in yourdata warehouse. You have to designate a disk storage area and set it up so
that each of the two platforms recognizes the disk storage area as its own.
Mass Data Transmission In this case, transmission of data across platforms takes place
through data ports. Data ports are simply interplatform devices that enable massive quantities
of data to be transported from one platform to the other. Each platform must be configured to
handle the transfers through the ports. This option calls for special hardware, software, and
network components. There must also be sufficient network bandwidth to carry high data
volumes.
Real-Time Connection In this option, two platforms establish connection in real time so
that a program running on one platform may use the resources of the other platform. A pro-
gram on one platform can write to the disk storage on the other. Also, jobs running on one
platform can schedule jobs and events on the other. With the widespread adoption of TCP/
IP, this option is very viable for your data warehouse. If your data warehouse is intended to be
a real time or near real time data warehouse, then this is an important consideration.
Manual Methods Perhaps these are the options of last resort. Nevertheless, these options
are straightforward and simple. A program on one platform writes to an external medium
such as tape or disk. Another program on the receiving platform reads the data from the exter-
nal medium.
Client/Server Architecture for the Data Warehouse Although mainframe and
minicomputer platforms were utilized in the early implementations of data warehouses,
by and large, today’s warehouses are built using the client/server architecture. Most of
DESKTOP
CLIENT
APPLICATION
SERVERS
DATABASE
SERVER
SERVICE TYPES
Presentation Logic
Presentation Service
Middleware/Connectivity/Control/
Metadata Management/Web Access/
Authentication/Query - Report
Management/OLAP
DBMS
Primary Data Repository
Figure 8-7 Client/server architecture for the data warehouse.
174 INFRASTRUCTURE AS THE FOUNDATION FOR DATA WAREHOUSING
206.
these are multitiered,second-generation client/server architectures. Figure 8-7 shows a
typical client/server architecture for a data warehouse implementation.
The data warehouse DBMS executes on the data server component. The data repository of
the data warehouse sits on this machine. This server component is a major component and it
is discussed in detail in the next section.
As data warehousing technologies have grown substantially, you will now observe a
proliferation of application server components in the middle tier. You will find application
servers for a number of purposes. Here are the important ones:
† To run middleware and establish connectivity
† To execute management and control software
† To handle data access from the Web
† To manage metadata
† For authentication
† As front end
† For managing and running standard reports
† For sophisticated query management
† For OLAP applications
Generally, the client workstations still handle the presentation logic and provide the
presentation services. Let us briefly address the significant considerations for the client
workstations.
Considerations for Client Workstations When you are ready to consider the con-
figurations for the workstation machines, you will quickly come to realize that you need
to cater to a variety of user types. We are only considering the needs at the workstation
with regard to information delivery from the data warehouse. A casual user is perhaps sat-
isfied with a machine that can run a Web browser to access HTML reports. A serious analyst,
on the other hand, needs a larger and more powerful workstation machine. The other types of
users between these two extremes need a variety of services.
Do you then come up with a unique configuration for each user? That will not be practical.
It is better to determine a minimum configuration on an appropriate platform that would sup-
port a standard set of information delivery tools in your data warehouse. Apply this configur-
ation for most of your users. Here and there, add a few more functions as necessary. For the
power users, select another configuration that would support tools for complex analysis.
Generally, this configuration for power users also supports OLAP. More recently, consider-
ations are given to the ability to support presentation of dashboards for continuous
monitoring.
The factors for consideration when selecting the configurations for your users’ worksta-
tions are similar to the ones for any operating environment. However, the main consideration
for workstations accessing the data warehouse is the support for the selected set of tools. This
is the primary reason for the preference of one platform over another.
Use this checklist while considering workstations:
† Workstation operating system
† Processing power
HARDWARE AND OPERATING SYSTEMS 175
207.
† Memory
† Diskstorage
† Network and data transport
† Tool support
Options as the Data Warehouse Matures After all this discussion of the comput-
ing platforms for your data warehouse, you might reach the conclusion that the platform
choice is fixed as soon as the initial choices are made. It is interesting to note that as the
data warehouse in each enterprise matures, the arrangement of the platforms also evolves.
Data staging and data storage may start out on the same computing platform. As time
goes by and more of your users begin to depend on your data warehouse for strategic decision
making, you will find that the platform choices may have to be recast. Figure 8-8 shows you
what to expect as your data warehouse matures.
Options in Practice Before we leave this section, it may be worthwhile to take a look
at the types of data sources and target platforms in use at different enterprises. An indepen-
dent survey has produced some interesting findings. Figure 8-9 shows the approximate
percentage distribution for the first part of the survey about the principal data sources.
Figure 8-10 shows the distribution of the answers to question about the platforms the
respondents use for the data storage component of their data warehouses.
STAGE 1
INITIAL
STAGE 2
GROWING
STAGE 3
MATURED
Desktop
Clients
Appln.
Server
Data
Warehouse/
Data Staging
Desktop
Clients
Appln.
Server
Data
Warehouse/
Data Mart
Data
Staging/
Development
Desktop
Clients
Appln.
Servers
Data Marts
Data
Staging
Development
Data
Warehouse/
Data Mart
Figure 8-8 Platform options as the data warehouse matures.
176 INFRASTRUCTURE AS THE FOUNDATION FOR DATA WAREHOUSING
208.
Server Hardware
Selecting theserver hardware is among the most important decisions your data warehouse
project team is faced with. Probably, for most warehouses, server hardware selection can
be a “bet your bottom dollar” decision. Scalability and optimal query performance are the
key phrases.
You know that your data warehouse exists for one primary purpose—to provide infor-
mation to your users. Ad hoc, unpredictable, complex querying of the data warehouse is
the most common method for information delivery. If your server hardware does not support
faster query processing, the entire project is in jeopardy.
The need to scale is driven by a few factors. As your data warehouse matures, you will see
a steep increase in the number of users and in the number of queries. The load will simply
shoot up. Typically, the number of active users doubles in six months. Again, as your data
warehouse matures, you will be increasing the content by including more business subject
areas and adding more data marts. Corporate data warehouses start at approximately 200
to 300 GB and some shoot up to a terabyte within 18 to 24 months.
Hardware options for scalability and complex query processing consist of four types of
parallel architecture. Initially, parallel architecture makes the most sense. Shouldn’t a
query complete faster if you increase the number of processors, each processor working
on parts of the query simultaneously? Can you not subdivide a large query into separate
tasks and spread the tasks among many processors? Parallel processing with multiple com-
puting engines does provide a broad range of benefits, but no single processing option does
everything right.
Mainframe legacy
database systems
Mainframe VSAM
and other files
Misc. including
outside sources
Other than
mainframe sources
40% 15%
20% 25%
Figure 8-9 Principal data sources.
UNIX-based client/server
with relational DBMS
Mainframe environment
with relational DBMS
Other technologies including
NT-based client/server
15%
55%
30%
Figure 8-10 Target platforms for the data storage component.
HARDWARE AND OPERATING SYSTEMS 177
209.
In Chapter 3,we reviewed parallel processing as one of the significant trends in data ware-
housing. We also briefly looked at three more common processing architectures. In this
section, let us summarize the current parallel processing hardware options. You will gain
sufficient insight into the features, benefits, and limitations of each of these options. By
doing so, you will be able contribute your understanding to your project team for selecting
the proper server hardware.
SMP (Symmetric Multiprocessing) Refer to Figure 8-11.
Features:
† This is a shared-everything architecture, the simplest parallel processing machine.
† Each processor has full access to the shared memory through a common bus.
† Communication between processors occurs through common memory.
† Disk controllers are accessible to all processors.
Benefits:
† This is a proven technology that has been used since the early 1970s.
† It provides high concurrency. You can run many concurrent queries.
† It balances workload very well.
† It gives scalable performance; simply add more processors to the system bus.
† Being a simple design, you can administer the server easily.
Limitations:
† Available memory may be limited.
† Performance may be limited by bandwidth for processor-to-processor communi-
cation, I/O, and bus communication.
† Availability is limited; like a single computer with many processors.
Shared Disks Shared Memory
Common Bus
Processor Processor Processor Processor
Figure 8-11 Server hardware option: SMP.
178 INFRASTRUCTURE AS THE FOUNDATION FOR DATA WAREHOUSING
210.
You may considerthis option if the size of your data warehouse is expected to be about
200 or 300 GB and concurrency requirements are reasonable.
Clusters Refer to Figure 8-12.
Features:
† Each node consists of one or more processors and associated memory.
† Memory is not shared among the nodes; it is shared only within each node.
† Communication occurs over a high-speed bus.
† Each node has access to the common set of disks.
† This architecture is a cluster of nodes.
Benefits:
† This architecture provides high availability; all data is accessible even if one node
fails.
† It preserves the concept of one database.
† This option is good for incremental growth.
Limitations:
† Bandwidth of the bus could limit the scalability of the system.
† This option comes with a high operating system overhead.
† Each node has a data cache; the architecture needs to maintain cache consistency for
internode synchronization. A cache is a “work area” holding currently used data; the
main memory is like a big file cabinet stretching across the entire room.
You may consider this option if your data warehouse is expected to grow in well-defined
increments.
Shared
Memory
Processor
Processor Processor Processor
Shared
Memory
Common High Speed Bus
Shared Disks
Figure 8-12 Server hardware option: cluster.
HARDWARE AND OPERATING SYSTEMS 179
211.
MPP (Massively ParallelProcessing) Refer to Figure 8-13.
Features:
† This is a shared-nothing architecture.
† This architecture is more concerned with disk access than memory access.
† It works well with an operating system that supports transparent disk access.
† If a database table is located on a particular disk, access to that disk depends entirely
on the processor that owns it.
† Internode communication is by processor-to-processor connection.
Benefits:
† This architecture is highly scalable.
† The option provides fast access between nodes.
† Any failure is local to the failed node; this improves system availability.
† Generally, the cost per node is low.
Limitations:
† The architecture requires rigid data partitioning.
† Data access is restricted.
† Workload balancing is limited.
† Cache consistency must be maintained.
Consider this option if you are building a medium-sized or large data warehouse in the
range of 400 to 500 GB. For larger warehouses in the terabyte range, look for special archi-
tectural combinations.
ccNUMA or NUMA (Cache-Coherent Nonuniform Memory Architecture)
Refer to Figure 8-14.
Features:
† This is the newest architecture; it was developed in the 1990s.
† The NUMA architecture is like a big SMP broken into smaller SMPs that are easier
to build.
Processor Processor Processor Processor
Memory Memory Memory Memory
Disk Disk Disk Disk
Figure 8-13 Server hardware option: MPP.
180 INFRASTRUCTURE AS THE FOUNDATION FOR DATA WAREHOUSING
212.
† The hardwareconsiders all memory units as one giant memory. The system has a
single real memory address space over the entire machine; memory addresses
begin with 1 on the first node and continue on the following nodes. Each node con-
tains a directory of memory addresses within that node.
† In this architecture, the amount of time needed to retrieve a memory value varies
because the first node may need the value that resides in the memory of the third
node. That is why this architecture is called nonuniform memory access architecture.
Benefits:
† Provides maximum flexibility.
† Overcomes the memory limitations of SMP.
† Better scalability than SMP.
† If you need to partition your data warehouse database and run these using a centra-
lized approach, you may want to consider this architecture. You may also place your
OLAP data on the same server.
Limitations:
† Programming NUMA architecture is more complex than even with MPP.
† Software support for NUMA is fairly limited.
† The technology is still maturing.
This option is a more aggressive approach for you. You may decide on a NUMA machine
consisting of one or two SMP nodes, but if your company is inexperienced in hardware tech-
nology, this option may not be for you.
DATABASE SOFTWARE
Examine the features of the leading commercial relational database management systems
(RDBMSs). As data warehousing has become widely prevalent, you now see data warehouse
features being included in software products. That is exactly what the database vendors have
been doing during the past decade. Data warehouse-related add-ons have become part of the
Processor Processor
Disks
Memory
Processor Processor
Disks
Memory
Figure 8-14 Server hardware option: NUMA.
DATABASE SOFTWARE 181
213.
database offerings. Databasesoftware that started out for use in operational OLTP systems
have been enhanced to cater to decision support systems. DBMSs have also been scaled up to
support very large databases.
Some RDBMS products now include support for the data acquisition area of the data
warehouse. Mass loading and retrieval of data from other database systems have become
easier. Some vendors have paid special attention to the data transformation function.
Replication features have been reinforced to assist in bulk refreshes and incremental loading
of the data warehouse.
Bit-mapped indexes could be very effective in a data warehouse environment to index on
fields that have a smaller number of distinct values. For example, in a database table contain-
ing geographic regions, the number of distinct region codes is few. But frequently, queries
involve selection by regions. In this case, retrieval by a bit-mapped index on the region code
values can be very fast. Vendors have strengthened this type of indexing. We will discuss bit-
mapped indexing further in Chapter 18.
Apart from these enhancements, the more important ones relate to load balancing and
query performance. These two features are critical in a data warehouse. Your data warehouse
is query-centric. Everything that can be done to improve query performance is most desir-
able. The DBMS vendors have provided parallel processing features to improve query per-
formance. Let us briefly review the parallel processing options within the DBMS that can
take full advantage of parallel server hardware.
Parallel Processing Options
Parallel processing options in database software are intended only for machines with
multiple processors. Most of the current database software can parallelize a large number
of operations. These operations include the following: mass loading of data, full table
scans, queries with exclusion conditions, queries with grouping, selection with distinct
values, aggregation, sorting, creation of tables using subqueries, creating and rebuilding
indexes, inserting rows into a table from other tables, enabling constraints, star transform-
ation (an optimization technique when processing queries against a STAR schema), and
so on. Notice that this is an impressive list of operations that the RDBMS can process in
parallel.
Let us now examine what happens when a user initiates a query at the workstation. Each
session accesses the database through a server process. The query is sent to the DBMS and
data retrieval takes place from the database. Data is retrieved and the results are sent back, all
under the control of the dedicated server process. The query dispatcher software is respon-
sible for splitting the work, distributing the units to be performed among the pool of available
query server processes, and balancing the load. Finally, the results of the query processes are
assembled and returned as a single, consolidated result set.
Interquery Parallelization In this method, several server processes handle multiple
requests simultaneously. Multiple queries may be serviced based on your server configur-
ation and the number of available processors. You may successfully take advantage of
this feature of the DBMS on SMP systems, thereby increasing the throughput and supporting
more concurrent users.
However, interquery parallelism is limited. Let us see what happens here. Multiple
queries are processed concurrently, but each query is still being processed serially by a
single server process. Suppose a query consists of index read, data read, join, and sort
182 INFRASTRUCTURE AS THE FOUNDATION FOR DATA WAREHOUSING
214.
operations; these operationsare carried out in this order. Each operation must finish before
the next one can begin. Parts of the same query do not execute in parallel. To overcome this
limitation, many DBMS vendors have come up with versions of their products to provide
intraquery parallelization.
Intraquery Parallelization We will use Figure 8-15 for our discussion of intraquery
parallelization. Understanding this will help you to match your choice of server hardware
with your selection of RDBMS.
Let us say a query from one of your users consists of an index read, a data read, a data join,
and a data sort from the data warehouse database. A serial processing DBMS will process
this query in the sequence of these base operations and produce the result set. However,
while this query is executing on one processor in the SMP system, other queries can execute
in parallel. This method is the interquery parallelization discussed above. The first group of
operations in Figure 8-15 illustrates this method of execution.
Using the intraquery parallelization technique, the DBMS splits the query into the lower-
level operations of index read, data read, data join, and data sort. Then each one of these basic
operations is executed in parallel on a single processor. The final result set is the consolida-
tion of the intermediary results. Let us review three ways a DBMS can provide intraquery
parallelization, that is, parallelization of parts of the operations within the same query itself.
Horizontal Parallelism The data is partitioned across multiple disks. Parallel processing
occurs within each single task in the query; for example, data read, which is performed on
multiple processors concurrently on different sets of data to be read from multiple disks.
After the first task is completed from all of the relevant parts of the partitioned data, the
next task of that query is carried out, and then the next one after that task, and so on. The
Interquery Parallelization
Index Read Data Read Join Sort
Intraquery Parallelization
Execution Time
Serial
Processing
CASE A:
Horizontal
Partitioning
CASE B:
Vertical
Partitioning
CASE C:
Hybrid
Method
Figure 8-15 Query parallelization by DBMS.
DATABASE SOFTWARE 183
215.
problem with thisapproach is the resulting wait until all the needed data is read. Look at Case
A in Figure 8-15.
Vertical Parallelism This kind of parallelism occurs among different tasks, not just a
single task in a query as in the case of horizontal parallelism. All component query oper-
ations are executed in parallel, but in a pipelined manner. This assumes that the RDBMS
has the capability to decompose the query into subtasks; each subtask has all the operations
of index read, data read, join, and sort. Then each subtask executes on the data in serial
fashion. In this approach, the database records are ideally processed by one step and immedi-
ately given to the next step for processing, thus avoiding wait times. Of course, in this
method, the DBMS must possess a very high level of sophistication in decomposing
tasks. Now, look at Case B in Figure 8-15.
Hybrid Method In this method, the query decomposer partitions the query both horizon-
tally and vertically. Naturally, this approach produces the best results. You will realize the
greatest utilization of resources, optimal performance, and high scalability. Case C in
Figure 8-15 illustrates this method.
Selection of the DBMS
Our discussions of the server hardware and the DBMS parallel processing options must have
convinced you that selection of the DBMS is most crucial. You must choose the server hard-
ware with the appropriate parallel architecture. Your choice of the DBMS must match with
the selected server hardware. These are critical decisions for your data warehouse.
While discussing how business requirements drive the design and development of the
data warehouse in Chapter 6, we briefly mentioned how requirements influence the selection
of the DBMS, Apart from the criteria that the selected DBMS must have load balancing and
parallel processing options, the other key features listed below must be considered when
selecting the DBMS for your data warehouse.
Query governor—to anticipate and abort runaway queries
Query optimizer—to parse and optimize user queries
Query management—to balance the execution of different types of queries
Load utility—for high-performance data loading, recovery, and restart
Metadata management—with an active data catalog or dictionary
Scalability—in terms of both number of users and data volumes
Extensibility—having hybrid extensions to OLAP databases
Portability—across platforms
Query tool Application Program Interfaces (APIs)—for tools from leading vendors
Administration—providing support for all DBA functions
COLLECTION OF TOOLS
Think about an OLTP application, perhaps a checking account system in a commercial bank.
When you, as a developer, designed and deployed the application, how many third-party
184 INFRASTRUCTURE AS THE FOUNDATION FOR DATA WAREHOUSING
216.
software tools didyou use to develop such an application? Of course, do not count the pro-
gramming language or the database software. We mean other third-party vendor tools for
data modeling, GUI design software, and so on. You probably used just a few, if any, at
all. Similarly, when the bank teller uses the application, she or he probably uses no third-
party software tools.
But a data warehouse environment is different. When you, as a member of the project
team, develop the data warehouse, you will use third-party tools for different phases of
the development. You may use code-generators for preparing in-house software for data
extraction. When the data warehouse is deployed, your users will be accessing information
through third-party query tools and creating reports with report writers. Software tools are
very significant parts of the infrastructure in a data warehouse environment.
Software tools are available for every architectural component of the data warehouse. As
the data warehousing has matured over the past decade, vendors have produced more and
more sophisticated and useful tools for all aspects. Figure 8-16 shows the tool groups that
support the various functions and services in a data warehouse.
Software tools are extremely important in a data warehouse. As you have seen from this
figure, tools cover all the major functions. Data warehouse project teams write in-house
only a small part of the software needed to perform these functions. Because the data ware-
house tools are so important, we will discuss these again in later chapters: data extraction and
transformation tools in Chapter 12, data quality tools in Chapter 13, and query tools in
Chapter 14. Also, Appendix C provides guidelines for evaluating vendor solutions. When
you get to the point of selecting tools for your data warehouse project, that list could serve
as a handy reference.
Data Storage
Data Acquisition Information Delivery
Data Loading
Data Quality
Data Transformation
Data Extraction
Source
Systems
Data
Warehouse/
Data Marts
Staging
Area
Data Modeling
MDDB
Data Warehouse Administration
Middleware and Connectivity
Queries and Reports
Dashboards
Scorecards
Alert Systems
Online Analytical
Processing (OLAP)
Data
Mining
DS
Apps.
Figure 8-16 Tools for your data warehouse.
COLLECTION OF TOOLS 185
217.
At this stage,let us introduce the types of software tools that are generally required in a
data warehouse environment. For each type, we will briefly discuss the purpose and
functions.
Before we get to the types of software tools, let us reiterate an important maxim that
was mentioned earlier in the previous chapter. In that chapter we discussed the architectural
components and studied the functions and services of individual components. Now go to the
next subsection here and read about that important principle again.
Architecture First, Then Tools
The title of this subsection simply means this: ignore the tools; design the architecture first;
then, and only then, choose the tools to match the functions and services stipulated for the
architectural components. Do the architecture first; select the tools later.
Why is this principle sacred? Why is it not advisable to just buy the set of tools and then
use the tools to build and to deploy your data warehouse? This appears to be an easy solution.
The salespersons of the tool vendors promise success. Why would this not work in the end?
Let us take an example.
Let us begin to design your information delivery architectural component. First of all, the
business requirements are the driving force. Your largest group of users is the group of power
users. They will be creating their own reports and run their own queries. These users will
constantly perform complex analysis consisting of drilling down, slicing and dicing of
data, and extensive visualization of result sets. You know these users are power users.
They need the most sophisticated information delivery component. The functions and ser-
vices of the information delivery component must be very involved and powerful. But
you have not yet established the information delivery architectural component.
Hold it right there. Let us now say that the salesperson from XYZ Report Writer, Inc. has
convinced you that their report generation tool is all you need for information delivery in
your data warehouse. Two of your competitors use it in their data warehouses. You buy
the tool and are ready to install it. What would be the fate of your power users? What is
wrong with this scenario? The information delivery tool was selected before the architectural
component was established. The tool did not meet the requirements as these would have been
reflected in the architecture.
Now let us move on to review the types of software tools for your data warehouse. As
mentioned earlier, more details will be added in the later chapters. These chapters will
also elaborate on individual tool types. In the following subsections, we mention the
basic purposes and features of the type of tool indicated by the title of each subsection.
Data Modeling
† Enable developers to create and maintain data models for the source systems and the
data warehouse target databases. If necessary, data models may be created for the
staging area.
† Provide forward engineering capabilities to generate the database schema.
† Provide reverse engineering capabilities to generate the data model from the data
dictionary entries of existing source databases.
† Provide dimensional modeling capabilities to data designers for creating STAR
schemas.
186 INFRASTRUCTURE AS THE FOUNDATION FOR DATA WAREHOUSING
218.
Data Extraction
† Twoprimary extraction methods are available: bulk extraction for full refreshes and
change-based replication for incremental loads.
† Tool choices depend on the following factors: source system platforms and databases,
and available built-in extraction and duplication facilities in the source systems.
Data Transformation
† Transform extracted data into appropriate formats and data structures.
† Provide default values as specified.
† Major features include field splitting, consolidation, standardization, and deduplication.
Data Loading
† Load transformed and consolidated data in the form of load images into the data ware-
house repository.
† Some loaders generate primary keys for the tables being loaded.
† For load images available on the same RDBMS engine as the data warehouse, pre-
coded procedures stored on the database itself may be used for loading.
Data Quality
† Assist in locating and correcting data errors.
† May be used on the data in the staging area or on the source systems directly.
† Help resolve data inconsistencies in load images.
Queries and Reports
† Allow users to produce canned, graphic-intensive, sophisticated reports.
† Help users to formulate and run queries.
† Two main classifications are report writers and report servers.
Dashboards
† Provide real-time or near real-time information to users in an interactive manner.
† Most real-time dashboards are linked directly to operational systems.
† Allow several capabilities for users such as drill down, parameter changes on the fly,
different kinds of displays, and so on.
Scorecards
† Allow users to select key performance indicators easily for reporting.
† Provide comparison of current performance against targets and past performance.
† Focus on clarity and ease of use.
COLLECTION OF TOOLS 187
219.
Online Analytical Processing(OLAP)
† Allow users to run complex dimensional queries.
† Enable users to generate canned queries.
† Two categories of online analytical processing are multidimensional online analytical
processing (MOLAP) and relational online analytical processing (ROLAP). MOLAP
works with proprietary multidimensional databases that receive data feeds from the
main data warehouse. ROLAP provides online analytical processing capabilities
from the relational database of the data warehouse itself.
Alert Systems
† Highlight and get user’s attention based on defined exceptions.
† Provide alerts from the data warehouse database to support strategic decisions.
† Three basic alert types are: from individual source systems, from integrated enterprise-
wide data warehouses, and from individual data marts.
Middleware and Connectivity
† Transparent access to source systems in heterogeneous environments.
† Transparent access to databases of different types on multiple platforms.
† Tools are moderately expensive but prove to be invaluable for providing interoperabil-
ity among the various data warehouse components.
Data Warehouse Administration
† Assist data warehouse administrators in day-to-day management.
† Some tools focus on the load process and track load histories.
† Other tools track types and number of user queries.
DATA WAREHOUSE APPLIANCES
In Chapter 3 while discussing data warehousing trends, we introduced the recently
prevalent trend of data warehouse appliances. In the present chapter we have reviewed
data warehouse infrastructure. We have seen how server hardware and the concomitant
operating system and database management system are crucial pieces of the infrastructure.
Companies that are gaining more and more experience in data warehousing have
realized the importance of parallel processing options for server hardware and accompany-
ing software to support parallel processing. As their data warehouses grew in size and
complexity, these companies addressed the challenges with constant upgrades to hardware
and software.
More recently, with enormous emphasis on business intelligence, the older methods of
constant upgrades do not seem to work. Upgrading hardware and software in a piecemeal
188 INFRASTRUCTURE AS THE FOUNDATION FOR DATA WAREHOUSING
220.
fashion opened upproblems of compatibility. This is because the hardware and software are
not specially designed and tuned for data warehouses with massive data volumes and com-
plex business intelligence delivery mechanisms. Consequently, organizations have begun to
use what are known as data warehouse appliances.
A data warehouse appliance is a device with hardware and software components specifi-
cally designed and architected for data warehouses. Through its architecture, a data ware-
house appliance integrates processor hardware, data storage, operating systems, and
database software into one unified whole. Scalability all around is achieved easily as
almost all the components come from a single vendor.
Evolution of DW Appliances
Beginning with the adoption of data warehouses by organizations, in many cases the
business intelligence infrastructure remains a loosely coupled patchwork of hardware, soft-
ware, and storage. Typically what we notice as the common configuration consists of the
following:
† Hardware and operating system, generically put together, and continuously optimized
and upgraded
† Database management system (DBMS), initially designed for transaction processing,
now amended and enlarged to support unexpectedly large volumes of data in a data
warehouse
† Storage units and storage management, ever expanding to suit the needs of a data
warehouse
The only answer to increased demand for business intelligence seems to be just adding
hardware, software, and storage up to the breaking point. In most companies the situation
is getting worse.
In this context, the data warehouse appliance is crafted specifically to streamline business
intelligence workload by integrating hardware, software, and storage components. The best
features of SMP and MPP approaches are embedded into the appliance architecture to pro-
duce the best results.
Generally, Teradata’s core product line is considered the mother of all data warehouse
appliances, although the term was not associated with the product offering. Greater interest
in data warehouse appliances surged with the emergence of Netezza in the early 2000s.
This vendor did much to prove the concept and educate organizations in the data warehouse
arena. The term data warehouse appliance was coined by Foster Hinshaw, a founder of
Netezza.
As of 2009, we are into a second generation of data warehouse appliances resulting from
mainstream vendor integration. Vendors have created DW appliances totally with their own
products. Some other vendors have partnered with major hardware vendors to create bundles
to constitute their DW appliance offerings.
As the data warehousing and business intelligence markets mature, we have noticed stan-
dardization of interfaces, protocols, features, and functionality of components. The data
warehouse appliance, as it emerges in this climate of standardization, is easily being
made to work seamlessly with tools and applications.
DATA WAREHOUSE APPLIANCES 189
221.
Benefits of DWAppliances
Asdatawarehouseappliances gainpopularityandusage, organizations acquiring theseobtain
a number of benefits. The following highlight the benefits of data warehouse appliances.
Cost Reduction The total cost associated with a data warehouse mainly breaks down
into initial set-up cost and ongoing maintenance cost. Data warehouse appliances incur
less initial costs compared to the alternative options. Ongoing maintenance also costs
less. As powerful, off-the-shelf components continue to drop in price, the data warehouse
constructed with such components will reflect the price reduction. Wherever a data ware-
house appliance is put together with components from a single vendor, the total cost of
ownership is linked to just one vendor, with great reduction in support costs.
Performance Improvement Favorable price/performance ratio stands out as a great
benefit from data warehouse appliances. Most appliances support mixed workloads,
enabling reports, queries, and complex analysis to be run simultaneously with ease. DW
appliance vendors apply various partitioning and load distribution methods to achieve par-
allel processing. Improved performance opens up great possibilities to the user. Reports that
took days for turnaround would now take hours; analysis that took hours would now take
minutes; queries that ran for minutes would now take seconds.
High Availability By building in selective redundancy, DW appliance vendors are able
to provide high availability. Many vendors offer warm-standby servers, dual power supplies,
backup networks, disk mirroring, and automatic solutions for server failures.
Reduced Administration A DW appliance is an administrator’s dream. The integrated
nature of the components in an appliance translates into greatly reduced time for trouble-
shooting and maintenance. As most DW appliances are single-vendor devices, the design
and responsibility for optimization rest with single vendors. The data warehouse administra-
tor needs to spend a lot less time on administrative tasks. DW appliances reduce administra-
tive costs through features such as automated space allocation, reduced index maintenance,
and reduced performance tuning.
Scalability Most DW appliances implement a modular design for each of the com-
ponents. This makes it easy for the appliances to scale for both capacity and performance.
For example, in MPP architectures, adding servers improves performance and capacity.
Reliability The homogeneous nature of a DW appliance, usually with components from a
single owner, contributes to its reliability. The users need not perform difficult and uncertain
integration of disk storage, operating systems, DBMS, and processors and attempt to make
them all work together. A DW appliance is a single, architected, cohesive device.
Faster Implementation Because DW appliances may be implemented without
regression or integration testing, the overall implementation time is greatly reduced. Also,
rapid prototyping is possible with DW appliances. Faster implementation means ability to
reap the benefits of business intelligence in the current business cycle itself.
190 INFRASTRUCTURE AS THE FOUNDATION FOR DATA WAREHOUSING
222.
CHAPTER SUMMARY
† Infrastructureacts as the foundation supporting the data warehouse architecture.
† The data warehouse infrastructure consists of operational infrastructure and physical
infrastructure.
† Hardware and operating systems make up the computing environment for the data
warehouse.
† Several options exist for the computing platforms needed to implement the various
architectural components.
† Selecting the server hardware is a key decision. Invariably, the choice is one of four
parallel server architectures.
† Parallel processing options are critical in the DBMS. Current database software pro-
ducts are able to perform interquery and intraquery parallelization.
† Software tools are used in the data warehouse for data modeling, data extraction, data
transformation, data loading, data quality assurance, queries and reports, and online
analytical processing (OLAP). Tools are also used as middleware, alert systems, and
for data warehouse administration.
† A data warehouse appliance is an architected device consisting of integrated hardware
processors, storage, operating systems, and DBMS, specifically preoptimized for data
warehousing. Usually, these are single-vendor solutions, providing substantial
benefits. DW appliances are becoming more and more popular.
REVIEW QUESTIONS
1. What is the composition of the operational infrastructure of the data warehouse? Why is
the operational infrastructure as important as the physical infrastructure?
2. List the major components of the physical infrastructure. Write two or three sentences to
describe each component.
3. Briefly describe any six criteria you will use for selecting the operating system for your
data warehouse.
4. What are the platform options for the staging area? Compare the options and mention the
advantages and disadvantages.
5. What are the four common methods for data movement within the data warehouse?
Explain any two of these methods.
6. What are data warehouse appliances? List their benefits.
7. What are the four parallel server hardware options? List the features, benefits, and limit-
ations of any one of these options.
8. How have RDBMS vendors enhanced their products for data warehousing? Describe
briefly in one or two paragraphs.
9. What is intraquery parallelization by the DBMS? What are the three methods?
10. List any six types of software tools used in the data warehouse. Pick any three types from
your list and describe the features and the purposes.
REVIEW QUESTIONS 191
223.
EXERCISES
1. Match thecolumns:
1. operational infrastructure
2. preemptive multitasking
3. shared disk
4. MPP
5. SMP
6. interquery parallelization
7. intraquery parallelization
8. NUMA
9. UNIX-based system
10. data staging area
A. shared-nothing architecture
B. provides high concurrency
C. single memory address space
D. operating system feature
E. vertical parallelism
F. people, procedures, training
G. easy administration
H. choice data warehouse platform
I. optimize for data transformation
J. data movement option
2. In your company, all the source systems reside on a single UNIX-based platform, except
one legacy system on a mainframe computer. Analyze the platform options for your data
warehouse. Would you consider the single-platform option? If so, why? If not, why not?
3. You are the manager for the data warehouse project of a nationwide car rental company.
Your data warehouse is expected to start out in the 500 GB range. Examine the options for
server hardware and write a justification for choosing one.
4. As the administrator of the proposed data warehouse for a hotel chain with a leading pres-
ence in 10 eastern states, write a proposal describing the criteria you will use to select the
RDBMS for your data warehouse. Make your assumptions clear.
5. You are the senior analyst responsible for the tools in the data warehouse of a large local
bank with branches in only one state. Make a list of the types of tools you will provide for
use in your data warehouse. Include tools for developers and users. Describe the features
you will be looking for in each tool type.
192 INFRASTRUCTURE AS THE FOUNDATION FOR DATA WAREHOUSING
224.
CHAPTER 9
THE SIGNIFICANTROLE OF METADATA
CHAPTER OBJECTIVES
† Find out why metadata is so important
† Understand who needs metadata and what types they need
† Review metadata types by the three functional areas
† Discuss business metadata and technical metadata in detail
† Examine all the requirements metadata must satisfy
† Understand the challenges for metadata management
† Study options for providing metadata
We discussed metadata briefly in earlier chapters. In Chapter 2, we considered metadata as
one of the major building blocks for a data warehouse. We grouped metadata into three types,
namely, operational, extraction and transformation, and end-user metadata. While discussing
the major data warehousing trends in Chapter 3, we reviewed the industry initiatives to
standardize metadata.
This chapter deals with the topic of metadata in further depth. We will attempt to remove
uncertainty you may have about the exact meaning, content, and characteristics of metadata.
We will also get an appreciation for why metadata is vitally important. Further, we will look
for practical methods to provide effective metadata in a data warehouse environment.
WHY METADATA IS IMPORTANT
Let us begin with a positive assumption. Assume that your project team has successfully
completed the development of the first data mart. Everything was done according to
Data Warehousing Fundamentals for IT Professionals, Second Edition. By Paulraj Ponniah
Copyright # 2010 John Wiley & Sons, Inc.
193
225.
schedule. Your managementis pleased that the team finished the project under budget and
comfortably before the deadline. All the results proved out in comprehensive testing. Your
data warehouse is ready to be deployed. This is the big day.
One of your prominent users is sitting at the workstation poised to compose and run
the first query. Before he or she touches the keyboard, several important questions come
to mind.
† Are there any predefined queries I can look at?
† What are the various elements of data in the warehouse?
† Is there information about unit sales and unit costs by product?
† How can I browse and see what is available?
† From where did they get the data for the warehouse? From which source systems?
† How did they merge the data from the telephone orders system and the mail orders
system?
† How old is the data in the warehouse?
† When was the last time fresh data was brought in?
† Are there any summaries by month and by product?
These questions and several more like them are very valid and pertinent. What are the
answers? Where are the answers? Can your user see the answers? How easy is it for the
user to get to the answers?
Metadata in a data warehouse contains the answers to questions about the data in the data
warehouse. You keep the answers in a place generally called the metadata repository. Even if
you ask just a few data warehousing practitioners or if you read just a few of the books on data
warehousing, you will receive seemingly different definitions for metadata. Here is a sample
list of definitions:
† Data about the data
† Table of contents for the data
† Catalog for the data
† Data warehouse atlas
† Data warehouse roadmap
† Data warehouse directory
† Glue that holds the data warehouse contents together
† Tongs to handle the data
† The nerve center
So, what exactly is metadata? Which one of these definitions comes closest to the truth?
Let us take a specific example. Assume your user wants to know about the table or entity
called Customer in your data warehouse before running any queries on customer data.
What is the information content about Customer in your metadata repository? Let us
review the metadata element for the Customer entity as shown in Figure 9-1.
What do you see in the figure? The metadata element describes the entity called Customer
residing the data warehouse. It is not just a description. It tells you more. It gives more than
the explanation of the semantics and the syntax. Metadata describes all the pertinent aspects
194 THE SIGNIFICANT ROLE OF METADATA
226.
of the datain the data warehouse fully and precisely. Pertinent to whom? Pertinent primarily
to the users and also to you as developer and part of the project team.
In this chapter, we will explore why metadata has a very significant role in the data ware-
house. We will find out why and how metadata is vital to the users and the developers.
Without metadata, your data warehouse will simply be a disjointed system. If metadata is
so significant, how best can you provide it? We will discuss some available options and
make some valid suggestions.
A Critical Need in the Data Warehouse
Let us first examine the need for metadata in a slightly general way. We will get more specific
in later sections. In broad terms, proper metadata is absolutely necessary for using, building,
and administering your data warehouse.
For Using the Data Warehouse There is one big difference between a data ware-
house and any operational system such as an order processing application. The difference
is in the usage—the information access. In an order processing application, how do your
users get information? You provide them with GUI screens and predefined reports. They
get information about pending or back orders through the relevant screens. They get infor-
mation about the total orders for the day from specific daily reports. You created the screens
and you formatted the reports for the users. Of course, these were designed based on speci-
fications from the users. Nevertheless, the users themselves do not create the screen formats
or lay out the reports every time they need information.
In marked contrast, users themselves retrieve information from the data warehouse. By
and large, users themselves create ad hoc queries and run these against the data warehouse.
Entity Name: Customer
Alias Names: Account, Client
Definition: A person or an organization that purchases goods or services
from the company.
Remarks: Customer entity includes regular, current, and past customers.
Source Systems: Finished Goods Orders, Maintenance Contracts, Online Sales.
Create Date: January 15, 2006
Last Update Date: January 21, 2008
Update Cycle: Weekly
Last Full Refresh Date: December 29, 2007
Full Refresh Cycle: Every six months
Data Quality Reviewed: January 25, 2008
Last Deduplication: January 10, 2008
Planned Archival: Every six months
Responsible User: Jane Brown
Figure 9-1 Metadata element for the entity Customer.
WHY METADATA IS IMPORTANT 195
227.
They format theirown reports. Because of this major difference, before they can create and
run their queries, users need to know about the data in the data warehouse. They need
metadata.
In our operational systems, however, we do not really have any easy and flexible methods
for knowing the nature of the contents of the database. In fact, there is no great need for user-
friendly interfaces to the database contents. The data dictionary or catalog is meant for IT
uses only.
The situation for a data warehouse is totally different. Your data warehouse users need to
receive maximum value from your data warehouse. They need sophisticated methods for
browsing and examining the contents of the data warehouse. They need to know the mean-
ings of the data items. You have to prevent them from drawing wrong conclusions from their
analysis through their ignorance about the exact meanings.
Earlier data mart implementations were limited in scope to probably one subject area.
Mostly, those data marts were used by small groups of users in single departments. The
users of those data marts were able to get by with scanty metadata. Today’s data warehouses
are much wider in scope and larger in size. Without adequate metadata support, users of
these larger data warehouses are totally handicapped.
For Building the Data Warehouse Let us say you are the data extraction and trans-
formation expert on the project team. You know data extraction methods very well. You can
work with data extraction tools. You understand the general data transformation techniques.
But, in order to apply your expertise, first you must know the source systems and their data
structures. You need to know the structures and the data content in the data warehouse. Then
you need to determine the mappings and the data transformations. So far, to perform your
tasks in building the data extraction and data transformation component of the data ware-
house, you need metadata about the source systems, source-to-target mappings, and data
transformation rules.
Try to wear a different hat. You are now the database administrator (DBA) for the data
warehouse database. You are responsible for the physical design of the database and for
doing the initial loading. You are also responsible for periodic incremental loads. There
are more responsibilities for you. Even ignoring all the other responsibilities for a
moment, in order to perform just the tasks of physical design and loading, you need metadata
about a number of things. You need the layouts in the staging area. You need metadata about
the logical structure of the data warehouse database. You need metadata about the data
refresh and load cycles. This is just the bare minimum information you need.
If you consider every activity and every task for building the data warehouse, you will
come to realize that metadata is an overall compelling necessity and a very significant com-
ponent in your data warehouse. Metadata is absolutely essential for building your data
warehouse.
For Administering the Data Warehouse Because of the complexities and enormous
sizes of modern data warehouses, it is impossible to administer the data warehouse without
substantial metadata. Figure 9-2 lists a series of questions relating to data warehouse admini-
stration. Review each question on the list carefully. You cannot administer your data
warehouse without answers to these questions. Your data warehouse metadata must address
these issues.
Figure 9-3 gives you an idea about who needs and uses metadata. We will elaborate on
this in later sections.
196 THE SIGNIFICANT ROLE OF METADATA
228.
How to handledata changes?
How to include new sources?
Where to cleanse the data? How to change
the data cleansing methods?
How to cleanse data after populating the
warehouse?
How to switch to new data transformation
techniques?
How to audit the application of ongoing
changes?
How to add new external data sources?
How to drop some external data sources?
When mergers and acquisitions happen, how
to bring in new data to the warehouse?
How to verify all external data on ongoing
basis?
How to add new summary tables?
How to control runaway queries?
How to expand storage?
When to schedule platform upgrades?
How to add new information delivery
tools for the users?
How to continue ongoing training?
How to maintain and enhance user
support function?
How to monitor and improve ad hoc
query performance?
When to schedule backups?
How to perform disaster recovery drills?
How to keep data definitions up-to-date?
How to maintain the security system?
How to monitor system load
distribution?
Data Extraction/Transformation/Loading
Data from External Sources
Data Warehouse
Figure 9-2 Data warehouse administration: questions and issues.
Databases, Tables,
Columns, Server
Platforms
Databases, Tables,
Columns
List of Predefined
Queries and Reports,
Business Views
Data Structures, Data
Definitions, Data
Mapping, Cleansing
Functions,
Transformation Rules
Business Terms, Data
Definitions, Data
Mapping, Cleansing
Functions,
Transformation Rules
Business Terms, Data
Definitions, Filters,
Data Sources,
Conversion , Data
Owners
Program Code in
SQL, 3GL, 4GL,
Front-end
Applications, Security
Query Toolsets,
Database Access for
Complex Analysis
Authorization
Requests, Information
Retrieval into Desktop
Applications such as
Spreadsheets
I
n
f
o
r
m
a
t
i
o
n
D
i
s
c
o
v
e
r
y
I
n
f
o
r
m
a
t
i
o
n
A
c
c
e
s
s
M
e
a
n
i
n
g
o
f
D
a
t
a
IT Professionals Power Users Casual Users
Figure 9-3 Who needs metadata?
WHY METADATA IS IMPORTANT 197
229.
Imagine a filingcabinet stuffed with documents without any folders and labels. Without
metadata, your data warehouse is like such a disorganized filing cabinet. It is probably filled
with information very useful for your users and for IT developers and administrators. But
without an easy means to know what is there, the data warehouse is of very limited value.
Metadata is Like a Nerve Center Various processes during the building and admini-
stering of the data warehouse generate parts of the data warehouse metadata. Parts of
metadata generated by one process are used by another. In the data warehouse, metadata
assumes a key position and enables communication among various processes. It acts like
a nerve center in the data warehouse. Figure 9-4 shows the location of metadata within
the data warehouse. Use this figure to determine the metadata components that apply to
your data warehouse environment. By examining each metadata component closely, you
will also perceive that the individual parts of the metadata are needed by two groups of
people: (1) end-users, and (2) IT developers and administrators. In the next two subsections,
we will review why metadata is critical for each of these two groups.
Why Metadata Is Vital for End-Users
The following would be a typical use of your data warehouse by a key user, say, a business
analyst. The marketing VP of your company has asked this business analyst to do a thorough
analysis of a problem that recently surfaced. Because of the enormous sales potential in the
midwest and northeast regions, your company has opened five new stores in each region.
Although overall countrywide sales increased nicely for two months following the opening
of the stores, after that the sales went back to the prior levels and remained flat. The
marketing VP wants to know why, so that she can take appropriate action.
Extraction
Tool
Source
Systems
Cleansing
Tool
Transfor-
mation
Tool
Data
Load
Function External
Data
Query
Tool
Reporting
Tool
OLAP
Tool
Data
Mining
Appli-
cations
DATA
WAREHOUSE
METADATA
Figure 9-4 The location of metadata within the data warehouse.
198 THE SIGNIFICANT ROLE OF METADATA
230.
As a user,the business analyst expects to find answers from the new data warehouse, but
he does not know the details about the data in the data warehouse. Specifically, he does not
know the answers to the following questions:
† Are the sale units and dollars stored by individual transactions or as summary totals, by
product, for each day in each store?
† Can sales be analyzed by product, promotion, store, and month?
† Can current-month sales be compared to sales in the same month last year?
† Can sales be compared to targets?
† How is profit margin calculated? What are the business rules?
† What is the definition of a sales region? Which districts are included in each of the two
regions being analyzed?
† Where did the sales come from? From which source systems?
† How old are the sales numbers? How often do these numbers get updated?
If the analyst is not sure of the nature of the data, he is likely to interpret the results of the
analysis incorrectly. It is possible that the new stores are cannibalizing sales from other stores
in their region and that is why the overall sales remain flat. But the analyst may not find the
right reasons because of misinterpretation of the results.
The analysis will be more effective if you provide adequate metadata to help as a powerful
roadmap of the data. If there is sufficient and proper metadata, the analyst does not have to
get assistance from IT every time he needs to run an analysis. Easily accessible metadata is
crucial for end-users.
Let us take the analogy of an industrial warehouse storing items of merchandise sold
through a catalog. The customer refers to the catalog to find the merchandise to be ordered.
The customer uses the item number in the catalog to place the order. Also, the catalog indi-
cates the color, size, and shape of the merchandise item. The customer calculates the total
amount to be paid from the price details in the catalog. In short, the catalog covers all the
items in the industrial warehouse, describes the items, and facilitates the placing of the order.
In a similar way, the user of your data warehouse is like the customer. A query for infor-
mation from the user is like an order for items of merchandise in the industrial warehouse.
Just as the customer needs the catalog to place an order, so does your user need metadata to
run a query on your data warehouse.
Figure 9-5 summarizes the vital need of metadata for end-users. The figure shows the
types of information metadata provides to the end-users and the purposes for which they
need these types of information.
Why Metadata Is Essential for IT
Development and deployment of your data warehouse is a joint effort between your IT staff
and your user representatives. Nevertheless, because of the technical issues, IT is primarily
responsible for the design and ongoing administration of the data warehouse. For performing
the responsibilities for design and administration, IT must have access to proper metadata.
Throughout the entire development process, metadata is essential for IT. Beginning with
the data extraction and ending with information delivery, metadata is crucial for IT. As the
development process moves through data extraction, data transformation, data integration,
WHY METADATA IS IMPORTANT 199
231.
data cleansing, datastaging, data storage, query and report design, and design for OLAF and
other front-end systems, metadata is critical for IT to perform their development activities.
Here is a summary list of processes in which metadata is significant for IT:
† Data extraction from sources
† Data transformation
† Data scrubbing
† Data aggregation and summarization
† Data staging
† Data refreshment
† Database design
† Query and report design
Figure 9-6 summarizes the essential need for metadata for IT. The figure shows the
types of information metadata provides IT staff and the purposes for which they need
these types of information.
Automation of Warehousing Tasks
Maintaining metadata is no longer a form of glorified documentation. Traditionally, meta-
data has been created and maintained as documentation about the data for each process.
Now metadata is assuming a new active role. Let us see how this is happening.
As you know, tools perform major functions in a data warehouse environment. For
example, tools enable the extraction of data from designated sources. When you provide
the mapping algorithms, data transformation tools transform data elements to suit the
METADATA VITAL FOR END-USERS
Data content
Summary data
Business dimensions
Business metrics
Navigation paths
Source systems
External data
Data transformation rules
Last update dates
Data load/update cycles
Query templates
Report formats
Predefined queries/reports
OLAP data
METADATA
ESSENTIAL
FOR IT
END-USERS
Figure 9-5 Metadata vital for end-users.
200 THE SIGNIFICANT ROLE OF METADATA
232.
target data structures.You may specify valid values for data elements and the data quality
tools will use these values to ensure the integrity and validity of data. At the front end,
tools empower the users to browse the data content and gain access to the data warehouse.
These tools generally fall into two categories: development tools for IT professionals, and
information access tools for end-users.
When you, as a developer, use a tool for design and development, in that process, the tool
lets you create and record a part of the data warehouse metadata. When you use another tool
to perform another process in the design and development, this tool uses the metadata created
by the first tool. When your end-user uses a query tool for information access at the front end,
that query tool uses metadata created by some of the back-end tools. What exactly is happen-
ing here with metadata? Metadata is no longer passive documentation. Metadata takes part in
the process. It aids in the automation of data warehouse processes.
Let us consider the back-end processes beginning with the defining of the data sources.
As the data movement takes place from the data sources to the data warehouse database
through the data staging area, several processes occur. In a typical data warehouse, appropri-
ate tools assist in these processes. Each tool records its own metadata as data movement takes
place. The metadata recorded by one tool drives one or more processes that follow. This is
how metadata assumes an active role and assists in the automation of data warehouse
processes.
Here is a list of back-end processes shown in the order in which they generally occur:
1. Source data structure definition
2. Data extraction
3. Initial reformatting/merging
4. Preliminary data cleansing
METADATA ESSENTIAL FOR IT
Source data structures
Source platforms
Data extraction methods
External data
Data transformation rules
Data cleansing rules
Staging area structures
Dimensional models
Initial loads
Incremental loads
Data summarization
OLAP system
Web-enabling
Query/report design
METADATA
VITAL FOR
END-USERS
IT
PROFESSIONALS
Figure 9-6 Metadata essential for IT.
WHY METADATA IS IMPORTANT 201
233.
5. Data transformationand consolidation
6. Validation and quality check
7. Data warehouse structure definition
8. Load image creation
Figure 9-7 shows each of these eight processes. The figure also indicates the metadata
recorded by each process. Further, the figure points out how each process is able to use
the metadata recorded in the earlier processes.
Metadata is important in a data warehouse because it drives the processes. However, our
discussion above leads to the realization that each tool may record metadata in its own pro-
prietary format. Again, the metadata recorded by each tool may reside on the platform where
the corresponding process runs. If this is the case, how can the metadata recorded by one tool
in a proprietary format drive the process for the next tool? This is a critical question. This is
where standardization of metadata comes into play. We will get to the discussion on metadata
standards later in the chapter.
Establishing the Context of Information
Imagine this scenario. One of your users wants to run a query to retrieve sales data for three
products during the first seven days of April in the southern region. This user composes the
query as follows:
Product ¼ Widget-1 or Widget-2 or Widget-3, Region ¼ ‘SOUTH’
Period ¼ 04-01-2009 to 04-07-2009
Source
Data
Structure
Definition
Source system
platforms, data
structures
Data
Transformation
and
Consolidation
Data transformation
rules, aggregation
Data
Extraction
Extraction
techniques,
initial files and
structures
Validation
and Quality
Check
Quality
verification
rules
Initial
Reformatting/
Merging
Sort/merge rules,
merged files and
structures
Preliminary
Data
Cleansing
Data cleansing
rules
Data
Warehouse
Structure
Definition
Data models --
logical/physical
Load
Image
Creation
Key structuring
rules, DBMS
considerations
Process Associated Metadata
Figure 9-7 Metadata drives data warehouse processes.
202 THE SIGNIFICANT ROLE OF METADATA
234.
The result comesback:
Sale Units Amount
Widget-1 25,355 253,550
Widget-2 16,978 254,670
Widget-3 7,994 271,796
Let us examine the query and the results. In the specification for region, which territories
does the region “SOUTH” include? Are these the territories your user is interested in? What
is the context of the data item “SOUTH” in your data warehouse? Next, does the data item
04-01-2009 denote April 1, 2009 or January 4, 2009? What is the convention used for dates
in your data warehouse?
Look at the result set. Are the numbers shown as sale units given in physical units of the
products, or in some measure such as pounds or kilograms? What about the amounts shown
in the result set? Are these amounts in dollars or in euros? This is a pertinent question if your
user is accessing your data warehouse from Europe.
For the dates stored in your data warehouse, if the first two digits of the date format indi-
cate the month and the next two digits denote the date, then 04-01-2009 means April 1, 2009.
Only in this context is the interpretation correct. Similarly, context is important for the
interpretation of the other data elements.
How can your user find out what exactly each data element in the query is and what the
result set means? The answer is metadata. Metadata gives your user the meaning of each data
element. Metadata establishes the context for the data elements. Data warehouse users,
developers, and administrators interpret each data element in the context established and
recorded in metadata.
METADATA TYPES BY FUNCTIONAL AREAS
So far in this chapter, we have discussed several aspects of metadata in a data warehouse
environment. We have seen why metadata is a critical need for end-users as well as for IT
professionals who are responsible for development and administration. We have established
that metadata plays an active role in the automation of data warehouse processes.
At this stage, we can increase our understanding further by grouping the various types of
metadata. When you classify each type, your appreciation for each type will increase and you
can better understand the role of metadata within each group.
Different authors and data warehouse practitioners classify and group metadata in various
ways: some by usage and some by who uses it. Let us look at some of the different methods
for classification of metadata:
† Administrative/end-user/optimization
† Development/usage
† In the data mart/at the workstation
† Building/maintaining/managing/using
† Technical/business
† Back room/front room
† Internal/external
METADATA TYPES BY FUNCTIONAL AREAS 203
235.
In an earlierchapter, we considered a way of dividing the data warehouse environment
by means of the major functions. We can picture the data warehouse environment as
being functionally divided into the three areas of data acquisition, data storage, and infor-
mation delivery. All data warehouse processes occur in these three functional areas. As a
developer, you design the processes in each of the three functional areas. Each of the
tools used for these processes creates and records metadata and may also use and be
driven by the metadata recorded by other tools.
First, let us group the metadata types by these three functional areas. Why? Because every
data warehouse process occurs in one of just these three areas. Take into account all the pro-
cesses happening in each functional area and then put together all the processes in all the
three functional areas. You will get a complete set of the data warehouse processes without
missing any one. Also, you will be able to compile a complete list of metadata types.
Let us move on to the classification of metadata types by the functional areas in the data
warehouse:
1. Data acquisition
2. Data storage
3. Information delivery
Data Acquisition
In this area, the data warehouse processes relate to the following functions:
† Data extraction
† Data transformation
† Data cleansing
† Data integration
† Data staging
As the processes take place, the appropriate tools record the metadata elements relating to
the processes. The tools record the metadata elements during the development phases as well
as while the data warehouse is in operation after deployment.
As an IT professional and part of the data warehouse project team, you will be using
development tools that record metadata relating to this area. Also, some other tools you
will be using for other processes either in this area or in some other area may use the metadata
recorded by other tools in this area. For example, when you use a query tool to create stan-
dard queries, you will be using metadata recorded by processes in the data acquisition area.
As you will note, the query tool is meant for a process in a different area, namely, the infor-
mation delivery area.
IT professionals will also be using metadata recorded by processes in the data acquisition
area for administering and monitoring the ongoing functions of the data warehouse after
deployment. You will use the metadata from this area to monitor ongoing data extraction
and transformation. You will make sure that the ongoing load images are created properly
by referring to the metadata from this area.
The users of your data warehouse will also be using the metadata recorded in the data
acquisition area. When a user wants to find the data sources for the data elements in his
or her query, he or she will look up the metadata from the data acquisition area. Again,
204 THE SIGNIFICANT ROLE OF METADATA
236.
when the userwants to know how the profit margin has been calculated and stored in the data
warehouse, he or she will look up the derivation rules in the metadata recorded in the data
acquisition area.
For metadata types recorded and used in the data acquisition area, refer to Fig. 9-8. This
figure summarizes the metadata types and the relevant data warehouse processes. Try to
relate these metadata types and processes to your data warehouse environment.
Data Storage
In this area, the data warehouse processes relate to the following functions:
† Data loading
† Data archiving
† Data management
Just as in the other areas, as processes take place in the data storage functional area, the
appropriate tools record the metadata elements relating to the processes. The tools record the
metadata elements during the development phases as well as while the data warehouse is in
operation after deployment.
Similar to metadata recorded by processes in the data acquisition area, metadata recorded
by processes in the data storage area is used for development, administration, and by the
users. You will be using the metadata from this area for designing the full data refreshes
and the incremental data loads. The DBA will be using metadata for the processes of
backup, recovery, and tuning the database. For purging the data warehouse and for periodic
archiving of data, metadata from this area will be used for data warehouse administration.
DATA ACQUISITION
PROCESSES
Data Extraction, Data
Transformation, Data Cleansing,
Data Integration, Data Staging
METADATA TYPES
Source system platforms
Source system logical models
Source system physical models
Source structure definitions
Data extraction methods
Data transformation rules
Data cleansing rules
Summarization rules
Target logical models
Target physical models
Data structures in staging area
Source to target relationships
External data structures
External data definitions
Figure 9-8 Data acquisition: metadata types.
METADATA TYPES BY FUNCTIONAL AREAS 205
237.
Will the usersbe using metadata from the data storage functional area? To give you just
one example, let us say one of your users wants to create a query breaking the total quarterly
sales down by sale districts. Before the user runs the query, he or she would like to know
when was the last time the data on district delineation was loaded. From where can the
user get the information about load dates of the district delineation? Metadata recorded by
the data loading process in the data storage functional area will give the user the latest
load date for district delineation.
For metadata types recorded and used in the data storage area, refer to Fig. 9-9. This figure
summarizes the metadata types and the relevant data warehouse processes. See how the
metadata types and the processes relate to your data warehouse environment.
Information Delivery
In this area, the data warehouse processes relate to the following functions:
† Report generation
† Query processing
† Complex analysis
Mostly, the processes in this area are meant for end-users. While using the processes, end-
users generally use metadata recorded in processes of the other two areas of data acquisition
and data storage. When a user creates a query with the aid of a query processing tool, he or
she can refer back to metadata recorded in the data acquisition and data storage areas and can
look up the source data configurations, data structures, and data transformations from the
metadata recorded in the data acquisition area. In the same way, from metadata recorded
DATA STORAGE
PROCESSES
Load Image Creation, Data Loading,
Data Archiving, Data Management
METADATA TYPES
Source logical models
Source physical models
Target logical models
Target physical models
Source-target mapping
Key restructuring rules
Data application methods
Initial load procedure and stats.
Incremental loads procedure
Rules for handling load
exceptions
Data archival rules
Storage allocations
Backup/recovery procedures
Database fine-tuning stats.
Figure 9-9 Data storage: metadata types.
206 THE SIGNIFICANT ROLE OF METADATA
238.
in the datastorage area, the user can find the date of the last full refresh and the incremental
loads for various tables in the data warehouse database.
Generally, metadata recorded in the information delivery functional area relate to pre-
defined queries, predefined reports, and input parameter definitions for queries and reports.
Metadata recorded in this functional area also include information for OLAP. The
developers and administrators are involved in these processes.
For metadata types recorded and used in the information delivery area, see Fig. 9-10. This
figure summarizes the metadata types and the relevant data warehouse processes. See how
the metadata types and processes apply to your data warehouse environment.
Metadata types may also be classified as business metadata and technical metadata. This
is another effective method of classifying metadata types because the nature and format of
metadata in one group are markedly different from those in the other group. The next two
sections deal with this method of classification.
BUSINESS METADATA
Business metadata connects your business users to your data warehouse. Business users need
to know what is available in the data warehouse from a perspective different from that of IT
professionals like you. Business metadata is like a roadmap or an easy-to-use information
directory showing the contents and how to get there. It is like a tour guide for executives
and a route map for managers and business analysts.
Content Overview
First of all, business metadata must describe the contents in plain language, giving infor-
mation in business terms. For example, the names of the data tables or individual data
INFORMATION DELIVERY
PROCESSES
Report Generation,
Query Processing,
Complex Analysis
METADATA TYPES
Source systems
Source data definitions
Source structure definitions
Data extraction rules
Data transformation rules
Data cleansing rules
Source-target mapping
Summary data
Target physical models
Target data definitions in
business terms
Data content
Data navigation methods
Query templates
Preformatted reports
Predefined queries/reports
OLAP content
Figure 9-10 Information delivery: metadata types.
BUSINESS METADATA 207
239.
elements must notbe cryptic but be meaningful terms that business users are familiar with.
The data item name calc_pr_sle is not acceptable. You need to rename this as calculated-
prior-month-sale.
Business metadata is much less structured than technical metadata. A substantial portion
of business metadata originates from textual documents, spreadsheets, and even business
rules and policies not written down completely. Even though much of business metadata
is from informal sources, it is as important as metadata from formal sources such as data
dictionary entries. All of the informal metadata must be captured, put in a standard form,
and stored as business metadata in the data warehouse.
A large segment of business users do not have enough technical expertise to create their
own queries or format their own reports. They need to know what predefined queries are
available and what preformatted reports can be produced. They must be able to identify
the tables and columns in the data warehouse by referring to them by business names.
Business metadata should, therefore, express all of this information in plain language.
Examples of Business Metadata
Business metadata focuses on providing support for the end-user at the workstation. It must
make it easy for the end-users to understand what data is available in the data warehouse and
how they can use it. Business metadata portrays the data warehouse purely from the perspec-
tive of the end-users. It is like an external view of the data warehouse designed and composed
in simple business terms that users can easily understand.
Let us try to better understand business metadata by looking at a list of examples:
† Connectivity procedures
† Security and access privileges
† The overall structure of data in business terms
† Source systems
† Source-to-target mappings
† Data transformation business rules
† Summarization and derivations
† Table names and business definitions
† Attribute names and business definitions
† Data ownership
† Query and reporting tools
† Predefined queries
† Predefined reports
† Report distribution information
† Common information access routes
† Rules for analysis using OLAP
† Currency of OLAP data
† Data warehouse refresh schedule
The list is by no means all inclusive, but it gives a good basis for you to make up a similar
list for your data warehouse. Use the list as a guide to ensure that business metadata is
provided using business names and made easily understandable to your users.
208 THE SIGNIFICANT ROLE OF METADATA
240.
Content Highlights
From thelist of examples, let us highlight the contents of business metadata. What are all the
various kinds of questions business metadata can answer? What types of information can the
user get from business metadata?
Let us derive a list of questions business metadata can answer for the end-users. Although
the following list does not include all possible questions by the users, it can be a useful
reference:
† How can I sign onto and connect with the data warehouse?
† Which parts of the data warehouse can I access?
† Can I see all the attributes from a specific table?
† What are the definitions of the attributes I need in my query?
† Are there any queries and reports already predefined to give the results I need?
† Which source system did the data I want come from?
† What default values were used for the data items retrieved by my query?
† What types of aggregations are available for the metrics needed?
† How is the value in the data item I need derived from other data items?
† When was the last update for the data items in my query?
† On which data items can I perform drill-down analysis?
† How old is the OLAP data? Should I wait for the next update?
Who Benefits?
Business metadata primarily benefits end-users. This is a general statement. Who specifi-
cally benefits from business metadata? How does business metadata serve specific members
of the end-user community? Look over the following list:
† Managers
† Business analysts
† Power users
† Regular users
† Casual users
† Senior managers/junior executives
TECHNICAL METADATA
Technical metadata is meant for the IT staff responsible for the development and admini-
stration of the data warehouse. The technical personnel need information to design each pro-
cess. These are processes in every functional area of the data warehouse. You, as part of the
technical group on the project team, must know the proposed structure and content of the
data warehouse. Different members on the project team need different kinds of information
from technical metadata. If business metadata is like a roadmap for the users to use the data
warehouse, technical metadata is like a support guide for the IT professionals to build,
maintain, and administer the data warehouse.
TECHNICAL METADATA 209
241.
Content Overview
IT staffworking on the data warehouse project need technical metadata for different pur-
poses. If you are a data acquisition expert, your need for metadata is different from that of
the information access developer on the team. As a whole, the technical staff on the project
need to understand the data extraction, data transformation, and data cleansing processes.
They have to know the output layouts from every extraction routine and must understand
the data transformation rules.
IT staff require technical metadata for three distinct purposes. First, IT personnel need
technical metadata for the initial development of the data warehouse. Let us say you are
responsible for design and development of the data transformation process. For this purpose,
the metadata from the earlier process of data extraction can assist in your development effort.
Second, technical metadata is absolutely essential for ongoing growth and maintenance
of the data warehouse. If you are responsible for making changes to some data structures, or
even for a second release of the data warehouse, where will you find the information on the
contents and the various processes? You need technical metadata.
Technical metadata is also critical for the continuous administration of the production
data warehouse. As an administrator, you have to monitor the ongoing data extractions.
You have to ensure that the incremental loads are completed correctly and on time. Your
responsibility may also include database backups and archiving of old data. Data warehouse
administration is almost impossible without technical metadata.
Examples of Technical Metadata
Technical metadata concentrates on support for the IT staff responsible for development,
maintenance, and administration. Technical metadata is more structured than business meta-
data. Technical metadata is like an internal view of the data warehouse showing the inner
details in technical terms. Here is a list of examples of technical metadata:
† Data models of source systems
† Record layouts of outside sources
† Source to staging area mappings
† Staging area to data warehouse mappings
† Data extraction rules and schedules
† Data transformation rules and versioning
† Data aggregation rules
† Data cleansing rules
† Summarization and derivations
† Data loading and refresh schedules and controls
† Job dependencies
Program names and descriptions
† Data warehouse data model
† Database names
† Table/view names
† Column names and descriptions
† Key attributes
210 THE SIGNIFICANT ROLE OF METADATA
242.
† Business rulesfor entities and relationships
† Mapping between logical and physical models
† Network/server information
† Connectivity data
† Data movement audit controls
† Data purge and archival rules
† Authority/access privileges
† Data usage/timings
† Query and report access patterns
† Query and reporting tools
Review the list and develop a comparable list for your data warehouse environment.
Content Highlights
The list of examples gives you an idea of the kinds of information technical metadata in a
data warehouse environment must contain. Just as in the case of business metadata, let us
derive a list of questions technical metadata can answer for developers and administrators.
Review the following list:
† What databases and tables exist?
† What are the columns for each table?
† What are the keys and indexes?
† What are the physical files?
† Do the business descriptions correspond to the technical ones?
† When was the last successful update?
† What are the source systems and their data structures?
† What are the data extraction rules for each data source?
† What is the source to target mapping for each data item in the data warehouse?
† What are the data transformation rules?
† What default values were used for the data items while cleaning up missing data?
† What types of aggregations are available?
† What are the derived fields and their rules for derivation?
† When was the last update for the data items in my query?
† What are the load and refresh schedules?
† How often is data purged or archived? Which data items?
† What is the schedule for creating data for OLAP?
† What query and report tools are available?
Who Benefits?
The following list indicates the specific types of personnel who will benefit from technical
metadata:
† Project manager
† Data warehouse administrator
TECHNICAL METADATA 211
243.
† Database administrator
†Metadata manager
† Data warehouse architect
† Data acquisition developer
† Data quality analyst
† Business analyst
† System administrator
† Infrastructure specialist
† Data modeler
† Security architect
HOW TO PROVIDE METADATA
As your data warehouse is being designed and built, metadata needs to be collected and
recorded. As you know, metadata describes your data warehouse from various points of
view. You look into the data warehouse through the metadata to find the data sources, to
understand the data extractions and transformations, to determine how to navigate through
the contents, and to retrieve information. Most of the data warehouse processes are
performed with the aid of software tools. The same metadata or true copies of the relevant
subsets must be available to every tool.
In a study conducted by the Data Warehousing Institute in the early years of data
warehousing, 86% of the respondents fully recognized the significance of having a metadata
management strategy. However, only 9% had implemented a metadata solution. Another
16% had a plan and had begun to work on the implementation. This situation has improved
somewhat in today’s environment.
If most of the companies with data warehouses realized the enormous significance of
metadata management, why is only a small percentage doing anything about it? Metadata
management presents great challenges. The challenges are not in the capturing of metadata
through the use of the tools during data warehouse processes but lie in the integration of the
metadata from the various tools that create and maintain their own metadata.
We will explore the challenges. How can you find options to overcome the challenges
and establish effective metadata management in your data warehouse environment? What
is happening in the industry? While standards are being worked out in industry coalitions,
are there interim options for you? First, let us establish the basic requirements for good
metadata management. What are the requirements? Next, we will consider the sources for
metadata before we examine the challenges.
Metadata Requirements
Very simply put, metadata must serve as a roadmap to the data warehouse for your users. It
must also support IT in the development and administration of the data warehouse. Let us go
beyond these simple statements and look at specifics of the requirements for metadata
management.
Capturing and Storing Data The data dictionary in an operational system stores the
structure and business rules as they are at the current time. For operational systems, it is not
212 THE SIGNIFICANT ROLE OF METADATA
244.
necessary to keepthe history of the data dictionary entries. However, the history of the data in
your data warehouse spans several years, typically 5 to 15 in most data warehouses. During
this time, changes do occur in the source systems, data extraction methods, data transform-
ation algorithms, and in the structure and content of the data warehouse database itself.
Metadata in a data warehouse environment must, therefore, keep track of the revisions. As
such, metadata management must provide means for capturing and storing metadata with
proper versioning to indicate its time-variant feature.
Variety of Metadata Sources Metadata for a data warehouse never comes from a
single source. CASE tools, the source operational systems, data extraction tools, data trans-
formation tools, the data dictionary definitions, and other sources all contribute to the data
warehouse metadata. Metadata management, therefore, must be open enough to capture
metadata from a large variety of sources.
Metadata Integration We have looked at elements of business and technical metadata.
You must be able to integrate and merge all these elements in a unified manner for them to
be meaningful to your end-users. Metadata from the data models of the source systems must
be integrated with metadata from the data models of the data warehouse databases. The
integration must continue further to the front-end tools used by the end-users. All these
are difficult propositions and very challenging.
Metadata Standardization If your data extraction tool and the data transformation tool
represent data structures, then both tools must record the metadata about the data structures in
the same standard way. The same metadata in different metadata stores of different tools
must be represented in the same manner.
Rippling Through of Revisions Revisions will occur in metadata as data or business
rules change. As the metadata revisions are tracked in one data warehouse process, the revi-
sions must ripple throughout the data warehouse to the other processes.
Keeping Metadata Synchronized Metadata about data structures, data elements,
events, rules, and so on must be kept synchronized at all times throughout the data
warehouse.
Metadata Exchange While your end-users are using the front-end tools for infor-
mation access, they must be able to view the metadata recorded by back-end tools like the
data transformation tool. Free and easy exchange of metadata from one tool to another
must be possible.
Support for End-Users Metadata management must provide simple graphical and
tabular presentations to end-users, making it easy for them to browse through the metadata
and understand the data in the data warehouse purely from a business perspective.
The requirements listed are very valid for metadata management. Integration and stan-
dardization of metadata are great challenges. Nevertheless, before addressing these issues,
you need to know the usual sources of metadata. A general list of metadata sources will
help you establish a metadata management initiative for your data warehouse.
HOW TO PROVIDE METADATA 213
245.
Sources of Metadata
Astools are used for the various data warehouse processes, metadata gets recorded as a
byproduct. For example, when a data transformation tool is used, the metadata on the
source to target mappings get recorded as a byproduct of the process carried out with that
tool. Let us look at all the usual sources of metadata without any reference to individual
processes.
Source Systems
† Data models of operational systems (manual or with CASE tools)
† Definitions of data elements from system documentation
† COBOL copybooks and control block specification
† Physical file layouts and field definitions
† Program specifications
† File layouts and field definitions for data from outside sources
† Other sources such as spreadsheets and manual lists
Data Extraction
† Data on source platforms and connectivity
† Layouts and definitions of selected data sources
† Definitions of fields selected for extraction
† Criteria for merging into initial extract files on each platform
† Rules for standardizing field types and lengths
† Data extraction schedules
† Extraction methods for incremental changes
† Data extraction job streams
Data Transformation and Cleansing
† Specifications for mapping extracted files to data staging files
† Conversion rules for individual files
† Default values for fields with missing values
† Business rules for validity checking
† Sorting and resequencing arrangements
† Audit trail for the movement from data extraction to data staging
Data Loading
† Specifications for mapping data staging files to load images
† Rules for assigning keys for each file
† Audit trail for the movement from data staging to load images
† Schedules for full refreshes
† Schedules for incremental loads
† Data loading job streams
214 THE SIGNIFICANT ROLE OF METADATA
246.
Data Storage
† Datamodels for centralized data warehouse and dependent data marts
† Subject area groupings of tables
† Data models for conformed data marts
† Physical files
† Table and column definitions
† Business rules for validity checking
Information Delivery
† List of query and report tools
† List of predefined queries and reports
† Data model for special databases for OLAP
† Schedules for retrieving data for OLAP
Challenges for Metadata Management
Although metadata is so vital in a data warehouse environment, seamlessly integrating all the
parts of metadata is a formidable task. Industry-wide standardization is far from being a rea-
lity. Metadata created by a process at one end cannot be viewed through a tool used at another
end without going through convoluted transformations. These challenges force many data
warehouse developers to abandon the requirements for proper metadata management.
Here are the major challenges to be addressed while providing metadata:
† Each software tool has its own propriety metadata. If you are using several tools in your
data warehouse, how can you reconcile the formats?
† No industry-wide accepted standards exist for metadata formats.
† There are conflicting claims on the advantages of a centralized metadata repository
as opposed to a collection of fragmented metadata stores.
† There are no easy and accepted methods of passing metadata along the processes
as data moves from the source systems to the staging area and thereafter to the data
warehouse storage.
† Preserving version control of metadata uniformly throughout the data warehouse is
tedious and difficult.
† In a large data warehouse with numerous source systems, unifying the metadata
relating to the data sources can be an enormous task. You have to deal with conflicting
standards, formats, data naming conventions, data definitions, attributes, values,
business rules, and units of measure. You have to resolve indiscriminate use of aliases
and compensate for inadequate data validation rules.
Metadata Repository
Think of a metadata repository as a general-purpose information directory or cataloging
device to classify, store, and manage metadata. As we have seen earlier, business metadata
and technical metadata serve different purposes. The end-users need the business metadata;
HOW TO PROVIDE METADATA 215
247.
data warehouse developersand administrators require the technical metadata. The structures
of these two categories of metadata also vary. Therefore, the metadata repository can be
thought of as two distinct information directories, one to store business metadata and the
other to store technical metadata. This division may also be logical within a single physical
repository.
Figure 9-11 shows the typical contents in a metadata repository. Notice the division
between business and technical metadata. Did you also notice another component called
the information navigator? This component is implemented in different ways in commercial
offerings. The functions of the information navigator include the following:
Interface from Query Tools. This function attaches data warehouse data to third-party
query tools so that metadata definitions inside the technical metadata may be viewed
from these tools.
Drill Down for Details. The user of metadata can drill down and proceed from one level
of metadata to a lower level for more information. For example, you can first get the
definition of a data table, then go to the next level for seeing all attributes, and go
further to get the details of individual attributes.
Review Predefined Queries and Reports. The user is able to review predefined queries
and reports, and launch the selected ones with proper parameters.
A centralized metadata repository accessible from all parts of the data warehouse for your
end-users, developers, and administrators appears to be an ideal solution for metadata man-
agement. But for a centralized metadata repository to be the best solution, the repository
must meet some basic requirements. Let us quickly review these requirements. It is not
easy to find a repository tool that satisfies every one of the requirements listed below.
METADATA REPOSITORY
Information Navigator
Technical Metadata
Business Metadata
Source systems data models, structures of external data sources, staging area file
layouts, target warehouse data models, source-staging area mappings, staging area-
warehouse mappings, data extraction rules, data transformation rules, data cleansing
rules, data aggregation rules, data loading and refreshing rules, source system
platforms, data warehouse platform, purge/archival rules, backup/recovery, security
Source systems, source-target mappings, data transformation business rules,
summary datasets, warehouse tables and columns in business terminology, query
and reporting tools, predefined queries, preformatted reports, data load and refresh
schedules, support contact, OLAP data, access authorizations
Navigation routes through warehouse content, browsing of warehouse tables
and attributes, query composition, report formatting, drill-down and roll-up,
report generation and distribution, temporary storage of results
Figure 9-11 Metadata repository.
216 THE SIGNIFICANT ROLE OF METADATA
248.
Flexible Organization. Allowthe data administrator to classify and organize metadata
into logical categories and subcategories, and assign specific components of metadata
to the classifications.
Historical. Use versioning to maintain the historical perspective of the metadata.
Integrated. Store business and technical metadata in formats meaningful to all types
of users.
Good Compartmentalization. Able to separate and store logical and physical database
models.
Analysis and Look-up Capabilities. Capable of browsing all parts of metadata and also
navigating through the relationships.
Customizable. Able to create customized views of metadata for individual groups of
users and to include new metadata objects as necessary.
Maintain Descriptions and Definitions. View metadata in both business and technical
terms.
Standardize Naming Conventions. Flexibility to adopt any type of naming convention
and standardize throughout the metadata repository.
Synchronization. Keep metadata synchronized within all parts of the data warehouse
environment and with the related external systems.
Open. Support metadata exchange between processes via industry-standard interfaces
and be compatible with a large variety of tools.
Selection of a suitable metadata repository product is one of the key decisions the project
team must make. Use the above list of criteria as a guide while evaluating repository tools for
your data warehouse.
Metadata Integration and Standards
For a free interchange of metadata within the data warehouse between processes performed
with the aid of software tools, the need for standardization is obvious. Our discussions so
far must have convinced you of this. As mentioned in Chapter 3, the Meta Data Coalition
and the Object Management Group had both been working on standards for metadata.
The Meta Data Coalition had accepted a standard known as the Open Information Model
(OIM). The Object Management Group had released the Common Warehouse Metamodel
(CWM) as its standard. As mentioned earlier, in November 2000 these two bodies merged
into the OMG. Since then some integration of the two standards have emerged for
industry-wide acceptance.
You need to be aware of these efforts towards the worthwhile goal of metadata standards.
Also, note the following highlights of these initiatives as they relate to data warehouse
metadata:
† The standard model provides metadata concepts for database schema management,
design, and reuse in a data warehouse environment. It includes both logical and physi-
cal database concepts.
† The model includes details of data transformations applicable to populating data
warehouses.
† The model can be extended to include OLAP-specific metadata types capturing
descriptions of data cubes.
HOW TO PROVIDE METADATA 217
249.
† The standardmodel contains details for specifying source and target schemas and data
transformations between those regularly found in the data acquisition processes in the
data warehouse environment. This type of metadata can be used to support transform-
ation design, impact analysis (which transformations are affected by a given schema
change), and data lineage (which data sources and transformations were used to pro-
duce given data in the data warehouse).
† The transformation component of the standard model captures information about
compound data transformation scripts. Individual transformations have relationships
to the sources and targets of the transformation. Some transformation semantics may
be captured by constraints and by code–decode sets for table-driven mappings.
Implementation Options
Enough has been said about the absolute necessity of metadata in a data warehouse environ-
ment. At the same time. we have noted the need for integration and standards for metadata.
Associated with these two facts is the reality of the lack of universally accepted metadata
standards. Therefore, in a typical data warehouse environment where multiple tools from
different vendors are used, what are the options for implementing metadata management?
In this section, we will explore a few random options. We have to hope, however, that the
goal of universal standards will be met soon.
Review the following options and consider the ones most appropriate for your data
warehouse environment.
† Select and use a metadata repository product with its business information directory
component. Your information access and data acquisition tools that are compatible
with the repository product will seamlessly interface with it. For the other tools that
are not compatible, you will have to explore other methods of integration.
† In the opinion of some data warehouse consultants, a single centralized repository is a
restrictive approach jeopardizing the autonomy of individual processes. Although a
centralized repository enables sharing of metadata, it cannot be easily administered
in a large data warehouse. In the decentralized approach, metadata is spread across
different parts of the architecture with several private and unique metadata stores.
Metadata interchange could be a problem.
† Some developers have come up with their own solutions. They have come up with a set
of procedures for the standard usage of each tool in the development environment and
provide a table of contents.
† Other developers create their own database to gather and store metadata and publish it
on the company’s intranet.
† Some adopt clever methods of integration of information access and analysis tools.
They provide side-by-side display of metadata by one tool and display of the real
data by another tool. Sometimes, the help texts in the query tools may be populated
with the metadata exported from a central repository.
As you know, the current trend is to use Web technology for reporting and OLAP
functions. The company’s intranet is widely used as the means for information delivery.
Figure 9-12 shows how this paradigm shift changes the way metadata may be accessed.
218 THE SIGNIFICANT ROLE OF METADATA
250.
Business users canuse their Web browsers to access metadata and navigate through the data
warehouse and any data marts.
From the outset, pay special attention to metadata for your data warehouse environment.
Prepare a metadata initiative to answer the following questions:
What are the goals for metadata in your enterprise? What metadata is required to meet the
goals?
What are the sources for metadata in your environment?
Who will maintain it?
How will they maintain it?
What are the metadata standards?
How will metadata be used? By whom? What metadata tools will be needed?
Set your goals for metadata in your environment and follow through.
CHAPTER SUMMARY
† Metadata is a critical need for using, building, and administering the data warehouse.
† For end-users, metadata is like a roadmap to the data warehouse contents.
† For IT professionals, metadata supports development and administration functions.
† Metadata has an active role in the data warehouse and assists in the automation of the
processes.
† Metadata types may be classified by the three functional areas of the data warehouse,
namely, data acquisition, data storage, and information delivery. The types are linked to
the processes that take places in these three areas.
Warehouse data
Metadata Repository
Web Client
Web Client
Browser
Browser
Web Server ODBC
JDBC
API
CGI
Gateway
Figure 9-12 Metadata: Web-based access.
CHAPTER SUMMARY 219
251.
† Business metadataconnects the business users to the data warehouse. Technical meta-
data is meant for the IT staff responsible for development and administration.
† Effective metadata must meet a number of requirements. Metadata management is
difficult; many challenges need to be faced.
† Universal metadata standardization is still an elusive goal. Lack of standardization
inhibits seamless passing of metadata from one tool to another.
† A metadata repository is like a general-purpose information directory that includes
several enhancing functions.
† One metadata implementation option includes the use of a commercial metadata
repository. There are other possible home-grown options.
REVIEW QUESTIONS
1. Why do you think metadata is important in a data warehouse environment? Give a
general explanation in one or two paragraphs.
2. Explain how metadata is critical for data warehouse development and administration.
3. Examine the concept that metadata is like a nerve center. Describe how the concept
applies to the data warehouse environment.
4. List and describe three major reasons why metadata is vital for end-users.
5. Why is metadata essential for IT? List six processes in which metadata is significant for
IT and explain why.
6. Pick three processes in which metadata assists in the automation of these processes.
Show how metadata plays an active role in these processes.
7. What is meant by establishing the context of information? Briefly explain with an
example of how metadata establishes the context of information in a data warehouse.
8. List four metadata types used in each of the three areas of data acquisition, data storage,
and information delivery.
9. List any ten examples of business metadata.
10. List four major requirements that metadata must satisfy. Describe each of these four
requirements.
EXERCISES
1. Indicate if true or false:
A. The importance of metadata is the same in a data warehouse as it is in an operational
system.
B. Metadata is needed by IT for data warehouse administration.
C. Technical metadata is usually less structured than business metadata.
D. Maintaining metadata in a modern data warehouse is just for documentation.
220 THE SIGNIFICANT ROLE OF METADATA
252.
E. Metadata providesinformation on predefined queries.
F. Business metadata comes from sources more varied than those for technical
metadata.
G. Technical metadata is shared between business users and IT staff.
H. A metadata repository is like a general purpose directory tool.
I. Metadata standards facilitate metadata interchange among tools.
J. Business metadata is only for business users; business metadata cannot be understood
or used by IT staff.
2. As the project manager for the development of the data warehouse for a domestic soft
drinks manufacturer, your assignment is to write a proposal for providing metadata.
Consider the options and come up with what you think is needed and how you plan to
implement a metadata strategy.
3. As the data warehouse administrator, describe all the types of metadata you would need
for performing your job. Explain how these types would assist you.
4. You are responsible for training the data warehouse end-users. Write a short procedure for
your casual end-users to use the business metadata and run queries. Describe the pro-
cedure in user terms without using the word metadata.
5. As the data acquisition specialist, what types of metadata can help you? Choose one of the
data acquisition processes and explain the role of metadata in that process.
EXERCISES 221
CHAPTER 10
PRINCIPLES OFDIMENSIONAL
MODELING
CHAPTER OBJECTIVES
† Clearly unde rstand how the requirements definition determines data design
† Introduce dimensional modeling and contrast it with entity-relationship modeling
† Review the basics of the STAR schema
† Find out what is inside the fact table and inside the dimension tables
† Determine the advantages of the STAR schema for data warehouses
† Review examples of the STAR schema
FROM REQUIREMENTS TO DATA DESIGN
The requirements definition completely drives the data design for the data warehouse. Data
design consists of putting together the data structures. A group of data elements form a data
structure. Logical data design includes determination of the various data elements that are
needed and combination of the data elements into structures of data. Logical data design
also includes establishing the relationships among the data structures.
Let us look at Figure 10-1. Notice how the phases start with requirements gathering. The
results of the requirements gathering phase is documented in detail in the requirements defi-
nition document. An essential component of this document is the set of information package
diagrams. Remember that these are information matrices showing the metrics, business
dimensions, and the hierarchies within individual business dimensions.
The information package diagrams form the basis for the logical data design for a
data warehouse made up of data marts. The data design process results in a dimensional
data model.
Data Warehousing Fundamentals for IT Professionals, Second Edition. By Paulraj Ponniah
Copyright # 2010 John Wiley & Sons, Inc.
225
257.
Design Decisions
Before weproceed with designing the dimensional data model, let us quickly review some of
the design decisions you have to make:
Choosing the Process. Selecting the subjects from the information packages for the first
set of logical structures to be designed.
Choosing the Grain. Determining the level of detail for the data in the data structures.
Identifying and Conforming the Dimensions. Choosing the business dimensions (such
as product, market, time, etc.) to be included in the first set of structures and
making sure that each particular data element in every business dimension is con-
formed to one another.
Choosing the Facts. Selecting the metrics or units of measurements (such as product sale
units, dollar sales, dollar revenue, etc.) to be included in the first set of structures.
Choosing the Duration of the Database. Determining how far back in time you should go
for historical data.
Dimensional Modeling Basics
Dimensional modeling gets its name from the business dimensions we need to incorporate
into the logical data model. It is a logical design technique to structure the business dimen-
sions and the metrics that are analyzed along these dimensions. This modeling technique is
intuitive for that purpose. The model has also proved to provide high performance for queries
and analysis.
The multidimensional information package diagram we have discussed is the foundation
for the dimensional model. Therefore, the dimensional model consists of the specific data
Requirements
Gathering
Data
Design
Requirements
Definition
Document
Information
Packages
Dimensional
Model
………
………
………
………
………
……
……
Figure 10-1 From requirements to data design.
226 PRINCIPLES OF DIMENSIONAL MODELING
258.
structures needed torepresent the business dimensions. These data structures also contain the
metrics or facts.
In Chapter 5, we discussed information package diagrams in sufficient detail. We specifi-
cally looked at an information package diagram for automaker sales. Please go back and
review Figure 5-5 in that chapter. What do you see? In the bottom section of the diagram,
you observe the list of measurements or metrics that the automaker wants to use for analysis.
Next, look at the column headings. These are the business dimensions along which the auto-
maker wants to analyze the measurements or metrics. Under each column heading you see
the dimension hierarchies and categories within that business dimension. What you see
under each column heading are the attributes relating to that business dimension.
Reviewing the information package diagram for automaker sales, we notice three types of
data entities: (1) measurements or metrics, (2) business dimensions, and (3) attributes foreach
business dimension. So, when we put together the dimensional model to represent the infor-
mation contained in the automaker sales information package, we need to come up with data
structures to represent these three types of data entities. Let us discuss how we can do this.
First, let us work with the measurements or metrics seen at the bottom of the information
package diagram. These are the facts for analysis. In the automaker sales diagram, the facts
are as follows:
Actual sale price
MSRP
Options price
Full price
Dealer add-ons
Dealer credits
Dealer invoice
Amount of down payment
Manufacturer proceeds
Amount financed
Each of these data items is a measurement or fact. Actual sale price is a fact about what the
actual price was for the sale. Full price is a fact about what the full price was relating to the
sale. As we review each of these factual items, we find that we can group all of these into a
single data structure. In relational database terminology, you may call the data structure a
relational table. So, the metrics or facts from the information package diagram will form
the fact table. For the automaker sales analysis this fact table would be the automaker
sales fact table.
Look at Figure 10-2 showing how the fact table is formed. The fact table gets its name
from the subject for analysis; in this case, it is automaker sales. Each fact item or measure-
ment goes into the fact table as an attribute for automaker sales.
We have determined one of the data structures to be included in the dimensional model for
automaker sales and derived the fact table from the information package diagram. Let us now
move on to the other sections of the information package diagram, taking the business
dimensions, one by one. Look at the product business dimension in Figure 5-5.
The product business dimension is used when we want to analyze the facts by products.
Sometimes our analysis could be a breakdown by individual models. Another analysis could
FROM REQUIREMENTS TO DATA DESIGN 227
259.
be at ahigher level by product lines. Yet another analysis could be at even a higher level by
product categories. The list of data items relating to the product dimension are as follows:
Model name
Model year
Package styling
Product line
Product category
Exterior color
Interior color
First model year
What can we do with all these data items in our dimensional model? All of these relate to
the product in some way. We can, therefore, group all of these data items in one data structure
or one relational table. We can call this table the product dimension table. The data items in
the above list would all be attributes in this table.
Looking further into the information package diagram, we note the other business dimen-
sions shown as column headings. In the case of the automaker sales information package
diagram, these other business dimensions are dealer, customer demographics, payment
method, and time. Just as we formed the product dimension table, we can form the remaining
dimension tables of dealer, customer demographics, payment method, and time. The data
items shown within each column would then be the attributes for each corresponding
dimension table.
Facts: Actual Sale Price, MSRP, Options Price, Full Price, Dealer Add-ons, Dealer Credits,
Dealer Invoice, Down Payment, Proceeds, Finance
Time Product
Payment
Method
Customer
Demo-
graphics
Year
Dimensions
Quarter
Month
Date
Day of
Week
Day of
Month
Season
Holiday
Flag
Model
Name
Model
Year
Package
Styling
Product
Line
Product
Category
Exterior
Color
Interior
Color
First Year
Finance
Type
Term
(Months)
Interest
Rate
Agent
Dealer
Age
Gender
Income
Range
Marital
Status
House-
hold Size
Vehicles
Owned
Home
Value
Own or
Rent
Dealer
Name
City
State
Single
Brand Flag
Date First
Operation
Actual Sale Price
MSRP
Options Price
Full Price
Dealer Add-ons
Dealer Credits
Dealer Invoice
Down Payment
Proceeds Finance
Automaker
Sales
Fact Table
Figure 10-2 Formation of the automaker sales fact table.
228 PRINCIPLES OF DIMENSIONAL MODELING
260.
Figure 10-3 putsall of this together. It shows how the various dimension tables are
formed from the information package diagram. Look at the figure closely and see how
each dimension table is formed.
So far we have formed the fact table and the dimension tables. How should these
tables be arranged in the dimensional model? What are the relationships and how should
we mark the relationships in the model? The dimensional model should primarily facilitate
queries and analyses. What would be the types of queries and analyses? These would be
queries and analyses where the metrics inside the fact table are analyzed across one or
more dimensions using the dimension table attributes.
Let us examine a typical query against the automaker sales data. How much sales pro-
ceeds did the Jeep Cherokee, Year 2007 Model with standard options, generate in July
2007 at Big Sam Auto dealership for buyers who own their homes and who took 3-year
leases, financed by Daimler-Chrysler Financing? We are analyzing actual sale price,
MSRP, and full price. We are analyzing these facts along attributes in the various dimension
tables. The attributes in the dimension tables act as constraints and filters in our queries. We
also find that any or all of the attributes of each dimension table can participate in a query.
Further, each dimension table has an equal chance to be part of a query.
Before we decide how to arrange the fact and dimension tables in our dimensional
model and mark the relationships, let us go over what the dimensional model needs to
achieve and what its purposes are. Here are some of the criteria for combining the tables
into a dimensional model.
Facts: Actual Sale Price, MSRP, Options Price, Full Price, Dealer Add-ons,
Dealer Credits, Dealer Invoice, Down Payment, Proceeds, Finance
Model Name
Model Year
Package Styling
Product Line
Product Category
Exterior Color
Interior Color
First Year
Dimension Tables
Year
Quarter …………..
Product
Time
Finance Type
Term ………….....
Age
Gender …………..
Payment
Method
Customer
Demo-
graphics
Dealer Name
City …………..
Dealer
Time Product
Payment
Method
Customer
Demo-
graphics
Year
Quarter
Month
Date
Day of
Week
Day of
Month
Season
Holiday
Flag
Model
Name
Model
Year
Package
Styling
Product
Line
Product
Category
Exterior
Color
Interior
Color
First Year
Finance
Type
Term
(Months)
Interest
Rate
Agent
Dealer
Age
Gender
Income
Range
Marital
Status
House-
hold Size
Vehicles
Owned
Home
Value
Own or
Rent
Dealer
Name
City
State
Single
Brand Flag
Date First
Operation
Figure 10-3 Formation of the automaker dimension tables.
FROM REQUIREMENTS TO DATA DESIGN 229
261.
† The modelshould provide the best data access.
† The whole model must be query-centric.
† It must be optimized for queries and analyses.
† The model must show that the dimension tables interact with the fact table.
† It should also be structured in such a way that every dimension can interact equally with
the fact table.
† The model should allow drilling down or rolling up along dimension hierarchies.
With these requirements, we find that a dimensional model with the fact table in the
middle and the dimension tables arranged around the fact table satisfies the conditions.
In this arrangement, each of the dimension tables has a direct relationship with the fact
table in the middle. This is necessary because every dimension table with its attributes
must have an even chance of participating in a query to analyze the attributes in the fact table.
Such an arrangement in the dimensional model looks like a star formation, with the fact
table at the core of the star and the dimension tables along the spikes of the star. The dimen-
sional model is therefore called a STAR schema.
Let us examine the STAR schema for the automaker sales as shown in Figure 10-4. The
sales fact table is in the center. Around this fact table are the dimension tables of product,
dealer, customer demographics, payment method, and time. Each dimension table is related
to the fact table in a one-to-many relationship. In other words, for one row in the product
dimension table, there are one or more related rows in the fact table.
E-R Modeling Versus Dimensional Modeling
We are familiar with data modeling for operational or OLTP systems. We adopt the Entity-
Relationship (E-R) modeling technique to create the data models for these systems.
AUTO
SALES
DEALER
PRODUCT
TIME
PAYMENT
METHOD
CUSTOMER
DEMO -
GRAPHICS
Figure 10-4 STAR schema for automaker sales.
230 PRINCIPLES OF DIMENSIONAL MODELING
262.
Figure 10-5 liststhe characteristics of OLTP systems and shows why E-R modeling is
suitable for OLTP systems.
We have so far discussed the basics of the dimensional model and find that this model is
most suitable for modeling the data for the data warehouse. Let us recapitulate the character-
istics of the data warehouse information and review how dimensional modeling is suitable
for this purpose. Study the features of dimensional modeling listed in Figure 10-6.
OLTP systems capture details of events or transactions
OLTP systems focus on individual events
An OLTP system is a window into micro-level transactions
Picture at detail level necessary to run the business
Suitable only for questions at transaction level
Data consistency, non-redundancy, and efficient data
storage critical
Entity-Relationship Modeling
Removes data redundancy
Ensures data consistency
Expresses microscopic
relationships
Figure 10-5 E-R modeling for OLTP systems
DW meant to answer questions on overall process
DW focus is on how managers view the business
DW reveals business trends
Information is centered around a business process
Answers show how the business measures the process
The measures to be studied in many ways along several
business dimensions
Dimensional Modeling
Captures critical measures
Views along dimensions
Intuitive to business users
Figure 10-6 Dimensional modeling for the data warehouse.
FROM REQUIREMENTS TO DATA DESIGN 231
263.
Use of CASETools
Many case tools are available for data modeling. In Chapter 8, we introduced these tools and
their features. You can use these tools for creating the logical schema and the physical
schema for specific target database management systems (DBMSs).
You can use a case tool to define the tables, the attributes, and the relationships. You can
assign the primary keys and indicate the foreign keys. You can form the entity-relationship
diagrams. All of this is done very easily using graphical user interfaces and powerful
drag-and-drop facilities. After creating an initial model, you may add fields, delete fields,
change field characteristics, create new relationships, and make any number of revisions
with utmost ease.
Another very useful function found in the case tools is the ability to forward-engineer the
model and generate the schema for the target database system you need to work with.
Forward-engineering is easily done with these case tools.
For modeling the data warehouse, we are interested in the dimensional modeling tech-
nique. Most of the existing vendors have expanded their modeling case tools to include
dimensional modeling. You can create fact tables, dimension tables, and establish the
relationships between each dimension table and the fact table. The result is a STAR
schema for your model. Again, you can forward-engineer the dimensional STAR model
into a relational schema for your chosen database management system.
THE STAR SCHEMA
Now that you have been introduced to the STAR schema, let us take a simple example and
examine its characteristics in detail. Creating the STAR schema is the fundamental data
design technique for the data warehouse. It is necessary to gain a good grasp of this
technique.
Review of a Simple STAR Schema
We will take a simple STAR schema designed for order analysis. Assume this to be the
schema for a manufacturing company and that the marketing department is interested in
determining how they are doing with the orders received by the company.
Figure 10-7 shows this simple STAR schema. It consists of the orders fact table shown
in the middle of the schema diagram. Surrounding the fact table are the four dimension
tables of customer, salesperson, order date, and product. Let us begin to examine this
STAR schema. Look at the structure from the point of view of the marketing department.
The users in this department will analyze the orders using dollar amounts, cost, profit
margin, and sold quantity. This information is found in the fact table of the structure. The
users will analyze these measurements by breaking down the numbers in combinations
by customer, salesperson, date, and product. All these dimensions along which the users
will analyze are found in the structure. The STAR schema structure is a structure that can
be easily understood by the users and with which they can comfortably work. The structure
mirrors how the users normally view their critical measures along their business dimensions.
When you look at the order dollars, the STAR schema structure intuitively answers the
questions of what, when, by whom, and to whom. From the STAR schema, the users can
easily visualize the answers to these questions: For a given amount of dollars, what was
232 PRINCIPLES OF DIMENSIONAL MODELING
264.
the product sold?Who was the customer? Which salesperson brought the order? When was
the order placed?
When a query is made against the data warehouse, the results of the query are produced by
combining or joining one of more dimension tables with the fact table. The joins are between
the fact table and individual dimension tables. The relationship of a particular row in the fact
table is with the rows in each dimension table. These individual relationships are clearly
shown as the spikes of the STAR schema.
Take a simple query against the STAR schema. Let us say that the marketing department
wants the quantity sold and order dollars for product bigpart-1, relating to customers in the
Order Measures
Order Dollars
Cost
Margin Dollars
Quantity Sold
Product
Product Name
SKU
Brand
Order Date
Date
Month
Quarter
Year
Customer
Customer Name
Customer Code
Billing Address
Shipping Address
Salesperson
Salesperson Name
Territory Name
Region Name
Figure 10-7 Simple STAR schema for orders analysis.
Month =
June
State =
Maine
Salesperson
Name = Jane
Doe
Product
Name =
bigpart-1
Order Measures
Order Dollars
Cost
Margin Dollars
Quantity Sold
Product
Product Name
SKU
Brand
Order Date
Date
Month
Quarter
Year
Customer
Customer Name
Customer Code
Billing Address
Shipping Address
Salesperson
Salesperson Name
Territory Name
Region Name
Figure 10-8 Understanding a query from the STAR schema.
THE STAR SCHEMA 233
265.
state of Maine,obtained by salesperson Jane Doe, during the month of June. Figure 10-8
shows how this query is formulated from the STAR schema. Constraints and filters for
queries are easily understood by looking at the STAR schema.
A common type of analysis is the drilling down of summary numbers to get at the details
at the lower levels. Let us say that the marketing department has initiated a specific analysis
by placing the following query: Show me the total quantity sold of product brand big parts to
customers in the northeast region for year 2008. In the next step of the analysis, the market-
ing department now wants to drill down to the level of quarters in 2008 for the northeast
region for the same product brand, big parts. Next, the analysis goes down to the level of
individual products in that brand. Finally, the analysis goes to the level of details by individ-
ual states in the northeast region. The users can easily discern all of this drill-down analysis
by reviewing the STAR schema. Refer to Figure 10-9 to see how the drill-down is derived
from the STAR schema.
Inside a Dimension Table
We have seen that a key component of the STAR schema is the set of dimension tables.
These dimension tables represent the business dimensions along which the metrics are
Brand=big parts
Year=2008
Region Name =
North East
2008 1st Qtr
2008 2nd Qtr
2008 3rd Qtr
2008 4th Qtr.
Brand=bigparts
Product=bigpart1
Product=bigpart2
State=Maine
State=New York
Product=bigpart1
Product=bigpart2
STEP 1
STEP 4
STEP 3
STEP 2
DRILL DOWN STEPS
Region Name =
North East
2008 1st Qtr
2008 2nd Qtr
2008 3rd Qtr
2008 4th Qtr.
2008 1st Qtr
2008 2nd Qtr
2008 3rd Qtr
2008 4th Qtr.
Region Name =
North East
Order Measures
Order Dollars
Cost
Margin Dollars
Quantity Sold
Product
Product Name
SKU
Brand
Order Date
Date
Month
Quarter
Year
Customer
Customer Name
Customer Code
Billing Address
Shipping Address
Salesperson
SalespersonName
Territory Name
Region Name
Figure 10-9 Understanding drill-down analysis from the STAR schema.
234 PRINCIPLES OF DIMENSIONAL MODELING
266.
analyzed. Let uslook inside a dimension table and study its characteristics. See Figure 10-10
and review the following observations.
Dimension Table Key. The primary key of the dimension table uniquely identifies each
row in the table.
Table is Wide. Typically, a dimension table has many columns or attributes. It is not
uncommon for some dimension tables to have more than 50 attributes. Therefore,
we say that the dimension table is wide. If you lay it out as a table with columns
and rows, the table is spread out horizontally.
Textual Attributes. In the dimension table you will seldom find any numerical values
used for calculations. The attributes in a dimension table are of textual format.
These attributes represent the textual descriptions of the components within the business
dimensions. Users will compose their queries using these descriptors.
Attributes not Directly Related. Frequently you will find that some of the attributes in a
dimension table are not directly related to the other attributes in the table. For example,
package size is not directly related to product brand; nevertheless, package size and
product brand could both be attributes of the product dimension table.
Not Normalized. The attributes in a dimension table are used over and over again in
queries. An attribute is taken as a constraint in a query and applied directly to the
metrics in the fact table. For efficient query performance, it is best if the query
picks up an attribute from the dimension table and goes directly to the fact table
and not through other intermediary tables. If you normalize the dimension table,
you will be creating such intermediary tables and that will not be efficient.
Therefore, a dimension table is flattened out, not normalized.
Drilling Down, Rolling Up. The attributes in a dimension table provide the ability to get
to the details from higher levels of aggregation to lower levels of details. For example,
the three attributes zip code, city, and state form a hierarchy. You may get the total sales
bystate, then drill down to total sales by city, and then by zip code. Going the other way,
you may first get the totals by zip codes, and then roll up to totals by city and state.
Multiple Hierarchies. In the example of the customer dimension, there is a single hier-
archy going up from individual customer to zip, city, and state. But dimension tables
often provide for multiple hierarchies, so that drilling down may be performed along
Dimension table key
Large number of attributes (wide)
Textual attributes
Attributes not directly related
Flattened out, not normalized
Ability to drill down/roll up
Multiple hierarchies
Less number of records
CUSTOMER
customer_key
name
customer_id
billing_address
billing_city
billing_state
billing_zip
shipping_address
Figure 10-10 Inside a dimension table.
THE STAR SCHEMA 235
267.
any of themultiple hierarchies. Take for example a product dimension table for a
department store. In this business, the marketing department may have its way of
classifying the products into product categories and product departments. On the
other hand, the accounting department may group the products differently into cat-
egories and product departments. So in this case, the product dimension table will
have the attributes of marketing–product–category, marketing–product–department,
finance–product–category, and finance–product–department.
Fewer Records. A dimension table typically has fewer records or rows than the fact table.
A product dimension table for an automaker may have just 500 rows. On the other
hand, the fact table may contain millions of rows.
Inside the Fact Table
Let us now get into a fact table and examine the components. Remember this is where we
keep the measurements. We may keep the details at the lowest possible level. In the depart-
ment store fact table for sales analysis, we may keep the units sold by individual transactions
at the cashier’s checkout. Some fact tables may just contain summary data. These are called
aggregate fact tables. Figure 10-11 lists the characteristics of a fact table. Let us review these
characteristics.
Concatenated Key. A row in the fact table relates to a combination of rows from all the
dimension tables. In this example of a fact table, you find quantity ordered as an attri-
bute. Let us say the dimension tables are product, time, customer, and sales represen-
tative. For these dimension tables, assume that the lowest level in the dimension
hierarchies are individual product, a calendar date, a specific customer, and a single
sales representative. Then a single row in the fact table must relate to a particular pro-
duct, a specific calendar date, a specific customer, and an individual sales representa-
tive. This means the row in the fact table must be identified by the primary keys of these
four dimension tables. Thus, the primary key of the fact table must be the concatenation
of the primary keys of all the dimension tables.
Data Grain. This is an important characteristic of the fact table. As we know, the data
grain is the level of detail for the measurements or metrics. In this example, the metrics
are at the detailed level. The quantity ordered relates to the quantity of a particular pro-
duct on a single order, on a certain date, for a specific customer, and procured by a
Concatenated fact table key
Grain or level of data identified
Fully additive measures
Semi-additive measures
Large number of records
Only a few attributes
Sparsity of data
Degenerate dimensions
ORDER_FACTS
product_key
order_date_key
salesperson_key
customer_key
order_dollars
extended_cost
margin_dollars
quantity_ordered
order_number
order_line
Figure 10-11 Inside a fact table.
236 PRINCIPLES OF DIMENSIONAL MODELING
268.
specific sales representative.If we keep the quantity ordered as the quantity of a
specific product for each month, then the data grain is different and is at a higher level.
Fully Additive Measures. Let us look at the attributes order_dollars, extended_cost, and
quantity_ordered. Each of these relates to a particular product on a certain date for a
specific customer procured by an individual sales representative. In a certain query, let
us say that the user wants the totals for the particular product on a certain date, not for a
specific customer, but for customers in a particular state. Then we need to find all the
rows in the fact table relating to all the customers in that state and add the order_dol-
lars, extended_cost, and quantity_ordered to come up with the totals. The values of
these attributes may be summed up by simple addition. Such measures are known
as fully additive measures. Aggregation of fully additive measures is done by
simple addition. When we run queries to aggregate measures in the fact table, we
will have to make sure that these measures are fully additive. Otherwise, the aggre-
gated numbers may not show the correct totals.
Semiadditive Measures. Consider the margin_dollars attribute in the fact table. For
example, if the order_dollars is 120 and extended_cost is 100, the margin_percentage
is 20. This is a calculated metric derived from the order_dollars and extended_cost. If
you are aggregating the numbers from rows in the fact table relating to all the customers
in a particular state, you cannot add up the margin_percentages from all these rows and
come up with the aggregated number. Derived attributes such as margin_percentage
are not additive. They are known as semiadditive measures. Distinguish semiadditive
measures from fully additive measures when you perform aggregations in queries.
Table Deep, Not Wide. Typically a fact table contains fewer attributes than a dimension
table. Usually, there are about 10 attributes or less. But the number of records in a fact
table is very large in comparison. Take a very simplistic example of 3 products, 5 cus-
tomers, 30 days, and 10 sales representatives represented as rows in the dimension
tables. Even in this example, the number of fact table rows will be 4500, very large
in comparison with the dimension table rows. If you lay the fact table out as a two-
dimensional table, you will note that the fact table is narrow, with a small number
of columns, but very deep, with a large number of rows.
Sparse Data. We have said that a single row in the fact table relatesto a particular product,
a specific calendar date, a specific customer, and an individual sales representative. In
other words, for a particular product, a specific calendar date, a specific customer, and
an individual sales representative, there is a corresponding row in the fact table. What
happens when the date represents a closed holiday and no orders are received and pro-
cessed? The fact table rows for such dates will not have values for the measures. Also,
there could be other combinations of dimension table attributes, values for which the
fact table rows will have null measures. Do we need to keep such rows with null
measures in the fact table? There is no need for this. Therefore, it is important to realize
this type of sparse data and understand that the fact table could have gaps.
Degenerate Dimensions. Look closely at the example of the fact table. You find the attri-
butes of order_number and order_line. These are not measures or metrics or facts.
Then why are these attributes in the fact table? When you pick up attributes for the
dimension tables and the fact tables from operational systems, you will be left with
some data elements in the operational systems that are neither facts nor strictly dimen-
sion attributes. Examples of such attributes are reference numbers like order numbers,
invoice numbers, order line numbers, and so on. These attributes are useful in some
THE STAR SCHEMA 237
269.
types of analyses.For example, you may be looking for average number of products
per order. Then you will have to relate the products to the order number to calculate
the average. Attributes such as order_number and order_line in the example are
called degenerate dimensions and these are kept as attributes of the fact table.
The Factless Fact Table
Apart from the concatenated primary key, a fact table contains facts or measures. Let us say
we are building a fact table to track the attendance of students. For analyzing student attend-
ance, the possible dimensions are student, course, date, room, and professor. The attendance
may be affected by any of these dimensions. When you want to mark the attendance relating
to a particular course, date, room, and professor, what is the measurement you come up with
for recording the event? In the fact table row, the attendance will be indicated with the
number one. Every fact table row will contain the number one as attendance. If so, why
bother to record the number one in every fact table row? There is no need to do this. The
very presence of a corresponding fact table row could indicate the attendance. This type of
situation arises when the fact table represents events. Such fact tables really do not need
to contain facts. They are factless fact tables. Figure 10-12 shows a typical factless fact table.
Data Granularity
By now, we know that granularity represents the level of detail in the fact table. If the fact
table is at the lowest grain, then the facts or metrics are at the lowest possible level at
which they could be captured from the operational systems. What are the advantages of keep-
ing the fact table at the lowest grain? What is the trade-off?
When you keep the fact table at the lowest grain, users can drill down to the lowest level of
detail from the data warehouse without the need to go to the operational systems themselves.
Base level fact tables must be at the natural lowest levels of all corresponding dimensions. By
doing this, queries for drill down and roll up can be performed efficiently.
What then are the natural lowest levels of the corresponding dimensions? In the example
with the dimensions of product, date, customer, and sales representative, the natural lowest
levels are an individual product, a specific individual date, an individual customer, and an
Measures or facts are represented in a fact table. However, there are
business events or coverage that could be represented in a fact table,
although no measures or facts are associated with these.
Date Key
Course Key
Professor Key
Student Key
Room Key
Date Dimension
Course Dimension
Student Dimension
Professor Dimension
Room Dimension
Tracks the attendance although no measured facts in the fact table
Figure 10-12 A factless fact table.
238 PRINCIPLES OF DIMENSIONAL MODELING
270.
individual sales representative,respectively. So, in this case, a single row in the fact table
should contain measurements at the lowest level for an individual product, ordered on a
specific date, relating to an individual customer, and procured by an individual sales
representative.
Let us say we want to add a new attribute of district in the sales representative dimension.
This change will not warrant any changes in the fact table rows because these are already at
the lowest level of individual sales representative. This is a “graceful” change because all the
old queries will continue to run without any changes. Similarly, let us assume we want to add
a new dimension of promotion. Now you will have to recast the fact table rows to include
promotion dimensions. Still, the fact table grain will be at the lowest level.
Even here, the old queries will still run without any changes. This is also a “graceful”
change. Fact tables at the lowest grain facilitate “graceful” extensions.
But we have to pay the price in terms of storage and maintenance for the fact table at the
lowest grain. Lowest grain necessarily means large numbers of fact table rows. In practice,
however, we build aggregate fact tables to support queries looking for summary numbers.
There are two more advantages of granular fact tables. Granular fact tables serve as natu-
ral destinations for current operational data that may be extracted frequently from operational
systems. Further, the more recent data mining applications need details at the lowest grain.
Data warehouses feed data into data mining applications.
STAR SCHEMA KEYS
Figure 10-13 illustrates how the keys are formed for the dimension and fact tables.
Primary Keys
Each row in a dimension table is identified by a unique value of an attribute designated as the
primary key of the dimension. In a product dimension table, the primary key identifies each
product uniquely. In the customer dimension table, the customer number identifies each
STORE KEY
PRODUCT KEY
TIME KEY
Dollars
Units
Product Dimension
Time Dimension
Store Dimension
STORE KEY
Store Desc
District ID
District Desc
Region ID
Region Desc
Level
Fact Table
Fact Table: Composite primary key, one
segment for each dimension
Dimension Table: Generated primary key
Figure 10-13 The STAR schema keys.
STAR SCHEMA KEYS 239
271.
customer uniquely. Similarly,in the sales representative dimension table, the social security
number of the sales representative identifies each sales representative.
We have picked these out as possible candidate keys for the dimension tables. Now let us
consider some implications of these candidate keys. Let us assume that the product code in
the operational system is an 8-position code, two of which positions indicate the code of the
warehouse where the product is normally stored, and two other positions denote the product
category. Let us see what happens if we use the operational system product code as the pri-
mary key for the product dimension table.
The data warehouse contains historic data. Assume that the product code gets changed in
the middle of a year, because the product is now stored in a different warehouse of the com-
pany. So we have to change the product code in the data warehouse. If the product code is the
primary key of the product dimension table, then the newer data for the same product will
reside in the data warehouse with different key values. This could cause problems if we
need to aggregate the data from before the change with the data from after the change to
the product code. What really has caused this problem? The problem is the result of our
decision to use the operational system key as the key for the dimension table.
Surrogate Keys
How do we resolve the problem faced in the previous section? Can we use production system
keys as primary keys for dimension tables? If not, what are the other candidate keys?
There are two general principles to be applied when choosing primary keys for dimension
tables. The first principle is derived from the problem caused when the product began to be
stored in a different warehouse. In other words, the product key in the operational system has
built-in meanings. Some positions in the operational system product key indicate the ware-
house and some other positions in the key indicate the product category. These are built-in
meanings in the key. The first principle to follow is: avoid built-in meanings in the primary
key of the dimension tables.
In some companies, a few of the customers are no longer listed with the companies. They
could have left their respective companies many years ago. It is possible that the customer
numbers of such discontinued customers are reassigned to new customers. Now, let us say
we had used the operational system customer key as the primary key for the customer dimen-
sion table. We will have a problem because the same customer number could relate to the
data for the newer customer and also to the data of the retired customer. The data of the retired
customer may still be used for aggregations and comparisons by city and state. Therefore, the
second principle is: do not use production system keys as primary keys for dimension tables.
What then should we use as primary keys for dimension tables? The answer is to use sur-
rogate keys. The surrogate keys are simply system-generated sequence numbers. They do not
have any built-in meanings. Of course, the surrogate keys will be mapped to the production
system keys. Nevertheless, they are different. The general practice is to keep the operational
system keys as additional attributes in the dimension tables. Refer back to Figure 10-13. The
STORE KEY is the surrogate primary key for the store dimension table. The operational
system primary key for the store reference table may be kept as just another non-key attribute
in the store dimension table.
Foreign Keys
Each dimension table is in a one-to-many relationship with the central fact table. So the
primary key of each dimension table must be a foreign key in the fact table. If there are
240 PRINCIPLES OF DIMENSIONAL MODELING
272.
four dimension tablesof product, date, customer, and sales representative, then the primary
key of each of these four tables must be present in the orders fact table as foreign keys.
Let us reexamine the primary keys for the fact tables. There are three options:
1. A single compound primary key whose length is the total length of the keys of the indi-
vidual dimension tables. Under this option, in addition to the compound primary key,
the foreign keys must also be kept in the fact table as additional attributes. This option
increases the size of the fact table.
2. A concatenated primary key that is the concatenation of all the primary keys of the
dimension tables. Here you need not keep the primary keys of the dimension tables
as additional attributes to serve as foreign keys. The individual parts of the primary
keys themselves will serve as the foreign keys.
3. A generated primary key independent of the keys of the dimension tables. In addition
to the generated primary key, the foreign keys must also be kept in the fact table as
additional attributes. This option also increases the size of the fact table.
In practice, option (2) is used in most fact tables. This option enables you to easily relate
the fact table rows with the dimension table rows.
ADVANTAGES OF THE STAR SCHEMA
When you look at the STAR schema, you find that it is simply a relational model with a one-
to-many relationship between each dimension table and the fact table. What is so special
about the arrangement of the STAR schema? Why is it declared to be eminently suitable
for the data warehouse? What are the reasons for its wide use and success in providing
optimization for processing queries?
Although the STAR schema is a relational model, it is not a normalized model. The
dimension tables are purposely denormalized. This is a basic difference between the
STAR schema and relational schemas for OLTP systems.
Before we discuss some very significant advantages of the STAR schema, we need to be
aware that strict adherence to this arrangement is not always the best option. For example, if
customer is one of the dimensions and if the enterprise has a very large number of customers,
a denormalized customer dimension table is not desirable. A large dimension table may
increase the size of the fact table correspondingly.
However, the advantages far outweigh any shortcomings. So, let us go over the advan-
tages of the STAR schema.
Easy for Users to Understand
Users of OLTP systems interact with the applications through predefined GUI screens
or preset query templates. There is practically no need for the users to understand the data
structures behind the scenes. The data structures and the database schema remain in the
realm of the IT professionals.
Users of decision support systems such as data warehouses are different. Here the users
themselves will formulate queries. When they interact with the data warehouse through
third-party query tools, the users should know what to ask for. They must gain a familiarity
with what data is available to them in the data warehouse. They must have an understanding
of the data structures and how the various pieces are associated with one another in the over-
all scheme. They must comprehend the connections without difficulty.
ADVANTAGES OF THE STAR SCHEMA 241
273.
The STAR schemareflects exactly how the users think and need data for querying and
analysis. They think in terms of significant business metrics. The fact table contains the
metrics. The users think in terms of business dimensions for analyzing the metrics. The
dimension tables contain the attributes along which the users normally query and analyze.
When you explain to the users that the units of product A are stored in the fact table and
point out the relationship of this piece of data to each dimension table, the users readily
understand the connections. That is because the STAR schema defines the join paths in
exactly the same way users normally visualize the relationships. The STAR schema is intui-
tively understood by the users.
Try to walk a user through the relational schema of an OLTP system. For them to under-
stand the connections, you will have to take them through a maze of normalized tables,
sometimes passing through several tables, one by one, to get even the smallest result set.
The STAR schema emerges as a clear winner because of its simplicity. Users understand
the structures and the connections very easily.
The STAR schema has definite advantages after implementation. However, the advan-
tages even in the development stage cannot be overlooked. Because the users understand
the STAR schema so very well, it is easy to use it as a vehicle for communicating with
the users during the development of the data warehouse.
Optimizes Navigation
In a database schema, what is the purpose of the relationships or connections among the data
entities? The relationships are used to go from one table to another for obtaining the infor-
mation you are looking for. The relationships provide the ability to navigate through the data-
base. You hop from table to table using the join paths.
If the join paths are numerous and convoluted, your navigation through the database gets
difficult and slow. On the other hand, if the join paths are simple and straightforward, your
navigation is optimized and becomes faster.
A major advantage of the STAR schema is that it optimizes the navigation through the
database. Even when you are looking for a query result that is seemingly complex, the navi-
gation is still simple and straightforward. Let us look at an example and understand how
this works. Look at Figure 10-14 showing a STAR schema for analyzing defects in auto-
mobiles. Assume you are the service manager at an automobile dealership selling GM
automobiles. You noticed a high incidence of chipped white paint on the Corvettes in
January 2009. You need a tool to analyze such defects, determine the underlying causes,
and resolve the problems.
In the STAR schema, the number of defects is kept as metrics in the middle as part of the
defects fact table. The time dimension contains the model year. The component dimension
has part information; for example, pearl white paint. The problem dimension carries the
types of problems; for example, chipped paint. The product dimension contains the make,
model, and trim package of the automobiles. The supplier dimension contains data on the
suppliers of parts.
Now see how easy it is to determine the supplier causing the chipped paint on the pearl
white Corvettes. Look at the four arrows pointing to the fact table from the four dimension
tables. These arrows show how you will navigate to the rows in the fact table by isolating the
Corvette from the product dimension, chipped paint from the problem dimension, pearl
white paint from the component dimension, and January 2009 from the time dimension.
From the fact table, the navigation goes directly to the supplier dimension to isolate the sup-
plier causing the problem.
242 PRINCIPLES OF DIMENSIONAL MODELING
274.
Most Suitable forQuery Processing
We have already mentioned a few times that the STAR schema is a query-centric structure.
This means that the STAR schema is most suitable for query processing. Let us see how this
is true.
Let us form a simple query on the STAR schema for the order analysis shown in
Figure 10-7. What is the total extended cost of product A sold to customers in
San Francisco during January 2009? This is a three-dimensional query. What should be
the characteristics of the data structure or schema if it is to be most suitable for processing
this query? The final result, which is the total extended cost, will come from the rows in
the fact table. But from which rows? The answer is those rows relating to product A, relating
to customers in San Francisco, and relating to January 2009.
Let us see how the query will be processed. First, select the rows from the customer
dimension table where the city is San Francisco. Then, from the fact table, select only
those rows that are related to these customer dimension rows. This is the first result set of
rows from the fact tables. Next, select the rows in the Time dimension table where the
month is January 2009. Select from the first result set only those rows that are related to
these time dimension rows. This is now the second result set of fact table rows. Move on
to the next dimension of product. Select the rows in the product dimension table where
the product is product A. Select from the second result only those rows that are related to
the selected product dimension rows. You now have the final result of fact table rows.
Add up the extended cost to get the total.
Irrespective of the number of dimensions that participate in the query and irrespective of
the complexity of the query, every query is simply executed first by selecting rows from the
dimension tables using the filters based on the query parameters and then finding the corre-
sponding fact table rows. This is possible because of the simple and straightforward join
paths and because of the very arrangement of the STAR schema. There is no intermediary
maze to be navigated to reach the fact table from the dimension tables.
DEFECTS
PROBLEM
COMPO-
NENT
TIME
PRODUCT
SUPPLIER
Figure 10-14 The STAR schema optimizes navigation.
ADVANTAGES OF THE STAR SCHEMA 243
275.
Another important aspectof data warehouse queries is the ability to drill down or roll up.
Let us quickly run through a drill-down scenario. Let us say we have queried and obtained the
total extended cost for all the customers in the state of California. The result comes from the
set of fact table rows. Then we want to drill down and look at the results by zip code ranges.
This is obtained by making a further selection from the selected fact table rows relating to the
chosen zip code ranges. Drill down is a process of further selection of the fact table rows.
Going the other way, rolling up is a process of expanding the selection of the fact table rows.
STARjoin and STARindex
The STAR schema allows the query processor software to use better execution plans. It
enables specific performance schemes to be applied to queries. The STAR schema arrange-
ment is eminently suitable for special performance techniques such as the STARjoin and the
STARindex.
STARjoin is a high-speed, single-pass, parallelizable, multitable join. It can join more
than two tables in a single operation. This special scheme boosts query performance.
STARindex is a specialized index to accelerate join performance. These are indexes cre-
ated on one or more foreign keys of the fact table. These indexes speed up joins between the
dimension tables and the fact table.
Chapter 18 deals with the physical design and indexing methods for the data warehouse.
STAR SCHEMA: EXAMPLES
In this section we provide four examples of STAR schema relating to four different types of
businesses. In each case, notice the following carefully and understand the STAR schema:
† The metrics or facts being analyzed
† The business dimensions used for analysis
† The hierarchy available within each dimension for drill down and roll up
† The primary and foreign keys
Video Rental
See Figure 10-15.
Supermarket
See Figure 10-16.
Wireless Phone Service
See Figure 10-17.
Auction Company
See Figure 10-18.
244 PRINCIPLES OF DIMENSIONAL MODELING
276.
Item Key
Time Key
CustomerKey
Store Key
Promotion Key
Rental Fee
Late Charge
RENTAL FACTS
CUSTOMER
PROMOTION
RENTAL ITEM
TIME
Customer Key
Customer Name
Customer Code
Address
State
Zip
Rental Plan Type
Promotion Key
Promotion Code
Promotion Type
Discount Rate
Time Key
Date
Day of Month
Week End Flag
Month
Quarter
Year
Item Key Title
Item No
Rating
New Release Flag
Genre
Classification
Sub-classification
Director
Lead Male
Lead Female
Store Key
Store Name
Store Code
Zip Code
Manager
STORE
Figure 10-15 STAR schema example: video rental.
Product Key
Time Key
Store Key
Promotion Key
Sold Quantity
Gross Sales
Net Sales
Cost
Store Coupon Amt
Mfr Coupon Amt
SALES FACTS
STORE
PROMOTION
PRODUCT
TIME
Store Key
Store Name
Store Code
Address
State
Zip
Manager Name
Promotion Key
Promotion Code
Promotion Type
Promotion Medium
Discount Rate
Time Key
Date
Day Number
Day Of Week
Week Number
Month
Month Number
Fiscal Period
Quarter
Year
Product Key
Product Name
Product Code
Product Line
Brand
Department
Figure 10-16 STAR schema example: supermarket.
STAR SCHEMA: EXAMPLES 245
277.
CHAPTER SUMMARY
† Thecomponents of the dimensional model are derived from the information packages
in the requirements definition.
Plan Key
Time Key
Customer Key
Status Key
Plan Minutes
Overage Minutes
Mthly Access Charges
Mthly Overage Charges
Voice Usage
Data Usage
USAGE FACTS
CUSTOMER
STATUS
PLAN
TIME
Customer Key
Customer Name
Customer Code
Family Size
Address
State
Zip
Status Key
New Customer
New Address
Payment Overdue
Closed This Period
Time Key
Month Number
Month
Quarter
Fiscal Period
Year
Plan Key
Plan Name
Plan Code
Num Of Phones
Monthly Minutes
Rollover Minutes
Figure 10-17 STAR schema example: wireless phone service.
Item Key
Time Key
Consignor Key
Buyer Key
Location Key
Low Estimate
High Estimate
Reserve Price
Sold Price
AUCTION SALES
CONSIGNOR
ITEM
TIME
Consignor Key
Consignor Name
Consignor Code
Consignor Type
Consignor Addr
Consignor State
Consignor Zip
Time Key
Date
Month
Quarter
Year
Item Key
Item Name
Item Number
Department
Sold Flag
BUYER
Buyer Key
Buyer Name
Buyer Code
Buyer Type
Buyer Addr
Buyer State
Buyer Zip
Location Key
Auction Location
Country
Continent
Hemisphere
LOCATION
Figure 10-18 STAR schema example: auction company.
246 PRINCIPLES OF DIMENSIONAL MODELING
278.
† The entity-relationshipmodeling technique is not suitable for data warehouses; the
dimensional modeling technique is appropriate.
† The STAR schema used for data design is a relational model consisting of fact and
dimension tables.
† The fact table contains the business metrics or measurements; the dimension tables
contain the business dimensions. Hierarchies within each dimension table are used
for drilling down to lower levels of data.
† STAR schema advantages are that it is easy for users to understand optimizes
navigation, is most suitable for query processing, and enables specific performance
schemes.
REVIEW QUESTIONS
1. Discuss the major design issues that need to be addressed before proceeding with the
data design.
2. Why is the entity-relationship modeling technique not suitable for the data warehouse?
How is dimensional modeling different?
3. What is the STAR schema? What are the component tables?
4. A dimension table is wide; the fact table is deep. Explain.
5. What are hierarchies and categories as applicable to a dimension table?
6. Differentiate between fully additive and semiadditive measures.
7. Explain the sparse nature of the data in the fact table.
8. Describe the composition of the primary keys for the dimension and fact tables.
9. Discuss data granularity in a data warehouse.
10. Name any three advantages of the STAR schema. Can you think of any disadvantages of
the STAR schema?
EXERCISES
1. Match the columns:
1. information package
2. fact table
3. case tools
4. dimension hierarchies
5. dimension table
6. degenerate dimensions
7. profit margin percentage
8. data granularity
9. STAR schema
10. customer demographics
A. enable drill down
B. reference numbers
C. level of detail
D. users understand easily
E. semiadditive
F. STAR schema components
G. used for dimensional modeling
H. dimension attribute
I. contains metrics
J. wide
EXERCISES 247
279.
2. Refer backto the information package given for a hotel chain in Chapter 5 (Fig. 5.6). Use
this information package and design a STAR schema.
3. What is a factless fact table? Design a simple STAR schema with a factless fact table to
track patients in a hospital by diagnostic procedures and time.
4. You are the data design specialist on the data warehouse project team for a manufacturing
company. Design a STAR schema to track the production quantities. Production quan-
tities are normally analyzed along the business dimensions of product, time, parts
used, production facility, and production run. State your assumptions.
5. In a STAR schema to track the shipments for a distribution company, the following
dimension tables are found: (1) time, (2) customer ship-to, (3) ship-from, (4) product,
(5) type of deal, and (6) mode of shipment. Review these dimensions and list the possible
attributes for each of the dimension tables. Also, designate a primary key for each table.
248 PRINCIPLES OF DIMENSIONAL MODELING
280.
CHAPTER 11
DIMENSIONAL MODELING:ADVANCED
TOPICS
CHAPTER OBJECTIVES
† Discuss and get a good grasp of slowly changing dimensions
† Understand large dimensions and how to deal with them
† Examine the snowflake schema in detail
† Learn about aggregate tables and determine when to use them
† Completely survey families of STARS and their applications
From the previous chapter, you have learned the basics of dimensional modeling. You know
that the STAR schema is composed of the fact table in the middle surrounded by the dimen-
sion tables. Although this is a good visual representation, it is still a relational model in which
each dimension table is in a parent-child relationship with the fact table. The primary key of
each dimension table, therefore, is a foreign key in the fact table.
You have also grasped the nature of the attributes within the fact table and the dimension
tables. You have understood the advantages of the STAR schema in decision support sys-
tems. The STAR schema is easy for users to understand; it optimizes navigation through
the data warehouse content and is most suitable for query-centric environments.
Our study of dimensional modeling will not be complete until we consider some more
topics. In the STAR schema, the dimension tables enable analysis in many different
ways. We need to explore the dimension tables in further detail. How about summarizing
the metrics and storing aggregate numbers in additional fact tables? How much precalculated
aggregation is necessary? The STAR schema is a denormalized design. Does this result in
too much redundancy and inefficiency? If so, is there an alternative approach?
Let us now move beyond the basics of dimensional modeling and consider additional fea-
tures and issues. Let us discuss the pertinent advanced topics and extend our study further.
Data Warehousing Fundamentals for IT Professionals, Second Edition. By Paulraj Ponniah
Copyright # 2010 John Wiley & Sons, Inc.
249
281.
UPDATES TO THEDIMENSION TABLES
Going back to Figure 10-4 of the previous chapter, you see the STAR schema for automaker
sales. The fact table Auto Sales contains the measurements or metrics such as Actual Sale
Price, Options Price, and so on. Over time, what happens to the fact table? Every day as
more and more sales take place, more and more rows get added to the fact table. Over
time the number of rows in the fact table continues to grow. Very rarely are the rows in a
fact table updated with changes. Even when there are adjustments to the prior numbers,
these are also processed as additional adjustment rows and added to the fact table.
Now consider the dimension tables. Compared to the fact table, the dimension tables are
more stable and less volatile. However, unlike the fact table, which changes through an
increase in the number of rows, a dimension table does not change just through the increase
in the number of rows, but also through changes to the attributes themselves.
Look at the product dimension table. Every year, rows are added as new models become
available. But what about the attributes within the product dimension table? If a particular
product is moved to a different product category, then the corresponding values must be
changed in the product dimension table. Let us examine the types of changes that affect
dimension tables and discuss the ways for dealing with these types.
Slowly Changing Dimensions
In the above example, we mentioned a change to the product dimension table because the
product category for a product was changed. Consider the customer demographics dimen-
sion table. What happens when a customer’s status changes from rental home to own
home? The corresponding row in that dimension table must be changed. Next, look at the
payment method dimension table. When finance type changes for one of the payment
methods, this change must be reflected in the payment method dimension table.
From the consideration of the changes to the dimension tables, we can derive the follow-
ing principles:
† Most dimensions are generally constant over time.
† Many dimensions, though not constant over time, change slowly.
† The product key of the source record does not change.
† The description and other attributes change slowly over time.
† In the source OLTP systems, the new values overwrite the old ones.
† Overwriting of dimension table attributes is not always the appropriate option in a data
warehouse.
† The ways changes are made to the dimension tables depend on the types of changes and
what information must be preserved in the data warehouse.
Techniques for making the changes fall into three distinct types. Data warehousing
practitioners have come up with different techniques for applying the changes. They have
also given names to these three types of dimension table changes. Yes, your guess in
right. The given names are type 1 changes, type 2 changes, and type 3 changes.
We will study these three types by using a simple STAR schema for tracking orders for a
distributor of industrial products, as shown in Figure 11-1. This STAR schema consists of
250 DIMENSIONAL MODELING: ADVANCED TOPICS
282.
the fact tableand four dimension tables. Let us assume some changes to these dimensions
and review the techniques for applying the changes to the dimension tables.
Type 1 Changes: Correction of Errors
Nature of Type 1 Changes These changes usually relate to the corrections of errors in
the source systems. For example, suppose a spelling error in the customer name is corrected
to read Michael Romano from the erroneous entry of Michel Romano, Also, suppose the
customer name for another customer is changed from Kristin Daniels to Kristin
Samuelson, and the marital status changed from single to married.
Consider the changes to the customer name in both cases. There is no need to preserve
the old values. In the case of Michael Romano, the old name is erroneous and needs to be
discarded. When a user needs to find all the orders from Michael Romano, he or she will
use the correct name. The same principles apply to the change in customer name for
Kristin Samuelson.
But the change in the marital status is slightly different. This change can be handled in the
same way as the change in customer name only if that change is a correction of error.
Otherwise, you will cause problems when the users want to analyze orders by marital status.
Here are the general principles for type 1 changes:
† Usually, the changes relate to correction of errors in source systems.
† Sometimes the change in the source system has no significance.
† The old value in the source system needs to be discarded.
† The change in the source system need not be preserved in the data warehouse.
Product Key
Time Key
Customer Key
Salesperson Key
Order Dollars
Cost Dollars
Margin Dollars
Sale Units
ORDER FACTS
CUSTOMER
SALESPERSON
PRODUCT
TIME
Customer Key
Customer Name
Customer Code
Marital Status
Address
State
Zip
Salesperson Key
Salesperson Name
Territory Name
Region Name
Time Key
Date
Month
Quarter
Year
Product Key
Product Name
Product Code
Product Line
Brand
Figure 11-1 STAR schema for order tracking.
UPDATES TO THE DIMENSION TABLES 251
283.
Applying Type 1Changes to the Data Warehouse Figure 11-2 shows the appli-
cation of type 1 changes to the customer dimension table. The method for applying type I
changes is:
† Overwrite the attribute value in the dimension table row with the new value.
† The old value of the attribute is not preserved.
† No other changes are made in the dimension table row.
† The key of this dimension table or any other key values are not affected.
† This type is easiest to implement.
Type 2 Changes: Preservation of History
Nature of Type 2 Changes Go back to the change in the marital status for Kristin
Samuelson. Assume that in your data warehouse one of the essential requirements is to
track orders by marital status in addition to tracking by other attributes. If the change to mar-
ital status happened on October 1, 2008, all orders from Kristin Samuelson before that date
must be included under marital status: single, and all orders on or after October 1, 2008
should be included under marital status: married.
What exactly is needed in this case? In the data warehouse, you must have a way of sep-
arating the orders for the customer so that the orders before and after that date can be added
up separately.
Now let us add another change to the information about Kristin Samuelson. Assume that
she moved to a new address in California from her old address in New York on November 1,
2008. If it is a requirement in your data warehouse that you must be able to track orders by
state, then this change must also be treated like the change to marital status. Any orders prior
to November 1, 2008 will go under the state: NY.
Customer Key:
Customer
Name:
Customer
Code:
Marital Status:
Address:
State:
Zip:
33154112
Kristin Daniels
K12356
Single
733 Jackie Lane,
Baldwin Harbor
NY
11510
33154112
Kristin Samuelson
K12356
Single
733 Jackie Lane,
Baldwin Harbor
NJ
11510
Customer Code:
K12356
Customer Name:
Kristin Samuelson
INCREMENTAL LOAD
-- TYPE 1 CHANGE
33154112 K12356
R
E
T
F
A
E
R
O
F
E
B
KEY RESTRUCTURING
Figure 11-2 The method for applying type 1 changes.
252 DIMENSIONAL MODELING: ADVANCED TOPICS
284.
The types ofchanges we have discussed for marital status and customer address are type 2
changes. Here are the general principles for this type of change:
† They usually relate to true changes in source systems.
† There is a need to preserve history in the data warehouse.
† This type of change partitions the history in the data warehouse.
† Every change for the same attribute must be preserved.
Applying Type 2 Changes to the Data Warehouse Figure 11-3 shows the appli-
cation of type 2 changes to the customer dimension table. The method for applying type 2
changes is:
† Add a new dimension table row with the new value of the changed attribute.
† An effective date field may be included in the dimension table.
† There are no changes to the original row in the dimension table.
† The key of the original row is not affected.
† The new row is inserted with a new surrogate key.
Type 3 Changes: Tentative Soft Revisions
Nature of Type 3 Changes Almost all the usual changes to dimension values are
either type 1 or type 2 changes. Of these two, type 1 changes are more common. Type 2
changes preserve the history. When you apply a type 2 change on a certain date, that date
Customer Key:
Customer
Name:
Customer
Code:
Marital Status:
Address:
State:
Zip:
33154112
Kristin Daniels
K12356
Single
733 Jackie Lane,
Baldwin Harbor
NY
11510
51141234
Kristin Samuelson
K12356
Married
733 Jackie Lane,
Baldwin Harbor
NY
11510
Customer Code: K12356
Marital Status: Married
Address: 1417 Ninth Street,
Sacramento
State: CA Zip: 94236
INCREMENTAL LOAD -- TYPE 2
CHANGES ON 10/1/2008 & 11/1/2008
33154112 K12356
51141234
52789342
BEFORE AFTER-Eff. 10/1/2008
KEY RESTRUCTURING
52789342
Kristin Samuelson
K12356
Married
1417 Ninth Street,
Sacramento
CA
11510
AFTER- Eff. 11/1/2008
Figure 11-3 The method for applying type 2 changes.
UPDATES TO THE DIMENSION TABLES 253
285.
is a cut-offpoint. In the above case of change to marital status on October 1, 2008, that date
is the cut-off date. Any orders from the customer prior to that date fall into the older
orders group; orders on or after that date fall into the newer orders group. An order for
this customer has to fall in one or the other group; it cannot be counted in both groups for
any period of time.
What if you have the need to count the orders on or after the cut-off date in both groups
during a certain period after the cut-off date? You cannot handle this change as a type 2
change. Sometimes, though rarely, there is a need to track both the old and new values of
changed attributes for a certain period, in both forward and backward directions. These
types of changes are type 3 changes.
Type 3 changes are tentative or soft changes. An example will make this clearer. Assume
your marketing department is contemplating a realignment of the territorial assignments for
salespersons. Before making a permanent realignment, they want to count the orders in two
ways: according to the current territorial alignment and also according to the proposed
realignment. This type of provisional or tentative change is a type 3 change.
As an example, let us say you want to move salesperson Robert Smith from the
New England territory to the Chicago territory with the ability to trace his orders in both
territories. You need to track all orders through Robert Smith in both territories.
Here are the general principles for type 3 changes:
† They usually relate to “soft” or tentative changes in the source systems.
† There is a need to keep track of history with old and new values of the changed
attribute.
† They are used to compare performances across the transition.
† They provide the ability to track forward and backward.
Salesperson Key
Salesperson
Name:
Old Territory
Name:
Current Territory
Name:
Effective Date:
Region Name:
12345
Robert Smith
New England
January 1, 2006
North
Salesperson ID:
RS199701
Territory Name:
Chicago
INCREMENTAL LOAD --
TYPE 3 CHANGE Eff. 12/1/2008
12345 RS199701
R
E
T
F
A
E
R
O
F
E
B
KEY RESTRUCTURING
12345
Robert Smith
New England
Chicago
December 1, 2008
North
Figure 11-4 Applying type 3 changes.
254 DIMENSIONAL MODELING: ADVANCED TOPICS
286.
Applying Type 3Changes to the Data Warehouse Figure 11-4 shows the appli-
cation of type 3 changes to the customer dimension table. The methods for applying type 3
changes are:
† Add an “old” field in the dimension table for the affected attribute.
† Push down the existing value of the attribute from the “current” field to the “old” field.
† Keep the new value of the attribute in the “current” field.
† Also, you may add a “current” effective date field for the attribute.
† The key of the row is not affected.
† No new dimension row is needed.
† The existing queries will seamlessly switch to the “current” value.
† Any queries that need to use the “old” value must be revised accordingly.
† The technique works best for one “soft” change at a time.
† If there is a succession of changes, more sophisticated techniques must be devised.
MISCELLANEOUS DIMENSIONS
Having considered the types of changes to dimension attributes and the ways to handle the
dimension changes in the data warehouse, let us now turn our attention to a few other impor-
tant issues about dimensions. One issue relates to dimension tables that are very wide and
very deep.
In our earlier discussion, we had assumed that dimension attributes do not change too
rapidly. If the change is a type 2 change, you know that you have to create another row
with the new value of the attribute. If the value of the attribute changes again, then you
create another row with the newer value. What if the value changes too many times or too
rapidly? Such a dimension is no longer a slowly changing dimension. What must you do
about a not-so-slowly-changing dimension? We will complete our discussion of dimensions
by considering such relevant issues.
Large Dimensions
You may consider a dimension large based on two factors. A large dimension is very deep;
that is, the dimension has a very large number of rows. A large dimension may also be very
wide; that is, the dimension may have a large number of attributes or columns. In either case,
you may declare the dimension large. There are special considerations for large dimensions.
You may have to attend to populating large-dimension tables in a special way. You may want
to separate out some mini-dimensions from a large dimension. We will take a simple STAR
schema designed for order analysis. Assume this to be the schema for a manufacturing com-
pany and that the marketing department is interested in determining how they are making
progress with the orders received by the company.
In a data warehouse, typically the customer and product dimensions are likely to be large.
Whenever an enterprise deals with the general public, the customer dimension is expected to
be gigantic. The customer dimension of a national retail chain can approach the size of
the number of U.S. households. Such customer dimension tables may have as many as
100 million rows. Next on the scale, the number of dimension table rows of companies in
telecommunications and travel industries may also run in the millions. Having 10 or 20
MISCELLANEOUS DIMENSIONS 255
287.
million customer rowsis not uncommon. The product dimension of large retailers is also
quite huge.
Here are some typical features of large customer and product dimensions:
Customer
† Huge—in the range of 20 million rows
† Easily up to 150 dimension attributes
† Can have multiple hierarchies
Product
† Sometimes as many as 100,000 product variations
† Can have more than 100 dimension attributes
† Can have multiple hierarchies
Large dimensions call for special considerations. Because of the sheer size, many data
warehouse functions involving large dimensions may be slow and inefficient. You need
to address the following issues by using effective design methods, by choosing proper
indexes, and by applying other optimizing techniques:
† Populating very large dimension tables
† Browse performance of unconstrained dimensions, especially where the cardinality of
the attributes is low
† Browsing time for cross-constrained values of the dimension attributes
† Inefficiencies in fact table queries when large dimensions need to be used
† Additional rows created to handle type 2 slowly changing dimensions
Multiple Hierarchies Large dimensions usually possess another distinct characteristic.
They tend to have multiple hierarchies. Take the example of the product dimension for a
large retailer. One set of attributes may form the hierarchy for the marketing department.
Users from that department use these attributes to drill down or up. In the same way, the
finance department may need to use its own set of attributes from the same product dimen-
sion to drill down or up. Figure 11-5 shows multiple hierarchies within a large product
dimension.
Rapidly Changing Dimensions
As you know, when you deal with a type 2 change, you create an additional dimension table
row with the new value of the changed attribute. By doing so, you are able to preserve the
history. If the same attribute changes a second time, you create one more dimension table
row with the latest value.
Most product dimensions change very infrequently, maybe once or twice a year. If the
number of rows in such a product dimension is about 100,000 or so, using the approach
of creating additional rows with the new values of the attributes is easily manageable.
Even if the number of rows is in the range of several thousands, the approach of applying
the changes as type 2 changes is still quite feasible.
However, consider another dimension, such as the customer dimension. Here the number
of rows tends to be large, sometimes in the range of even a million or more rows. If the
256 DIMENSIONAL MODELING: ADVANCED TOPICS
288.
attributes of alarge number of rows change, but change infrequently, the type 2 approach is
not too difficult. But significant attributes in a customer dimension may change many times
in a year. Rapidly changing large dimensions can be too problematic for the type 2 approach.
The dimension table could be littered with a very large number of additional rows created
every time there is an incremental load.
Before rushing to explore other options for handling rapidly changing large dimensions,
deal with each large dimension individually. The type 2 approach is still good in a STAR
schema design. Here are some reasons why the type 2 approach could work in many
cases for rapidly changing dimensions:
† When the dimension table is kept flat, it allows symmetric cross-browsing among the
various attributes of the dimension.
† Even when additional dimension table rows get created, the basic dimensional struc-
ture is still preserved. The fact table is connected to all the dimension tables by foreign
keys. The advantages of the STAR schema are still available.
† Only when the end-user queries are based on a changed attribute does the existence of
multiple rows for the same customer become apparent. For other queries, the existence
of multiple rows is practically hidden.
What if the dimension table is too large and is changing too rapidly? Then seek alterna-
tives to straightforward application of the type 2 approach. One effective approach is to break
the large dimension table into one or more simpler dimension tables. How can you accom-
plish this?
Product Key
Product Description
Product Source Key
Product Line
Product Group
Brand
Vendor Make
Sub-Category
Category
Major Group
Department
Division
Hemisphere
Package Size
Package Type
Weight
Unit of Measure
Stackable
Shelf Height
Shelf Depth
Shelf Width
PRODUCT
DIMENSION
Hierarchy for
Marketing
Hierarchy for
Finance
Figure 11-5 Multiple hierarchies in a large product dimension.
MISCELLANEOUS DIMENSIONS 257
289.
Obviously, you needto break off the rapidly changing attributes into another dimension
table, leaving the slowly changing attributes behind in the original table. Figure 11-6 shows
how a customer dimension table may be separated into two dimension tables. The figure
illustrates the general technique of separating out the rapidly changing attributes. Use this
as a guide when dealing with large, rapidly changing dimensions in your data warehouse
environment.
Junk Dimensions
Examine your source legacy systems and review the individual fields in source data struc-
tures for customer, product, order, sales territories, promotional campaigns, and so on.
Most of these fields wind up in the dimension tables. You will notice that some fields like
miscellaneous flags and textual fields are left in the source data structures. These include
yes/no flags, textual codes, and free form texts.
A few of these flags and textual data may be too obscure to be of real value. These may be
leftovers from past conversions from manual records created long ago. However, many of the
flags and texts could be of value once in a while in queries. These may not be included as
significant fields in the major dimensions. At the same time, these flags and texts cannot
be discarded either. So, what are your options? Here are the main choices:
† Exclude and discard all flags and texts. Obviously, this is not a good option, for the
simple reason that you are likely to throw away some useful information.
† Place the flags and texts unchanged in the fact table. This option is likely to swell up the
fact table to no specific advantage.
Customer Key (PK)
Customer Name
Address
State
Zip
Phone
…………….
……………..
Behavior Key (PK)
Customer Type
Product Returns
Credit Rating
Marital Status
Purchases Range
Life Style
Income Level
Home Ownership
Customer Key
Behavior Key
Other keys
…………...
Metrics
Customer Key
Other keys
…………...
Metrics
Customer Key (PK)
Customer Name
Address
State
Zip
Customer Type
Product Returns
Credit Rating
Marital Status
Purchases Range
Life Style
Income Level
Home Ownership
…………….
……………..
CUSTOMER
DIMENSION (Original)
CUSTOMER
DIMENSION (New)
BEHAVIOR
DIMENSION (New)
Any FACT table
Any FACT table
Figure 11-6 Dividing a large, rapidly changing dimension table.
258 DIMENSIONAL MODELING: ADVANCED TOPICS
290.
† Make eachflag and text a separate dimension table on its own. Using this option, the
number of dimension tables will greatly increase.
† Keep only those flags and texts that are meaningful; group all the useful flags into a
single “junk” dimension. “Junk” dimension attributes are useful for constraining
queries based on flag/text values.
THE SNOWFLAKE SCHEMA
“Snowflaking” is a method of normalizing the dimension tables in a STAR schema. When
you completely normalize all the dimension tables, the resultant structure resembles a snow-
flake with the fact table in the middle. First, let us begin with Figure 11-7, which shows a
simple STAR schema for sales in a manufacturing company.
The sales fact table contains quantity, price, and other relevant metrics. Sales rep, custo-
mer, product, and time are the dimension tables. This is a classic STAR schema, denorma-
lized for optimal query access involving all or most of the dimensions. The model is not in
the third normal form.
Options to Normalize
Assume that there are 500,000 product dimension rows. These products fall under 500 pro-
duct brands and these product brands fall under 10 product categories. Now suppose one of
your users runs a query constraining just on product category. If the product dimension table
is not indexed on product category, the query will have to search through 500,000 rows. On
the other hand, even if the product dimension is partially normalized by separating out pro-
duct brand and product category into separate tables, the initial search for the query will have
to go through only 10 rows in the product category table. Figure 11-8 illustrates this
reduction in the search process.
SALES FACTS
CUSTOMER
SALESREP
PRODUCT
TIME
Customer Key
Customer Name
Customer Code
Marital Status
Address
State
Zip
Classification
SalesRep Key
Salesperson Name
Territory Name
Region Name
Time Key
Date
Month
Quarter
Year
Product Key
Product Name
Product Code
Brand Name
Product Category
Package Type
Product Key
Time Key
Customer Key
SalesRep Key
Sales Quantity
Sales Dollars
Sales Price Margin
Figure 11-7 Sales: a simple STAR schema.
THE SNOWFLAKE SCHEMA 259
291.
In Figure 11-8,we have not completely normalized the product dimension. We can also
move other attributes out of the product dimension table and form normalized structures.
“Snowflaking” or normalization of the dimension tables can be achieved in a few different
ways. When you want to “snowflake,” examine the contents and the normal usage of each
dimension table.
The following options indicate the different methods you may want to consider for
normalization of the dimension tables:
† Partially normalize only a few dimension tables, leaving the others intact.
† Partially or fully normalize only a few dimension tables, leaving the rest intact.
† Partially normalize every dimension table.
† Fully normalize every dimension table.
Figure 11-9 shows the version of the snowflake schema for sales in which every dimen-
sion table is partially or fully normalized.
The original STAR schema for sales as shown in Figure 11-7 contains only 5 tables,
whereas the normalized version now extends to 11 tables. You will notice that in the snow-
flake schema, the attributes with low cardinality in each original dimension table are
removed to form separate tables. These new tables are linked back to the original dimension
table through artificial keys.
Advantages and Disadvantages
You may want to snowflake for one obvious reason. By eliminating all the long text fields
from the dimension tables, you expect to save storage space. For example, if you have “men’s
Product Key
Time Key
Customer Key
SalesRep Key
Sales Quantity
Sales Dollars
Sales Price Margin
SALES FACTS
CUSTOMER
SALESREP
PRODUCT
TIME
Customer Key
Customer Name
Customer Code
Marital Status
Address
State
Zip
Country
SalesRep Key
Salesperson Name
Territory Name
Region Name
Time Key
Date
Month
Quarter
Year
Product Key
Product Name
Product Code
Package Type
Brand Key
CATEGORY
Brand Key
Brand Name
Category Key
Category Key
Product Category
BRAND
Figure 11-8 Product dimension: partially normalized.
260 DIMENSIONAL MODELING: ADVANCED TOPICS
292.
furnishings” as oneof the category names, that text will be repeated on every product row in
that category. At first blush, removing such redundancies might appear to save significant
storage space when the dimensions are large.
Let us assume that your product dimension table has 500,000 rows. By snowflaking you
are able to remove 500,000 20-byte category names. At the same time, you have to add a
4-byte artificial category key to the dimension table. The net savings work out to be approxi-
mately 500,000 times 16, that is, about 8 MB. Your average 500,000-row product dimension
table occupies about 200 MB of storage space and the corresponding fact table another 20
GB. The savings are just 4%. You will find that the small savings in space does not compen-
sate for the other disadvantages of snowflaking.
Here is a brief summary of the advantages and limitations of snowflaking:
Advantages
† Small savings in storage space
† Normalized structures are easier to update and maintain
Disadvantages
† Schema less intuitive and end-users are put off by the complexity
† Ability to browse through the contents difficult
† Degraded query performance because of additional joins
Snowflaking is not generally recommended in a data warehouse environment. Query
performance takes the highest significance in a data warehouse and snowflaking hampers
the performance.
Product Key
Time Key
Customer Key
SalesRep Key
Sales Quantity
Sales Dollars
Sales Price Margin
SALES FACTS
CUSTOMER
SALESREP
PRODUCT
TIME
Customer Key
Customer Name
Customer Code
Marital Status
Address
State
Zip
Country Key
SalesRep Key
Salesperson Name
Territory Key
Time Key
Date
Month
Quarter
Year
Product Key
Product Name
Product Code
Package Key
Brand Key
BRAND
Brand Key
Brand Name
Category Key
Category Key
Product Category
CATEGORY
CountryKey
Country Name
Territory Key
Territory Name
Region Key
Region Key
Region Name
Package Key
Package Type
COUNTRY
REGION
TERRITORY
PACKAGE
Figure 11-9 Sales: the “snowflake” schema.
THE SNOWFLAKE SCHEMA 261
293.
When to Snowflake
Asan IT professional, you have an affinity for third normal form structures. We very well
know all the problems unnormalized structures can cause. Further, wasted space could be
another consideration for snowflaking.
In spite of the apparent disadvantages, are there any circumstances under which snow-
flaking may be permissible? The principle behind snowflaking is normalization of the
dimension tables by removing low cardinality attributes and forming separate tables. In a
similar manner, some situations provide opportunities to separate out a set of attributes
and form a subdimension. This process is very close to the snowflaking technique.
Figure 11-10 shows how a city classification subdimension is formed out of the customer
dimension.
Although forming subdimensions may be construed as snowflaking, it makes a lot of
sense to separate out the demographic attributes into another table. You usually load the
demographic data at times different from the times when you load the other dimension attri-
butes. The two sets of attributes differ in granularity. If the customer dimension is very large,
running into millions of rows, the savings in storage space could be substantial, Another
valid reason for separating out the demographic attributes relates to the browsing of attri-
butes. Users may browse the demographic attributes more than the others in the customer
dimension table.
AGGREGATE FACT TABLES
Aggregates are precalculated summaries derived from the most granular fact table. These
summaries form a set of separate aggregate fact tables. You may create each aggregate
fact table as a specific summarization across any number of dimensions. Let us begin by
examining a sample STAR schema. Choose a simple STAR schema with the fact table at
City Class Key (PK)
City Code
Class Description
Population Range
Cost of Living
Pollution Index
Quality of Life
Public Transportation
Roads and Streets
Parks
Commerce Index
Customer Key
…………..
Other keys
…………...
Metrics
Customer Key (PK)
Customer Name
Address
State
Zip
City Class Key
……………..
…………….
……………..
CUSTOMER
DIMENSION
CITY
CLASSIFICATION
Any FACT table
CITY CLASSIFICATION contains attributes to
classify each city within a limited set of classes.
These attributes are separated from the
CUSTOMER DIMENSION to form a separate
sub-dimension as CITY CLASSIFICATION
Figure 11-10 Forming a subdimension.
262 DIMENSIONAL MODELING: ADVANCED TOPICS
294.
the lowest possiblelevel of granularity. Assume there are four dimension tables surrounding
this most granular fact table. Figure 11-11 shows the example we want to examine.
What is the essential difference between queries run in an operational system and those
run in a data warehouse environment? When you run a query in an operational system, it pro-
duces a result set about a single customer, a single order, a single invoice, a single product,
and so on. But, as you know, the queries in a data warehouse environment produce large
result sets. Queries in a data warehouse retrieve hundreds and thousands of table rows,
manipulate the metrics in the fact tables, and then produce the result sets. The manipulation
of the fact table metrics may be a simple addition, an addition with some adjustments, a
calculation of averages, or even an application of complex arithmetic algorithms.
Let us review a few typical queries against the sample STAR schema shown in
Figure 11-11.
Query 1: Total sales for customer number 12345678 during the first week of December
2008 for product Widget-1.
Query 2: Total sales for customer number 12345678 during the first three months of 2009
for product Widget-1.
Query 3: Total sales for all customers in the south-central territory for the first two
quarters of 2009 for product category Bigtools.
Scrutinize these queries and determine how the totals will be calculated in each case. The
totals will be calculated by adding the sales quantities and sales dollars from the qualifying
rows of the fact table. In each case, let us review the qualifying rows that contribute to the
total in the result set.
Query 1: All fact table rows where the customer key relates to customer number
12345678, the product key relates to product Widget-1, and the time key relates to
Product Key
Time Key
Customer Key
Sales Region Key
Unit Sales
Sales Dollars
SALES FACTS
CUSTOMER
SALES REGION
PRODUCT
TIME
Customer Key
Customer Name
Customer Code
Address
State
Zip
Sales Region Key
Territory Name
Region Name
Time Key
Date
Week Number
Month
Quarter
Year
Product Key
Product Name
Product Code
Product Category
Granularity:
One fact table row per
day, for each product,
for each customer
Figure 11-11 STAR schema with most granular fact table.
AGGREGATE FACT TABLES 263
295.
the seven daysin the first week of December 2008. Assuming that a customer may
make at most one purchase of a single product in a single day, only a maximum of
seven fact table rows participate in the summation.
Query 2: All fact table rows where the customer key relates to customer number
12345678, the product key relates to product Widget-1, and the time key relates to
about 90 days of the first quarter of 2009. Assuming that a customer may make at
most one purchase of a single product in a single day, only about 90 fact table rows
or less participate in the summation.
Query 3: All fact table rows where the customer key relates to all customers in the
south-central territory, the product key relates to all products in the product
category Bigtools, and the time key relates to about 180 days in the first two quarters
of 2009. In this case, clearly a large number of fact table rows participate in the
summation.
Obviously, Query 3 will run long because of the large number of fact table rows to be
retrieved. What can be done to reduce the query time? This is where aggregate tables can
be helpful. Before we discuss aggregate fact tables in detail, let us review the sizes of
some typical fact tables in real-world data warehouses.
Fact Table Sizes
Figure 11-12 represents the STAR schema for sales of a large supermarket chain. There are
about two billion rows of the base fact table with the lowest level of granularity. Study the
calculations shown below:
Time dimension: 5 years 365 days ¼ 1825
Store dimension: 300 stores reporting daily sales
Product dimension: 40,000 products in each store (about 4000 sell in each store daily)
Promotion dimension: a sold item may be in only one promotion in a store on a given day
Maximum number of base fact table records: 1825 300 4000 1 ¼ 2 billion
Here are a few more estimates of the fact table sizes in other typical cases:
Telephone call monitoring
Time dimension: 5 years ¼ 1825 days
Number of calls tracked each day: 150 million
Maximum number of base fact table records: 274 billion
Credit card transaction tracking
Time dimension: 5 years ¼ 60 months
Number of credit card accounts: 150 million
Average number of monthly transactions per account: 20
Maximum number of base fact table records: 180 billion
From the above examples you see the typical enormity of the fact tables that are at the
lowest level of granularity. Although none of the queries from the users would call for
264 DIMENSIONAL MODELING: ADVANCED TOPICS
296.
data just froma single row in these fact tables, data at the lowest level of detail is needed. This
is because when a user performs various forms of analysis, he or she must he able to get
result sets comprising a variety of combinations of individual fact table rows. If you do
not keep details by individual stores, you cannot retrieve result sets for products by individ-
ual stores. On the other hand, if you do not keep details by individual products, you cannot
retrieve result sets for stores by individual products.
So, here is the question. If you need detailed data at the lowest level of granularity in the
base fact tables, how do you deal with summations of huge numbers of fact table rows to
produce query results? Consider the following queries related to a grocery chain data
warehouse:
† How did the three new stores in Wisconsin perform during the last three months com-
pared to the national average?
† What is the effect of the latest holiday sales campaign on meat and poultry?
† How do the July 4th holiday sales by product categories compare to last year?
Each of these three queries requires selections and summations from the fact table rows.
For these types of summations, you need detailed data based on one or more dimensions, but
only summary totals based on the other dimensions. For example, for the last query, you
need detailed daily data based on the time dimension, but summary totals by product cat-
egories. In any case, if you had summary totals or precalculated aggregates readily available,
the queries would run faster. With properly aggregated summaries, the performance of each
of these queries can be dramatically improved.
Product Key
Time Key
Store Key
Promotion Key
Unit Sales
Dollar Sales
Dollar Cost
SALES FACTS
STORE
PROMOTION
PRODUCT
TIME
Store Key
Store Name
Store ID
Address
City
State
Zip
District
Manager
Floor Plan
Services Type
Promotion Key
Promotion Name
Promotion Type
Display Type
Coupon Type
Media Type
Promotion Cost
Start Date
End Date
Responsible Manager
Time Key
Date
Day of Week
Week Number
Month
Month Number
Quarter
Year
Holiday Flag
Product Key
SKU Number
Product Description
Brand Name
Product Sub-Category
Product Category
Department
Package Size
Package Type
Weight
Unit of Measure
Units per case
Shelf level
Shelf width
Shelf depth
5 years or
1,825 days
300 stores
40,000 products
(only 4,000 sell in
each store daily)
A sold item
in only one
promotion,
per store,
per day.
2 billion fact table rows
Figure 11-12 STAR schema: grocery chain.
AGGREGATE FACT TABLES 265
297.
Need for Aggregates
Referto Figure 11-12 showing the STAR schema for a grocery chain. In those 300 stores,
assume there are 500 products per brand. Of the 40,000 products, assume that there is at
least one sale per product per store per week. Let us estimate the number of fact table
rows to be retrieved and summarized for the following types of queries:
Query involves 1 product, 1 store, 1 week—retrieve/summarize only 1 fact table row
Query involves 1 product, all stores, I week—retrieve/summarize 300 fact table rows
Query involves 1 brand, 1 store, 1 week—retrieve/summarize 500 fact table rows
Query involves 1 brand, all stores, 1 year—retrieve/summarize 7,800,000 fact table rows
Suppose you had precalculated and created an aggregate fact table in which each row
summarized the totals for a brand, per store, per week. Then the third query must retrieve
only one row from this aggregate fact table. Similarly, the last query must retrieve only
15,600 rows from this aggregate fact table, much less than the 7 million rows.
Further, if you precalculate and create another aggregate fact table in which each row
summarized the totals for a brand, per store, per year, the last query must retrieve only
300 rows.
Aggregates have fewer rows than the base tables. Therefore, when most of the queries are
run against the aggregate fact tables instead of the base fact table, you notice a tremendous
boost to performance in the data warehouse. Formation of aggregate fact tables is certainly a
very effective method to improve query performance.
Aggregating Fact Tables
As we have seen, aggregate fact tables are merely summaries of the most granular data at
higher levels along the dimension hierarchies. Figure 11-13 illustrates the hierarchies
along three dimensions. Examine the hierarchies in the three dimensions. The hierarchy
levels in the time dimension move up from day at the lowest level to year at the highest
level. City is at the lowest level in the store dimension and product at the lowest level in
the product dimension.
In the base fact table, the rows reflect the numbers at the lowest levels of the dimension
hierarchies. For example, each row in the base fact table shows the sales units and sales dol-
lars relating to one date, one store, and one product. By moving up one or more notches along
the hierarchy in each dimension, you can create a variety of aggregate fact tables. Let us
explore the possibilities.
Multi-Way Aggregate Fact Tables Figure 11-14 illustrates the different ways aggre-
gate fact tables may be formed. The following paragraphs describe possible aggregates.
One-Way Aggregates When you rise to higher levels in the hierarchy of one dimension
and keep the level at the lowest in the other dimensions, you create one-way aggregate tables.
Review the following examples:
† Product category by store by date
† Product department by store by date
266 DIMENSIONAL MODELING: ADVANCED TOPICS
298.
Product Key
Time Key
StoreKey
Unit Sales
Sales Dollars
SALES FACTS
STORE
PRODUCT
TIME
Store Key
Store Name
Territory
Region
Time Key
Date
Month
Quarter
Year
Product Key
Product
Category
Department
All Stores
All Products
HIERARCHY
LEVELS HIERARCHY
LEVELS
HIERARCHY
LEVELS
HIERARCHY
LEVELS
Lowest Level
Highest Level
Figure 11-13 Dimension hierarchies.
Store
Region
Territory
All Stores
STORE
Date
Quarter
Month
Year
Product
Department
Category
All Products
PRODUCT TIME EXAMPLES
One-way
Aggregate
Store
Region
Territory
All Stores
Quarter
Month
Year
Product
Department
Category
All Products
Store
Region
Territory
All Stores
Quarter
Month
Year
Product
Department
Category
All Products
Date
Date
Three-way
Aggregate
Two-way
Aggregate
Figure 11-14 Forming aggregate fact tables.
AGGREGATE FACT TABLES 267
299.
† All productsby store by date
† Territory by product by date
† Region by product by date
† All stores by product by date
† Month by store by product
† Quarter by store by product
† Year by store by product
Two-Way Aggregates When you rise to higher levels in the hierarchies of two dimen-
sions and keep the level at the lowest in the other dimension, you create two-way aggregate
tables. Review the following examples:
† Product category by territory by date
† Product category by region by date
† Product category by all stores by date
† Product category by month by store
† Product category by quarter by store
† Product category by year by store
† Product department by territory by date
† Product department by region by date
† Product department by all stores by date
† Product department by month by store
† Product department by quarter by store
† Product department by year by store
† All products by territory by date
† All products by region by date
† All products by all stores by date
† All products by month by store
† All products by quarter by store
† All products by year by store
† District by month by product
† District by quarter by product
† District by year by product
† Territory by month by product
† Territory by quarter by product
† Territory by year by product
† Region by month by product
† Region by quarter by product
† Region by year by product
† All stores by month by product
† All stores by quarter by product
† All stores by year by product
268 DIMENSIONAL MODELING: ADVANCED TOPICS
300.
Three-Way Aggregates Whenyou rise to higher levels in the hierarchies of all the three
dimensions, you create three-way aggregate tables. Review the following examples:
† Product category by territory by month
† Product department by territory by month
† All products by territory by month
† Product category by region by month
† Product department by region by month
† All products by region by month
† Product category by all stores by month
† Product department by all stores by month
† Product category by territory by quarter
† Product department by territory by quarter
† All products by territory by quarter
† Product category by region by quarter
† Product department by region by quarter
† All products by region by quarter
† Product category by all stores by quarter
† Product department by all stores by quarter
† Product category by territory by year
† Product department by territory by year
† All products by territory by year
† Product category by region by year
† Product department by region by year
† All products by region by year
† Product category by all stores by year
† Product department by all stores by year
† All products by all stores by year
Each of these aggregate fact tables is derived from a single base fact table. The derived
aggregate fact tables are joined to one or more derived dimension tables. Figure 11-15
shows a derived aggregate fact table connected to a derived dimension table.
Effect of Sparsity on Aggregation Consider the case of the grocery chain with 300
stores, 40,000 products in each store, but only 4000 selling in each store in a day. As dis-
cussed earlier, assuming that you keep records for 5 years or 1825 days, the maximum
number of base fact table rows is calculated as follows:
Product ¼ 40,000
Store ¼ 300
Time ¼ 1825
Maximum number of base fact table rows ¼ 22 billion
AGGREGATE FACT TABLES 269
301.
Because only 4000products sell in each store in a day, not all of these 22 billion rows are
occupied. Because of this sparsity, only 10% of the rows are occupied. Therefore, the real
estimate of the number of base table rows is 2 billion.
Now let us see what happens when you form aggregates. Scrutinize a one-way aggregate:
brand totals by store by day. Calculate the maximum number of rows in this one-way
aggregate.
Brand ¼ 80
Store ¼ 300
Time ¼ 1825
Maximum number of aggregate table rows ¼ 43,800,000
While creating the one-way aggregate, you will notice that the sparsity for this aggregate
is not 10% as in the case of the base table. This is because when you aggregate by brand,
more of the brand codes will participate in combinations with store and time codes. The spar-
sity of the one-way aggregate would be about 50%, resulting in a real estimate of 21,900,000.
If the sparsity had remained as the 10% applicable to the base table, the real estimate of the
number of rows in the aggregate table would be much less.
When you go for higher levels of aggregates, the sparsity percentage moves up and even
reaches 100%. Because of the failure of sparsity to stay lower, you are faced with the ques-
tion whether aggregates do improve performance that much. Do they reduce the number of
rows that dramatically?
Experienced data warehousing practitioners have a suggestion. When you form aggre-
gates, make sure that each aggregate table row summarizes at least 10 rows in the lower
level table. If you increase this to 20 rows or more, it would be really remarkable.
Product Key
Time Key
Store Key
Unit Sales
Sales Dollars
SALES FACTS
STORE
PRODUCT
TIME
Store Key
Store Name
Territory
Region
Time Key
Date
Month
Quarter
Year
Product Key
Product
Category
Department
CATEGORY
Category Key
Category
Department
Category Key
Time Key
Store Key
Unit Sales
Sales Dollars
SALES FACTS
BASE TABLE
ONE-WAY AGGREGATE
DIMENSION
DERIVED FROM
PRODUCT
Figure 11-15 Aggregate fact table and derived dimension table.
270 DIMENSIONAL MODELING: ADVANCED TOPICS
302.
Aggregation Options
Going backto our discussion of one-way, two-way, and three-way aggregates for a basic
STAR schema with just three dimensions, you could count more than 50 different ways
you may create aggregates. In the real world, the number of dimensions is not just three, but
many more. Therefore, the number of possible aggregate tables escalates into the hundreds.
Further, from the reference to the failure of sparsity in aggregate tables, you know that the
aggregation process does not reduce the number of rows proportionally. In other words, if the
sparsity of the base fact table is 10%, the sparsity of the higher-level aggregate tables does
not remain at 10%. The sparsity percentage increases more and more as your aggregate tables
climb higher and higher in levels of summarization.
Is aggregation that much effective after all? What are some of the options? How do you
decide what to aggregate? First, set a few goals for aggregation for your data warehouse
environment.
Goals for Aggregation Strategy Apart from the general overall goal of improving
data warehouse performance, here are a few specific, practical goals:
† Do not get bogged down with too many aggregates. Remember, you have to create
additional derived dimensions as well to support the aggregates.
† Try to cater to a wide range of user groups. In any case, provide for your power users.
† Go for aggregates that do not unduly increase the overall usage of storage. Look care-
fully into larger aggregates with low sparsity percentages.
† Keep the aggregates hidden from the end-users but be transparent to the end-user
query. That is, it is the query tool that needs to be aware of the aggregates to direct
the queries for proper access.
† Attempt to keep the impact on the data staging process as minimally intensive as
possible.
Practical Suggestions Before doing any calculations to determine the types of aggre-
gates needed for your data warehouse environment, spend a good deal of time on determin-
ing the nature of the common queries. How do your users normally report results? What are
the reporting levels? By stores? By months? By product categories? Go through the dimen-
sions, one by one, and review the levels of the hierarchies. Check if there are multiple hier-
archies within the same dimension. If so, find out which of these multiple hierarchies are
more important. In each dimension, ascertain which attributes are used for grouping the
fact table metrics. The next step is to determine which of these attributes are used in combi-
nations and what the most common combinations are.
Once you determine the attributes and their possible combinations, look at the number of
values for each attribute. For example, in a hotel chain schema, assume that hotel is at the
lowest level and city is at the next higher level in the hotel dimension. Let us say there
are 25,000 values for hotel and 15,000 values for city. Clearly, there is no big advantage
of aggregating by cities. On the other hand, if city has only 500 values, then city is a
level at which you may consider aggregation. Examine each attribute in the hierarchies
within a dimension. Check the values for each of the attributes. Compare the values of attri-
butes at different levels of the same hierarchy and decide which ones are strong candidates to
participate in aggregation.
AGGREGATE FACT TABLES 271
303.
Develop a listof attributes that are useful candidates for aggregation, then work out the
combinations of these attributes to come up with your first set of multi-way aggregate fact
tables. Determine the derived dimension tables you need to support these aggregate fact
tables. Go ahead and implement these aggregate fact tables as the initial set.
Bear in mind that aggregation is a performance tuning mechanism. Improved query per-
formance drives the need to summarize, so do not be too concerned if your first set of aggre-
gate tables do not perform perfectly. Your aggregates are meant to be monitored and revised
as necessary. The nature of the bulk of the query requests is likely to change. As your users
become more adept at using the data warehouse, they will devise new ways of grouping and
analyzing data. So what is the practical advice? Do your preparatory work. Start with a
reasonable set of aggregate tables, and continue to make adjustments as necessary.
FAMILIES OF STARS
When you look at a single STAR schema with its fact table and the surrounding dimension
tables, you know that is not the extent of a data warehouse. Almost all data warehouses con-
tain multiple STAR schema structures. Each STAR serves a specific purpose to track the
measures stored in the fact table. When you have a collection of related STAR schemas,
you may call the collection a family of STARS. Families of STARS are formed for various
reasons. You may form a family by just adding aggregate fact tables and the derived dimen-
sion tables to support the aggregates. Sometimes, you may create a core fact table containing
facts interesting to most users and customized fact tables for specific user groups. Many
factors lead to the existence of families of STARS. First, look at the example provided in
Figure 11-16.
The fact tables of the STARS in a family share dimension tables. Usually, the time dimen-
sion is shared by most of the fact tables in the group. In the above example, all three fact
tables are likely to share the time dimension. Going the other way, dimension tables from
multiple STARS may share the fact table of one STAR.
FACT
TABLE
DIMENSION
TABLE
DIMENSION
TABLE
DIMENSION
TABLE
DIMENSION
TABLE
DIMENSION
TABLE
DIMENSION
TABLE
FACT
TABLE
FACT
TABLE
DIMENSION
TABLE
DIMENSION
TABLE
Figure 11-16 Family of STARS.
272 DIMENSIONAL MODELING: ADVANCED TOPICS
304.
If you arein a business like banking or telephone services, it makes sense to capture indi-
vidual transactions as well as snapshots at specific intervals. You may then use families of
STARS consisting of transaction and snapshot schemas. If you are in a manufacturing com-
pany or a similar production-type enterprise, your company needs to monitor the metrics
along the value chain. Some other institutions are like a medical center, where value is
added not in a chain but at different stations within the enterprise. For these enterprises,
the family of STARS supports the value chain or the value circle. We will get into details
in the next few sections.
Snapshot and Transaction Tables
Let us review some basic requirements of a telephone company. A number of individual
transactions make up a telephone customer’s account. Many of the transactions occur
during the hours of 6:00 a.m. to 10:00 p.m. of the customer’s day. More transactions
happen during the holidays and weekends for residential customers. Institutional customers
use the phones on weekdays rather than over the weekends. A telephone company
accumulates a very large collection of rich transaction data that can be used for many
types of valuable analysis. The telephone company needs a schema capturing transaction
data that supports strategic decision making for expansions, new service improvements,
and so on. This transaction schema answers questions such as how does the revenue of
peak hours over the weekends and holidays compare with peak hours over weekdays.
In addition, the telephone company needs to answer questions from the customers as to
account balances. The customer service departments are constantly bombarded with ques-
tions on the status of individual customer accounts. At periodic intervals, the accounting
department may be interested in the amounts expected to be received by the middle of
next month. What are the outstanding balances for which bills will be sent this month-
end? For these purposes, the telephone company needs a schema to capture snapshots
at periodic intervals. Figure 11-17 shows the snapshot and transaction fact tables for a
Time Key
Account Key
Transaction Key
District Key
Trans Reference
Account Number
Amount
TELEPHONE
TRANSACTION
FACT TABLE
STATUS
Status Key
…………...
ACCOUNT
Account Key
…………...
DISTRICT
District Key
…………...
TIME
Time Key
…………...
Time Key
Account Key
Status Key
Transaction Count
Ending Balance
TELEPHONE
SNAPSHOT
FACT TABLE
TRANSACTION
Transaction Key
…………...
Figure 11-17 Snapshot and transaction tables.
FAMILIES OF STARS 273
305.
telephone company. Makea note of the attributes in the two fact tables. One table tracks the
individual phone transactions. The other table holds snapshots of individual accounts at
specific intervals. Also, notice how dimension tables are shared between two fact tables.
Snapshots and transaction tables are also common for banks. For example, an ATM trans-
action table stores individual ATM transactions. This fact table keeps track of individual
transaction amounts for the customer accounts. The snapshot table holds the balance for
each account at the end of each day. The two tables serve two distinct functions. From the
transaction table, you can perform various types of analysis of the ATM transactions. The
snapshot table provides total amounts held at periodic intervals showing the shifting and
movement of balances.
Financial data warehouses also require snapshot and transaction tables because of the
nature of the analysis in these cases. The first set of questions for these warehouses relates
to the transactions affecting given accounts over a certain period of time. The other set of
questions centers around balances in individual accounts at specific intervals or totals of
groups of accounts at the end of specific periods. The transaction table answers the questions
of the first set; the snapshot table handles the questions of the second set.
Core and Custom Tables
Consider two types of businesses that are apparently dissimilar. First take the case of a bank.
A bank offers a large variety of services all related to finance in one form or another. Most of
the services are different from one another. The checking account service and the savings
account service are similar in most ways. But the savings account service does not resemble
the credit card service in any way. How do you track these dissimilar services?
Next, consider a manufacturing company producing a number of heterogeneous products.
Although a few factors may be common to the various products, by and large the factors
differ. What must you do to get information about heterogeneous products?
A different type of the family of STARS satisfies the requirements of these companies. In
this type of family, all products and services connect to a core fact table and each product or
service relates to individual custom tables. In Figure 11-18, you will see the core and custom
tables for a bank. Note how the core fact table holds the metrics that are common to all types
of accounts. Each custom fact table contains the metrics specific to that line of service. Also
note the shared dimension and notice how the tables form a family of STARS.
Supporting Enterprise Value Chain or Value Circle
In a manufacturing business, a product travels through various steps, starting off as raw
materials and ending as finished goods in the warehouse inventory. Usually, the steps
include addition of ingredients, assembly of materials, process control, packaging, and ship-
ping to the warehouse. From finished goods inventory, a product moves into shipments to
distributor, distributor inventory, distributor shipment, retail inventory, and retail sales. At
each step, value is added to the product. Several operational systems support the flow through
these steps. The whole flow forms the supply chain or the value chain. Similarly, in an insur-
ance company, the value chain may include a number of steps from sales of insurance
through issuance of policy and then finally claims processing. In this case, the value
chain relates to the service.
If you are in one of these businesses, you need to track important metrics at different steps
along the value chain. You create STAR schemas for the significant steps and the complete
274 DIMENSIONAL MODELING: ADVANCED TOPICS
306.
set of relatedschemas forms a family of STARS. You define a fact table and a set of corre-
sponding dimensions for each important step in the chain. If your company has multiple
value chains, then you have to support each chain with a separate family of STARS.
A supply chain or a value chain runs in a linear fashion beginning with a certain step and
ending at another step with many steps in between. Again, at each step, value is added. In
some other kinds of businesses where value gets added to services, similar linear movements
do not exist. For example, consider a health care institution where value gets added to patient
service from different units almost as if they form a circle around the service. We perceive a
value circle in such organizations. The value circle of a large health maintenance organiz-
ation may include hospitals, clinics, doctor’s offices, pharmacies, laboratories, government
agencies, and insurance companies. Each of these units either provides patient treatments or
measures patient treatments. Patient treatment by each unit may be measured in different
metrics. But most of the units would analyze the metrics using the same set of conformed
dimensions such as time, patient, health care provider, treatment, diagnosis, and payer.
For a value circle, the family of STARS comprises multiple fact tables and a set of conformed
dimensions.
Conforming Dimensions
While exploring families of STARS, you will have noticed that dimensions are shared among
fact tables. Dimensions form common links between STARS. For dimensions to be con-
formed, you have to deliberately make sure that common dimensions may be used between
two of more STARS. If the product dimension is shared between two fact tables of sales and
inventory, then the attributes of the product dimension must have the same meaning in
relation to each of the two fact tables. Figure 11-19 shows a set of conformed dimensions.
Time Key
Account Key
Branch Key
Household Key
Balance
Fees Charged
Transactions
BRANCH
Branch Key
…………...
ACCOUNT
Account Key
…………...
TIME
Time Key
…………...
Account Key
Deposits
Withdrawals
Interest Earned
Balance
Service Charges
HOUSEHOLD
Household Key
…………...
Account Key
ATM Trans.
Drive-up Trans.
Walk-in Trans.
Deposits
Checks Paid
Overdraft
BANK CORE FACT TABLE
SAVINGS CUSTOM
FACT TABLE
CHECKING CUSTOM
FACT TABLE
Figure 11-18 Core and custom tables.
FAMILIES OF STARS 275
307.
The order andshipment fact tables share the conformed dimensions of product, date, cus-
tomer, and salesperson. A conformed dimension is a comprehensive combination of attri-
butes from the source systems after resolving all discrepancies and conflicts. For example,
a conformed product dimension must truly reflect the master product list of the enterprise
and must include all possible hierarchies. Each attribute must be of the correct data type
and must have proper lengths and constraints.
Conforming dimensions is a basic requirement in a data warehouse. Pay special attention
and take the necessary steps to conform all your dimensions. This is a major responsibility
of the project team. Conformed dimensions allow roll ups across data marts. User interfaces
will be consistent irrespective of the type of query. Result sets of queries will be consistent
across data marts. Of course, a single conformed dimension can be used against multiple
fact tables.
Standardizing Facts
In addition to the task of conforming dimensions is the requirement to standardize facts. We
have seen that fact tables work across STAR schemas. Review the following issues relating
to the standardization of fact table attributes:
† Ensure the same definitions and terminology across data marts.
† Resolve homonyms and synonyms.
† Types of facts to be standardized include revenue, price, cost, and profit margin.
† Guarantee that the same algorithms are used for any derived units in each fact table.
† Make sure each fact uses the right unit of measurement.
Product Key
Date Key
Customer Key
Salesperson Key
Order Dollars
Cost Dollars
Margin Dollars
Sale Units
ORDER
CUSTOMER
SALESPERSON
PRODUCT
DATE
Customer Key
……………….
Salesperson Key
………………...
Date Key
………………...
Product Key
……………...
Product Key
Date Key
Customer Key
Salesperson Key
Channel Key
Ship-to Key
Ship-from Key
Invoice Number
Order Number
Ship Date
Arrival Date
SHIPMENT
CHANNEL
Channel Key
………………...
SHIP-TO
Ship-to Key
………………...
SHIP-FROM
Ship-from Key
………………...
CONFORM
ED
DIM
ENSIONS
Figure 11-19 Conformed dimensions.
276 DIMENSIONAL MODELING: ADVANCED TOPICS
308.
Summary of Familyof STARS
Let us end our discussion of the family of STARS with a comprehensive diagram showing
a set of standardized fact tables and conformed dimension tables. Study Figure 11-20 care-
fully. Note the aggregate fact tables and the corresponding derived dimension tables. What
types of aggregates are these? Which are the base fact tables? Notice the shared dimensions.
Are these conformed dimensions? See how the various fact tables and the dimension tables
are related.
CHAPTER SUMMARY
† Slowly changing dimensions may be classified into three different types based on the
nature of the changes. Type 1 relates to corrections, type 2 to preservation of history,
and type 3 to soft revisions. Applying each type of revision to the data warehouse is
different.
† Large dimension tables such as customer or product need special considerations for
applying optimizing techniques.
† “Snowflaking” or creating a snowflake schema is a method of normalizing the STAR
schema. Although some conditions justify the snowflake schema, it is generally not
recommended.
† Miscellaneous flags and textual data are thrown together in one table called a junk
dimension table.
Date Key
Account Key
Branch Key
Balance
BRANCH
Branch Key
Branch Name
State
Region
ACCOUNT
Account Key
…………...
DATE
Date Key
Date
Month
Year
Account Key
ATM Trans.
Other Trans.
STATE
State Key
State
Region
Date Key
Account Key
State Key
Balance
MONTH
Month Key
Month
Year
Month Key
Account Key
State Key
Balance
2-WAY AGGREGATE
1-WAY AGGREGATE
BANK CORE TABLE
CHECKING CUSTOM TABLE
Figure 11-20 A comprehensive family of STARS.
CHAPTER SUMMARY 277
309.
† Aggregate orsummary tables improve performance. Formulate a strategy for building
aggregate tables.
† A set of related STAR schemas make up a family of STARS. Examples are snapshot
and transaction tables, core and custom tables, and tables supporting a value chain or a
value circle. A family of STARS relies on conformed dimension tables and standar-
dized fact tables.
REVIEW QUESTIONS
1. Describe slowly changing dimensions. What are the three types? Explain each type very
briefly.
2. Compare and contrast type 2 and type 3 slowly changing dimensions.
3. Can you treat rapidly changing dimensions in the same way as type 2 slowly changing
dimensions? Discuss.
4. What are junk dimensions? Are they necessary in a data warehouse?
5. How does a snowflake schema differ from a STAR schema? Name two advantages and
two disadvantages of the snowflake schema.
6. Differentiate between slowly and rapidly changing dimensions.
7. What are aggregate fact tables? Why are they needed? Give an example.
8. Describe with examples snapshot and transaction fact tables. How are they related?
9. Give an example of a value circle. Explain how a family of STARS can support a value
circle.
10. What is meant by conforming the dimension? Why is this important in a data
warehouse?
EXERCISES
1. Indicate if true or false:
A. Type 1 changes for slowly changing dimensions relate to correction of errors.
B. To apply type 3 changes of slowly changing dimensions, overwrite the attribute value
in the dimension table row with the new value.
C. Large dimensions usually have multiple hierarchies.
D. The STAR schema is a normalized version of the snowflake schema.
E. Aggregates are precalculated summaries.
F. The percentage of sparsity of the base table tends to be higher than that of aggregate
tables.
G. The fact tables of the STARS in a family share dimension tables.
H. Core and custom fact tables are useful for companies with several lines of service.
I. Conforming dimensions is not absolutely necessary in a data warehouse.
J. A value circle usually needs a family of STARS to support the business.
278 DIMENSIONAL MODELING: ADVANCED TOPICS
310.
2. Assume youare in the insurance business. Find two examples of type 2 slowly changing
dimensions in that business. As an analyst on the project, write the specifications for
applying the type 2 changes to the data warehouse with regard to the two examples.
3. You are the data design specialist on the data warehouse project team for a retail com-
pany. Design a STAR schema to track the sales units and sales dollars with three dimen-
sion tables. Explain how you will decide to select and build four two-way aggregates.
4. As the data designer for an international bank, consider the possible types of snapshot
and transaction tables. Complete the design of one snapshot and one transaction table.
5. For a manufacturing company, design a family of three STARS to support the value
chain.
EXERCISES 279
312.
CHAPTER 12
DATA EXTRACTION,TRANSFORMATION,
AND LOADING
CHAPTER OBJECTIVES
† Survey broadly all the various aspects of the data extraction, transformation, and
loading (ETL) functions
† Examine the data extraction function, its challenges, its techniques, and learn how to
evaluate and apply the techniques
† Discuss the wide range of tasks and types of the data transformation function
† Understand the meaning of data integration and consolidation
† Perceive the importance of the data load function and probe the major methods for
applying data to the warehouse
† Gain a true insight into why ETL is crucial, time consuming, and arduous
You may be convinced that the data in your organization’s operational systems is totally
inadequate for providing information for strategic decision making. As information techno-
logy professionals, we are fully aware of the futile attempts in the past decades to provide
strategic information from operational systems. These attempts did not work. Data warehous-
ing had begun to fulfill that pressing need for strategic information.
Mostly, the information contained in a warehouse flows from the same operational sys-
tems that could not be directly used to provide strategic information. What constitutes the
difference between the data in the source operational systems and the information in the
data warehouse? It is the set of functions that fall under the broad group of data extraction,
transformation, and loading (ETL).
ETL functions reshape the relevant data from the source systems into useful information
to be stored in the data warehouse. Without these functions, there would be no strategic infor-
mation in the data warehouse. If the source data is not extracted correctly, cleansed, and
Data Warehousing Fundamentals for IT Professionals, Second Edition. By Paulraj Ponniah
Copyright # 2010 John Wiley Sons, Inc.
281
313.
integrated in theproper formats, query processing and delivery of business intelligence, the
backbone of the data warehouse, could not happen.
In Chapter 2, when we discussed the building blocks of the data warehouse, we briefly
looked at ETL functions as part of the data staging area. In Chapter 6 we revisited ETL func-
tions and examined how the business requirements drive these functions as well. Further, in
Chapter 8, we explored the hardware and software infrastructure options to support the data
movement functions. Why, then, is additional review of ETL necessary?
ETL functions form the prerequisites for the data warehouse information content. ETL
functions rightly deserve more consideration and discussion. In this chapter, we will
delve deeper into issues relating to ETL functions. We will review many significant activities
within ETL. In the next chapter, we need to continue the discussion by studying another
important function that falls within the overall purview of ETL—data quality. Now, let us
begin with a general overview of ETL.
ETL OVERVIEW
If you recall our discussion of the functions and services of the technical architecture of the
data warehouse, you will see that we divided the environment into three functional areas.
These areas are data acquisition, data storage, and information delivery. Data extraction,
data transformation, and data loading encompass the areas of data acquisition and data sto-
rage. These are back-end processes that cover the extraction of data from the source systems.
Next, they include all the functions and procedures for changing the source data into the
exact formats and structures appropriate for storage in the data warehouse database. After
the transformation of the data, these processes consist of all the functions for physically
moving the data into the data warehouse repository.
Data extraction, of course, precedes all other functions. But what is the scope and extent
of the data you will extract from the source systems? Do you not think that the users of your
data warehouse are interested in all of the operational data for some type of query or analysis?
So, why not extract all of the operational data and dump it into the data warehouse? This
seems to be a straightforward approach. However, the approach for data extraction is
driven by the user requirements. Your requirements definition should guide you as to
what data you need to extract and from which source systems. Avoid creating a data junk-
house by dumping all the available data from the source systems and waiting to see what
the users will do with it. Data extraction presupposes a selection process. Select the
needed data based on the user requirements.
The extent and complexity of the back-end processes differ from one data warehouse to
another. If your enterprise is supported by a large number of operational systems running on
several computing platforms, the back-end processes in your case would be extensive and
possibly complex as well. So, in your situation, data extraction becomes quite challenging.
The data transformation and data loading functions may also be equally difficult. Moreover,
if the quality of the source data is below standard, this condition further aggravates the back-
end processes. In addition to these challenges, if only a few of the loading methods are feas-
ible for your situation, then data loading could also be difficult. Let us get into specifics about
the nature of the ETL functions.
Most Important and Most Challenging
Each of the ETL functions fulfills a significant purpose. When you want to convert data from
the source systems into business information to be stored in the data warehouse, each of these
282 DATA EXTRACTION, TRANSFORMATION, AND LOADING
314.
functions is essential.For changing data into information you first need to capture the data.
After you capture the data, you cannot simply dump that data into the data warehouse and
call it strategic information. You have to subject the extracted data to all manner of transform-
ations so that the data will be fit to be converted into strategic information. Once you have
transformed the data, it is still not useful to the end-users until it is moved to the data ware-
house repository. Data loading is an essential function. You must perform all three functions
of ETL for successfully transforming data into strategic information or business intelligence.
Take as an example an analysisyour user wantsto perform. The user wantsto compare and
analyze sales by store, by product, and by month. The sales figures are available in the several
sales applications in your company. Also, you have a product master file. Further, each sales
transaction refers to a specific store. All these are pieces of data in the source operational sys-
tems. For doing the analysis, you have to provide information about the sales in the data ware-
house database. You have to provide the sales units and dollars in afact table, the products in a
product dimension table, the stores in a store dimension table, and months in atime dimension
table. How do you do this? Extract the datafrom each of the operational systems, reconcile the
variations in data representations among the source systems, and transform all the sales of all
the products. Then load the sales into the fact and dimension tables. Now, after completion of
these three functions, the extracted data is sitting in the data warehouse, transformed into stra-
tegic information, ready for delivery as business intelligence for analysis. Notice that it is
important for each function to be performed, and performed in sequence.
ETL functions are challenging primarily because of the nature of the source systems. Most
of the challenges in ETL arise from the disparities among the source operational systems.
Review the following list of reasons for the types of difficulties in ETL functions. Consider
each carefully and relate it to your environment so that you may find proper resolutions.
† Source systems are very diverse and disparate.
† There is usually a need to deal with source systems on multiple platforms and different
operating systems.
† Many source systems are older legacy applications running on obsolete database
technologies.
† Generally, historical data on changes in values are not preserved in source operational
systems. Historical information is critical in a data warehouse.
† Quality of data is dubious in many old source systems that have evolved over time.
† Source system structures keep changing over time because of new business conditions.
ETL functions must also be modified accordingly.
† Gross lack of consistency among source systems is prevalent. Same data is likely to be
represented differently in the various source systems. For example, data on salary may
be represented as monthly salary, weekly salary, and bimonthly salary in different
source payroll systems.
† Even when inconsistent data is detected among disparate source systems, lack of a
means for resolving mismatches escalates the problem of inconsistency.
† Most source systems do not represent data in types or formats that are meaningful to the
users. Many representations are cryptic and ambiguous.
Time Consuming and Arduous
When the project team designs the ETL functions, tests the various processes, and deploys
them, you will find that these consume a very high percentage of the total project effort. It is
ETL OVERVIEW 283
315.
not uncommon fora project team to spend as much as 50% to 70% of the project effort
on ETL functions. You have already noted several factors that add to the complexity of
the ETL functions.
Data extraction itself can be quite involved depending on the nature and complexity of the
source systems. The metadata on the source systems must contain information on every data-
base and every data structure that are needed from the source systems. You need very
detailed information, including database size and volatility of the data. You have to know
the time window during each day when you can extract data without impacting use of the
operational systems. You also need to determine the mechanism for capturing the changes
to data in each of the relevant source systems. These are strenuous and time-consuming
activities.
Activities within the data transformation function can run the gamut of transformation
methods. You have to reformat internal data structures, resequence data, apply various
forms of conversion techniques, supply default values wherever values are missing, and
you must design the whole set of aggregates that are needed for performance improvement.
In many cases, you need to convert from EBCDIC to ASCII formats.
Now turn your attention to the data loading function. The sheer massive size of the initial
loading can populate millions of rows in the data warehouse database. Creating and mana-
ging load images for such large numbers are not easy tasks. Even more difficult is the task of
testing and applying the load images to actually populate the physical files in the data ware-
house. Sometimes, it may take two or more weeks to complete the initial physical loading.
With regard to extracting and applying the ongoing incremental changes, there are several
difficulties. Finding the proper extraction method for individual source datasets can be ardu-
ous. Once you settle on the extraction method, finding a time window to apply the changes to
the data warehouse can be tricky if your data warehouse cannot suffer long downtimes.
ETL REQUIREMENTS AND STEPS
Before we highlight some key issues relating to ETL, let us review the functional steps. For
initial bulk refresh as well as for the incremental data loads, the sequence is simply as noted
here: triggering for incremental changes, filtering for refreshes and incremental loads, data
extraction, transformation, integration, cleansing, and applying to the data warehouse
database.
What are the major steps in the ETL process? Look at the list shown in Figure 12-1. Each
of these major steps breaks down into a set of activities and tasks. Use this figure as a guide to
come up with a list of steps for the ETL process of your data warehouse.
The following list enumerates the types of activities and tasks that compose the ETL
process. This list is by no means complete for every data warehouse, but it gives a good
insight into what is involved to complete the ETL process.
Plan for aggregate fact tables.
Determine data transformation and cleansing rules.
Establish comprehensive data extraction rules.
Prepare data mapping for target data elements from sources.
Integrate all the data sources, both internal and external.
Determine all the target data needed in the data warehouse.
284 DATA EXTRACTION, TRANSFORMATION, AND LOADING
316.
Combine several sourcedata structures into a single row in the target database of the data
warehouse.
Split one source data structure into several structures to go into several rows of the target
database.
Read data from data dictionaries and catalogs of source systems.
Read data from a variety of file structures including flat files, indexed files (VSAM), and
legacy system databases (hierarchical/network).
Load details for populating atomic fact tables.
Aggregate for populating aggregate or summary fact tables.
Transform data from one format in the source platform to another format in the target
platform.
Derive target values for input fields (example: age from date of birth).
Change cryptic values to values meaningful to the users (example: 1 and 2 to male and
female).
Key Factors
Before we move on, let us point out a couple of key factors. The first relates to the complexity
of the data extraction and transformation functions. The second is about the data loading
function.
Remember that the primary reason for the complexity of the data extraction and trans-
formation functions is the tremendous diversity of the source systems. In a large enterprise,
we could have a bewildering combination of computing platforms, operating systems,
database management systems, network protocols, and source legacy systems. You need
to pay special attention to the various sources and begin with a complete inventory of the
source systems. With this inventory as a starting point, work out all the details of data extrac-
tion. The difficulties encountered in the data transformation function also relate to the
heterogeneity of the source systems.
Determine all the target data needed in the data warehouse.
Determine all the data sources, both internal and external.
Prepare data mapping for target data elements from sources.
Establish comprehensive data extraction rules.
Determine data transformation and cleansing rules.
Plan for aggregate tables.
Organize data staging area and test tools.
Write procedures for all data loads.
ETL for dimension tables.
ETL for fact tables.
Figure 12-1 Major steps in the ETL process.
ETL REQUIREMENTS AND STEPS 285
317.
Now, turning yourattention to the data loading function, you have a number of issues to
be careful about. Usually, the mass refreshes, whether for initial load or for periodic
refreshes, cause difficulties, not so much because of complexities, but because these load
jobs run too long. You will have to find the proper time to schedule these full refreshes.
Incremental loads have some other types of difficulties. First, you have to determine the
best method to capture the ongoing changes from each source system. Next, you have to exe-
cute the capture without impacting the source systems. After that, at the other end, you have
to schedule the incremental loads without impacting use of the data warehouse by the users.
Pay special attention to these key issues while designing the ETL functions for your
data warehouse. Now let us take each of the three ETL functions, one by one, and study
the details.
DATA EXTRACTION
As an IT professional, you must have participated in data extractions and conversions when
implementing operational systems. When you went from a VSAM file-oriented order entry
system to a new order processing system using relational database technology, you may have
written data extraction programs to capture data from the VSAM files to get the data ready for
populating the relational database.
Two major factors differentiate the data extraction for a new operational system from the
data extraction for a data warehouse. First, for a data warehouse, you have to extract data from
many disparate sources. Next, for a data warehouse, you have to extract data on the changes
for ongoing incremental loads as well as for a one-time initial full load. For operational sys-
tems, all you need is one-time extractions and data conversions.
These two factors increase the complexity of data extraction for a data warehouse and,
therefore, warrant the use of third-party data extraction tools in addition to in-house programs
or scripts. Third-party tools are generally more expensive than in-house programs, but they
record their own metadata. On the other hand, in-house programs increase the cost of main-
tenance and are hard to maintain as source systems change. If your company is in an industry
where frequent changes to business conditions are the norm, then you may want to minimize
the use of in-house programs. Third-party tools usually provide built-in flexibility. All you
have to do is to change the input parameters for the third-party tool you are using.
Effective data extraction is a key to the success of your data warehouse. Therefore, you
need to pay special attention to the issues and formulate a data extraction strategy for
your data warehouse. Here is a list of data extraction issues:
† Source identification—identify source applications and source structures.
† Method of extraction—for each data source, define whether the extraction process is
manual or tool-based.
† Extraction frequency—for each data source, establish how frequently the data extrac-
tion must be done: daily, weekly, quarterly, and so on.
† Time window—for each data source, denote the time window for the extraction
process.
† Job sequencing—determine whether the beginning of one job in an extraction job
stream has to wait until the previous job has finished successfully.
† Exception handling—determine how to handle input records that cannot be extracted.
286 DATA EXTRACTION, TRANSFORMATION, AND LOADING
318.
Source Identification
Let usconsider the first of the above issues, namely, source identification. We will deal with
the other issues later as we move through the remainder of this chapter. Source identification,
of course, encompasses the identification of all the proper data sources. It does not stop with
just the identification of the data sources. It goes beyond that to include examination and veri-
fication that the identified sources will provide the necessary value to the data warehouse. Let
us walk through the source identification process in some detail.
Assume that a part of your database, maybe one of your data marts, is designed to provide
strategic information on the fulfillment of orders. For this purpose, you need to store histori-
cal information about the fulfilled and pending orders. If you ship orders through multiple
delivery channels, you need to capture data about these channels. If your users are interested
in analyzing the orders by the status of the orders as the orders go through the fulfillment
process, then you need to extract data on the order statuses.
In the fact table for order fulfillment, you need attributes about the total order amount,
discounts, commissions, expected delivery time, actual delivery time, and dates at different
stages of the process. You need dimension tables for product, order disposition, delivery
channel, and customer. First, you have to determine if you have source systems to provide
you with the data needed for this data mart. Then, from the source systems, you have to estab-
lish the correct data source for each data element in the data mart. Further, you have to go
through a verification process to ensure that the identified sources are really the right ones.
Figure 12-2 describes a stepwise approach to source identification for order fulfillment.
Source identification is not as simple a process as it may sound. It is a critical first process
in the data extraction function. You need to go through the source identification process
for every piece of information you have to store in the data warehouse. As you might
have already figured out, source identification needs thoroughness, lots of time, and exhaus-
tive analysis.
Data Extraction Techniques
Before examining the various data extraction techniques, you must clearly understand the
nature of the source data you are extracting or capturing. Also, you need to get an insight
into how the extracted data will be used. Source data is in a state of constant flux.
Business transactions keep changing the data in the source systems. In most cases, the
value of an attribute in a source system is the value of that attribute at that time. If you
look at every data structure in the source operational systems, the day-to-day business trans-
actions constantly change the values of the attributes in these structures. When a customer
moves to another state, the data about that customer changes in the customer table in the
source system. When two additional package types are added to the way a product may
be sold, the product data changes in the source system. When a correction is applied to
the quantity ordered, the data about that order gets changed in the source system.
Data in the source systems are said to be time-dependent or temporal. This is because
source data changes with time. The value of a single variable varies over time. Again,
take the example of the change of address of a customer who moves from New York to
California. In the operational system, what is important is that the current address of the
customer has CA as the state code. The actual change transaction itself, stating that the
previous state code was NY and the revised state code is CA, need not be preserved. But
think about how this change affects the information in the data warehouse. If the state
DATA EXTRACTION 287
319.
code is usedfor analyzing some measurements such as sales, the sales to the customer prior
to the change must be counted in New York and those after the move must be counted in
California. In other words, the history cannot be ignored in the data warehouse. This
brings us to the question: how do you capture the history from the source systems? The
answer depends on how exactly data is stored in the source systems. So let us examine
and understand how data is stored in the source operational systems.
Data in Operational Systems These source systems generally store data in two ways.
Operational data in the source system may be thought of as falling into two broad categories.
The type of data extraction technique you have to use depends on the nature of each of these
two categories.
Current Value Most of the attributes in the source systems fall into this category. Here the
stored value of an attribute represents the value of the attribute at this moment of time. The
values are transient or transitory. As business transactions happen, the values change. There
is no way to predict how long the present value will stay or when it will get changed next.
Customer name and address, bank account balances, and outstanding amounts on individual
orders are some examples of this category.
What is the implication of this category for data extraction? The value of an attribute
remains constant only until a business transaction changes it. There is no telling when it
PRODUCT
DATA
ORDER
METRICS
TIME
DATA
DISPOSITION
DATA
DELIVERY
CHANNEL DATA
CUSTOMER
TARGET
SOURCE
Delivery Contracts
Shipment Tracking
Inventory Management
Product
Customer
Order Processing
SOURCE IDENTIFICATION PROCESS
• List each data item of
metrics or facts needed for
analysis in fact tables.
• List each dimension
attribute from all
dimensions.
• For each target data item,
find the source system and
source data item.
• If there are multiple
sources for one data element,
choose the preferred source.
• Identify multiple source
fields for a single target field
and form consolidation rules.
• Identify single source field
for multiple target fields and
establish splitting rules.
• Ascertain default values.
• Inspect source data for
missing values.
Figure 12-2 Source identification: a stepwise approach.
288 DATA EXTRACTION, TRANSFORMATION, AND LOADING
320.
will get changed.Data extraction for preserving the history of the changes in the data
warehouse gets quite involved for this category of data.
Periodic Status This category is not as common as the previous category. In this
category, the value of the attribute is preserved as the status every time a change occurs.
At each of these points in time, the status value is stored with reference to the time when
the new value became effective. This category also includes events stored with reference
to the time when each event occurred. Look at the way data about an insurance policy is
usually recorded in the operational systems of an insurance company. The operational data-
bases store the status data of the policy at each point of time when something in the policy
changes. Similarly, for an insurance claim, each event, such as claim initiation, verification,
appraisal, and settlement, is recorded with reference to the points in time.
For operational data in this category, the history of the changes is preserved in the source
systems themselves. Therefore, data extraction for the purpose of keeping history in the data
warehouse is relatively easier. Whether it is status data or data about an event, the source
systems contain data at each point in time when any change occurred.
Study Figure 12-3 for an understanding of the two categories of data stored in the oper-
ational systems. Pay special attention to the examples.
Having reviewed the categories indicating how data is stored in the operational systems,
we are now in a position to discuss the common techniques for data extraction. When you
deploy your data warehouse, the initial data as of a certain time must be moved to the
data warehouse to get it started. This is the initial load. After the initial load, your data ware-
house must be kept updated so the history of the changes and statuses are reflected in the
EXAMPLES OF ATTRIBUTES
VALUES OF ATTRIBUTES AS STORED IN
OPERATIONAL SYSTEMS AT DIFFERENT DATES
Storing Current Value
Storing Periodic Status
Attribute: Customer’s State of Residence
6/1/2008 Value: OH
9/15/2008 Changed to CA
1/22/2009 Changed to NY
3/1/2009 Changed to NJ
Attribute: Status of Property consigned
to an auction house for sale.
6/1/2008 Value: RE
(property receipted)
9/15/2008 Changed to ES
(value estimated)
1/22/2009 Changed to AS
(assigned to auction)
3/1/2009 Changed to SL
(property sold)
6/1/2008
OH
9/15/2008 1/22/2009 3/1/2009
CA NY NJ
6/1/2008 RE 6/1/2008 RE
9/15/2008 ES
1/22/2009 AS
3/1/2009 SL
6/1/2008 RE
9/15/2008 ES
1/22/2009 AS
6/1/2008 RE
9/15/2008 ES
6/1/2008 9/15/2008 1/22/2009 3/1/2009
Figure 12-3 Data in operational systems.
DATA EXTRACTION 289
321.
data warehouse. Broadly,there are two major types of data extractions from the source
operational systems: “as is” (static) data and data of revisions.
“As is” or static data is the capture of data at a given point in time. It is like taking a snap-
shot of the relevant source data at a certain point in time. For current or transient data, this
capture would include all transient data identified for extraction. In addition, for data cate-
gorized as periodic, this data capture would include each status or event at each point in
time as available in the source operational systems.
You will use static data capture primarily for the initial load of the data warehouse.
Sometimes, you may want a full refresh of a dimension table. For example, assume that
the product master of your source application is completely revamped. In this case, you
may find it easier to do a full refresh of the product dimension table of the target data
warehouse. So, for this purpose, you will perform a static data capture of the product data.
Data of revisions is also known as incremental data capture. Strictly, it is not incremental
data but the revisions since the last time data was captured. If the source data is transient, the
capture of the revisions is not easy. For periodic status data or periodic event data, the incre-
mental data capture includes the values of attributes at specific times. Extract the statuses and
events that have been recorded since the last data extraction.
Incremental data capture may be immediate or deferred. Within the group of immediate
data capture there are three distinct options. Two separate options are available for deferred
data capture.
Immediate Data Extraction In this option, the data extraction is real-time. It occurs as
the transactions happen at the source databases and files. Figure 12-4 shows the immediate
data extraction options.
Now let us go into some details about the three options for immediate data extraction.
SOURCE DATABASES
SOURCE
OPERATIONAL
SYSTEMS
Transaction
Log
Files
Extract
Files from
Source
Systems Output Files
of Trigger
Programs
Trigger
Programs
Source
Data
DBMS
DATA STAGING AREA
OPTION 1:
Capture through
transaction logs
OPTION 2:
Capture through
database triggers
OPTION 3:
Capture in source
applications
Figure 12-4 Options for immediate data extraction.
290 DATA EXTRACTION, TRANSFORMATION, AND LOADING
322.
Capture through TransactionLogs This option uses the transaction logs of the DBMSs
maintained for recovery from possible failures. As each transaction adds, updates, or deletes
a row from a database table, the DBMS immediately writes entries on the log file. This data
extraction technique reads the transaction log and selects all the committed transactions.
There is no extra overhead in the operational systems because logging is already part of
the transaction processing.
You have to make sure that all transactions are extracted before the log file gets refreshed.
As log files on disk storage get filled up, the contents are backed up on other media and the
disk log files are reused. Ensure that all log transactions are extracted for data warehouse
updates.
If all of your source systems are database applications, there is no problem with this
technique. But if some of your source system data is on indexed and other flat files, this
option will not work for these cases. There are no log files for these non-database applications.
You will have to devise some other data extraction technique for these cases.
While we are on the topic of data capture through transaction logs, let us take a side excur-
sion and look at the use of replication. Data replication is simply a method for creating copies
of data in a distributed environment. Figure 12-5 illustrates how replication technology can
be used to capture changes to source data.
The appropriate transaction logs contain all the changes to the various source database
tables. Here are the broad steps for using replication to capture changes to source data:
† Identify the source system database table
† Identify and define target files in the staging area
† Create mapping between the source table and target files
† Define the replication mode
† Schedule the replication process
SOURCE DATABASES
SOURCE
OPERATIONAL
SYSTEMS
Transaction
Log
Files
DBMS
REPLICATION
SERVER
Log Transaction
Manager
Replicated Log
Transactions stored in
Data Staging Area
Source
Data
Figure 12-5 Data extraction using replication technology.
DATA EXTRACTION 291
323.
† Capture thechanges from the transaction logs
† Transfer captured data from logs to target files
† Verify transfer of data changes
† Confirm success or failure of replication
† In metadata, document the outcome of replication
† Maintain definitions of sources, targets, and mappings
Capture through Database Triggers Again, this option is applicable to your source sys-
tems that are database applications. As you know, triggers are special stored procedures (pro-
grams) that are stored on the database and fired when certain predefined events occur. You
can create trigger programs for all events for which you need data to be captured. The output
of the trigger programs is written to a separate file that will be used to extract data for the data
warehouse. For example, if you need to capture all changes to the records in the customer
table, write a trigger program to capture all updates and deletes in that table.
Data capture through database triggers occurs right at the source and is therefore quite
reliable. You can capture both before and after images. However, building and maintaining
trigger programs puts an additional burden on the development effort. Also, execution
of trigger procedures during transaction processing of the source systems puts additional
overhead on the source systems. Further, this option is applicable only for source data in
databases.
Capture in Source Applications This technique is also referred to as application-
assisted data capture. In other words, the source application is made to assist in the data
capture for the data warehouse. You have to modify the relevant application programs
that write to the source files and databases. You revise the programs to write all adds,
updates, and deletes to the source files and database tables. Then other extract programs
can use the separate file containing the changes to the source data.
Unlike the previous two cases, this technique may be used for all types of source data irre-
spective of whether it is in databases, indexed files, or other flat files. But you have to revise
the programs in the source operational systems and keep them maintained. This could be a
formidable task if the number of source system programs is large. Also, this technique may
degrade the performance of the source applications because of the additional processing
needed to capture the changes on separate files.
Deferred Data Extraction In the cases discussed above, data capture takes place while
the transactions occur in the source operational systems. The data capture is immediate or
real-time. In contrast, the techniques under deferred data extraction do not capture the
changes in real time. The capture happens later. Figure 12-6 shows the deferred data extrac-
tion options.
Now let us discuss the two options for deferred data extraction.
Capture Based on Date and Time Stamp Every time a source record is created or
updated it may be marked with a stamp showing the date and time. The time stamp provides
the basis for selecting records for data extraction. Here the data capture occurs at a later time,
not while each source record is created or updated. If you run your data extraction program at
midnight every day, each day you will extract only those with the date and time stamp later
292 DATA EXTRACTION, TRANSFORMATION, AND LOADING
324.
than midnight ofthe previous day. This technique works well if the number of revised
records is small.
Of course, this technique presupposes that all the relevant source records contain date and
time stamps. Provided this is true, data capture based on date and time stamp can work for
any type of source file. This technique captures the latest state of the source data. Any inter-
mediary states between two data extraction runs are lost.
Deletion of source records presents a special problem. If a source record gets deleted in
between two extract runs, the information about the delete is not detected. You can get
around this by marking the source record for delete first, do the extraction run, and then
go ahead and physically delete the record. This means you have to add more logic to the
source applications.
Capture by Comparing Files If none of the above techniques are feasible for specific
source files in your environment, then consider this technique as the last resort. This tech-
nique is also called the snapshot differential technique because it compares two snapshots
of the source data. Let us see how this technique works.
Suppose you want to apply this technique to capture the changes to your product
data. While performing today’s data extraction for changes to product data, you do a full
file comparison between today’s copy of the product data and yesterday’s copy. You also
compare the record keys to find the inserts and deletes. Then you capture any changes
between the two copies.
This technique necessitates the keeping of prior copies of all the relevant source
data. Though simple and straightforward, comparison of full rows in a large file can be
very inefficient. However, this may be the only feasible option for some legacy data sources
that do not have transaction logs or time stamps on source records.
SOURCE DATABASES
SOURCE
OPERATIONAL
SYSTEMS
Today’s
Extract
Extract
Files based
on time-
stamp
Source
Data
DBMS
DATA STAGING AREA
OPTION 1:
Capture based on
date and time
stamp
EXTRACT
PROGRAMS
Yesterday’s
Extract
FILE
COMPARISON
PROGRAMS
Extract
Files based
on file
comparison
OPTION 2:
Capture by
comparing files
Figure 12-6 Options for deferred data extraction.
DATA EXTRACTION 293
325.
Evaluation of theTechniques
To summarize, the following options are available for data extraction:
† Capture of static data
† Capture through transaction logs
† Capture through database triggers
† Capture in source applications
† Capture based on date and time stamp
† Capture by comparing files
You are faced with some big questions. Which ones are applicable in your environment?
Which techniques must you use? You will be using the static data capture technique at least
in one situation when you populate the data warehouse initially at the time of deployment.
After that, you will usually find that you need a combination of a few of these techniques for
your environment. If you have old legacy systems, you may even have the need for the file
comparison method.
Figure 12-7 highlights the advantages and disadvantages of the different techniques.
Study it carefully and use it to determine the techniques you would need to use in your
environment.
Let us make a few general comments. Which of the techniques are easy and inexpensive
to implement? Consider the techniques of using transaction logs and database triggers.
Both of these techniques are already available through the database products. Both are
Capture of static data Capture in source applications
Capture through transaction logs Capture based on date and time stamp
Capture through database triggers Capture by comparing files
Good flexibility for capture specifications.
Performance of source systems not affected.
No revisions to existing applications.
Can be used on legacy systems.
Can be used on file-oriented systems.
Vendor products are used. No internal costs.
Not much flexibility for capture specifications.
Performance of source systems not affected.
No revisions to existing applications.
Can be used on most legacy systems.
Cannot be used on file-oriented systems.
Vendor products are used. No internal costs.
Not much flexibility for capture specifications.
Performance of source systems affected a bit.
No revisions to existing applications.
Cannot be used on most legacy systems.
Cannot be used on file-oriented systems.
Vendor products are used. No internal costs.
Good flexibility for capture specifications.
Performance of source systems affected a bit.
Major revisions to existing applications.
Can be used on most legacy systems.
Can be used on file-oriented systems.
High internal costs because of in-house work.
Good flexibility for capture specifications.
Performance of source systems not affected.
Major revisions to existing applications likely.
Cannot be used on most legacy systems.
Can be used on file-oriented systems.
Vendor products may be used.
Good flexibility for capture specifications.
Performance of source systems not affected.
No revisions to existing applications.
May be used on legacy systems.
May be used on file-oriented systems.
Vendor products are used. No internal costs.
Figure 12-7 Data capture techniques: advantages and disadvantages.
294 DATA EXTRACTION, TRANSFORMATION, AND LOADING
326.
comparatively cheap andeasy to implement. The technique based on transaction logs is
perhaps the most inexpensive. There is no additional overhead on the source operational sys-
tems. In the case of database triggers, there is a need to create and maintain trigger programs.
Even here, the maintenance effort and the additional overhead on the source operational
systems are not that much compared to other techniques.
Data capture in source systems could be the most expensive in terms of development
and maintenance. This technique needs substantial revisions to existing source systems.
For many legacy source applications, finding the source code and modifying it may not
be feasible at all. However, if the source data does not reside on database files and date
and time stamps are not present in source records, this is one of the few available options.
What is the impact on the performance of the source operational systems? Certainly, the
deferred data extraction methods have the least impact on the operational systems. Data
extraction based on time stamps and data extraction based on file comparisons are performed
outside the normal operation of the source systems. Therefore, these two are preferred options
when minimizing the impact on operational systems is a priority. However, these deferred
capture options suffer from some inadequacy. They track the changes from the state of the
source data at the time of the current extraction as compared to its state at the time of the pre-
vious extraction. Any interim changes are not captured. Therefore, wherever you are dealing
with transient source data, you can only come up with approximations of the history.
So, what is the bottom line? Use the data capture technique in source systems sparingly
because it involves too much development and maintenance work. For your source data on
databases, capture through transaction logs and capture through database triggers are
obvious first choices. Between these two, capture through transaction logs is a better
choice because of better performance. Also, this technique is also applicable to nonrelational
databases. The file comparison method is the most time consuming for data extraction. Use it
only if all others cannot be applied.
DATA TRANSFORMATION
By making use of the several techniques discussed in the previous section, you design the
data extraction function. Now the extracted data is raw data and it cannot be applied to
the data warehouse right away. First, all the extracted data must be made usable in the
data warehouse. Having information that is usable for strategic decision making is the under-
lying principle of the data warehouse. You know that the data in the operational systems is
not usable for this purpose. Next, because operational data is extracted from many old legacy
systems, the quality of the data in those systems is less likely to be good enough for the data
warehouse. You have to enrich and improve the quality of the data before it can be usable in
the data warehouse.
Before moving the extracted data from the source systems into the data warehouse, you
inevitably have to perform various kinds of data transformations. You have to transform
the data according to standards because they come from many dissimilar source systems.
You have to ensure that after all the data is put together, the combined data does not violate
any business rules.
Consider the data structures and data elements that you need in your data warehouse. Now
think about all the relevant data to be extracted from the source systems. From the variety of
source data formats, data values, and the condition of the data quality, you know that you
have to perform several types of transformations to make the source data suitable for your
DATA TRANSFORMATION 295
327.
data warehouse. Transformationof source data encompasses a wide variety of manipulations
to change all the extracted source data into usable information to be stored in the data
warehouse.
Many organizations underestimate the extent and complexity of the data transformation
functions. They start out with a simple departmental data mart as the pilot project. Almost
all of the data for this pilot comes from a single source application. The data transformation
just entails field conversions and some reformatting of the data structures. Do not make the
mistake of taking the data transformation functions too lightly. Be prepared to consider all
the different issues and allocate sufficient time and effort to the task of designing the
transformations.
Data warehouse practitioners have attempted to classify data transformations in several
ways, beginning with the very general and broad classifications of simple transformations
and complex transformations. There is also some confusion about the semantics. One prac-
titioner may refer to data integration as the process within the data transformation function
that is some kind of preprocessing of the source data. To another practitioner, data integration
may mean the mapping of the source fields to the target fields in the datawarehouse. Resisting
the temptation to generalize and classify, we will highlight and discuss the common types
of major transformation functions. You may review each type and decide for yourself if
that type is going to be simple or complex in your own data warehouse environment.
One major effort within data transformation is the improvement of data quality. In a
simple sense, this includes filling in the missing values for attributes in the extracted data.
Data quality is of paramount importance in the data warehouse because the effect of strategic
decisions based on incorrect information can be devastating. Therefore, we will discuss data
quality issues extensively in the next chapter.
Data Transformation: Basic Tasks
Irrespective of the variety and complexity of the source operational systems, and regardless
of the extent of your data warehouse, you will find that most of your data transformation
functions break down into a few basic tasks. Let us go over these basic tasks so that you
can view data transformation from a fundamental perspective. Here is the set of basic tasks:
Selection. This takes place at the beginning of the whole process of data transformation.
You select either whole records or parts of several records from the source systems.
The task of selection usually forms part of the extraction function itself. However,
in some cases, the composition of the source structure may not be amenable to selec-
tion of the necessary parts during data extraction. In these cases, it is prudent to extract
the whole record and then do the selection as part of the transformation function.
Splitting/Joining. This task includes the types of data manipulation you need to perform
on the selected parts of source records. Sometimes (uncommonly), you will be split-
ting the selected parts even further during data transformation. Joining of parts
selected from many source systems is more widespread in the data warehouse
environment.
Conversion. This is an all-inclusive task. It includes a large variety of rudimentary
conversions of single fields for two primary reasons—one to standardize among the
data extractions from disparate source systems, and the other to make the fields
usable and understandable to the users.
296 DATA EXTRACTION, TRANSFORMATION, AND LOADING
328.
Summarization. Sometimes youmay find that it is not feasible to keep data at the lowest
level of detail in your data warehouse. It may be that none of your users ever need data
at the lowest granularity for analysis or querying. For example, for a grocery chain,
sales data at the lowest level of detail for every transaction at the checkout may not
be needed. Storing sales by product by store by day in the data warehouse may be
quite adequate. So, in this case, the data transformation function includes summariza-
tion of daily sales by product and by store.
Enrichment. This task is the rearrangement and simplification of individual fields to
make them more useful for the data warehouse environment. You may use one or
more fields from the same input record to create a better view of the data for the
data warehouse. This principle is extended when one or more fields originate from
multiple records, resulting in a single field for the data warehouse.
Major Transformation Types
You have looked at the set of basic transformation tasks. When you consider a particular set
of extracted data structures, you will find that the transformation functions you need to
perform on this set may be done by a combination of the basic tasks discussed.
Now let us consider specific types of transformation functions. These are the most
common transformation types:
Format Revisions. You will come across these quite often. These revisions include
changes to the data types and lengths of individual fields. In your source systems, pro-
duct package types may be indicated by codes and names in which the fields are
numeric and text data types. Again, the lengths of the package types may vary
among the different source systems. It is wise to standardize and change the data
type to text to provide values meaningful to the users.
Decoding of Fields. This is also a common type of data transformation. When you deal
with multiple source systems, you are bound to have the same data items described by
a plethora of field values. The classic example is the coding for gender, with one
source system using 1 and 2 for male and female and another system using M and
F. Also, many legacy systems are notorious for using cryptic codes to represent
business values. What do the codes AC, IN, RE, and SU mean in a customer file?
You need to decode all such cryptic codes and change these into values that make
sense to the users. Change the codes to Active, Inactive, Regular, and Suspended.
Calculated and Derived Values. What if you want to keep profit margin along with sales
and cost amounts in your data warehouse tables? The extracted data from the sales
system contains sales amounts, sales units, and operating cost estimates by product.
You will have to calculate the total cost and the profit margin before data can be
stored in the data warehouse. Average daily balances and operating ratios are examples
of derived fields.
Splitting of Single Fields. Earlier legacy systems stored names and addresses of custo-
mers and employees in large text fields. The first name, middle initials, and last
name were stored as a large text in a single field. Similarly, some earlier systems
stored city, state, and zip code data together in a single field. You need to store indi-
vidual components of names and addresses in separate fields in your data warehouse
for two reasons. First, you may improve the operating performance by indexing on
DATA TRANSFORMATION 297
329.
individual components. Second,your users may need to perform analysis by using
individual components such as city, state, and zip code.
MergingofInformation. Thisisnotquitetheoppositeofsplittingofsinglefields.Thistype
of data transformation does not literally mean the merging of several fields to create a
single field of data. For example, information about a product may come from different
data sources. The product code and description may come from one data source.
The relevant package types may be found in another data source. The cost data may
be from yet another source. In this case, merging of information denotes the combi-
nation of the product code, description, package types, and cost into a single entity.
Character set conversion. This type of data transformation relates to the conversion of
character sets to an agreed standard character set for textual data in the data warehouse.
If you have mainframe legacy systems as source systems, the source data from these
systems will be in EBCDIC characters. If PC-based architecture is the choice for
your data warehouse, then you must convert the mainframe EBCDIC format to the
ASCII format. When your source data is on other types of hardware and operating
systems, you are faced with similar character set conversions.
Conversion of Units of Measurements. Many companies today have global branches.
Measurements in many European countries are in metric units. If your company has
overseas operations, you may have to convert the metrics so that the numbers are all
in one standard unit of measurement.
Date/Time Conversion. This type relates to representation of date and time in standard
formats. For example, the American and the British date formats may be standardized
to an international format. The date of October 11, 2008 is written as 10/11/2008 in
the U.S. format and as 11/10/2008 in the British format. This date may be standar-
dized to be written as 11 OCT 2008.
Summarization. This type of transformation is the creating of summaries to be loaded in
the data warehouse instead of loading the most granular level of data. For example, for
a credit card company to analyze sales patterns, it may not be necessary to store in the
data warehouse every single transaction on each credit card. Instead, you may want to
summarize the daily transactions for each credit card and store the summary data
instead of storing the most granular data by individual transactions.
Key Restructuring. While extracting data from your input sources, look at the primary
keys of the extracted records. You will have to come up with keys for the fact and
dimension tables based on the keys in the extracted records. See Figure 12-8. In the
example shown in the figure, the product code in this organization is structured to
have inherent meaning. If you use this product code as the primary key, there will
be problems. If the product is moved to another warehouse, the warehouse part of
the product key will have to be changed. This is a typical problem with legacy systems.
When choosing keys for your data warehouse database tables, avoid such keys with
built-in meanings. Transform such keys into generic keys generated by the system
itself. This is called key restructuring.
Deduplication. In many companies, the customer files have several records for the same
customer. Mostly, the duplicates are the result of creating additional records by mis-
take. In your data warehouse, you want to keep a single record for one customer
and link all the duplicates in the source systems to this single record. This process
is called deduplication of the customer file. Employee files and, sometimes, product
master files have this kind of duplication problem.
298 DATA EXTRACTION, TRANSFORMATION, AND LOADING
330.
Data Integration andConsolidation
The real challenge of ETL functions is the pulling together of all the source data from many
disparate, dissimilar source systems. Even today, many data warehouses get data extracted
from a combination of legacy mainframe systems and old minicomputer applications, in
addition to newer client/server systems. Most of these source systems do not conform to
the same set of business rules. Very often they follow different naming conventions and
varied standards for data representation. Figure 12-9 shows a typical data source environ-
ment. Notice the challenging issues indicated in the figure.
PRODUCT CODE:
PRODUCTION SYSTEM KEY
Country
Code
Warehouse
Code
Sales
Territory
Product
Number
Sales
Person
DATA WAREHOUSE -- PRODUCT KEY
12345678
12 69
1234
M53
W1
Figure 12-8 Data transformation: key restructuring.
MINI
UNIX
MAINFRAME
*Multiple character sets (EBCDIC/ASCII)*
*Multiple data types* *Missing values*
*No default values* *Multiple naming standards*
*Conflicting business rules* *Incompatible structures*
*Inconsistent values*
Figure 12-9 Typical data source environment.
DATA TRANSFORMATION 299
331.
Integrating the datainvolves combining all the relevant operational data into coherent
data structures to be made ready for loading into the data warehouse. You may want to
think of data integration and consolidation as a type of preprocess before other major trans-
formation routines are applied. You have to standardize the names and data representations
and resolve discrepancies in the ways in which the same data is represented in different
source systems. Although time consuming, many of the data integration tasks can be man-
aged. However, let us go over a couple of more difficult challenges.
Entity Identification Problem If you have three different legacy applications devel-
oped in your organization at different times in the past, you are likely to have three different
customer files supporting those systems. One system may be the old order entry system,
another the customer service support system, and the third the marketing system. A very
large number of the customers will be common to all three files. The same customer on
each of the files may have a unique identification number. These unique identification num-
bers for the same customer may not be the same across the three systems.
This is a problem of identification in which you do not know which of the customer
records relate to the same customer. But in the data warehouse you need to keep a single
record for each customer. You must be able to get the activities of the single customer
from the various source systems and then match up with the single record to be loaded to
the data warehouse. This is a common but very difficult problem in many enterprises
where applications have evolved over time from the distant past. This type of problem is
prevalent where multiple sources exist for the same entities. Vendors, suppliers, employees,
and sometimes products are the kinds of entities that are prone to this type of problem.
In the above example of the three customer files, you have to design complex algorithmsto
matchrecordsfromallthethreefilesandformgroupsofmatchingrecords.Nomatchingalgor-
ithm can completely determine the groups. If the matching criteria are too tight, then some
records will escape the groups. On the other hand, if the matching criteria are too loose, a par-
ticular group may include records of more than one customer. You need to get your users
involved in reviewing the exceptions to the automated procedures. You have to weigh the
issues relating to your source systems and decide how to handle the entity identification pro-
blem. Every time a data extract function is performed for your data warehouse, which may be
every day, do you pause to resolve the entity identification problem before loading the data
warehouse? How will this affect the availability of the data warehouse to your users? Some
companies, depending on their individual situations, take the option of solving the entity
identification problem in two phases. In the first phase, all records, irrespective of whether
theyare duplicates or not, are assigned unique identifiers. The second phase consists of recon-
ciling the duplicates periodically through automatic algorithms and manual verification.
Multiple Sources Problem This is another kind of problem affecting data integration,
although less common and less complex than the entity identification problem. This problem
results from a single data element having more than one source. For example, suppose unit
cost of products is available from two systems. In the standard costing application, cost
values are calculated and updated at specific intervals. Your order processing system also
carries the unit costs for all products. There could be slight variations in the cost figures
from these two systems. From which system should you get the cost for storing in the
data warehouse?
A straightforward solution is to assign a higher priority to one of the two sources and pick
up the product unit cost from that source. Sometimes, a straightforward solution such as this
300 DATA EXTRACTION, TRANSFORMATION, AND LOADING
332.
may not becompatible with the needs of the data warehouse users. You may have to select
from either of the files based on the last update date. Or, in some other instances, your
determination of the appropriate source depends on other related fields.
Transformation for Dimension Attributes
In Chapter 11, we discussed the changes to dimension table attributes. We reviewed the types
of changes to these attributes. Also, we suggested ways to handle the three types of slowly
changing dimensions. Type 1 changes are corrections of errors. These changes are applied
to the data warehouse without any need to preserve history. Type 2 changes preserve the his-
tory in the data warehouse. Type 3 changes are tentative changes where your users need the
ability to analyze the metrics in both ways—with the changes and without the changes.
ln order to apply the changes correctly, you need to transform the incoming changes and
prepare the changes to the data for loading into the data warehouse. Figure 12-10 illustrates
how the data changes extracted from the source systems are transformed and prepared for
data loading. This figure shows the handling of each type of change to dimension tables.
Types 1, 2, and 3 are shown distinctly. Review the figure carefully to get a good grasp of
the solutions. You will be faced with dimension table changes all the time.
How to Implement Transformation
The complexity and the extent of data transformation strongly suggest that manual methods
alone will not be enough. You must go beyond the usual methods of writing conversion
programs when you deployed operational systems. The types of data transformation are
by far more difficult and challenging.
The methods you may want to adopt depend on some significant factors. If you are con-
sidering automating most of the data transformation functions, first consider if you have the
time to select the tools, configure and install them, train the project team on the tools, and
Source System
data changes
for dimensions
Perform data transformation
functions
TYPE 1 TYPE 2 TYPE 3
Convert production key to
existing surrogate key
Perform data cleansing
functions
Consolidate and integrate
data
Determine type of dimension
change
Convert production key to
new surrogate key
Convert production key to
existing surrogate key
Create
load image
Create
load image
Create load image
(include effective date)
Figure 12-10 Transformed for dimension changes.
DATA TRANSFORMATION 301
333.
integrate the toolsinto the data warehouse environment. Data transformation tools can be
expensive. If the scope of your data warehouse is modest, then the project budget may
not have room for transformation tools.
Let us look at the issues relating to using manual techniques and to the use of data trans-
formation tools. In many cases, a suitable combination of both methods will prove to be
effective. Find the proper balance based on the available time frame and the money in the
budget.
Using Transformation Tools In recent years, transformation tools have greatly
increased in functionality and flexibility. Although the desired goal for using transformation
tools is to eliminate manual methods altogether, in practice this is not completely possible.
Even if you get the most sophisticated and comprehensive set of transformation tools, be
prepared to use in-house programs here and there.
Use of automated tools certainly improves efficiency and accuracy. As a data transform-
ation specialist, you just have to specify the parameters, the data definitions, and the rules to
the transformation tool. If your input into the tool is accurate, then the rest of the work is
performed efficiently by the tool.
You gain a major advantage from using a transformation tool because of the recording of
metadata by the tool. When you specify the transformation parameters and rules, these are
stored as metadata by the tool. This metadata then becomes part of the overall metadata com-
ponent of the data warehouse. It may be shared by other components. When changes occur to
transformation functions because of changes in business rules or data definitions, you just
have to enter the changes into the tool. The metadata for the transformations get automati-
cally adjusted by the tool.
Using Manual Techniques This was the predominant method in the early days of data
warehousing when transformation tools began to appear in the market. Manual techniques
may still be adequate for smaller data warehouses. In such cases, manually coded programs
and scripts perform every data transformation. Mostly, these programs are executed in the
data staging area. Analysts and programmers who already possess the knowledge and the
expertise are able to produce the programs and scripts.
Of course, this method involves elaborate coding and testing. Although the initial cost
may be reasonable, ongoing maintenance may escalate the cost. Unlike automated tools,
the manual method is more likely to be prone to errors. It may also turn out that several
individual programs are required in your environment.
A major disadvantage relates to metadata. Automated tools record their own metadata,
but in-house programs have to be designed differently if you need to store and use metadata.
Even if the in-house programs record the data transformation metadata initially, every time
changes occur to transformation rules, the metadata has to be maintained. This puts an
additional burden on the maintenance of manually coded transformation programs.
DATA LOADING
It is generally agreed that transformation functions end as soon as load images are created.
The next major set of functions consists of the ones that take the prepared data, apply it to the
data warehouse, and store it in the database there. You create load images to correspond to
the target files to be loaded in the data warehouse database.
302 DATA EXTRACTION, TRANSFORMATION, AND LOADING
334.
The whole processof moving data into the data warehouse repository is referred to in
several ways. You must have heard the phrases applying the data, loading the data, and
refreshing the data. For the sake of clarity we will use the phrases as indicated below:
Initial load—populating all the data warehouse tables for the very first time.
Incremental load—applying ongoing changes as necessary in a periodic manner.
Full refresh—completely erasing the contents of one or more tables and reloading with
fresh data (initial load is a refresh of all the tables).
Because loading the data warehouse may take an inordinate amount of time, loads are
generally causes for great concern. During the loads, the data warehouse has to be offline.
You need to find a window of time when the loads may be scheduled without affecting
your data warehouse users. Therefore, consider dividing up the whole load process into
smaller chunks and populating a few files at a time. This will give you two benefits. You
may be able to run the smaller loads in parallel. Also, you might be able to keep some
parts of the data warehouse up and running while loading the other parts. It is hard to estimate
the running times of the loads, especially the initial load or a complete refresh. Do test loads
to verify the correctness and to estimate the running times.
When you are running a load, do not expect every record in the source load image file to
be successfully applied to the data warehouse. For the record you are trying to load to the fact
table, the concatenated key may be wrong and not correspond to the dimension tables.
Provide procedures to handle the load images that do not load. Also, have a plan for quality
assurance of the loaded records.
If the data staging area and the data warehouse database are on the same server that will
save you the effort of moving the load images to the data warehouse server. But if you
have to transport the load images to the data warehouse server, consider the options carefully
and select the ones best suited for your environment. The Web, FTP, and database links are a
few of the options. You have to consider the necessary bandwidth needed and also the impact
of the transmissions on the network. Think of data compression and have contingency plans.
What are the general methods for applying data? The most straightforward method is
writing special load programs. Depending on the size of your data warehouse, the number
of load programs can be large. Managing the load runs of a large number of programs
can be challenging. Further, maintaining a large suite of special load programs consumes
a lot of time and effort. Load utilities that come with the DBMSs provide a fast method
for loading. Consider this method as a primary choice. When the staging area files and
the data warehouse repository are on different servers, database links are useful.
You are already aware of some of the concerns and difficulties in data loading. The project
team has to be very familiar with the common challenges so that it can work out proper res-
olutions. Let us now move on to the details of the data loading techniques and processes.
Applying Data: Techniques and Processes
Earlier in this section, we defined three types of application of data to the data warehouse:
initial load, incremental load, and full refresh. Consider how data is applied in each of
these types. Let us take the example of product data. For the initial load, you extract the
data for all the products from the various source systems, integrate and transform the data,
and then create load images for loading the data into the product dimension table. For an
DATA LOADING 303
335.
incremental load, youcollect the changes to the product data for those product records that
have changed in the source systems since the previous extract, run the changes through the
integration and transformation process, and create output records to be applied to the product
dimension table. A full refresh is similar to the initial load.
In every case, you create a file of data to be applied to the product dimension table in the
data warehouse. How can you apply the data to the warehouse? What are the modes? Data
may be applied in the following four different modes: load, append, destructive merge, and
constructive merge. Study Figure 12-11 for an understanding of the effect of applying data in
each of these four modes. Let us explain how each mode works.
Load If the target table to be loaded already exists and data exists in the table, the load pro-
cess wipes out the existing data and applies the data from the incoming file. If the table is
already empty before loading, the load process simply applies the data from the incoming file.
Append You may think of the append as an extension of the load. If data already exists in
the table, the append process unconditionally adds the incoming data, preserving the existing
data in the target table. When an incoming record is a duplicate of an already existing record,
you may define how to handle an incoming duplicate. The incoming record may be allowed
to be added as a duplicate. In the other option, the incoming duplicate record may be rejected
during the append process.
Destructive Merge In this mode, you apply the incoming data to the target data. If the
primary key of an incoming record matches with the key of an existing record, update the
matching target record. If the incoming record is a new record without a match with any
existing record, add the incoming record to the target table.
Key Data
123 AAAAA
234 BBBBB
345 CCCCC
DATA
STAGING
Key Data
123 AAAAA
234 BBBBB
345 CCCCC
DATA
STAGING
Key Data
123 AAAAA
234 BBBBB
345 CCCCC
DATA
STAGING
Key Data
123 AAAAA
234 BBBBB
345 CCCCC
DATA
STAGING
BEFORE
AFTER
Key Data
555 PPPPP
666 QQQQ
777 HHHH
WAREHOUSE
Key Data
123 AAAAA
234 BBBBB
345 CCCCC
WAREHOUSE
Load
Key Data
111 PPPPP
WAREHOUSE
Key Data
111 PPPPP
123 AAAAA
234 BBBBB
345 CCCCC
WAREHOUSE
Append Destructive
Merge
Key Data
123 PPPPP
WAREHOUSE
Key Data
123 AAAAA*
123 PPPPP
234 BBBBB
345 CCCCC
WAREHOUSE
Key Data
123 PPPPP
WAREHOUSE
Key Data
123 AAAAA
234 BBBBB
345 CCCCC
WAREHOUSE
Constructive
Merge
Figure 12-11 Modes of applying data.
304 DATA EXTRACTION, TRANSFORMATION, AND LOADING
336.
Constructive Merge Thismode is slightly different from the destructive merge. If the
primary key of an incoming record matches with the key of an existing record, leave the exist-
ing record, add the incoming record, and mark the added record as superseding the old
record.
Let us now consider how these modes of applying data to the data warehouse fit into the
three types of loads. We will discuss these one by one.
Initial Load Let us say you are able to load the whole data warehouse in a single run. As a
variation of this single run, let us say you are able to split the load into separate subloads and
run each of these subloads as single loads. In other words, every load run creates the database
tables from scratch. In these cases, you will be using the load mode discussed above.
If you need more than one run to create a single table, and your load runs for a single table
must be scheduled to run on several days, then the approach is different. For the first run
of the initial load of a particular table, use the load mode. All further runs will apply the
incoming data using the append mode.
Creation of indexes on initial loads or full refreshes requires special consideration. Index
creation on mass loads can be too time consuming. So drop the indexes prior to the loads to
make the loads go quicker. You may rebuild or regenerate the indexes when the loads are
complete.
Incremental Loads These are the applications of ongoing changes from the source sys-
tems. Changes to the source systems are always tied to specific times, irrespective of whether
or not they are based on explicit time stamps in the source systems. Therefore, you need a
method to preserve the periodic nature of the changes in the data warehouse.
Let us review the constructive merge mode. In this mode, if the primary key of an incom-
ing record matches with the key of an existing record, the existing record is left in the target
table as is and the incoming record is added and marked as superseding the old record. If the
time stamp is also part of the primary key or if the time stamp is included in the comparison
between the incoming and the existing records, then constructive merge may be used to pre-
serve the periodic nature of the changes. This is an oversimplification of the exact details of
how constructive merge may be used. Nevertheless, the point is that the constructive merge
mode is an appropriate method for incremental loads. The details will have to be worked out
based on the nature of the individual target tables.
Are there cases in which the mode of destructive merge may be applied? What about a
type 1 slowly changing dimension? In this case, the change to a dimension table record is
meant to correct an error in the existing record. The existing record must be replaced by
the corrected incoming record, so you may use the destructive merge mode. This mode is
also applicable to any target tables where the historical perspective is not important.
Full Refresh This type of application of data involves periodically rewriting the entire
data warehouse. Sometimes, you may also do partial refreshes to rewrite only specific
tables. Partial refreshes are rare because every dimension table is intricately tied to the
fact table.
As far as the data application modes are concerned, full refresh is similar to the initial
load. However, in the case of full refreshes, data exists in the target tables before incoming
data is applied. The existing data must be erased before applying the incoming data. Just as in
the case of the initial load, the load and append modes are applicable to full refresh.
DATA LOADING 305
337.
Data Refresh VersusUpdate
After the initial load, you may maintain the data warehouse and keep it up to date by using
two methods:
Update—application of incremental changes in the data sources. Refresh—complete
reload at specified intervals.
Technically, refresh is a much simpler option than update. To use the update option, you
have to devise the proper strategy to extract the changes from each data source. Then you
have to determine the best strategy to apply the changes to the data warehouse. The refresh
option simply involves the periodic replacement of complete data warehouse tables. But
refresh jobs can take a long time to run. If you have to run refresh jobs every day, you
may have to keep the data warehouse down for unacceptably long times. The case worsens
if your database has large tables.
Is there some kind of a guideline as to when refresh is better than update or vice versa?
Figure 12-12 shows a graph comparing refresh with update. The cost of refresh remains con-
stant irrespective of the number of changes in the source systems. If the number of changes
increases, the time and effort for doing a full refresh remain the same. On the other hand, the
cost of update varies with the number of records to be updated.
If the number of records to be updated falls between 15% and 25% of the total number of
records, the cost of loading per record tends to be the same whether you opt for a full refresh
of the entire data warehouse or to do the updates. This range is just a general guide. If more
than 25% of the source records change daily, then seriously consider full refreshes.
Generally, data warehouse administrators use the update process. Occasionally, you may
want to redo the data warehouse with a full refresh when some major restructuring or similar
mass changes take place.
Procedure for Dimension Tables
In a data warehouse, dimension tables contain attributes that are used to analyze basic
measurements such as sales and costs. As you know very well, customer, product, time,
UPDATE
REFRESH
% OF RECORDS CHANGED
COST
15% to 25%
After the initial load, the data warehouse is
kept up-to-date by
REFRESH - complete reload at specified intervals
UPDATE - application of incremental changes
Figure 12-12 Refresh versus update.
306 DATA EXTRACTION, TRANSFORMATION, AND LOADING
338.
and sales territoryare examples of dimension tables. The procedure for maintaining the
dimension tables includes two functions: first, the initial loading of the tables; thereafter,
applying the changes on an ongoing basis. Let us consider two issues.
The first one is about the keys of the records in the source systems and the keys of the
records in the data warehouse. For reasons discussed earlier, we do not use the production
system keys for the records in the data warehouse. In the data warehouse, you use system-
generated keys. The records in the source systems have their own keys. Therefore, before
source data can be applied to the dimension tables, whether for the initial load or for ongoing
changes, the production keys must be converted to the system-generated keys in the dataware-
house. You may do the key conversion as part of the transformation functions or you may do it
separately before the actual load functions. The separate key translation system is preferable.
The next issue relates to the application of the type 1, type 2, and type 3 dimension
changes to the data warehouse. Figure 12-13 shows how these different types are handled.
Fact Tables: History and Incremental Loads
The key of the fact table is the concatenation of the keys of the dimension tables. Therefore,
for this reason, dimension records are loaded first. Then, before loading each fact table
record, you have to create the concatenated key for the fact table record from the keys of
the corresponding dimension records.
Here are some tips for history loads of the fact tables:
† Identify historical data useful and interesting for the data warehouse.
† Define and refine extract business rules.
† Capture audit statistics to tie back to the operational systems.
† Perform fact table surrogate key look-up.
† Improve fact table content.
† Restructure the data.
† Prepare the load files.
Source System
data changes
for dimensions
Transform and prepare for
loading in Staging area
Determine if rows exist for
this surrogate key
Match changed values with
existing dimension values
Matches
exactly? YES NO
ACTION
Matches
exactly? NO
Overwrite
old value
Create a new
dimension record
Push down changed value to
“old” attribute field
TYPE 3
TYPE 2
TYPE 1
PART OF
LOAD
PROCESS
Figure 12-13 Loading changes to dimension tables.
DATA LOADING 307
339.
Given below area few useful remarks about incremental loads for fact tables:
† Incremental extracts for fact tables
† Consist of new transactions
† Consist of update transactions
† Use database transaction logs for data capture
† Incremental loads for fact tables
† Load as frequently as feasible
† Use partitioned files and indexes
† Apply parallel processing techniques
ETL SUMMARY
By now you should be fully convinced that the data extraction, transformation, and loading
functions for a data warehouse cover very wide ground. The conversion functions normally
associated with the development of any operational system bear no comparison to the extent
and complexity of the ETL functions in a data warehouse environment. The data extraction
function in a data warehouse spans several, varied source systems. As a data warehouse
developer, you need to carefully examine the challenges the variety of your source systems
pose and find appropriate data extraction methods. We have discussed most of the common
methods. Data extraction for a data warehouse is not a one-time event; it is an ongoing
function carried out at very frequent intervals.
There are many types of data transformation in a data warehouse with many different
tasks. It is not just a field-to-field conversion. In our discussion, we considered many
common types of data transformation. The list of types we were able to consider is by no
means exhaustive or complete. In your data warehouse environment, you will come
across additional types of data transformation.
What about the data loads in a data warehouse in comparison with the loads for a new
operational system? For the implementation of a new operational system, you convert and
load the data once to get the new system started. Loading of data in a data warehouse
does not cease with the initial implementation. Just like extraction and transformation,
data loading is not just an initial activity to get the data warehouse started. Apart from the
initial data load, you have the ongoing incremental data loads and the periodic full refreshes.
Fortunately, many vendors have developed powerful tools for data extraction, data trans-
formation, and data loading. You are no longer left to yourself to handle these challenges
with unsophisticated manual methods. You have flexible and suitable vendor solutions.
Vendor tools cover a wide range of functional options. You have effective tools to perform
functions in every part of the ETL process. Tools can extract data from multiple sources,
perform scores of transformation functions, and do mass loads as well as incremental
loads. Let us review some of the options you have with regard to ETL tools.
ETL Tool Options
Vendors have approached the challenges of ETL and addressed them by providing tools
falling into the following three broad functional categories:
1. Data transformation engines. These consist of dynamic and sophisticated data
manipulation algorithms. The tool suite captures data from a designated set of
308 DATA EXTRACTION, TRANSFORMATION, AND LOADING
340.
source systems atuser-defined intervals, performs elaborate data transformations,
sends the results to a target environment, and applies the data to target files. These
tools provide you with maximum flexibility for pointing to various source systems,
to select the appropriate data transformation methods, and to apply full loads and
incremental loads. The functionality of these tools sweeps the full range of the ETL
process.
2. Data capture through replication. Most of these tools use the transaction recovery
logs maintained by the DBMS. The changes to the source systems captured in the
transaction logs are replicated in near real time to the data staging area for further pro-
cessing. Some of the tools provide the ability to replicate data through the use of data-
base triggers. These specialized stored procedures in the database signal the
replication agent to capture and transport the changes.
3. Code generators. These are tools that directly deal with the extraction, transform-
ation, and loading of data. The tools enable the process by generating program code
to perform these functions. Code generators create 3GL/4GL data extraction and
transformation programs. You provide the parameters of the data sources and the
target layouts along with the business rules. The tools generate most of the program
code in some of the common programming languages. When you want to add more
code to handle the types of transformation not covered by the tool, you may do so
with your own program code. The code automatically generated by the tool has
exits at which points you may add your code to handle special conditions.
Currently, several DBMS vendors include ETL capabilities in their database products at
little or no extra cost. This option is attractive to many organizations because of the cost
implications. Also, if ETL and database functionalities come from the same vendor, support
issues are minimized.
More specifically, what can the ETL tools do? Review the following list and as you read
each item consider if you need that feature in the ETL tool for your environment:
† Data extraction from various relational databases of leading vendors
† Data extraction from old legacy databases, indexed files, and flat files
† Data transformation from one format to another with variations in source and target
fields
† Performing of standard conversions, key reformatting, and structural changes
† Provision of audit trails from source to target
† Application of business rules for extraction and transformation
† Combining of several records from the source systems into one integrated target record
† Recording and management of metadata
Reemphasizing ETL Metadata
Chapter 9 covered data warehouse metadata in great detail. We discussed the role and
importance of metadata in the three major functional areas of the data warehouse. We
reviewed the capture and use of metadata in the three areas of data acquisition, data storage,
and information delivery. Metadata in data acquisition and data storage relate to the ETL
functions.
ETL SUMMARY 309
341.
When you usevendor tools for performing part or all of the ETL functions, most of these
tools record and manage their own metadata. Even though the metadata is in the proprietary
formats of the tools, it is usable and available. ETL metadata contains information about the
source systems, mappings between source data and data warehouse target data structures,
data transformations, and data loading.
But as you know, your selected tools may not exclusively perform all of the ETL func-
tions. You will have to augment your ETL effort with in-house programs. In each of the
data extraction, data transformation, and data loading functions, you may use programs writ-
ten by the project team. Depending on the situation in your environment, these in-house pro-
grams may vary considerably in number. Although in-house programs give you more control
and flexibility, there is one drawback. Unlike using ETL tools, in-house programs do not
record or manage metadata. You have to make a special effort to deal with metadata.
Although we have reviewed metadata extensively in the earlier chapter, we want to reiterate
that you need to pay special attention and ensure that metadata is not overlooked when you
use in-house programs for ETL functions. All the business rules, source data information,
source-to-target mappings, transformation, and loading information must be recorded manu-
ally in the metadata directory. This is extremely important to make your metadata component
complete and accurate.
ETL Summary and Approach
Let us summarize the functions covered in this chapter with Figure 12-14. Look at the figure
and do a quick review of the major functions.
What do you think of the size of this chapter and the topics covered? If nothing else, the
length of the chapter alone highlights the importance and complexity of the data extraction,
DATA EXTRACTION
Extraction from heterogeneous
source systems and outside
sources.
DATA TRANSFORMATION
Conversion and restructuring
according to transformation
rules.
DATA INTEGRATION
Combining all related data
from various sources based on
source-to-target mapping.
DATA SUMMARIZATION
Creating aggregate datasets
based on predefined
procedures.
METADATA UPDATES
Maintain and use metadata for
Extraction, Transformation,
and Load functions.
DATA CLEANSING
Scrubbing and enriching
according to cleansing
rules.
INITIAL DATA LOADING
Apply initial data in large
volumes to the
warehouse.
ONGOING LOADING
Apply ongoing incremental
loads and periodic refreshes to
the warehouse.
Figure 12-14 ETL summary.
310 DATA EXTRACTION, TRANSFORMATION, AND LOADING
342.
transformation, and loadingfunctions. Why so? Again and again, the variety and hetero-
geneous nature of the source systems comes to the forefront as the pressing reason to pay
special attention to ETL. For one thing, the variety and heterogeneity add to the challenge
of data extraction. But when you consider the number of different source systems, the
more there are, the more intense and complex will be the transformation functions. More
inconsistencies are likely to be present and more variations from standards are expected.
Nevertheless, what is required is a systematic and practical approach. Whenever you can
break down a task into two, do so without hesitation. For example, look for ways to break
down the initial load into several subloads. Additionally, detailed analysis is crucial. You
cannot take any source system lightly. Every source system may pose its own challenges.
Get down to the details. Spend enough time in the source-to-target mappings. Make an initial
list of data transformations and let this list evolve. Do more analysis and add to the list.
You have to live with data loads every day. Frequent incremental loads are absolutely
essential to keep your data warehouse up to date. Try to automate as much of incremental
loading as possible. Keep in-house programming down to a reasonable level. Manual main-
tenance of metadata could impose a large burden. We realize ETL functions are time con-
suming, complex, and arduous; nevertheless, they are very important. Any flaws in the
ETL process show up in the data warehouse. Your users will end up using faulty information.
What kind of decisions do you think they will make with incorrect and incomplete
information?
OTHER INTEGRATION APPROACHES
After considering all that was discussed in this chapter about data extraction, transforming,
and loading, you can appreciate that ETL is a leading methodology for enterprise data inte-
gration. At the heart of ETL is the consolidation of enterprise data from, perhaps, many dis-
parate sources. Nevertheless, as companies progress in information integration to provide a
single unified corporate view, there are other integration approaches to be considered.
We will now review two leading approaches for information integration without getting
too much into technical details. We will also compare each of these approaches to ETL in
order to help you make choices in your own particular environment. The two other
approaches are commonly known as Enterprise Information Integration (EII) and
Enterprise Application Integration (EAI).
Enterprise Information Integration (EII)
This approach to integration is based on configuring and providing a unified view of dis-
persed corporate data. However, the integration is not physical but virtual. EII products
strive to provide a virtual business view of dispersed data. The various collections of dispa-
rate data sources are deemed to be an information federation. The collections may include
business transaction data, a data mart, and even some set of unstructured data content. EII
supports an information federation approach to integration.
Applications needing to access data virtually see the dispersed data sets as though they all
reside in a single database. A query is directed against a virtual view of the required data that
may reside in various sources. EII products break the query down into subqueries. Each sub-
query is directed to the appropriate data set. When all the subqueries finish execution, the
results are combined into a unified result and presented to the user. Relational DBMS and
OTHER INTEGRATION APPROACHES 311
343.
XML technologies aredriving the implementation of EII tools. These EII products support
SQL and XML data interfaces.
EII compared to ETL
† EII may be applicable to a federated data warehouse; but a federated architecture
is almost always not recommended for a new data warehouse. EII, therefore, is not
generally a total substitute for ETL.
† When using ETL to capture and consolidate data, some latency is to be expected.
However, if the operational data is highly volatile and real-time querying and analysis
is absolutely essential, then EII may be considered as an option.
† Querying through EII implies data access to current operational systems as well as to
historical data. If self-service business intelligence is opened up to unknown or less-
trained users, erratic queries through EII may cause severe system degradation in oper-
ational systems.
† In cases where data volumes are too large for consolidation and only a fraction of the
consolidated data is used regularly, retrieval and data consolidation using ETL may not
be justified. EII may prove to be a viable alternative.
† Data transformation as part of ETL may sometimes be extremely complex. In these
situations, complex data transformations of EII on the fly may result in very high
system overhead.
† ETL enables the building of historical data over time in a systematic manner. Wherever
historical trends and patterns are the focus of business intelligence, EII may not be the
approach of choice.
Enterprise Application Integration (EAI)
In this approach, integration takes the form of linking application systems by allowing them
to exchange data, messages, and transactions. A specific application may access the required
data transparently without knowing the format of how the data is stored or where the data is
stored. By its very nature, EAI is generally applied to real-time transaction processing in an
operational system.
So, how does EAI fare as an integration approach? EAI may be used to move data
from a real-time event to other data integration approaches such as ETL. EAI is designed
to transport small amounts of data in real-time. Any data transformation in EAI is rudimen-
tary. This approach is not meant for vast amounts of data retrieval, transformation, and
delivery.
EAI compared to ETL
† First, EAI cannot be regarded as an integration approach competing with ETL. The
two approaches may be combined to complement each other. EAI can be used as an
input-producing mechanism for ETL; ETL may be considered as a service mechanism
for EAI.
† Wherever ETL applications require low-latency data, EAI may be used to provide the
EAI-to-ETL interface for real-time data extraction and consolidation.
312 DATA EXTRACTION, TRANSFORMATION, AND LOADING
344.
† Although adynamic EAI-to-ETL interface is desirable, most organizations are using
EAI to create data sets that are subsequently input into ETL applications.
CHAPTER SUMMARY
† ETL functions in a data warehouse are most important, challenging, time consuming,
and labor intensive.
† Data extraction is complex because of the disparate source systems; data transformation
is difficult because of the wide range of tasks; data loading is challenging because of
the volume of data.
† Several data extraction techniques are available, each with its advantages and
disadvantages. Choose the right technique based on the conditions in your
environment.
† The data transformation function encompasses data conversion, cleansing, consolida-
tion, and integration. Implement the transformation function using a combination of
specialized tools and in-house developed software.
† The data loading function relates to the initial load, regular periodic incremental loads,
and full refreshes from time to time. Four methods to apply data are: load, append,
destructive merge, and constructive merge.
† Tools for ETL functions fall into three broad functional categories: data transformation
engines, data capture through replication, and code generators.
† Enterprise Information Integration (EII) and Enterprise Application Integration (EAI)
are some other approaches to data integration.
REVIEW QUESTIONS
1. Give three reasons why you think ETL functions are most challenging in a data
warehouse environment.
2. Name any five types of activities that are part of the ETL process. Which of these are
time consuming?
3. The tremendous diversity of the source systems is the primary reason for their
complexity. Do you agree? If so, explain briefly why.
4. What are the two general categories of data stored in source operational systems? Give
two examples for each.
5. Name five types of the major transformation tasks. Give an example for each.
6. Describe briefly the entity identification problem in data integration and consolidation.
How do you resolve this problem?
7. What is key restructuring? Explain why it is needed.
8. Define initial load, incremental load, and full refresh.
REVIEW QUESTIONS 313
345.
9. Explain thedifference between destructive merge and constructive merge for applying
data to the data warehouse repository. When do you use these modes?
10. When is a full data refresh preferable to an incremental load? Can you think of an
example?
EXERCISES
1. Match the columns:
1. constructive merge
2. full refresh
3. character set conversion
4. derived value
5. immediate data extract
6. initial load
7. file comparison method
8. data enrichment
9. Type 1 dimension changes
10. code generator
A. use static data capture
B. EBCDIC to ASCII
C. technique of last resort
D. overwrite old value with new
E. record supersedes
F. average daily balance
G. complete reload
H. make data more useful
I. create extraction program
J. real-time data capture
2. As the ETL expert on the data warehouse project team for a telecommunications com-
pany, write a memo to your project leader describing the types of challenges in your
environment, and suggest some practical steps to meet the challenges.
3. Your project team has decided to use the system logs for capturing the updates from the
source operational systems. You have to extract data for the incremental loads from four
operational systems all running on relational databases. These are four types of sales
applications. You need data to update the sales data in the data warehouse. Make assump-
tions and describe the data extraction process.
4. In your organization, assume that customer names and addresses are maintained in three
customer files supporting three different source operational systems. Describe the poss-
ible entity identification problem you are likely to face when you consolidate the custo-
mer records from the three files. Write a procedure outlining how you propose to resolve
the problem.
5. You are the staging area expert on the data warehouse project team for a large toy
manufacturer. Discuss the four modes of applying data to the data warehouse. Select
the modes you want to use for your data warehouse and explain the reasons for your
selection.
314 DATA EXTRACTION, TRANSFORMATION, AND LOADING
346.
CHAPTER 13
DATA QUALITY:A KEY TO SUCCESS
CHAPTER OBJECTIVES
† Clearly understand why data quality is critical in a data warehouse
† Observe the challenges posed by corrupt data and learn the methods to deal with them
† Appreciate the benefits of quality data
† Review the various categories of data quality tools and examine their usage
† Study the implications of a data quality initiative and learn practical tips on data quality
† Review Master Data Management (MDM) and check its applicability to data quality in
the data warehouse
Imagine a small error, seemingly inconsequential, creeping into one of your operational
systems. While collecting data in that operational system about customers, let us say the user
consistently entered erroneous region codes. The sales region codes of the customers are all
messed up, but in the operational system, the accuracy of the region codes may not be that
important because no invoices to the customers are going to be mailed out using region
codes. These region codes were entered for marketing purposes.
Now take the customer data to the next step and move it into the data warehouse. What is
the consequence of this error? All analyses performed by your data warehouse users based
on region codes will result in serious misrepresentation. An error that seems to be so irrele-
vant in the operational systems can cause gross distortion in the results from the data ware-
house. This example may not appear to be the true state of affairs in many data warehouses,
but you will be surprised to learn how common these kinds of problems really are. Poor data
quality in the source systems results in poor decisions by the users of the business intelli-
gence from the data warehouse.
Data Warehousing Fundamentals for IT Professionals, Second Edition. By Paulraj Ponniah
Copyright # 2010 John Wiley Sons, Inc.
315
347.
Dirty data isamong the top reasons for failure of a data warehouse. As soon as the users
sense that the data is of unacceptable quality, they lose their confidence in the data ware-
house. They will flee from the data warehouse in droves and all the effort of the project
team will be down the drain. It will be impossible to get back the trust of the users.
Most companies overestimate the quality of the data in their operational systems. Very
few organizations have procedures and systems in place to verify the quality of data in
their various operational systems. As long as the quality of the data is acceptable enough
to perform the functions of the operational systems, then the general conclusion is that all
of the enterprise data is good. For some companies that are building data warehouses,
data quality is not a high priority. These companies suspect that there may be a problem,
but that it is not so pressing as to demand immediate attention.
Only when companies make an effort to ascertain the quality of their data are they amazed
at the extent of data corruption. Even when companies discover a high level of data pollution,
they tend to underestimate the effort needed to cleanse the data. They do not allocate suffi-
cient time and resources for the clean-up effort. At best, the problem is addressed partially
and intermittently.
If your enterprise has several disparate legacy systems from which your data warehouse
must draw its data, start with the assumption that your source data is likely to be corrupt.
Then ascertain the level of the data corruption. The project team must allow enough time
and effort and have a plan for correcting the polluted data. In this chapter, we will define
data quality in the context of the data warehouse. We will consider the common types of
data quality problems so that when you analyze your source data, you can identify the
types and deal with them. We will explore the methods for data cleansing and also review
the features of the tools available to assist the project team in this crucial undertaking.
WHY IS DATA QUALITY CRITICAL?
Data quality in a data warehouse is critical (this sounds so obvious and axiomatic), more so
than in an operational system. Strategic decisions made on the basis of business intelligence
from the data warehouse are likely to be more far reaching in scope and consequences. Let us
list some reasons why data quality is critical. Consider the following observations. Improved
data quality:
† boosts confidence in decision making.
† enables better customer service.
† increases opportunity to add better value to the services.
† reduces risk from disastrous decisions.
† reduces costs, especially of marketing campaigns.
† enhances strategic decision making.
† improves productivity by streamlining processes.
† avoids compounding the effects of data contamination.
What Is Data Quality?
As an IT professional, you have heard of data accuracy quite often. Accuracy is associated
with a data element. Consider an entity such as customer. The customer entity has attributes
316 DATA QUALITY: A KEY TO SUCCESS
348.
such as customername, customer address, customer state, customer lifestyle, and so on. Each
occurrence of the customer entity refers to a single customer. Data accuracy, as it relates to
the attributes of the customer entity, means that the values of the attributes of a single occur-
rence accurately describe the particular customer. The value of the customer name for a
single occurrence of the customer entity is actually the name of that customer. Data quality
implies data accuracy, but it is much more than that. Most cleansing operations concentrate
on just data accuracy. You need to go beyond data accuracy.
If the data is fit for the purpose for which it is intended, we can then say such data has
quality. Therefore, data quality is to be related to the usage for the data item as defined by
the users. Does the data item in an entity reflect exactly what the user is expecting to observe?
Does the data item possess fitness of purpose as defined by the users? If it does, the data item
conforms to the standards of data quality. Examine Fig. 13-1. This figure brings out the dis-
tinction between data accuracy and data quality.
What is considered to be data quality in operational systems? If the database records con-
form to the field validation edits, then we generally say that the database records are of good
data quality. But such single field edits alone do not constitute data quality.
Data quality in a data warehouse is not just the quality of individual data items but the
quality of the full, integrated system as a whole. It is more than the data edits on individual
fields. For example, while entering data about the customers in an order entry application,
you may also collect the demographics of each customer. The customer demographics are
not directly germane to the order entry application and, therefore, they are not given too
much attention. But you run into problems when you try to access the customer demo-
graphics in the data warehouse. The customer data as an integrated whole lacks data quality.
Figure 13-1 is just a clarification of the distinction between data accuracy and data quality.
But how can you specifically define data quality? Can you know intuitively whether a data
element is of high quality or not by examining it? If so, what kind of examination do you
conduct, and how do you examine the data? As IT professionals, having worked with
DATA INTEGRITY DATA QUALITY
Specific instance of an entity
accurately represents that occurrence
of the entity.
Data element defined in terms of
database technology.
Data element conforms to validation
constraints.
Individual data items have the correct
data types.
Traditionally relates to operational
systems.
The data item is exactly fit for the
purpose for which the business users
have defined it.
Wider concept grounded in the specific
business of the company.
Relates not just to single data elements
but to the system as a whole.
Form and content of data elements
consistent across the whole system.
Essentially needed in a corporate-wide
data warehouse for business users.
Figure 13-1 Data accuracy versus data quality.
WHY IS DATA QUALITY CRITICAL? 317
349.
data in ourassignments, we have a sense of what corrupt data is and how to tell whether a
data element is of high data quality or not. But a vague concept of data quality is not adequate
to deal with data corruption effectively. So, let us get into some concrete ways of recognizing
data quality in the data warehouse.
The following list is a survey of the characteristics or indicators of high-quality data. We
will start with data accuracy, as discussed earlier. Study each of these data quality dimen-
sions and use the list to recognize and measure the data quality in the systems that feed
your data warehouse,
Accuracy. The value stored in the system for a data element is the right value for that
occurrence of the data element. If you have a customer name and an address stored
in a record, then the address is the correct address for the customer with that name.
If you find the quantity ordered as 1000 units in the record for order number
12345678, then that quantity is the accurate quantity for that order.
Domain Integrity. The data value of an attribute falls in the range of allowable, defined
values. The common example is the allowable values being “male” and “female” for
the gender data element.
Data Type. Value for a data attribute is actually stored as the data type defined for that
attribute. When the data type of the store name field is defined as “text,” all instances
of that field contain the store name shown in textual format and not numeric codes.
Consistency. The form and content of a data field is the same across multiple source sys-
tems. If the product code for product ABC in one system is 1234, then the code for this
product is 1234 in every source system.
Redundancy. The same data must not be stored in more than one place in a system. If, for
reasons of efficiency, a data element is intentionally stored in more than one place in a
system, then the redundancy must be clearly identified and verified.
Completeness. There are no missing values for a given attribute in the system. For
example, in a customer file, there must be a valid value for the “state” field for
every customer. In the file for order details, every detail record for an order must be
completely filled.
Duplication. Duplication of records in a system is completely resolved. If the product file
is known to have duplicate records, then all the duplicate records for each product are
identified and a cross-reference created.
Conformance to Business Rules. The values of each data item adhere to prescribed
business rules. In an auction system, the hammer or sale price cannot be less than the
reserve price. In a bank loan system, the loan balance must always be positive or zero.
Structural Definiteness. Wherever a data item can naturally be structured into individual
components, the item must contain this well-defined structure. For example, an indi-
vidual’s name naturally divides into first name, middle initial, and last name. Values
for names of individuals must be stored as first name, middle initial, and last name.
This characteristic of data quality simplifies enforcement of standards and reduces
missing values.
Data Anomaly. A field must be used only for the purpose for which it is defined. If the
field Address-3 is defined for any possible third line of address for long addresses, then
this field must be used only for recording the third line of address. It must not be used
for entering a phone or fax number for the customer.
318 DATA QUALITY: A KEY TO SUCCESS
350.
Clarity. A dataelement may possess all the other characteristics of quality data but if the
users do not understand its meaning clearly, then the data element is of no value to the
users. Proper naming conventions help to make the data elements well understood by
the users.
Timely. The users determine the timeliness of the data. lf the users expect customer
dimension data not to be older than one day, the changes to customer data in the
source systems must be applied to the data warehouse daily.
Usefulness. Every data element in the data warehouse must satisfy some requirements of
the collection of users. A data element may be accurate and of high quality, but if it is
of no value to the users, then it is totally unnecessary for that data element to be in the
data warehouse.
Adherence to Data Integrity Rules. The data stored in the relational databases of the
source systems must adhere to entity integrity and referential integrity rules. Any
table that permits null as the primary key does not have entity integrity. Referential
integrity forces the establishment of the parent–child relationships correctly. In a
customer-to-order relationship, referential integrity ensures the existence of a customer
for every order in the database.
Benefits of Improved Data Quality
Everyone generally understands that improved data quality is a critical goal, especially in a
data warehouse. Bad data leads to bad decisions. At this stage, let us review some specific
areas where data quality yields definite benefits.
Analysis with Timely Information Suppose a large retail chain is running daily pro-
motions of many types in most of its 200 stores in the country. This is a major seasonal cam-
paign. Promotion is one of the dimensions stored in the data warehouse. The marketing
department wants to run various analyses using promotion as the primary dimension to
monitor and tune the promotions as the season progresses. It is critical for the department
to perform the analyses every day. Suppose the promotion details are fed into the data ware-
house only once a week. Do you think the promotional data is timely for the marketing
department? Of course not. Is the promotional data in the data warehouse of high quality
for the data warehouse users? Not according to the characteristics of quality data listed in
the previous section. Quality data produces timely information, a significant benefit for
the users.
Better Customer Service The benefit of accurate and complete information for cus-
tomer service cannot be overemphasized. Let us say the customer service representative at
a large bank receives a call. The customer at the other end of the line wants to talk about
the service charge on his checking account. The bank customer service representative
notices a balance of $27.38 in the customer’s checking account. Why is he making a big
fuss about the service charge with almost nothing in the account? But let us say the customer
service representative clicks on the customer’s other accounts and finds that the customer has
$35,000 in his savings accounts and CDs worth more than $120,000. How do you think the
customer service representative will answer the call? Of course, with much respect.
Complete and accurate information improves customer service tremendously.
WHY IS DATA QUALITY CRITICAL? 319
351.
Newer Opportunities Qualitydata in a data warehouse is a great boon for marketing. It
opens the doors to immense opportunities to cross-sell across product lines and departments.
The users can select the buyers of one product and determine all the other products they are
likely to purchase. Marketing departments can conduct well-targeted campaigns. This is just
one example of the numerous opportunities that are made possible by quality data. On the
other hand, if the data is of inferior quality, the campaigns will be failures.
Reduced Costs and Risks What are some of the risks of poor data quality? The
obvious risk is strategic decisions that could lead to disastrous consequences. Other risks
include wasted time, malfunction of processes and systems, and sometimes even legal
action by customers and business partners. One area where quality data reduces costs is in
mailings to customers, especially in marketing campaigns. If the addresses are incomplete,
inaccurate, or duplicated, most of the mailings are wasted.
Improved Productivity Users get an enterprise-wide view of information from the data
warehouse. This is a primary goal of the data warehouse. In areas where a corporate-wide
view of information naturally enables the streamlining of processes and operations, you
will see productivity gains. For example, a company-wide view of purchasing patterns in
a large department store can result in better purchasing procedures and strategies.
Reliable Strategic Decision Making This point is worth repeating. If the data in the
warehouse is reliable and of high quality, then decisions based on the business intelligence
from the data warehouse will be sound. No data warehouse can add value to a business until
the data is clean and of high quality.
Types of Data Quality Problems
As part of the discussion on why data quality is critical in the data warehouse, we have
explored the characteristics of quality data. The characteristics themselves have demon-
strated the critical need for quality data. The discussion of the benefits of having quality
data further strengthens the argument for cleaner data. Our discussion of the critical need
for quality data is not complete until we quickly walk through the types of problems you
are likely to encounter when the data is polluted. Description of the problem types will con-
vince you even more that data quality is of critical importance.
If 4% of the sales amounts are wrong in the billing systems of a $2 billion company, what
is the estimated loss in revenue? $80 million. What happens when a large catalog sales com-
pany mails catalogs to customers and prospects? If there are duplicate records for the same
customer in the customer files, then, depending on how extensive the duplication problem is,
the company will end up sending multiple catalogs to the same person.
In a recent independent survey, businesses with data warehouses were asked the question:
What is the biggest challenge in data warehouse development and usage? Figure 13-2 shows
the ranking of the answers. Nearly half of the respondents rated data quality as their biggest
challenge. Data quality is the biggest challenge not just because of the complexity and extent
of the problem of data pollution. More far-reaching is the effect of polluted data on strategic
decisions made based on such data.
Many of today’s data warehouses get their data feed from old legacy systems. Data in old
systems undergo a decaying process. For example, consider the field for product codes in a
retail chain store. Over the past few decades, the products sold must have changed many
320 DATA QUALITY: A KEY TO SUCCESS
352.
times and inmany variations. The product codes must have been assigned and reassigned a
number of times. The old codes must have decayed and perhaps some of the old codes could
have been reassigned to newer products. This is not a problem in operational systems because
these systems deal with current data. The old codes would have been right at that time in the
past when they were current. But the data warehouse carries historical data and these old
codes could cause problems in this repository.
Let us go over a list of explicit types of data quality problems. These are specific types of
data corruption. This list is by no means exhaustive, but will give you an appreciation of the
need for data quality.
Dummy Values in Fields. Are you aware of the practice of filling the Social Security
number field temporarily with nines to pass the numerical edits? The intention is to
enter the correct Social Security number when the data becomes available later on.
Many times the correction does not happen and you are left with the nines in that
field. Sometimes you may enter 88888 in the zip code field to pass the edit for an
Asian customer or enter 77777 for a European customer.
Absence of Data Values. This is common in customer data. In operational systems, users
are only concerned with the customer data that is needed to mail a billing statement, to
send a follow-up letter, and to make a call about an overdue balance. Not too much
attention is paid to demographic types of data that are not usable in operational sys-
tems. So, you are left with missing values in the demographic types of data that are
very useful for analysis from the data warehouse. Absence of data values is also related
to other types of data elements.
Unofficial Use of Fields. How many times have you asked your users to place their com-
ments in the customer contact field because no field was provided for comments in the
customer record? This is an unofficial use of the customer contact field.
50%
0% 40%
30%
20%
10%
Percentage of Respondents
DATA WAREHOUSE
CHALLENGES
Data Quality
Data Modeling
User Expectations
Data Transformation
Business Rules
Management Expectations
Database Performance
Figure 13-2 Data quality: the top challenge.
WHY IS DATA QUALITY CRITICAL? 321
353.
Cryptic Values. Thisis a prevalent problem in legacy systems, many of which were not
designed with end-users in mind. For example, the customer status codes could have
been started with R ¼ Regular and N ¼ New. Then at one time, another code D ¼
Deceased could have been added. Down the road, a further code A ¼ Archive
could have been included. More recently, the original R and N could have been dis-
carded and R ¼ Remove could have been added. Although this example is contrived
to make a point, such cryptic and confusing values for attributes are not uncommon in
old legacy systems.
Contradicting Values. There are related fields in the source systems in which the values
must be compatible. For example, the values in the fields for state and zip code must
agree. You cannot have a state value of CA (California) and a zip code of 08817 (a zip
code in New Jersey) in the same client record.
Violation of Business Rules. In a personnel and payroll system, an obvious business rule
is that the days worked in a year plus the vacation days, holidays, and sick days cannot
exceed 365 or 366. Any employee record that comes up with the number of days more
than 365 or 366 violates this basic business rule. In a bank loan system, the minimum
interest rate cannot be more than the maximum rate for a variable rate loan.
Reused Primary Keys. Suppose a legacy system has a five-digit primary key field
assigned for the customer record. This field will be adequate as long as the number
of customers is less than 100,000. When the number of customers increases, some
companies resolve the problem by archiving the older customer records and reassign-
ing the key values so that the newer customers are assigned primary key values restart-
ing with 1. This is not really a problem in the operational systems, but in the data
warehouse, where you capture both present data from the current customer file and
the past data from the archived customer file, you have a problem of duplication of
the reused primary key values.
Nonunique Identifiers. There is a different complication with identifiers. Suppose the
accounting systems have their own product codes used as identifiers but they are
different from the product codes used in the sales and inventory systems. Product
code 355 in the sales system may be identified as product code A226 in the accounting
system. Here a unique identifier does not represent the same product in two different
systems.
Inconsistent Values. Codes for policy type in different legacy systems in an expanding
insurance company could have inconsistent values such as A ¼ Auto, H ¼ Home,
F ¼ Flood, W ¼ Workers Comp in one system, and 1, 2, 3, and 4, respectively, in
another system. Another variation of these codes could be AU, HO, FL, and WO,
respectively.
Incorrect Values. Product code: 146, product name: crystal vase, and height: 486 inches
in the same record point to some sort of data inaccuracy. The values for product name
and height are not compatible. Perhaps the product code is also incorrect.
Multipurpose Fields. The same data value in a field entered by different departments may
mean different things. A field could start off as a storage area code to indicate the back-
room storage areas in stores. Later, when the company built its own warehouse to store
products, it used the same field to indicate the warehouse. This type of problem is per-
petuated because store codes and warehouse codes were residing in the same field.
Warehouse codes went into the same field by redefining the store code field. This
type of data pollution is hard to correct.
322 DATA QUALITY: A KEY TO SUCCESS
354.
Erroneous Integration. Inan auction company, buyers are the customers who bid at auc-
tions and buy the items that are auctioned off. The sellers are the customers who sell
their goods through the auction company. The same customer may be a buyer in the
auction system and a seller in the property receipting system. Assume that customer
number 12345 in the auction system is the same customer whose number is 34567
in the property receipting system. The data for customer number 12345 in the auction
system must be integrated with the data for customer number 34567 in the property
receipting system. The reverse side of the data integration problem is this: customer
number 55555 in the auction system and customer number 55555 in the property
receipting system are not the same customer but are different. These integration pro-
blems arise because, typically, each legacy system had been developed in isolation
at different times in the past.
DATA QUALITY CHALLENGES
There is an interesting but strange aspect of the whole data cleansing initiative for the data
warehouse. We are striving toward having clean data in the data warehouse. We want to
ascertain the extent of the pollution. Based on the condition of the data, we plan data cleans-
ing activities. What is strange about this whole set of circumstances is that the pollution of
data occurs outside the data warehouse. As part of the data warehouse project team, you are
taking measures to eliminate the corruption that arises in a place outside your control.
All data warehouses need historical data. A substantial part of the historical data comes
from antiquated legacy systems. Frequently, the end-users use the historical data in the
data warehouse for strategic decision making without knowing exactly what the data
really means. In most cases, detailed metadata hardly exists for the old legacy systems.
You are expected to fix the data pollution problems that emanate from the old operational
systems without the assistance of adequate information about the data there.
Sources of Data Pollution
In order to come up with a good strategy for cleansing the data, it will be worthwhile to
review a list of common sources of data pollution. Why does data get corrupted in the
source systems? Study the following list of data pollution sources against the background
of what data quality really is.
System Conversions. Trace the evolution of order processing in any company. The com-
pany must have started with a file-oriented order entry system in the early 1970s;
orders were entered into flat files or indexed files. There was not much stock verifica-
tion or customer credit verification during the entry of the order. Reports and hard-
copy printouts were used to continue with the process of executing the orders. Then
this system must have been converted into an online order entry system with
VSAM files and IBM’s CICS as the online processing monitor. The next conversion
must have been to a hierarchical database system. Perhaps that is where your order pro-
cessing system still remains, as a legacy application. Many companies have moved the
system forward to a relational database application. In any case, what has happened to
the order data through all these conversions? System conversions and migrations are
prominent reasons for data pollution. Try to understand the conversions gone through
by each of your source systems.
DATA QUALITY CHALLENGES 323
355.
Data Aging. Wehave already dealt with data aging when we reviewed how over the
course of many years the values in the product code fields could have decayed. The
older values lose their meaning and significance. If many of your source systems
are old legacy systems, pay special attention to the possibility of aged data in those
systems.
Heterogeneous System Integration. The more heterogeneous and disparate your source
systems are, the stronger is the possibility of corrupted data. In such a scenario, data
inconsistency is a common problem. Consider the sources for each of your dimension
tables and the fact table. If the sources for one table are several heterogeneous systems,
be cautious about the quality of data coming into the data warehouse from these
systems.
Poor Database Design. Good database design based on sound principles reduces the
introduction of errors. DBMSs provide for field editing. RDBMSs enable verifi-
cation of the conformance to business rules through triggers and stored procedures.
Adhering to entity integrity and referential integrity rules prevents some kinds of
data pollution.
Incomplete Information at Data Entry. At the time of the initial data entry about an
entity, if all the information is not available, two types of data pollution usually
occur. First, some of the input fields are not completed at the time of initial data
entry. The result is missing values. Second, if the unavailable data is mandatory at
the time of the initial data entry, then the person entering the data tries to force generic
values into the mandatory fields. Entering N/A for not available in the field for city is
an example of this kind of data pollution. Similarly, entry of all nines in the Social
Security number field results in data pollution.
Input Errors. In the old days when data entry clerks entered data into computer systems,
there was a second step of data verification. After the data entry clerk finished a batch,
the entries from the batch were independently verified by another person. Now, users
who are also responsible for the business processes enter the data. Data entry is not
their primary vocation. Data accuracy is supposed to be ensured by sight verification
and data edits planted on the input screens. Erroneous entry of data is a major source of
data corruption.
Internationalization/Localization. Because of changing business conditions, the struc-
ture of the business gets expanded into the international arena. The company moves
into wider geographic areas and newer cultures. As a company is internationalized,
what happens to the data in the source systems? The existing data elements must
adapt to newer and different values. Similarly, when a company wants to concentrate
on a smaller area and localize its operations, some of the values for the data elements
get discarded. This change in the company structure and the resulting revisions in the
source systems are also sources of data pollution.
Fraud. Do not be surprised to learn that deliberate attempts to enter incorrect data are not
uncommon. Here, the incorrect data entries are actually falsifications to commit fraud.
Look out for monetary fields and fields containing units of products. Make sure that
the source systems are fortified with tight edits for such fields.
Lack of Policies. In any enterprise, data quality does not just materialize by itself.
Prevention of entry of corrupt data and preservation of data quality in the source sys-
tems are deliberate activities. An enterprise without explicit policies on data quality
cannot be expected to have adequate levels of data quality.
324 DATA QUALITY: A KEY TO SUCCESS
356.
Validation of Namesand Addresses
Almost every company suffers from the problem of duplication of names and addresses. For
a single person, multiple records can exist among the various source systems. Even within a
single source system, multiple records can exist for one person. But in the data warehouse,
you need to consolidate all the activities of each person from the various duplicate records
that exist for that person in the multiple source systems. This type of problem occurs when-
ever you deal with people, whether they are customers, employees, physicians, or suppliers.
Take the specific example of an upscale auction company. Consider the different types of
customers and the different purposes for which the customers seek the services of the auction
company. Customers bring property items for sale, buy at auctions, subscribe to the catalogs
for the various categories of auctions, and bring articles to be appraised by experts for insur-
ance purposes and for estate dissolution. It is likely that there are different legacy systems at
an auction house to service the customers in these different areas. One customer may come
for all of these services and a record gets created for the customer in each of the different
systems. A customer usually comes for the same service many times. On some of these
occasions, it is likely that duplicate records are created for the same customer in one
system. Entry of customer data happens at different points of contact of the customer with
the auction company. If it is an international auction company, entry of customer data hap-
pens at many auction sites worldwide. Can you imagine the possibility for duplication of
customer records and the extent of this form of data corruption?
Name and address data is captured in two ways (see Fig. 13-3). If the data entry is in the
multiple field format, then it is easier to check for duplicates at the time of data entry. Here
are a few inherent problems with entering names and addresses:
† No unique key
† Many names on one line
† One name on two lines
† Name and the address in a single line
† Personal and company names mixed
† Different addresses for the same person
† Different names and spellings for the same customer
Before attempting to deduplicate the customer records, you need to go through a prelimi-
nary step. First, you have to recast the name and address data into the multiple field format.
This is not easy, considering the numerous variations in the way names and addresses are
entered in free-form textual format. After this first step, you have to devise matching algor-
ithms to match the customer records and find the duplicates. Fortunately, many good tools
are available to assist you in the deduplication process.
Costs of Poor Data Quality
Cleansing the data and improving the quality of data takes money and effort. Although data
cleansing is extremely important, you could justify the expenditure of money and effort by
counting the costs of not having or using quality data. You can produce estimates with the
help of the users. They are the ones who can really do estimates because the estimates are
based on forecasts of lost opportunities and possible bad decisions.
DATA QUALITY CHALLENGES 325
357.
The following isa list of categories for which cost estimates can be made. These are broad
categories. You will have to get into the details for estimating the risks and costs for each
category.
† Bad decisions based on routine analysis
† Lost business opportunities because of unavailable or “dirty” data
† Strain and overhead on source systems because of corrupt data causing reruns
† Fines from governmental agencies for noncompliance or violation of regulations
† Resolution of audit problems
† Redundant data unnecessarily using up resources
† Inconsistent reports
† Time and effort for correcting data every time data corruption is discovered
DATA QUALITY TOOLS
Based on our discussions in this chapter so far, you are at a point where you are convinced
about the seriousness of data quality in the data warehouse. Companies have begun to recog-
nize dirty data as one of the most challenging problems in a data warehouse.
You would, therefore, imagine that companies must be investing heavily in data clean-up
operations. But according to experts, data cleansing is still not a very high priority for com-
panies. This attitude is changing as useful data quality tools arrive on the market. You may
choose to apply these tools to the source systems, in the staging area before the load images
are created, or to the load images themselves. Many vendors have begun to provide a type of
data cleansing tool-kit that can be integrated with other tools such as ETL.
Name Address: Dr. Jay A. Harreld, P.O. Box 999,
100 Main Street,
Anytown, NX 12345, U.S.A.
Title: Dr.
First Name: Jay
Middle Initial: A.
Last Name: Harreld
Street Address-1: P.O. Box 999
Street Address-2: 100 Main Street
City: Anytown
State: NX
Zip: 12345
Country Code: U.S.A.
SING
LE
FIELD
FO
RM
AT
M
U
LTIPLE
FIELD
FO
R
M
A
T
Figure 13-3 Data entry: name and address formats.
326 DATA QUALITY: A KEY TO SUCCESS
358.
Categories of DataCleansing Tools
Generally, data cleansing tools assist the project team in two ways. Data error discovery tools
work on the source data to identify inaccuracies and inconsistencies. Data correction tools
help fix the corrupt data. These correction tools use a series of algorithms to parse, transform,
match, consolidate, and correct the data.
Although data error discovery and data correction are two distinct parts of the data cleans-
ing process, most of the tools on the market do a bit of both. The tools have features and
functions that identify and discover errors. The same tools can also perform the cleaning
up and correction of polluted data. In the following sections, we will examine the features
of the two aspects of data cleansing as found in the available tools.
Error Discovery Features
Study the following list of error discovery functions that data cleansing tools are capable of
performing.
† Quickly and easily identify duplicate records.
† Identify data items whose values are outside the range of legal domain values.
† Find inconsistent data.
† Check for range of allowable values.
† Detect inconsistencies among data items from different sources.
† Allow users to identify and quantify data quality problems.
† Monitor trends in data quality over time.
† Report to users on the quality of data used for analysis.
† Reconcile problems of RDBMS referential integrity.
Data Correction Features
The following list describes the typical error correction functions that data cleansing tools are
capable of performing:
† Normalize inconsistent data.
† Improve merging of data from dissimilar data sources.
† Group and relate customer records belonging to the same household.
† Provide measurements of data quality.
† Standardize data elements to common formats.
† Validate for allowable values.
The DBMS for Quality Control
The database management system itself is used as a tool for data quality control in many
ways. Relational database management systems have many features beyond the database
engine (see list below). Later versions of RDBMS can easily prevent several types of
errors creeping into the data warehouse.
DATA QUALITY TOOLS 327
359.
Domain Integrity. Providedomain value edits. Prevent entry of data if the entered data
value is outside the defined limits of value. You can define the edit checks while set-
ting up the data dictionary entries.
Update Security. Prevent unauthorized updates to the databases. This feature will stop
unauthorized users from updating data in an incorrect way. Casual and untrained
users can introduce inaccurate or incorrect data if they happen to have authorization
to update.
Entity Integrity Checking. Ensure that duplicate records with the same primary key value
are not entered. Also prevent duplicates based on values of other attributes.
Minimize missing values. Ensure that nulls are not allowed in mandatory fields.
Referential Integrity Checking. Ensure that relationships based on foreign keys are pre-
served. Prevent deletion of related parent rows.
Conformance to Business Rules. Use trigger programs and stored procedures to enforce
business rules. These are special scripts compiled and stored in the database itself.
Trigger programs are automatically fired when the designated data items are about
to be updated or deleted. Stored procedures may be coded to ensure that the entered
data conforms to specific business rules. Stored procedures may be called from appli-
cation programs.
DATA QUALITY INITIATIVE
In spite of the enormous importance of data quality, it seems as though many companies still
ask the question whether to pay special attention to it and cleanse the data or not. In many
instances, the data for the missing values of attributes cannot be recreated. In quite a number
of cases, the data values are so convoluted that the data cannot really be cleansed. A few other
questions arise. Should the data be cleansed? If so, how much of it can really be cleansed?
Which parts of the data deserve higher priority for applying data cleansing techniques? The
indifference and the resistance to data cleansing emerge from a few valid factors:
† Data cleansing is tedious and time consuming. The cleansing activity demands a com-
bination of the use of vendor tools, writing of in-house code, and arduous manual tasks
of examination and verification. Many companies are unable to sustain the effort. This
is not the kind of work many IT professionals enjoy.
† The metadata on many source systems may be missing or nonexistent. It will be diffi-
cult or even impossible to probe into dirty data without the documentation.
† The users who are asked to ensure data quality have many other business responsibil-
ities. Data quality probably receives the least attention.
† Sometimes, the data cleansing activity appears to be so gigantic and overwhelming that
companies are terrified of launching a data cleansing initiative.
Once your enterprise decides to institute a data cleansing initiative, you may consider one
of two approaches. You may opt to allow only clean data to go into your data warehouse.
This means only data with a 100% quality can be loaded into the data warehouse. Data
that is in any way polluted must be cleansed before it can be loaded. This is an ideal
approach, but it takes a while to detect incorrect data and even longer to fix it. This approach
is ideal from the point of view of data quality, but it will take a very long time before all data
is cleaned up for data loading.
328 DATA QUALITY: A KEY TO SUCCESS
360.
The second approachis a “clean as you go” method. In this method, you load all the data
“as is” into the data warehouse and perform data cleansing operations in the data warehouse
at a later time. Although you do not withhold data loads, the results of any query are suspect
until the data gets cleansed. Questionable data quality at any time leads to losing user con-
fidence that is extremely important for data warehouse success.
Data Cleansing Decisions
Before embarking on a data cleansing initiative, the project team, including the users, have to
make a number of basic decisions. Data cleansing is not as simple as deciding to cleanse all
data and to cleanse it now. Realize that absolute data quality is unrealistic in the real world.
Be practical and realistic. Go for the fitness-for-purpose principle. Determine what the data is
being used for and find the purpose. If the data from the warehouse has to provide exact sales
dollars of the top 25 customers, then the quality of this data must be very high. If customer
demographics are to be used to select prospects for the next marketing campaign, the quality
of this data may be at a lower level.
In the final analysis, when it comes to data cleansing, you are faced with a few fundamen-
tal questions. You have to make some basic decisions. In the following subsections, we pre-
sent the basic questions that need to be asked and the basic decisions that need to be made.
Which Data to Cleanse This is the root decision. First of all, you and your users must
jointly work out the answer to this question. It must primarily be the users’ decision. IT will
help the users make the decision. Decide on the types of questions the data warehouse is
expected to answer. Find the source data needed for getting answers. Weigh the benefits
of cleansing each piece of data. Determine how cleansing will help and how leaving the
dirty data in will affect any analysis made by the users in the data warehouse.
The cost of cleaning up all data in the data warehouse is enormous. Users usually under-
stand this. They do not expect to see 100% data quality and will usually settle for ignoring
the cleansing of unimportant data as long as all the important data is cleaned up. But be sure
of getting the definitions of what is important or unimportant from the users themselves.
Where to Cleanse Data for your warehouse originates in the source operational sys-
tems, so does the data corruption. Then the extracted data moves into the staging area.
From the staging area load images are loaded into the data warehouse. Therefore, theoreti-
cally, you may cleanse the data in any one of these areas. You may apply data cleansing tech-
niques in the source systems, in the staging area, or perhaps even in the data warehouse. You
may also adopt a method that splits the overall data cleansing effort into parts that can be
applied in two of the areas, or even in all three areas.
You will find that cleansing the data after it has arrived in the data warehouse repository is
impractical and results in undoing the effects of many of the processes for moving and load-
ing the data. Typically, data is cleansed before it is stored in the data warehouse. So that
leaves you with two areas where you can cleanse the data.
Cleansing the data in the staging area is comparatively easy. You have already resolved all
the data extraction problems. By the time data is received in the staging area, you are fully
aware of the structure, content, and nature of the data. Although this seems to be the best
approach, there are a few drawbacks. Data pollution will keep flowing into the staging
area from the source systems. The source systems will continue to suffer from the conse-
quences of the data corruption. The costs of bad data in the source systems do not get
DATA QUALITY INITIATIVE 329
361.
reduced. Any reportsproduced from the same data from the source systems and from the data
warehouse may not match and will cause confusion.
On the other hand, if you attempt to cleanse the data in the source systems, you are taking
on a complex, expensive, and difficult task. Many legacy source systems do not have proper
documentation. Some may not even have the source code for the production programs avail-
able for applying the corrections.
How to Cleanse Here the question is about the use of vendor tools. Do you use vendor
tools by themselves for all of the data cleansing effort? Do you integrate cleansing tool kits
with other ETL tools? If not, how much of in-house programming is needed for your
environment? Many tools are available in the market for several types of data cleansing
functions.
If you decide to cleanse the data in the source systems, then you have to find the appro-
priate tools that can be applied to source system files and formats. This may not be easy if
most of your source systems are fairly old. In that case, you have to fall back on in-house
programs.
How to Discover the Extent of Data Pollution Before you can apply data cleans-
ing techniques, you have to assess the extent of data pollution. This is a joint responsibility
shared among the users of operational systems, the potential users of the data warehouse, and
IT. IT staff, supporting both the source systems and the data warehouse, have a special role in
the discovery of the extent of data pollution. IT is responsible for installing the data cleansing
tools and training the users in using those tools. IT must augment the effort with in-house
programs.
In an earlier section, we discussed the sources of data pollution. Reexamine these
sources. Make a list that reflects the sources of pollution found in your environment, then
determine the extent of the data pollution with regard to each source of pollution. For
example, in your case, data aging could be a source of pollution. If so, make a list of all
the old legacy systems that serve as sources of data for your data warehouse. For the data
attributes that are extracted, examine the sets of values. Check if any of these values do
not make sense and have decayed. Similarly, perform detailed analysis for each type of
data pollution source.
Figure 13-4 shows a few typical ways you can detect the possible presence and extent of
data pollution. Use the list as a guide for your environment.
Setting Up a Data Quality Framework You have to contend with so many types of
data pollution. You need to make various decisions to embark on the cleansing of data. You
must dig into the sources of possible data corruption and determine the pollution. Most com-
panies serious about data quality pull all these factors together and establish a data quality
framework. Essentially, the framework provides a basis for launching data quality initiatives.
It embodies a systematic plan for action. The framework identifies the players, their roles,
and responsibilities. In short, the framework guides the data quality improvement effort.
Refer to Fig. 13-5. Notice the major functions carried out within the framework.
Who Should Be Responsible?
Data quality or data corruption originates in the source systems. Therefore, should not the
owners of the data in the source systems alone be responsible for data quality? If these
330 DATA QUALITY: A KEY TO SUCCESS
362.
Operational systems converted
fromolder versions are prone to
the perpetuation of errors.
Operational systems brought in
house from outsourcing companies
converted from their proprietary
software may have missing data.
Data from outside sources that is
not verified and audited may have
potential problems.
When applications are
consolidated because of corporate
mergers and acquisitions, these
may be error-prone because of time
pressures.
When reports from old legacy
systems are no longer used, that
could be because of erroneous data
reported.
If users do not trust certain
reports fully, there may be room
for suspicion because of bad data.
Whenever certain data elements
or definitions are confusing to the
users, these may be suspect.
If each department has its own
copies of standard data such as
Customer or Product, it is likely
corrupt data exists in these files.
If reports containing the same
data reformatted differently do not
match, data quality is suspect.
Wherever users perform too
much manual reconciliation, it may
be because of poor data quality.
If production programs
frequently fail on data exceptions,
large parts of the data in those
systems are likely to be corrupt.
Wherever users are not able to
get consolidated reports, it is
possible that data is not integrated.
Figure 13-4 Discovering the extent of data pollution.
Identify the
business functions
affected most by
bad data.
Establish Data
Quality Steering
Committee.
Agree on a
suitable data
quality framework.
Institute data
quality
policy and
standards.
Define quality
measurement
parameters and
benchmarks.
Select high impact
data elements and
determine
priorities.
Plan and execute
data cleansing for
high impact data
elements.
Plan and execute
data cleansing for
other less severe
elements.
INITIAL
DATA
CLEANSING
EFFORTS
ONGOING
DATA
CLEANSING
EFFORTS
IT Professionals User Representatives
Figure 13-5 Data quality framework.
DATA QUALITY INITIATIVE 331
363.
data owners areresponsible for the data, should they also bear the responsibility for any data
pollution that happens in the source systems? If data quality in the source systems is high, the
data quality in the data warehouse will also be high. But, as you well know, in operational
systems, there are no clear roles and responsibilities for maintaining data quality. This is a
serious problem. Owners of data in the operational systems are generally not directly
involved in the data warehouse. They have little interest in keeping the data clean in the
data warehouse.
Form a steering committee to establish the data quality framework discussed in the pre-
vious section. All the key players must be part of the steering committee. You must have
representatives of the data owners of source systems, users of the data warehouse, and IT
personnel responsible for the source systems and the data warehouse. The steering committee
is charged with assignment of roles and responsibilities. Allocation of resources is also the
steering committee’s responsibility. The steering committee also arranges data qualityaudits.
Figure 13-6 shows the participants in the data quality initiatives. These persons represent
the user departments and IT. The participants serve on the data quality team in specific roles.
Listed below are the suggested responsibilities for the roles:
Data Consumer. Uses the data warehouse for queries, reports, and analysis. Establishes
the acceptable levels of data quality.
Data Producer. Responsible for the quality of data input into the source systems.
Data Expert. Expert in the subject matter and the data itself of the source systems.
Responsible for identifying pollution in the source systems.
Data Policy Administrator. Ultimately responsible for resolving data corruption as data
is transformed and moved into the data warehouse.
Data Integrity Specialist. Responsible for ensuring that the data in the source systems
conforms to the business rules.
DATA
QUALITY
INITIATIVES
DATA
CONSUMER
(User Dept.)
DATA
EXPERT
(User Dept.)
DATA
PRODUCER
(User Dept.)
DATA POLICY
ADMINISTRATOR
(IT Dept.)
DATA INTEGRITY
SPECIALIST
(IT Dept.)
DATA CORRECTION
AUTHORITY
(IT Dept.)
DATA CONSISTENCY
EXPERT
(IT Dept.)
Figure 13-6 Data quality: participants and roles.
332 DATA QUALITY: A KEY TO SUCCESS
364.
Data Correction Authority.Responsible for actually applying the data cleansing tech-
niques through the use of tools or in-house programs.
Data Consistency Expert. Responsible for ensuring that all data within the data ware-
house (various data marts) are fully synchronized.
The Purification Process
We all know that it is unrealistic to hold up the loading of the data warehouse until the quality
of all data is at the 100% level. That level of data quality is extremely rare. So, how much of
the data should you attempt to cleanse? When do you stop the purification process?
Again, we come to the issues of who will use the data and for what purposes. Estimate the
costs and risks of each piece of incorrect data. Users usually settle for some measure of
errors, provided these errors result in no serious consequences. But the users need to be
kept informed of the extent of possible data corruption and exactly which parts of the
data could be suspect.
How then could you proceed with the purification process? With the complete partici-
pation of your users, divide the data elements into priorities for the purpose of data cleansing.
You may adopt a simple categorization by grouping the data elements into three priority cat-
egories: high, medium, and low. Achieving 100% data quality is critical for the high cat-
egory. The medium-priority data requires as much cleansing as possible. Some errors
may be tolerated when you strike a balance between the cost of correction and potential
effect of bad data. The low-priority data may be cleansed if you have any time and remaining
resources are still available. Begin your data cleansing efforts with the high-priority data.
Then move on to the medium-priority data.
A universal data corruption problem relates to duplicate records. As we have seen earlier,
for the same customer, there could be multiple records in the source systems. Activity
records are related to each of these duplicate records in the source systems. Make sure
your overall data purification process includes techniques for correcting the duplication pro-
blem. The techniques must be able to identify the duplicate records and then relate all the
activities to this single customer. Duplication normally occurs in records relating to persons
such as customers, employees, and business partners.
So far, we have not discussed data quality with regard to data obtained from external
sources. Pollution can also be introduced into the data warehouse through errors in external
data. Surely, if you pay for the external data and do not capture it from the public domain,
then you have every right to demand a warranty on data quality. In spite of what the vendor
might profess about the quality of the data, for each set of external data, set up some kind of
data quality audit. If the external data fails the audit, be prepared to reject the corrupt data and
demand a cleaner version.
Figure 13-7 illustrates the overall data purification process. Observe the process as shown
in the figure and go through the following summary:
† Establish the importance of data quality.
† Form a data quality steering committee.
† Institute a data quality framework.
† Assign roles and responsibilities.
† Select tools to assist in the data purification process.
† Prepare in-house programs as needed.
DATA QUALITY INITIATIVE 333
365.
† Train theparticipants in data cleansing techniques.
† Review and confirm data standards.
† Prioritize data into high, medium, and low categories.
† Prepare a schedule for data purification beginning with the high priority data.
† Ensure that techniques are available to correct duplicate records and to audit external
data.
† Proceed with the purification process according to the defined schedule.
Practical Tips on Data Quality
Before you run away to implement a comprehensive data quality framework and expend time
and resources on data quality, let us pause to go over a few practical suggestions. Remember,
ensuring data quality is a balancing act. You already know that 100% data quality is an
unrealistic expectation. At the same time, overlooking errors that could potentially ruin
the business is also not an option. You have to find the right balance between the data puri-
fication effort and the available time and resources. Here are a few practical tips:
† Identify high-impact pollution sources and begin your purification process with these.
† Do not try to do everything with in-house programs.
† Tools are good and useful. Select the proper tools.
† Agree on standards and reconfirm these.
† Link data quality with specific business objectives. By itself, data quality work is not
attractive.
† Get the senior executive sponsor of your data warehouse project to be actively involved
in backing the data cleansing initiative.
† Get users totally involved and keep them constantly informed of the developments.
† Wherever needed, bring in outside experts for specific assignments.
SOURCE
SYSTEMS
DATA
WAREHOUSE
DATA
STAG
ING
AREA
Cleansed
Data
Polluted
Data
DATA CLEANSING
FUNCTIONS
Vendor
Tools
In-house
Programs
DATA QUALITY
FRAMEWORK
IT Professionals/User Representatives
Figure 13-7 Overall data purification.
334 DATA QUALITY: A KEY TO SUCCESS
366.
MASTER DATA MANAGEMENT(MDM)
More recently organizations are achieving data quality by adopting an overall master data
management approach. MDM is an umbrella approach to provide consistent and comprehen-
sive core information across the organization. Master data generally refers to data describing
core business objects such as customers, products, locations, and financials. Sometimes data
about other entities such as business partners, employees, sales contacts, and physical assets
are also included as master data for an organization. These may be considered as nontransac-
tional data entities or reference data.
MDM comprises a set of technologies, disciplines, and solutions to create and maintain
consistent, accurate, and complete business data about the entities included within its ambit.
MDM is as much about information strategy as it is about software. It cuts across business
processes, software, data stewardship, data governance, and business information. At the
most fundamental level, MDM is meant to ensure that an organization does not present
multiple versions of the same master data in different operations and applications. It strives
for a single version of high quality master data.
MDM Categories
When you consider how MDM is practiced and where it is applied, you can put MDM
solutions into three broad categories. This categorization may vary from organization to
organization. Again in some organizations, all three categories may not be relevant.
Operational MDM. This is integrated with and used with operational applications for
CRM, ERP, financial systems, and such others.
Analytic MDM. This is predominant in data warehousing, useful for obtaining quality
master data.
Enterprise MDM. This is much wider in scope than the other categories, attempting to
encompass all aspects of master data within the enterprise.
MDM Benefits
Creating a master data service layer is a difficult undertaking for organizations. Nevertheless,
businesses have begun to adopt MDM because of several benefits they expect to obtain. Here
is a brief list of possible benefits from MDM.
† Reduction in cost and complexity of processes that use master data and provide internal
efficiencies.
† Improvement in the ability to consolidate, share, and analyze business information in a
timely manner, regionally and even globally.
† Possibility to rapidly assemble new, composite applications with accurate master data
and reusable business processes.
† Reduction in time to market by having a single system for creating and maintaining
product information, promotions, and consumer communications.
† Improvements to the supply chain with single, accurate, well-defined definitions of
products and suppliers, eliminating duplications.
† Enhanced customer service, with a complete view of each customer designed to better
anticipate customer needs and provide targeted offers.
MASTER DATA MANAGEMENT (MDM) 335
367.
† Better overallintegration, eliminating information silos that may have developed across
divisions within an organization.
MDM and Data Warehousing
As we have seen in this chapter, historically organizations have attempted to address data
quality problems in the data warehouse by rectifying problems downstream. Source systems
create inaccurate master data but in many organizations the trend has been to cleanse the
inaccurate data not at the source. Nor do these organizations try to go back and propagate
the corrections backward once the corrections are made in the data staging area or the
data warehouse itself. MDM provides a way to correct bad master data at the source so
that the data will be high quality when it reaches the data warehouse. The net result is accu-
rate business intelligence.
Creation of a system of record (a trusted single data source) is the underlying theme across
the many approaches to MDM. The intent is to establish an authenticated master copy from
which entity definitions and physical data can flow among all applications integrated through
the MDM initiative. Many enterprises build a central data warehouse or an operational data
store as a hub through master data definitions, metadata, and content synchronized for all
applications.
CHAPTER SUMMARY
† Data quality is critical because it boosts confidence, enables better customer service,
enhances strategic decision making, and reduces risks from disastrous decisions.
† Data quality dimensions include accuracy, domain integrity, consistency, complete-
ness, structural definiteness, clarity, and many more.
† Data quality problems run the gamut of dummy values, missing values, cryptic values,
contradicting values, business rule violations, inconsistent values, and so on.
† Data pollution results from many sources in a data warehouse and this variety of sources
of pollution intensifies the challenges faced when attempting to clean up the data.
† Poor data quality of names and addresses presents serious concerns to organizations.
This area is one of the greatest challenges.
† Data cleansing tools contain useful error discovery and error correction features. Learn
about them and make use of the tools applicable to your environment.
† The DBMS itself can be used for data cleansing.
† Set up a sound data quality initiative in your organization. Within that framework,
make the data cleansing decisions.
† Master Data Management (MDM) initiatives provide a means for ensuring data quality
in the data warehouse.
REVIEW QUESTIONS
1. List five reasons why you think data quality is critical in a data warehouse.
2. Explain how data quality is much more than just data accuracy. Give an example.
336 DATA QUALITY: A KEY TO SUCCESS
368.
3. Briefly listthree benefits of quality data in a data warehouse.
4. Give examples of four types of data quality problems.
5. What is the problem related to the reuse of primary keys? When does it usually occur?
6. Describe the functions of data correction in data cleansing tools.
7. Name five common sources of data pollution. Give an example for each type of source.
8. List six types of error discovery features found in data cleansing tools.
9. What is the “clean as you go” method? Is this a good approach for the data warehouse
environment?
10. Name any three types of participants on the data quality team. What are their functions?
EXERCISES
1. Match the columns:
1. domain integrity
2. data aging
3. entity integrity
4. data consumer
5. poor quality data
6. data consistency expert
7. error discovery
8. data pollution source
9. dummy values
10. data quality benefit
A. detect inconsistencies
B. better customer service
C. synchronize all data
D. allowable values
E. used to pass edits
F. uses warehouse data
G. heterogeneous systems integration
H. lost business opportunities
I. prevents duplicate key values
J. decay of field values
2. Assume that you are the data quality expert on the data warehouse project team for a large
financial institution with many legacy systems dating back to the 1970s. Review the types
of data quality problems you are likely to have and make suggestions on how to deal with
those.
3. Discuss the common sources of data pollution and provide examples.
4. You are responsible for the selection of data cleansing tools for your data warehouse
environment. How will you define the criteria for selection? Prepare a checklist for evalu-
ation and selection of these tools.
5. As a data warehouse consultant, a large bank with statewide branches has hired you to
help the company set up a data quality initiative. List your major considerations.
Produce an outline for a document describing the initiative, the policies, and the
procedures.
EXERCISES 337
CHAPTER 14
MATCHING INFORMATIONTO
THE CLASSES OF USERS
CHAPTER OBJECTIVES
† Appreciate the enormous information potential of the data warehouse
† Carefully note all the users who will use the data warehouse and devise a practical way
to classify them
† Delve deeply into the types of information delivery mechanisms
† Match each class of user to the appropriate information delivery method
† Understand the overall information delivery framework and study the components
Let us assume that your data warehouse project team has successfully identified all the
pertinent source systems. You have extracted and transformed the source data. You have
the best data design for the data warehouse repository. You have applied the most effective
data cleansing methods and gotten rid of most of the pollution from the source data. Using
the most optimal methods, you have loaded the transformed and cleansed data into your data
warehouse database. Then what?
After performing all of these tasks most effectively, if your team has not provided the best
possible mechanism for delivery of business intelligence to your users, you have really
accomplished nothing from the users’ perspective. As you know, the data warehouse
exists for one reason and one reason alone. It is there just for providing strategic information
to your users. For the users, the information delivery mechanism is the data warehouse. The
user interface for information is what determines the ultimate success of your data ware-
house. If the interface is intuitive, easy to use, and enticing, the users will keep coming
back to the data warehouse. If the interface is difficult to use, cumbersome, and convoluted,
your project team may as well leave the scene.
Data Warehousing Fundamentals for IT Professionals, Second Edition. By Paulraj Ponniah
Copyright # 2010 John Wiley Sons, Inc.
341
373.
Who are yourusers? What do they want? Your project team, of course, knows the answers
and has designed the data warehouse based on the requirements of these users. How do you
provide the needed information to your users? This depends on who your users are, what
information they need, when and where they need the information, and in exactly what
form they need the information. In this chapter, we will consider general classes of users
of a typical warehouse and the methods for providing information to them.
A large portion of the success of your data warehouse rests on the information delivery
tools made available to the users. Selecting the right tools is of paramount importance.
You have to make sure that the tools are most appropriate for your environment. We will
discuss in detail the selection of information delivery tools.
INFORMATION FROM THE DATA WAREHOUSE
As an IT professional, you have been involved in providing information to the user com-
munity. You must have worked on different types of operational systems that provide infor-
mation to users. The users in enterprises make use of the information from the operational
systems to perform their day-to-day work and run the business. If we have been involved
in information delivery from operational systems and we understand what information deliv-
ery to the users entails, then what is the need for this special study on information delivery
from the data warehouse?
Let us review how information delivery from a data warehouse differs from information
delivery from an operational system. If the kinds of strategic information made available in a
data warehouse were readily available from the source systems, then we would not really
need the warehouse. Data warehousing enables the users to make better strategic decisions
by obtaining data from the source systems and keeping it in a format suitable for querying
and analysis.
Data Warehouse Versus Operational Systems
Databases already exist in operational systems for querying and reporting. If so, how do the
databases in operational systems differ from those of the databases in the data warehouse?
The difference relates to two aspects of the information contained in these databases.
First, they differ in the usage of the information. Next, they differ in the value of the infor-
mation. Figure 14-1 shows how the data warehouse differs from an operational system in
usage and value.
Users go to the data warehouse to find information on their own. They navigate through
the contents and locate what they want. The users formulate their own queries and run them.
They format their own reports, run them, and receive the results. Some users may use pre-
defined queries and preformatted reports but, by and large, the data warehouse is a place
where the users are free to make up their own queries and reports. They move around the
contents and perform their own analysis, viewing the data in ever so many different ways.
Each time a user goes to the data warehouse, he or she may run different queries and different
reports, not repeating the earlier queries or reports. The information delivery is intended to be
interactive.
Compare this type of usage of the data warehouse to how an operational system is used for
information delivery. How often are the users allowed to run their own queries and format
their own reports from an operational system? From an inventory control application, do
342 MATCHING INFORMATION TO THE CLASSES OF USERS
374.
the users usuallyrun their own queries and make up their own reports? Hardly ever. First
of all, because of efficiency considerations, operational systems are not designed to let
users loose on the systems. The users may impact the performance of the system adversely
with runaway queries. Another important point is that the users of operational systems do not
exactly know the contents of the databases; metadata or data dictionary entries are typically
unavailable to them. Interactive analysis, which forms the bedrock of information delivery
in the data warehouse, is almost never present in an operational system.
What about the value of the information from the data warehouse to the users? How
does the value of information from an operational system compare to the value from the
data warehouse? Take the case of information for analyzing the business operations. The
information from an operational system shows the users how well the enterprise is doing
for running the day-to-day business. The value of information from an operational system
enables the users to monitor and control the current operations. On the other hand, infor-
mation from the data warehouse gives the users the ability to analyze growth patterns in rev-
enue, profitability, market penetration, and customer base. Based on such analysis, the users
are able to make strategic decisions to keep the enterprise competitive and sound. Look at
another area of the enterprise, namely, marketing. With regard to marketing, the value of
information from the data warehouse is oriented to strategic matters such as market share,
distribution strategy, predictability of customer buying patterns, and market penetration.
Although this is the case of the value of information from the data warehouse for marketing,
what is the value of information from operational systems? Mostly for monitoring sales
against target quotas and for attempting to get repeat business from customers.
We see that the usage and value of information from the data warehouse differ from those
of information from operational systems. What is the implication of the differences? First
of all, because of the differences, as an IT professional, you should not try to apply the
Revenue Growth Pattern
Profitability Analysis
Market Growth Directions
Market Share Analysis
Customer Growth Potential
Corporate Purchasing Strategy
Asset Utilization Analysis
New Product Development
Product Distribution Strategy
Cost/Revenue Calculations
Margin Calculations
Returns on Investment
Market Share Calculations
Customer Lifetime Values
Accounts Payable
Asset Management
Product Costs
Distribution Channel Expenses
Self-service Information
Ad queries by users
Report generation by users
Also predefined queries
Also preformatted reports
DATA WAREHOUSE OPERATIONAL SYSTEMS
Value
of
Informatio
n
-
Examples
How
used
for
Informatio
n
Information through applications
Online GUI screens
Standard reports
Very limited queries
Ad hoc reports through IT
Figure 14-1 Data warehouse versus operational systems.
INFORMATION FROM THE DATA WAREHOUSE 343
375.
principles of informationdelivery from operational systems to the data warehouse.
Information delivery from the data warehouse is markedly different. Different methods
are needed. Further, you should take serious note of the interactive nature of information
delivery from the data warehouse. Users are expected to gather information and perform
analysis from the data in the data warehouse interactively on their own without the assis-
tance of IT. IT staff supporting the users of the data warehouse do not run the queries and
reports for the users; the users do that by themselves. So, make the information from the
data warehouse easily and readily available to the users in their own terms.
Information Potential
Before we look at the different types of users and their information needs, we need to gain an
appreciation of the enormous potential of the data warehouse for business intelligence.
Because of this great potential, we have to pay adequate attention to information delivery
from the data warehouse. We cannot treat information delivery in a special way unless
we fully realize the significance of how the data warehouse plays a key role in the overall
management of an enterprise.
Overall Enterprise Management In every enterprise, three distinct processes govern
the overall management. First, the enterprise is engaged in planning. Execution of the plans
takes place next. Assessment of the results of the execution follows. Figure 14-2 indicates
these plan–execute–assess processes.
Let us see what happens in this closed loop. Consider the planning for expansion into a
specific geographic market for an enterprise. Let us say your company wants to increase its
market share in the northwest region. Now this plan is translated into execution by means of
PLANNING
EXECUTION ASSESSMENT
Plan
marketing
campaigns
Execute
marketing
campaigns
Assess
results of
campaigns
Enhance
campaigns
based on
results
Data
Warehouse
helps in
planning
Data
Warehouse
helps
assess
results
Figure 14-2 Plan–execute–assess closed loop for an enterprise.
344 MATCHING INFORMATION TO THE CLASSES OF USERS
376.
promotional campaigns, improvedservices, and customized marketing. After the plan is
executed, your company wants to find the results of the promotional campaigns and the
marketing initiatives. Assessment of the results determines the effectiveness of the cam-
paigns. Based on the assessment of the results, more plans may be made to vary the compo-
sition of the campaigns or launch additional ones. The cycle of planning, executing, and
assessing continues.
It is very interesting to note that the data warehouse, with its specialized information
potential, fits nicely into this plan–execute–assess loop. The data warehouse, with its
business intelligence component, reports on the past and helps plan the future. First, the
data warehouse assists in the planning. Once the plans are executed, the data warehouse is
used to assess the effectiveness of the execution.
Let us go back to the example of your company wanting to expand in the northwest
region. Here the planning consists of defining the proper customer segments in that region
and also defining the products to concentrate on. Your data warehouse can be used effec-
tively to separate out and identify the potential customer segments and product groups
for the purpose of planning. Once the plan is executed with promotional campaigns, your
data warehouse helps the users to assess and analyze the results of the campaigns. Your
users can analyze the results by product and by individual districts in the northwest
region. They can compare the sales to the targets set for the promotional campaigns, or
the prior year’s sales, or against industry averages. The users can estimate the growth in earn-
ings due to the promotional campaigns. The assessment can then lead to further planning
and execution. This plan–execute–assess loop is critical for the success of an enterprise.
Information Potential for Business Areas We considered one isolated example of
how the information potential of your data warehouse can assist in the planning for market
expansion and in the assessment of the results of the execution of marketing campaigns for
that purpose. Let us go through a few general areas of the enterprise where the data ware-
house can assist in the planning and assessment phases of the management loop.
Profitability Growth To increase profits, management has to understand how the profits
are tied to product lines, markets, and services. Management must gain insights into
which product lines and markets produce greater profitability. Business intelligence from
the data warehouse is ideally suited to plan for profitability growth and to assess the results
when the plans are executed.
Strategic Marketing Strategic marketing drives business growth. When management
studies the opportunities for up-selling and cross-selling to existing customers and for
expanding the customer base, they can plan for business growth. The data warehouse has
great information potential for strategic marketing.
Customer Relationship Management A customer’s interactions with an enterprise are
captured in various operational systems. The order processing system contains the orders
placed by the customer; the product shipment system, the shipments; the sales system, the
details of the products sold to the customer; the accounts receivable system, the credit details
and the outstanding balances. The data warehouse has all the data about the customer
extracted from the various disparate source systems, transformed, and integrated. Thus,
your management can “know” their customers individually from the information available
in the data warehouse. This knowledge results in better customer relationship management.
INFORMATION FROM THE DATA WAREHOUSE 345
377.
Corporate Purchasing Fromwhere can your management get the overall picture of
corporate-wide purchasing patterns? Your data warehouse. This is where all data about pro-
ducts and vendors are collected after integration from the source systems. Your data ware-
house empowers corporate management to plan for streamlining purchasing processes.
Realizing the Information Potential What is the underlying significance of the infor-
mation potential of the data warehouse? The data warehouse enables the users to view the
data in the right business context. The various operational systems collect massive quantities
of data on numerous types of business transactions. But these operational systems are not
directly helpful for planning and assessment of results. The users need to assess the results
by viewing the data in the proper business context. For example, when viewing the sales
in the northwest region, the users need to view the sales in the business context of geography,
product, promotion, and time. The data warehouse is designed for analysis of metrics such
as sales along these dimensions. The users are able to retrieve the data, transform it into
useful information, and leverage the information for planning and assessing the results.
The users interact with the data warehouse to obtain data, transform it into useful infor-
mation, and realize the full potential. This interaction of the users generally goes through the
six stages indicated in Figure 14-3 and summarized below.
1. Think through the business need and define it in terms of business rules as applicable
to data in the data warehouse.
2. Harvest or select the appropriate subset of the data according to the stipulated business
rules.
3. Enrich the selected subset with calculations such as totals or averages. Apply trans-
formations to translate codes to business terms.
DATA
WAREHOUSE
END-USERS
Define business
need in terms of
warehouse data.
Select appropriate
data subset from
warehouse.
Enrich selected
subset with
calculations, etc.
Associate
meanings to
selected data.
Structure results
into formats
suitable to users.
Present structured
results in a variety
of ways.
DATA
INFORMATION
6
5
4
3
2
1
Figure 14-3 Stages in realization of the information potential.
346 MATCHING INFORMATION TO THE CLASSES OF USERS
378.
4. Use metadatato associate the selected data with its business meaning.
5. Structure the result in a format useful to the users.
6. Present the structured information in a variety of ways, including tables, texts, graphs,
and charts.
User–Information Interface
In order to pass through the six stages and realize the information potential of the data
warehouse, you have to build a solid interface for information delivery to the users. Put
the data warehouse on one side and the entire community of users on the other. The interface
must be able to let the users realize the full information potential of the data warehouse.
The interface logically sits in the middle, enabling information delivery to the users.
The interface could be a specific set of tools and procedures, tailored for your environment.
At this point, we are not discussing the exact composition of the interface; we just want
to specify its features and characteristics. Without getting into the details of the types of
users and their specific information needs, let us define the general characteristics of the
user–information interface.
Information Usage Modes When you consider all the various ways the data ware-
house may be used, you note that all the usage comes down to two basic modes or ways.
Both modes relate to obtaining business intelligence. Remember, we are not considering
information retrieved from operational systems.
Verification Mode. In this mode, the business user proposes a hypothesis and asks a
series of questions to either confirm or repudiate it. Let us see how the use of the infor-
mation in this mode works. Assume that your marketing department planned and exe-
cuted several promotional campaigns on two product lines in the south-central region.
Now the marketing department wants to assess the results of the campaign. The
marketing department goes to the data warehouse with the hypothesis that sales in
the south-central region have increased. Information from the data warehouse will
help confirm the hypothesis.
Discovery Mode. When using the data warehouse in the discovery mode, the business
analyst does not use a predefined hypothesis. In this case, the business analyst desires
to discover new patterns of customer behavior or product demands. The user does not
have any preconceived notions of what the result sets will indicate. Data mining appli-
cations with data feeds from the data warehouse are used for knowledge discovery.
We have seen that users interact with the data warehouse for information either in the
hypothesis verification mode or in a knowledge discovery mode. What are the approaches
for the interaction? In other words, do the users interact with the data warehouse in an infor-
mational approach, an analytical approach, or by using data mining techniques?
Informational Approach. In this approach, with query and reporting tools, users retrieve
historicalorcurrentdataandperformsomestandardstatisticalanalysis.Thedatamaybe
lightly or heavily summarized. The result sets may take the form of reports and charts.
Analytical Approach. As the name of this approach indicates, users make use of the data
warehouse for performing analysis. They do the analysis along business dimensions
using historical summaries or detailed data. The business users conduct the analysis
INFORMATION FROM THE DATA WAREHOUSE 347
379.
using their ownbusiness terms. More complex analysis involves drill down, roll up, or
slice and dice.
Data Mining Approach. Both the informational and analytical approaches work in the
verification mode. The data mining approach, however, works in the knowledge
discovery mode.
We have reviewed two modes and three approaches for information usage. What about
the characteristics and structures of the data that is being used? How should the data be avail-
able through the user–information interface? Typically, the information made available
through the user–information interface has the following characteristics:
Preprocessed Information. These include routine information automatically created and
made readily available. Monthly and quarterly sales analysis reports, summary reports,
and routine charts fall into this category. Users simply copy such preprocessed
information.
Predefined Queries and Reports. This is a set of query templates and report formats
kept ready for users. The users apply the appropriate parameters and run the queries
and reports as and when needed. Sometimes, users are allowed to make minor modi-
fications to the templates and formats.
Ad hoc Constructions. Users create their own queries and reports using appropriate tools.
This category acknowledges the fact that not every need of the users can be antici-
pated. Generally, only power users and some regular users construct their own queries
and reports.
Finally, let us list the essential features necessary for the user–information interface. The
interface must
† Be easy to use, intuitive, and enticing to users.
† Support the ability to express the business need clearly.
† Convert the expressed need into a set of formal business rules.
† Be able to store these rules for future use.
† Provide the ability to the users to modify retrieved rules.
† Select, manipulate, and transform data according to the business rules.
† Have a set of data manipulation and transformation tools.
† Correctly link to data storage to retrieve the selected data.
† Be able to link with metadata.
† Be capable of formatting and structuring output in a variety of ways, both textual and
graphical.
† Have the means of building a procedure for executing specific steps.
† Have a procedure management facility.
Industry Applications
So far in this section, we have clearly perceived the great information potential of the
data warehouse. This enormous information potential drives the discussion that follows,
where we get into more specifics and details. Before we do that, let us pause to refresh
348 MATCHING INFORMATION TO THE CLASSES OF USERS
380.
our minds onhow the information potential of data warehouses is realized in a sample of
industry sectors.
Manufacturing: Warranty and service management, product quality control, order fulfill-
ment and distribution, supplier and logistics integration.
Retail and Consumer Goods: Store layout, product bundling, cross-selling, value chain
analysis.
Banking and Finance: Relationship management, credit risk management.
WHO WILL USE THE INFORMATION?
You will observe that within six months after deployment of the data warehouse, the number
of active users doubles. This is a typical experience for most data warehouses. Who are
these new people arriving at the data warehouse for information? Unless you know how
to anticipate who will come for business intelligence, you will not be able to cater to their
needs appropriately and adequately.
Anyone who needs strategic information is expected to be part of the groups of users.
That includes business analysts, business planners, departmental managers, and senior
executives. It is likely that each of the data marts may be built for the specific needs of
one segment of the user groups. In this case, you can identify the special groups and cater
to their needs. At this stage, when we are discussing information delivery, we are not con-
sidering the information content so much but the actual mechanism of information delivery.
Each group of users has specific business needs for which they expect to get answers
from the data warehouse. When we try to classify the user groups, it is best to understand
them from the perspective of what they expect to get out of the warehouse. How are they
going to use the information content in their job functions? Each user is performing
a particular business function and needs information for support in that specific job
function. Let us, therefore, base our classification of the users on their job functions and
organizational levels.
Figure 14-4 suggests a way of classifying the user groups. When you classify the users
by their job functions, their positions in the organizational hierarchy, and their computing
proficiency, you get a firm basis for understanding what they need and how to provide
information in the proper formats. If you are considering a user in accounting and finance,
that user will be very comfortable with spreadsheets and financial ratios. For a user in cus-
tomer service, a GUI screen showing consolidated information about each customer is most
useful. For someone in marketing, a tabular format may be suitable.
Classes of Users
In order to make your information delivery mechanism best suited for your environment, you
need to have a thorough understanding of the classes of users: First, let us start by associating
the computing proficiency of the users with how each group based on this type of division
interacts with the data warehouse.
Casual or Novice User. Uses the data warehouse occasionally, not daily. Needs a very
intuitive information interface. Looks for the information delivery to prompt the
user with available choices. Needs big button navigation.
WHO WILL USE THE INFORMATION? 349
381.
Regular User. Usesthe data warehouse almost daily. Comfortable with computing
options but cannot create own reports and queries from scratch. Needs query templates
and predefined reports.
Power User. Is highly proficient with technology. Can create reports and queries
from scratch. Some can write their own macros and scripts. Can import data into
spreadsheets and other applications.
Now let us change the perspective a bit and look at the user types by the way they wish to
interact to obtain information.
Preprocessed Reports. Use routine reports run and delivered at regular intervals.
Predefined Queries and Templates. Enter own set of parameters and run queries with
predefined templates and reports with predefined formats.
Limited ad hoc Access. Create from scratch and run limited number and simple types of
queries and analysis.
Complex ad hoc Access. Create complex queries and run analysis sessions from scratch
regularly. Provide the basis for preprocessed and predefined queries and reports.
Let us view the user groups from yet another perspective. Consider the users based on
their job functions.
High-Level Executives and Managers. Need information for high-level strategic
decisions. Standard reports on key metrics are useful. Customized and personalized
information is preferable.
Organizational
Hierarchy
Job
Function
Computing
Proficiency
Support
Analyst
Manager
Executive
Power User
Regular User
Novice User
M
arketing
Accounting
Purchasing
Personnel
Figure 14-4 A method of classifying users.
350 MATCHING INFORMATION TO THE CLASSES OF USERS
382.
Technical Analysts. Lookfor complex analysis, statistical analysis, drill-down and slice-
dice capabilities, and freedom to access the entire data warehouse.
Business Analysts. Although comfortable with technology, are not quite adept at creating
queries and reports from scratch. Predefined navigation is helpful. Want to look at the
results in many different ways. To some extent, can modify and customize predefined
reports.
Business-Oriented Users. These are knowledge workers who like point-and-click GUIs.
Desire to have standard reports and some measure of ad hoc querying.
We have considered a few ways of understanding how users may be grouped. Now,
let us put it all together and label the user classes in terms of their access and infor-
mation delivery practices and preferences. Figure 14-5 shows a way of classifying users
adopted by many data warehousing experts and practitioners. This figure shows five
broad classes of users. Within each class, the figure indicates the basic characteristics of
the users in that class. The figure also assigns the users in the organizational hierarchy to
specific classes.
Although the classification appears to be novel and interesting, you will find that it
provides a good basis to understand the characteristics of each group of users. You can fit
any user into one of these classes. When you observe the computing proficiency, the
organizational level, the information requirements, or even the frequency of usage, you
can readily identify the user as belonging to one of these groups. That will help you to satisfy
the needs of each user who depends on your data warehouse for information. It comes down
to this: if you provide proper information delivery to tourists, operators, farmers, explorers,
and miners, then you would have taken care of the needs of every one of your users.
FARMERS
EXPLORERS OPERATORS
MINERS TOURISTS
DATA
WAREHOUSE
Executives:
interested in
business
indicators
Support
staff:
interested
in current
data
Analysts:
interested
in routine
analysis
Skilled
analysts:
interested in
highly ad hoc
analysis
Special
purpose
analysts:
interested in
knowledge
discovery
Figure 14-5 Classes of data warehouse users.
WHO WILL USE THE INFORMATION? 351
383.
What They Need
Bynow we have formalized the broad classifications of data warehouse users. Let us pause
and consider how we accomplished this. If you take two of your users with similar infor-
mation access characteristics, computing proficiency, and scope of information needs,
you may very well place both these users in the same broad class. For example, if you
take two senior executives in different departments, they are similar in the way they
would like to get information and in the level and scope of information they would like to
have. You may place both of these executives in the tourist class or category.
Once you put both of these users in the tourist category, then it is easy for you to under-
stand and formulate the requirements for information delivery to these two executives.
The types of information needed by one user in a certain category are similar to the types
needed by another user in the same category. An understanding of the needs of a category
of users, generalized to some extent, provides insight into how best to provide the types
of information needed. Formal classification leads to understanding the information
needs. Understanding the information needs, in turn, leads to establishing proper ways for
providing the information. Establishing the best methods and techniques for each class of
users is the ultimate goal of information delivery.
What do the tourists need? What do the farmers need? What does each class of users
need? Let us examine each class, one by one, review the information access characteristics,
and arrive at the information needs.
Tourists Imagine a tourist visiting an interesting place. First of all, the tourist has
studied the broader features of the place he or she is visiting and is aware of the richness
of the culture and the variety of sites at this place. Although many interesting sites are
available, the tourist has to pick and choose the most worthwhile sites to visit. Once he or
she has arrived at the place, the tourist must be able to select the sites to visit with utmost
ease. At a particular site, if the tourist finds something very attractive, he or she will
likely allocate additional time to that site.
Now let us apply the tourist story to the data warehouse. A senior-level executive arriving
at the data warehouse for information is like a tourist visiting an interesting and useful
place. The executive has a broad business perspective and knows about the overall infor-
mation content of the data warehouse. However, the executive has no time to browse through
the data warehouse in any detailed fashion. Each executive has specific key indicators. These
are like specific sites to be visited. The executive wants to inspect the key indicators and if
something interesting is found about any of them, the executive wants to spend some more
time exploring further. The tourist has predefined expectations about each site being visited.
If a particular site deviates from these expectations, the tourist wants to ascertain the reasons
why. Similarly, if the executive finds indicators to be out of line, further investigation
becomes necessary.
Let us, therefore, summarize what the users classified as tourists need from the data
warehouse:
† Status of the indicators at routine intervals
† Capability to identify items of interest without any difficulty
† Selection of what is needed with utmost ease without wasting time in long navigation
† Ability to quickly move from one indicator of interest to another
† Wherever needed, additional information should be easily available about selected key
indicators for further exploration
352 MATCHING INFORMATION TO THE CLASSES OF USERS
384.
Operators We havelooked at some of the characteristics of users classified as operators.
This class of users is interested in the data warehouse for one primary reason. They find
the data warehouse to be the integrated source of information, not for historic data only
but for current data as well. Operators are interested in current data at a detailed level.
Operators are really monitors of current performance. Departmental managers, line
managers, and section supervisors may all be classified as operators.
Operators are interested in today’s performance and problems. They are not interested in
historical data. Being extensive users of OLTP systems, operators expect fast response times
and quick access to detailed data. How can they resolve the current bottleneck in the product
distribution system? What are the currently available alternative shipment methods and
which industrial warehouse is low on stock? Operators concern themselves with questions
like these relating to current situations. Because the data warehouse receives and stores
data extracted from disparate source systems, operators expect to find their answers there.
Note the following summary of what operators need.
† Immediate answers based on reliable current data
† Current state of the performance metrics
† Data as current as possible with daily or more frequent updates from source systems
† Quick access to very detailed information
† Rapid analysis of the most current data
† A simple and straightforward interface for information.
Farmers What do some data warehouse users and farmers have in common? Consider a
few traits of farmers. They are very familiar with the terrain. They know exactly what they
want in terms of crops. Their requirements are consistent. The farmers know how to use the
tools, work the fields, and get results. They also know the value of their crops. Now match
these characteristics with the category of data warehouse users classified as farmers.
Typically, different types of analysts in an enterprise may be classified as farmers. These
users may be technical analysts or analysts in marketing, sales, or finance. These analysts
have standard requirements. The requirements may comprise estimating profitability by
products or analyzing sales every month. Requirements rarely change. They are predictable
and routine.
Let us summarize the needs of the users classified as farmers.
† Quality data properly integrated from source systems
† Ability to run predictable queries easily and quickly
† Capability to run routine reports and produce standard result types
† Ability to obtain the same types of information at predictable intervals
† Precise and smaller result sets
† Mostly current data with simple comparisons with historical data
Explorers This class of users is different from the usual kind of routine users. Explorers
do not have set ways of looking for information. They tend to go where very few others
venture. Explorers often combine random probing with unpredictable investigation. Many
times the investigation may not lead to any results, but the few that dig up useful patterns
and unusual results produce nuggets of information that are solid gold. So the explorer con-
tinues his or her relentless search, using nonstandard procedures and unorthodox methods.
WHO WILL USE THE INFORMATION? 353
385.
In an enterprise,researchers and highly skilled technical analysts may be classified as
explorers. These users use the data warehouse in a highly random manner. The frequency
of their use is quite unpredictable. They may use the data warehouse for several days of
intense exploration and then stop using it for many months. Explorers analyze data in
ways virtually unknown to other types of users. The queries run by explorers tend to encom-
pass large data masses. These users work with lots of detailed data to discern desired
patterns. These results are elusive, but the explorers continue until they find the patterns
and relationships.
As in the other cases, let us summarize the needs of the users classified as explorers.
† Totally unpredictable and intensely ad hoc queries
† Ability to retrieve large volumes of detailed data for analysis
† Capability to perform complex analysis
† Provision for unstructured and completely new and innovative queries and analysis
† Long and protracted analysis sessions in bursts
Miners People mining for gold dig to discover precious nuggets of great value. Users
classified as miners also work in a similar manner. Before we get into the characteristics
and needs of the miners, let us compare the miners with explorers, because both are involved
in heavy analysis. Experts state that the role of the explorer is to create or suggest hypotheses,
whereas the role of the miner is to prove or disprove hypotheses. This is one way of looking at
the miner’s role. The miner works to discover new, unknown, and unsuspected patterns in
the data.
Miners are a special breed. In an enterprise, they are special purpose analysts with highly
specialized training and skills. Many companies do not have users who might be called
miners. Businesses employ outside consultants for specific data mining projects. Data
miners adopt various techniques and perform specialized analysis that discovers clusters
of related records, estimation of values for an unknown variable, grouping of products
that would be purchased together, and so on.
Here is a summary of the needs of users classified as miners:
† Access to mountains of data to analyze and mine
† Availability of large volumes of historical data going back many years
† Ability to wade through large volumes to obtain meaningful correlations
† Capability of extracting data from the data warehouse into formats suitable for special
mining techniques
† Ability to work with data in two modes: one to prove or disprove a stated hypothesis,
the other to discover hypotheses without any preconceived notions
How to Provide Information
What is the point of all this discussion about tourists, operators, farmers, explorers, and
miners? What is our goal? As part of a data warehouse project team, your objective is to pro-
vide each user exactly what that user needs in a data warehouse. The information delivery
system must be wide enough and appropriate enough to suit the entire needs of your user
community. What techniques and tools do your executives and managers need? How do
354 MATCHING INFORMATION TO THE CLASSES OF USERS
386.
your business analystslook for information? What about your technical analysts responsible
for deeper and more intense analysis? How about the knowledge worker charged with
monitoring day-to-day current operations? How are they going to interact with your data
warehouse?
In order to provide the best information delivery system, you have to find answers to
these questions. But how? Do you have to go to each individual user and determine how
he or she plans to use the data warehouse? Do you then aggregate all these requirements
and come up with the totality of the information delivery system? This would not be a
practical approach. This is why we have come up with the broad classifications of users.
If you are able to provide for these classifications of users, then you cover almost all of
your user community. Maybe in your enterprise there are no data miners yet. If so, you do
not have to cater to this group at the present time.
We have reviewed the characteristics of each class of users. We have also studied the
needs of each of these classes, not in terms of the specific information content, but how
and in what ways each class needs to interact with the data warehouse. Let us now turn
our attention to the most important question: how to provide information.
Study Figure 14-6 very carefully. This figure describes three aspects of providing infor-
mation to the five classes of users. The architectural implications state the requirements
relating to components such as metadata and user–information interface. These are broad
architectural needs. For each user class, the figure indicates the types of tools most useful
for that class. These specify the types. When you select vendors and tools, you will use
this as a guide. The “other considerations” listed in the figure include design issues, special
techniques, and any out-of-the-ordinary technology requirements.
Architectural
Implications
Tool
Features
Other
Considerations
Tourists Operators Farmers Explorers Miners
Strong Metadata
interface
including key
word search.
Web-enabled user
interface.
Customized for
individual needs.
Intuitive
navigation.
Ability to provide
interface through
special icons.
Limited drill-
down.
Very moderate
OLAP
capabilities.
Simple applica-
tions for standard
information.
Fast response
times.
Scope of data
content fairly
large.
Simple user
interface to get
current
information.
Simple queries
and reports.
Ability to create
simple menu-
driven
applications.
Provide key
performance
indicators
routinely
published.
Small result sets.
Reasonable
response times.
Multidimensional
data models with
business
dimensions and
metrics.
Standard user
interface for
queries and
reports.
Ability to create
reports.
Limited drill-
down.
Routine analysis
with definite
results.
Usually work
with summary
data.
Reasonable
response times.
Normalized data
models.
Special
architecture
including an
exploration
warehouse useful.
Provision for
large queries on
huge volumes of
detailed data.
A variety of tools
to query and
analyze.
Support for long
analysis sessions.
Usually large
result sets for
study and further
analysis.
Special data
repositories
getting data feed
from the
warehouse.
Normalized data
models.
Detailed data,
summarized used
hardly ever.
Range of special
data mining tools,
statistical analysis
tools, and data
visualization
tools.
Discovery of
unknown patterns
and relationships.
Ability to
interpret results.
Figure 14-6 How to provide information.
WHO WILL USE THE INFORMATION? 355
387.
INFORMATION DELIVERY
In allof our deliberations up to now, you have come to realize that there are four underlying
methods for information delivery. You may be catering to the needs of any class of users.
You may be constructing the information delivery system to satisfy the requirements of
users with simple needs or those of power users. Still the principal means of delivery are
the same.
The first method is the delivery of information through reports. Of course, the formats and
content could be sophisticated. Nevertheless, these are reports. The method of information
delivery through reports is a carry-over from operational systems. You are familiar with
hundreds of reports distributed from legacy operational systems. The next method is also
a perpetuation of a technique from operational systems. In operational systems, the users
are allowed to run queries in a very controlled setup. However, in a data warehouse,
query processing is the most common method for information delivery. The types of queries
run the gamut from simple to very complex. As you know, the main difference between
queries in an operational system and in the data warehouse is the extra capabilities and
openness in the warehouse environment.
The method of interactive analysis is something special in the data warehouse environ-
ment. Rarely are any users provided with such an interactive method in operational systems.
Lastly, the data warehouse is the source for providing integrated data for downstream
decision support applications. The Executive Information System is one such application.
But more specialized applications such as data mining make the data warehouse worthwhile.
Figure 14-7 shows a comparison of information delivery methods between the data
warehouse and operational systems.
The rest of this section is devoted to special considerations relating to these four
methods. We will highlight some basic features of the reporting and query environments
and provide details to be taken into account while designing these methods of
information delivery.
User-driven
queries.
Readily available
templates.
Predefined
queries.
User-driven
reporting.
Readily available
report formats.
Preformatted
reports.
Complex
queries. Long
interactive
analysis sessions.
Speed-of-thought
processing.
Saving of result
sets.
Data feed
to downstream
decision
support
applications
very
common.
Controlled, very
limited,
predefined
queries.
No ad hoc query
facility.
Predefined and
preformatted
reports through
applications.
User-driven
reporting very
rare.
No
complex query
facility.
No
interactive
analysis sessions
possible.
Data feed
to downstream
applications
rare. Only to
other operational
systems.
QUERIES APPLICATIONS
ANALYSIS
REPORTS
DATA
WAREHO
USE
OPERATIONAL
SYSTEMS
Figure 14-7 Information delivery: comparison between data warehouse and operational systems.
356 MATCHING INFORMATION TO THE CLASSES OF USERS
388.
Queries
Query management rankshigh in the provision of business intelligence from a data ware-
house. Because most of the information delivery is through queries, query management is
very important. The entire query process must be managed with utmost care. First, consider
the features of a managed query environment:
† Query initiation, formulation, and results presentation are provided on the client
machine.
† Metadata guides the query process.
† Ability for the users to navigate easily through the data structures is absolutely essential.
† Information is pulled by the users, not pushed to them.
† The query environment must be flexible to accommodate different classes of users.
Let us look at the arena in which queries are being processed. Essentially, there are three
sections in this arena. The first section deals with the users who need the query management
facility. The next section is about the types of queries themselves. Finally, you have the data
that resides in the data warehouse repository. This is the data that is used for the queries.
Figure 14-8 shows the query processing arena with the three sections. Please note the fea-
tures in each section. When you establish the managed query environment, take into account
the features and make proper provisions for them.
Let us now highlight a few important services to be made available in the managed query
environment.
Query Definition. Make it easy to translate the business need into the proper querysyntax.
Query Simplification. Make the complexity of data and query formulation transparent to
the users. Provide simple views of the data structures showing tables and attributes.
Make the rules for combining tables and structures easy to use.
DATA
QUERIES
USERS
DATA
WAREHOUSE
Simple
Complex
• User types
• Skill levels
• Number of users
• User information
needs
• Query types
• Query templates
• Complexity
• Predefined queries
• Data content
• Concurrency
• Volumes
• Responsiveness
Figure 14-8 Query processing arena.
INFORMATION DELIVERY 357
389.
Query Recasting. Evensimple-looking queries can result in intensive data retrieval and
manipulation. Therefore, provide for parsing incoming queries and recasting them to
work more efficiently.
Ease of Navigation. Use of metadata to browse through the data warehouse, easily navi-
gating with business terminology and not technical phrases.
Query Execution. Provide ability for the user to submit the query for execution without
intervention from IT.
Results Presentation. Present results of the query in a variety of ways.
Aggregate Awareness. Query processing mechanisms must be aware of aggregate fact
tables and, whenever necessary, redirect the queries to the aggregate tables for
faster retrieval.
Query Governance. Monitor and intercept runaway queries before they bring down the
data warehouse operations.
Reports
In this subsection, let us observe the significant features of the reporting environment.
Everyone is familiar with reports and how they are used. Without repeating what we already
know, let us discuss reporting services by relating these to the data warehouse.
What can you say about the overall defining aspects of a managed reporting environment?
Consider the following brief list.
† The information is pushed to the user, not pulled by the user as in the case of queries.
Reports are published and the user subscribes to what he or she needs.
† Compared to queries, reports are inflexible and predefined.
† Most of the reports are preformatted and, therefore, rigid.
† The user has less control over the reports received than the queries he or she can
formulate.
† A proper distribution system must be established.
† Report production normally happens on the server machine.
While constructing the reporting environment for your data warehouse, use the following
as guidelines:
Set of Preformatted Reports. Provide a library of preformatted reports with clear descrip-
tions of the reports. Make it easy for users to browse through the library and select the
reports they need.
Parameter-Driven Predefined Reports. These give the users more flexibility than pre-
formatted ones. Users must have the capability to set their own parameters and ask
for page breaks and subtotals.
Easy-to-Use Report Development. When users need new reports in addition to prefor-
matted or predefined reports, they must be able to develop their own reports easily
with a simple report-writer facility.
Execution on the Server. Run the reports on the server machine to free the client
machines for other modes of information delivery.
358 MATCHING INFORMATION TO THE CLASSES OF USERS
390.
Report Scheduling. Usersmust be able to schedule their reports at a specified time or
based on designated events.
Publishing and Subscribing. Users must have options to publish the reports they have
created and allow other users to subscribe and receive copies.
Delivery Options. Provide various options to deliver reports, including mass distribution,
e-mail, the Web, automatic fax, and so on. Allow users to choose their own methods
for receiving the reports.
Multiple Data Manipulation Options. Allow the users to ask for calculated metrics,
pivoting of results by interchanging the column and row variables, adding subtotals
and final totals, changing the sort orders, and showing stoplight-style thresholds.
Multiple Presentation Options. Provide a rich variety of options, including graphs,
tables, columnar formats, cross-tabs, fonts, styles, sizes, and maps.
Administration of Reporting Environment. Ensure easy administration to schedule,
monitor, and resolve problems.
Analysis
Who are the users seriously interested in analysis? Business strategists, market researchers,
product planners, production analysts—in short, all the users we have classified as explorers.
Because of its rich historical data content, the data warehouse is very well suited for analysis.
It provides these users with the means to search for trends, find correlations, and discern
patterns.
In one sense, an analysis session is nothing but a session of a series of related queries. The
user might start off with an initial query: What are the first quarter sales totals for this year
by individual product lines? The user looks at the numbers and is curious about the sag in
the sales of two of these product lines. The user then proceeds to drill down by individual
products in those two product lines. The next query is for a breakdown by regions and
then by districts. The analysis continues with comparison with the first quarterly sales of
the two prior years. In analysis, there are no set predefined paths. Queries are formulated
and executed at the speed of thought.
We have already covered the topic of query processing. Any provisions for query man-
agement apply to the queries executed as part of an analysis session. One significant differ-
ence is that each query in an analysis session is linked to the previous one. The queries in an
analysis session form a linked series. Analysis is an interactive exercise.
Analysis can become extremely complex, depending on what the explorer is after. The
explorer may take several steps in a winding navigational path. Each step may call for
large masses of data. The data joins may involve several constraints. The explorer may
want to view the results in many different formats and grasp the meaning of the results.
Complex analysis falls in the domain of online analytical processing (OLAP). The next
chapter is totally devoted to OLAP. There we will discuss complex analysis in detail.
Applications
A decision support application in relation to the data warehouse is any downstream system
that gets its data feed from the data warehouse. In addition to letting the users access the
data content of the warehouse directly, some companies create specialized applications for
specific groups of users. Companies do this for various reasons. Some of the users may
INFORMATION DELIVERY 359
391.
not be comfortablebrowsing through the data warehouse and looking for specific informa-
tion. If the required data is extracted from the data warehouse at periodic intervals
and specialized applications are built using the extracted data, these users have their
needs satisfied.
How are the downstream applications different from an application driven with data
extracted directly from the operational systems? Building an application with data from
the warehouse has one major advantage. The data in the data warehouse is already consoli-
dated, integrated, transformed, and cleansed. Any decision support applications built using
individual operational systems directly may not have the enterprise view of the data.
A downstream decision support application may just start out to be nothing more than
a set of preformatted and predefined reports. You add a simple menu for the users to
select and run the reports and you have an application that may very well be useful to a
number of your users. Executive Information Systems (EIS) are good candidates for down-
stream applications. EIS built with data from the warehouse proves to be superior to its
counterparts of more than a decade ago when EIS were based on data directly from oper-
ational systems.
A more recent development is data mining, a major type of application that may get data
feeds from the data warehouse. With more vendor products on the market to support
data mining, this application has become more and more prevalent. Data mining deals
with knowledge discovery. Refer to Chapter 17 for detailed coverage of data mining basics.
INFORMATION DELIVERY TOOLS
As we have indicated earlier, the success of your data warehouse rides on the strengths of
the information delivery tools. If the tools are effective, usable, and enticing, your users
will come to the data warehouse often. You have to select the information delivery tools
with great care and thoroughness. We will discuss this very important consideration in detail.
Information delivery tools come in different formats to serve various purposes. The prin-
cipal class of tools comprises query or data access tools. This class of tools enables users to
define, formulate, and execute queries and obtain results. Other types are the report writers or
reporting tools for formatting, scheduling, and running reports. Other tools specialize in
complex analysis. A few tools combine the different features so that your users may learn
to use a single tool for queries and reports. More commonly, you will find more than one
information delivery tool used in a single data warehouse environment.
Information delivery tools typically perform two functions: they translate the user
requests for queries or reports into SQL statements and send these to the DBMS; they receive
results from the data warehouse DBMS, format the result sets in suitable outputs, and present
the results to the users. Usually, the requests to the DBMS retrieve and manipulate large
volumes of data. Compared to the volumes of data retrieved, the result sets contain much
less data.
The Desktop Environment
In the client-server computing architecture, information delivery tools run in the desktop
environment. Users initiate the requests on the client machines. When you select the
query tools for your information delivery component, you are choosing software to run
on the client workstations. What are the basic categories of information delivery tools?
360 MATCHING INFORMATION TO THE CLASSES OF USERS
392.
Grouping the toolsinto basic categories broadens your understanding of what types of tools
are available and what types you need for your users.
Let us examine the array of information delivery tools you need to consider for selection.
Study Figure 14-9 carefully. This figure lists the major categories for the desktop environ-
ment and summarizes the use and purpose of each category. Note the purpose of each
category. The usage and functions of each category of tools help you match the categories
with the classes of users.
Methodology for Tool Selection
Because of the enormous importance of the information delivery tools in a data warehouse
environment, you must have a well thought out, formalized methodology for selecting the
appropriate tools. A set of tools from certain vendors may be the best for a given environ-
ment, but the same set of tools could be a total disaster in another data warehouse environ-
ment. There is no one-size-fits-all proposition in the tool selection. The tools for your
environment are for your users and must be the most suitable for them. Therefore, before
formalizing the methodology for selection, do reconsider the requirements of your users.
Who are your users? At what organizational levels do they perform? What are the levels
of their computing proficiency? How do they expect to interact with the data warehouse?
What are their expectations? How many tourists are there? Are there any explorers at all?
Ask all the pertinent questions and examine the answers.
Among the best practices in data warehouse design and development, a formal method-
ology ranks among the top. A good methodology certainly includes your user representa-
tives. Make your users part of the process. Otherwise your tool selection methodology is
TOOL CATEGORY PURPOSE AND USAGE
Ad Hoc Query
Preformatted
Reporting
Complex
Analysis
Knowledge
Discovery
DSS
Applications
Enhanced
Reporting
Managed Query
Application
Builder
Query templates and predefined queries. Users supply input parameters.
Users can receive results on GUI screens or as reports.
Users can define the information needs and compose their own queries.
May use complex templates. Results on screen or reports.
Users input parameters in predefined report formats and submit report jobs
to be run. Reports may be run as scheduled or on demand.
Users can create own reports using report writer features. Used for special
reports not previously defined. Reports run on demand.
Users write own complex queries. Perform interactive analysis usually in
long sessions. Store intermediate results. Save queries for future use.
Pre-designed standard decision support applications. May be customized.
Example: Executive Information System. Data from the warehouse.
Software to build simple downstream applications for decision support
applications. Proprietary language component. Usually menu-driven.
Set of data mining techniques. Tools used to discover patterns and
relationships not apparent or previously known.
Figure 14-9 Information delivery: the desktop environment.
INFORMATION DELIVERY TOOLS 361
393.
doomed to failure.Have the users actively involved in setting the criteria for the tools and
also in the evaluation activity itself. Apart from considerations of user preferences, technical
compatibility with other components of the data warehouse must also be taken into account.
Do not overlook technical aspects.
A good formal methodology promotes a staged approach. Divide the tool selection
process into well-defined steps. For each step, declare the purpose and state the activities.
Estimate the time needed to complete each step. Proceed from one stage to the next stage.
The activities in each stage depend on the successful completion of the activities in the
previous stage. Figure 14-10 illustrates the stages in the process for selecting information
delivery tools.
The formal methodology you come up with for the selection of tools for your environ-
ment must define the activities in each stage of the process. Examine the following list
suggesting the types of activities in each stage of the process. Use this list as a guide.
Form a Tool Selection Team. Include about four or five persons on the team. Because
information delivery tools are important, ensure that the executive sponsor is part of
the team. User representatives from the primary subject areas must be on the team.
They will provide the user perspective and act as subject matter experts. Have someone
experienced with information delivery tools on the team. If the data warehouse admin-
istrator is experienced in this area, let that person lead the team and drive the selection
process.
Reassess User Requirements. Review the user requirements, not in a general way, but
specifically in relation to information delivery. List the classes of users and put each
potential user in the appropriate class. Describe the expectations and needs of each
of your classes. Document the requirements so that you can match these up with the
features of potential tools.
Select Team
Review Requirements
Define Criteria
Research Tools/Vendors
Prepare Long List
Get More Information
Select Top Three
Attend Product Demos
IT to Complete Evaluation
User to Complete Evaluation
Make Final Selection
BEGIN
FINISH
CONTINUE
CONTINUE
1
10
11
2
3
4
5
6
7
8
9
Figure 14-10 Information delivery tools: methodology for selection.
362 MATCHING INFORMATION TO THE CLASSES OF USERS
394.
Stipulate Selection Criteria.For each broad group of tools such as query tools or
reporting tools, specify the criteria. See the following subsection on Tool Selection
Criteria.
Research Available Tools and Vendors. This stage can take a long time, so it is better
to get a head start on this stage. Obtain product literature from the vendors. Trade
shows can help for getting a first glimpse of potential tools. The Data
Warehousing Institute is another good source. Although there are a few hundred
tools on the market, narrow the list down to about 25 or less for preliminary research.
At this stage, concentrate primarily on the functions and features of the tools on
your list.
Prepare a Long List for Consideration. This follows from the research stage. Your
research will result in the preliminary or long list of potential tools for consideration.
For each tool on the preliminary list, document the functions and features. Also, note
how these functions and features would match with the requirements.
Obtain Additional Information. In this stage, you want to do additional and more inten-
sive research on the tools on your preliminary list. Talk to the vendors. Contact the
installations the vendors suggest to you as references.
Select the Top Three Tools. Select the top three tools as possible candidates. If you are
not very sure of the final outcome, choose more, but not more than five, because if you
have another long list, it will take a lot longer to go through the rest of the selection
process.
Attend Product Demonstrations. Now you want to know as much as possible about the
tools on the short list. Call the vendors in for product demonstrations. You may go to
the vendor sites if your computing configuration is not ready for the selected tools. Ask
questions. During the demonstrations, constantly try to match the functions of the tools
with the requirements of your users.
Complete Evaluation by IT. IT makes a separate evaluation, mainly for technical compat-
ibility with your computing environment. Test features such as connectivity with your
DBMS. Verify scalability.
Complete Evaluation by Users. This is a critical stage. User testing and acceptance is
very important. Do not cut this stage short. This stage consists of a sufficient
number of hands-on sessions. If it is feasible to prototype the actual usage, do so
by all means. Especially if two products match the requirements to about the same
extent, prototyping may bring out the essential differences.
Make the Final Selection. You are about ready to make the final selection. This stage
gives you a chance to reevaluate the tools that come very close to the requirements.
Also, in this stage check out the vendors. The tools may be excellent. But the current
vendor could have acquired the tool from another company and the technical support
may be inadequate. Or, the vendor may not be stable and enduring. Verify all the
relevant issues about the vendor. Make the final selection, keeping the users in the
loop all the while.
As you might have already realized, the tool selection process can be intense and may take
a considerable length of time. Nevertheless, it must not be taken lightly. It is advisable to
proceed in distinct stages, keeping the users involved from the beginning to the end of the
process.
INFORMATION DELIVERY TOOLS 363
395.
Let us endthis subsection with the following practical tips:
† Nominate an experienced member of the team or the data warehouse administrator to
lead the team and drive the process.
† Keep your users totally involved in the process.
† There is no substitute for hands-on evaluation. Do not be satisfied with just vendor
demonstrations. Try the tools yourself.
† Consider prototyping a few typical information delivery interactions. Will the tool
stand up to the load of multiple users?
† It is not easy to combine tools from multiple vendors.
† Remember, an information delivery tool must be compatible with the data warehouse
DBMS.
† Continue to keep metadata considerations in the forefront.
Tool Selection Criteria
From the discussions on the needs of each class of users, you must have understood the
criteria for selecting information delivery tools. For example, we referred to explorers and
their need for complex analysis. This tells us that the tools for explorers must possess features
suitable for performing complex analysis. For tourists, the tools must be easy and intuitive.
By now, you have a reasonable insight into the criteria for selecting the information delivery
tools. You have a good grasp of the criteria for selecting tools in the three main areas of
information delivery, namely, reporting, queries, and analysis.
Let us now bring our thoughts together and provide a list of general criteria for selecting
information delivery tools. This list is applicable to all three areas. You may use the list as a
guide and prepare your own checklist that is specific to your environment.
Ease of Use. This is perhaps the most important way to make your users happy. Ease
of use is specifically required for query creation, report building, and presentation
flexibility.
Performance. Although system performance and response times are less critical in a data
warehouse environment than in an OLTP system, still they rank high on the list of user
requirements. Need for acceptable performance spans not only the information deliv-
ery system, but the entire environment.
Compatibility. The features of the information delivery tool must be exactly suited to the
class of users it is intended for. For example, OLAP capability is not compatible with
the class of users called tourists, nor are preformatted reports the precise requirement of
explorers.
Functionality. This is an extension of compatibility. The profile of every user class
demands certain indispensable functions in the tool. For example, miners need a
full range of functions from data capture through discovery of unknown patterns.
Integrated. More commonly, querying, analyzing, and producing reports may be tied
together in one user session. The user may start with an initial query whose results
lead to drilling down or other forms of analysis. At the end of the session, the user
is likely to capture the final result sets in the form of reports. If this type of usage is
364 MATCHING INFORMATION TO THE CLASSES OF USERS
396.
common in yourenvironment, your information delivery tool must be able to integrate
different functions.
Tool Administration. Centralized administration makes the task of the information deliv-
ery administrator easy. The tool must come with utility functions to configure and
control the information delivery environment.
Web-Enabled. The Internet has become our window into the world. Today’s data ware-
houses have a big advantage over the ones built before Web technology became
popular. It is important for the information delivery tool to be able to publish Web
pages over the Internet and your company’s intranet.
Data Security. In most enterprises, safeguarding the warehouse data is as critical as pro-
viding security for data in operational systems. If your environment is a data-sensitive
one, the information delivery tools must have security features.
Data Browsing Capability. The user must be able to browse the metadata and review the
data definitions and meanings. Also, the tool must present data sets as GUI objects on
the screen for the user to choose by clicking on the icons.
Data Selector Ability. The tool must provide the user with the means for constructing
queries without having to perform specific joins of tables using technical terminology
and methods.
Database Connectivity. The ability to connect to any of the leading database products is
an essential feature needed in the information delivery tool.
Presentation Feature. It is important for the tool to present the result sets in a variety of
formats, including texts, tabular formats, charts, graphs, maps, and so on.
Scalability. If your data warehouse is successful, you can be sure of a substantial increase
in the number of users within a short time, as well as a marked expansion in the com-
plexity of the information requests. The information delivery tool must be scalable to
handle the larger volumes and extra complexity of the requests.
Vendor Dependability. As the data warehousing market matures you will notice many
mergers and acquisitions. Also, some companies are likely to go out of business.
The selected tool may be the best suited for your environment, but if the vendor is
not stable, you may want to rethink your selection.
Information Delivery Framework
It is time for us to sum up everything we have discussed in this chapter. We classified the
users and came up with standard classes of users. These are the classes into which you can
fit every group of your users. Each class of users has specific characteristics when it comes
to information delivery from the data warehouse. Classification of the users leads us to
formalizing the information needs of each class. Once you understand what each class
of users needs, you are able to derive the ways in which you must provide information
to these classes. Our discussions moved on to the standard methods of information deliv-
ery and to the selection of information delivery tools. Figure 14-11 summarizes the dis-
cussions. The figure shows the classes of users. It indicates how the various users in
the enterprise fit into this classification. The figure also matches each class of users
with the common tool categories appropriate for the class. The figure brings everything
together.
INFORMATION DELIVERY TOOLS 365
397.
INFORMATION DELIVERY: SPECIALTOPICS
So far in this chapter we have covered a lot of ground on information delivery to the users.
Provision of business intelligence from the datawarehouse necessarily depends on the classes
of users the data warehouse services. In this chapter, we reviewed, in detail, methods for clas-
sifying users. The classifications provided you great insight into the needs of the users.
You were able to see how the traditional information delivery methods of queries and
reports may be adapted to satisfy the needs of the different classes of users. You were also
able to notice the role of interactive analysis and down-stream decision support applications.
Further, you were able to appreciate the usage and applicability of tools for information
delivery.
We now want to turn our attention to two new trends in the demand and delivery of
business intelligence. During the early years of data warehousing, the updates to the data
warehouse were performed overnight, primarily in batch mode. And, usage of information
from the data warehouse was mainly meant for strategic decision making, not for operational
tasks. Now, the two new trends are real time business intelligence and pervasive business
intelligence. Now the need is to update the data warehouses in real time. This is real time
business intelligence. Also, the need is to make information available to a much larger popu-
lation in the organization than anticipated earlier. This is pervasive business intelligence.
Business Activity Monitoring (BAM)
In recent years real-time business intelligence has gained a lot of ground. One way of provi-
ding real-time BI is to adapt the traditional data warehouse to be populated faster in real-time
or near real-time instead of doing it overnight through batch ETL. However, a second
approach is to provide means for business activity monitoring through middleware solutions
using Web services or such monitoring methods. These software monitors or intelligent
FARMERS
EXPLORERS
OPERATORS
MINERS
TOURISTS
DATA
WAREHOUSE
Executives/
Sr. Managers
Support
staff
Managers/
Analysts
Skilled
analysts
Special
purpose
analysts
Tools
Ad Hoc
Query/
Complex
Analysis/
App.
Builder
Tools
Managed
Query/
Pre-
formatted
Reporting
Tools
Ad Hoc
Query/
Enhanced
Reporting/
Managed
Query
Tools
DSS
Applications
(EIS)/
Managed
Query
Tools
Knowledge
Discovery
(Data
Mining)
Figure 14-11 Information delivery framework.
366 MATCHING INFORMATION TO THE CLASSES OF USERS
398.
agents may beoutside the data warehouse to recognize key events and measure key processes
in operational systems in real time.
Although BAM may be outside the traditional data warehouse per se, it provides business
intelligence to interested users. Therefore, we want to include BAM in the overall scheme of
information delivery and consider a few of its aspects.
BAM is based on the notions of zero-latency and straight-through processing. Latency
refers to the time-lag between when data is collected and when the resulting business
intelligence is made available to the users. In straight-through processing inefficient inter-
mediary steps are avoided.
BAM Features These are real-time systems that alert decision makers to imminent
problems and to potential opportunities. Data is collected from internal and external sources
in real time, analyzed on the fly for specific patterns, and results are delivered to those who
need to act immediately. Generally these users dependent on BAM solutions include line
executives, departmental managers, financial officers, and heads of divisional facilities
such as a factory or a warehouse.
BAM Technologies Include (1) ETL to gather data from multiple sources, (2) process
modeling to scope out relevant processes and activities, (3) rules engines to spot and recog-
nize pertinent events in the activities, and (4) delivery mechanisms such as e-mails, portals,
Web services, dashboards, and so on.
BAM Benefits BAM empowers decision makers to quickly recognize critical events,
respond promptly, and review results of timely actions. The most important benefit is
real-time access to usable business intelligence in suitable formats. BAM tools enable
decision makers to quickly model the problem, collaborate for action, weigh solution alterna-
tives, and make faster and presumably better decisions. Further, real-time BI systems such
as BAM may be made to interact directly with business applications. For example, if the
inventory level of a product falls below a set threshold in a supply chain management
(SCM) application, BAM can initiate replenishment of the inventory. Again, in a customer
relationship management (CRM) application as soon as a customer places a substantially
large online order, BAM can initiate intensive credit verification.
Dashboards and Scorecards
During the past five years or so, organizations have seriously begun to deploy dashboards
and scorecards as their preferred mode of delivering business intelligence. Pervasive data
warehousing and business intelligence became the catch phrases because the need to deliver
operational, tactical, and strategic information was keenly felt. Further, organizations want
to provide such information to large groups of users in real time.
Many organizations find their need fulfilled through what are known as dashboards and
scorecards. Wayne Eckerson (2005), a leading researcher and business intelligence expert at
the Data Warehousing Institute, writes, “In many ways, dashboards and scorecards represent
the culmination of business intelligence.” He continues, “To borrow a term from the tele-
communications industry, dashboards and scorecards represent the ‘last mile’ of wiring
that connects users to the data warehousing and analytical infrastructure that organizations
have created during the past decade.” Dashboards and scorecards greatly promote perform-
ance visibility and effectiveness. They provide visual displays of significant, consolidated
information, nicely arranged and well presented on a single screen. With a single sweeping
INFORMATION DELIVERY: SPECIAL TOPICS 367
399.
Measures performance
Specialists, supervisors
“Right-time”feeds
Events
Visual graphs, raw data
Charts progress
Executives, managers, staff
Periodic snapshots
Summaries
Visual graphs, textual comments
DASHBOARD SCORECARD
PURPOSE
USERS
UPDATES
DATA
DISPLAY
Source: W. Eckerson, Performance Dashboards, Wiley, Hoboken, NJ, 2006
Figure 14-12 Differences between dashboards and scorecards.
Figure 14-13 Dashboard example: nationwide sales monitoring.
368 MATCHING INFORMATION TO THE CLASSES OF USERS
400.
Figure 14-14 Dashboardexample: airline executive management.
Sales
(s)
Sales
(s)
Total Sales
0
303,541
2003 Sep
0
287,505
575,010
862,915
1,150,020
1,437,525
1,725,030
2,012,535
2,587,545
2,300,040
2,875,050
Oct Nov Dec
Month
Jan Feb
2004
Time
2005
407,082
910,623
1,214,154
1,517,705
1,921,246
2,124,787
2,428,328
North America Latin America
Europe Asia pacific
Yearly sales 6 Month Rolling Sales Trend
Figure 14-15 Dashboard example: executive sales.
INFORMATION DELIVERY: SPECIAL TOPICS 369
401.
glance user canobtain the gist of the presentation and explore the contents further. However,
although dashboards and scorecards have much in common, some organizations do not
fully comprehend the differences between them. Even in some trade journals the
distinction is not clearly made.
Figure 14-16 Scorecard example: healthcare, cost and people.
Figure 14-17 Scorecard example: healthcare, productivity and patient service.
370 MATCHING INFORMATION TO THE CLASSES OF USERS
402.
Dashboards tell userswhat they are doing; scorecards tell them how well they are doing.
Dashboards provide real-time readouts of various aspects of business performance as events
occur. These are intended to inform, warn, caution, and alert users in a manner similar to
an automobile dashboard. Scorecards, on the other hand, provide periodic snapshots of per-
formance results. These measure business activities as compared to predefined targets and
objectives. Figure 14-12 highlights the differences between dashboards and scorecards.
Dashboards These are designed to produce maximum visual impact with optimal
arrangement of information for quick absorption. The display usually shows a combina-
tion of tables, graphs, dials, stoplights, gauges, threshold charts, odometers, and so on.
Most dashboards allow the users to set parameters and select which pieces of information
they would like to view. Dashboards are also presented as cascading dashboards from one
view to another. Users may work with dashboards interactively. As dashboards have
gained importance for information delivery, we have included three examples of dashboards.
See Figures 14-13, 14-14, and 14-15.
Scorecards These are designed to provide visual representation of key performance indi-
cators (KPIs). KPIs are preselected metrics intended to measure and manage performance.
Scorecards display actual values of the KPIs at selected intervals as compared to targets or
past periods. Figures 14-16 and 14-17 display two examples of scorecards for a healthcare
organization.
CHAPTER SUMMARY
† Information content and usage in a data warehouse differ greatly from those in oper-
ational systems.
† The data warehouse possesses enormous information potential for the overall enter-
prise management as well as for individual business areas.
† You realize the information potential of the data warehouse through an effective
user–information interface.
† Who will use the information? Understand the various users and their needs. The users
maybeclassifiedintointerestgroupsoftourists,operators,farmers,explorers,andminers.
† Provide information to each class according to its needs, skills, and business
background.
† Queries, reports, analysis, and applications form the basis for information delivery.
Each class of users needs variations of these information delivery methods.
† The success of your data warehouse rides on the effectiveness of the end-user infor-
mation delivery tools. Carefully choose the tools by applying proven selection criteria.
† Dashboards and scorecards are gradually becoming preferred means of delivering
business intelligence.
REVIEW QUESTIONS
1. How does the data warehouse differ from an operational system in usage and value?
2. Explain briefly how the information from the data warehouse promotes customer
relationship management.
REVIEW QUESTIONS 371
403.
3. What arethe two basic modes of usage of information from the data warehouse? Give an
example for each mode.
4. List any five essential features necessary for the user–information interface.
5. Who are the power users? How do power users expect to use the data warehouse?
6. Who are the users classified as farmers? Name any three characteristics of this class of
data warehouse users.
7. List any four essential features of a managed query environment.
8. List any four essential features of a managed reporting environment.
9. List and explain five criteria for selecting information delivery tools for your data
warehouse.
10. Describe in less than four sentences your understanding of the information delivery
framework.
EXERCISES
1. Match the columns:
1. information discovery mode
2. data warehouse tourists
3. query recasting
4. data warehouse explorers
5. downstream application
6. overall enterprise management
7. verification mode
8. casual user
9. data warehouse miners
10. queries
A. EIS
B. needs intuitive interface
C. plan, execute, assess
D. confirm hypothesis
E. information pull technique
F. analyze large data volumes
G. need status of indicators
H. highly random access
I. parse and improve query
J. data mining
2. Compare the usage and value of information in the data warehouse with those in oper-
ational systems. Explain the major differences. Discuss and give examples.
3. Examine the potential users of your data warehouse. Can you classify the users into
casual users, regular users, and power users? If this method of simple classification is
inadequate, discuss how your users may be classified.
4. Among the potential users in your data warehouse, whom can you classify as tourists?
What are the characteristics of these tourists? How can you provide information for the
tourists in your organization?
5. What do you understand about the information delivery framework in the data warehouse
environment? As an end-user information delivery specialist, discuss how you will
establish such a framework for a healthcare maintenance organization (HMO).
372 MATCHING INFORMATION TO THE CLASSES OF USERS
404.
CHAPTER 15
OLAP INTHE DATA WAREHOUSE
CHAPTER OBJECTIVES
† Perceive the unqualified demand for online analytical processing (OLAP) and under-
stand what drives this demand
† Review the major features and functions of OLAP in detail
† Grasp the intricacies of dimensional analysis and learn the meanings of hypercubes,
drill-down and roll-up, and slice-and-dice
† Examine the different OLAP models and determine which model is suitable for your
environment
† Consider OLAP implementation by studying the steps and the tools
In the earlier chapters we mentioned online analytical processing (OLAP) in passing. You
had a glimpse of OLAP when we discussed the information delivery methods. You have
some idea of what OLAP is and how it is used for complex analysis. As the name implies,
OLAP has to do with the processing of data as it is manipulated for analysis. The data
warehouse provides the best opportunity for analysis and OLAP is the vehicle for carrying
out involved analysis. The data warehouse environment is also best for data access when
analysis is carried out.
We now have the chance to explore OLAP in sufficient depth. In today’s data warehous-
ing environment, with such tremendous progress in analysis tools from various vendors, you
cannot have a data warehouse without OLAP. It is unthinkable. Therefore, throughout this
chapter, look out for the important topics in OLAP.
First, you have to perceive what OLAP is and why it is absolutely essential. This will help
you to better understand the features and functions of OLAP. We will discuss the major
features and functions so that your grasp of OLAP may be firmed up. There are two
Data Warehousing Fundamentals for IT Professionals, Second Edition. By Paulraj Ponniah
Copyright # 2010 John Wiley Sons, Inc.
373
405.
major models forOLAP. You should know which model is most suitable for your computing
and user environments. We will highlight the significance of each model, learn how to
implement OLAP in your data warehouse environment, investigate OLAP tools, and find
out how to evaluate and procure them for your users. Finally, we will discuss the imple-
mentation steps for OLAP.
DEMAND FOR ONLINE ANALYTICAL PROCESSING
Recall our discussions in Chapter 2 of the top-down and bottom-up approaches for building
a data warehouse. In the top-down approach, you build the overall corporate-wide data
repository using the entity-relationship (E-R) data modeling technique. This enterprise-
wide data warehouse feeds the departmental data marts that are designed using the dimen-
sional modeling technique. In the bottom-up approach, you build several data marts using
the dimensional modeling technique and the collection of these data marts forms the data
warehouse environment for your company. Each of these two approaches has its advantages
and shortcomings.
You also learned about a practical approach to building a conglomeration of supermarts
with conformed and standardized data content. While adopting this approach, first you
plan and define the requirements at the corporate level, build the infrastructure for the com-
plete warehouse, and then implement one supermart at a time in a priority sequence. The
supermarts are designed using the dimensional modeling technique.
As we have seen, a data warehouse is meant for performing substantial analysis using the
available data. The analysis leads to strategic decisions that are the major reasons for building
data warehouses in the first place. For performing meaningful analysis, data must be cast in a
way suitable for analysis of the values of key indicators over time along business dimensions.
Data structures designed using the dimensional modeling technique support such analysis.
In the three approaches referred to above, the data marts rest on the dimensional model.
Therefore, these data marts must be able to support dimensional analysis. In practice, these
data marts seem to be adequate for basic analysis. However, in today’s business conditions,
we find that users need to go beyond such basic analysis. They must have the capability to
perform far more complex analysis in less time. Let us examine how the traditional methods
of analysis provided in a data warehouse are not sufficient and perceive what exactly is
demanded by the users to stay competitive and to expand.
Need for Multidimensional Analysis
Let us quickly review the business model of a large retail operation. If you just look at daily
sales, you soon realize that the sales are interrelated with many business dimensions. The
daily sales are meaningful only when they are related to the dates of the sales, the products,
the distribution channels, the stores, the sales territories, the promotions, and a few more
dimensions. Multidimensional views are inherently representative of any business model.
Very few models are limited to three dimensions or less. For planning and making strategic
decisions, managers and executives probe into business data through scenarios. For example,
they compare actual sales against targets and against sales in prior periods. They examine the
breakdown of sales by product, by store, by sales territory, by promotion, and so on.
Decision makers are no longer satisfied with one-dimensional queries such as “How
many units of product A did we sell in the store in Edison, New Jersey?” Consider the
374 OLAP IN THE DATA WAREHOUSE
406.
following more usefulquery: “How much revenue did the new product X generate during
the last three months, broken down by individual months, in the south central territory, by
individual stores, broken down by promotions, compared to estimates, and compared to
the previous version of the product?” The analysis does not stop with this single multi-
dimensional query. The user continues to ask for further comparisons to similar products,
comparisons among territories, and views of the results by rotating the presentation between
columns and rows.
For effective analysis, your users must have easy methods of performing complex analy-
sis along several business dimensions. They need an environment that presents a multi-
dimensional view of data, providing the foundation for analytical processing through easy
and flexible access to information. Decision makers must be able to analyze data along
any number of dimensions, at any level of aggregation, with the capability of viewing results
in a variety of ways. They must have the ability to drill down and roll up along the hierarchies
of every dimension. Without a solid system for true multidimensional analysis, your data
warehouse is incomplete.
In any analytical system, time is a critical dimension. Hardly any query is executed with-
out having time as one of the dimensions along which analysis is performed. Further, time
is a unique dimension because of its sequential nature—November always comes after
October. Users monitor performance over time, as for example, performance this month
compared to last month, or performance this month compared with performance the same
month last year.
Another point about the uniqueness of the time dimension is the way in which the hier-
archies of the dimension work. A user may look for sales in March and may also look for
sales for the first four months of the year. In the second query for sales for the first four
months, the implied hierarchy at the next higher level is an aggregation taking into account
the sequential nature of time. No user looks for sales of the first four stores or the last three
stores. There is no implied sequence in the store dimension. True analytical systems must
recognize the sequential nature of time.
Fast Access and Powerful Calculations
Whether a user’s request is for monthly sales of all products along all geographical regions or
for year-to-date sales in a region for a single product, the query and analysis system must
have consistent response times. Users must not be penalized for the complexity of their
analysis. Both the size of the effort to formulate a query or the amount of time to receive
the result sets must be consistent irrespective of the query types.
Let us take an example to understand how speed of the analysis process matters to users.
Imagine a business analyst looking for reasons why profitability dipped sharply in recent
months in the entire enterprise. The analyst starts this analysis by querying for the overall
sales for the last five months for the entire company, broken down by individual months.
The analyst notices that although the sales do not show a drop, there is a sharp reduction
in profitability for the last three months. The analysis proceeds further when the analyst
wants to find out which countries show reductions. The analyst requests a breakdown of
sales by major worldwide regions and notes that the European region is responsible for
the reduction in profitability. Now the analyst senses that clues are becoming more pro-
nounced and looks for a breakdown of the European sales by individual countries. The ana-
lyst finds that the profitability has increased for a few countries, decreased sharply for some
other countries, and been stable for the rest. At this point, the analyst introduces another
DEMAND FOR ONLINE ANALYTICAL PROCESSING 375
407.
dimension into theanalysis. Now the analyst wants the breakdown of profitability for the
European countries by country, month, and product. This step brings the analyst closer
to the reason for the decline in the profitability. The analyst observes that the countries in
the European Union (EU) show very sharp declines in profitability for the last two
months. Further queries reveal that manufacturing and other direct costs remain at the
usual levels but the indirect costs have shot up. The analyst is now able to determine that
the decline is due to the additional tax levies on some products in the EU. The analyst
has also determined the exact effect of the levies so far. Strategic decisions follow on
how to deal with the decline in profitability.
Now look at Figure 15-1 showing the steps through the single analysis session. How
many steps are there? Many steps, but one single analysis session with a necessary continu-
ous train of thought. Each step in this train of thought constitutes a query. The analyst for-
mulates each query, executes it, waits for the result set to appear on the screen, and studies the
result set. Each query is interactive because the result set from one query forms the basis for
the next query. In this manner of querying, the user cannot maintain the train of thought
unless the momentum is preserved. Fast access is absolutely essential for an effective analyti-
cal processing environment.
Did you notice that none of the queries in the above analysis session included any serious
calculations? This is not typical. In a real-world analysis session, many of the queries require
calculations, sometimes complex calculations. What is the implication here? An effective
analytical processing environment must not only be fast and flexible, but it must also support
complex and powerful calculations.
Sharp enterprise-
wide
profitability dip
Sales OK,
profitability
down, last 3
months
Sharp
reduction in
European
region
Increase in a
few countries,
flat in others,
sharp decline in
some
Sharp decline in
EU countries,
last 2 months
Direct costs
OK, indirect
costs up
Additional tax
on some
products in EU.
Countrywide monthly sales for
last 5 months ???
Display of direct and indirect
costs for Euro Union countries
Breakdown of European Sales
by countries, by products ???
Breakdown of European sales
by countries ???
Monthly sales breakdown by
worldwide regions ???
Thought process based on each query result Query sequence in the analysis session
Begin
analysis
End
analysis
Figure 15-1 Query steps in an analysis session.
376 OLAP IN THE DATA WAREHOUSE
408.
What follows isa list of typical calculations that get included in the query requests:
† Roll ups to provide summaries and aggregations along the hierarchies of the
dimensions
† Drill downs from the top level to the lowest along the hierarchies of the dimensions,
in combinations among the dimensions
† Simple calculations, such as computation of margins (sales minus costs)
† Share calculations to compute the percentage of parts to the whole
† Algebraic equations involving key performance indicators
† Moving averages and growth percentages
† Trend analysis using statistical methods
Limitations of Other Analysis Methods
You now have a fairly good grip on the types of requirements of users to execute queries
and perform analysis. First and foremost, the information delivery system must be able to
present multidimensional views of the data. Then the information delivery system must
enable the users to use the data by analyzing it along multiple dimensions and their
hierarchies in a myriad of ways. And this facility must be fast. It must be possible for
users to perform complex calculations.
Let us understand why the traditional tools and methods are not up to the task when it
comes to complex analysis and calculations. What information methods are we familiar
with? Of course, the earliest method was the medium of reports. Then came spreadsheets
with all their functionality and features. SQL has been the accepted interface for retrieving
and manipulating data from relational databases. These methods are used in OLTP systems
and in data warehouse environments. Now, when we discuss multidimensional analysis
and complex calculations, how suitable are these traditional methods?
First, let us compare the characteristics of the OLTP and data warehouse environments.
When we mention the data warehouse environment here, we are not referring to heavy
multidimensional analysis and complex calculations. We are only referring to the environ-
ment with simple queries and routine reports. Figure 15-2 shows the characteristics of
the OLTP and the basic data warehouse environments as they relate to information
delivery needs.
Now consider information retrieval and manipulation in these two environments. What
are the standard methods of information delivery? These are reports, spreadsheets, and
online displays. What is the standard data access interface? SQL. Let us review these and
determine if they are adequate for multidimensional analysis and complex calculations.
Report writers provide two key functions: the ability to point and click for generating
and issuing SQL calls, and the capability to format the output reports. However, report wri-
ters do not support multidimensionality. With basic report writers, you cannot drill down to
lower levels in the dimensions. That will have to come from additional reports. You cannot
rotate the results by switching rows and columns. The report writers do not provide aggregate
navigation. Once the report is formatted and run, you cannot alter the presentation of the
result data sets.
If report writers are not the tools or methods we are looking for, how about spreadsheets
for calculations and the other features needed for analysis? Spreadsheets, when they first
appeared, were positioned as analysis tools. You can perform “what if” analysis with
DEMAND FOR ONLINE ANALYTICAL PROCESSING 377
409.
spreadsheets. When youmodify the values in some cells, the values in other related cells
automatically change. What about aggregations and calculations?
Spreadsheets with their add-in tools can perform some forms of aggregations and also
do a variety of calculations. Third-party tools have also enhanced spreadsheet products
to present data in three-dimensional formats. You can view rows, columns, and pages on
spreadsheets. For example, the rows can represent products, the columns represent stores,
and the pages represent the time dimension in months. Modern spreadsheet tools offer
pivot tables or n-way cross-tabs.
Even with enhanced functionality using add-ins, spreadsheets are still very cumbersome
to use. Take an analysis involving the four dimensions of store, product, promotion,
and time. Let us say each dimension contains an average of five hierarchical levels. Now
try to build an analysis to retrieve data and present it as spreadsheets showing all the aggre-
gation levels and multidimensional views, and also using even simple calculations. You can
very well imagine how much effort it would take for this exercise. Now what if your user
wants to change the navigation and do different roll ups and drill downs. The limitations
of spreadsheets for multidimensional analysis and complex calculations are quite evident.
Let us now turn our attention to SQL (Structured Query Language). Although it might
have been the original goal of SQL to be the end-user query language, now everyone
agrees that the language is too abstruse even for sophisticated users. Third-party products
attempt to extend the capabilities of SQL and hide the syntax from the users. Users can
formulate their queries through GUI point-and-click methods or by using natural language
syntax. Nevertheless, SQL vocabulary is ill-suited for analyzing data and exploring relation-
ships. Even basic comparisons prove to be difficult in SQL.
Meaningful analysis such as market exploration and financial forecasting typically
involve retrieval of large quantities of data, performing calculations, and summarizing
the data on the fly. Perhaps, even the detailed analysis may be achieved by using SQL for
CHARACTERISTICS OLTP SYSTEMS DATA WAREHOUSE
Analytical capabilities
Data for a single session
Size of result set
Response time
Data granularity
Data currency
Access method
Basic motivation
Data model
Optimization of database
Update frequency
Scope of user interaction
Very low
Very limited
Small
Very fast
Detail
Current
Predefined
Collect and input data
Design for data updates
For transactions
Very frequent
Single transactions
Moderate
Small to medium size
Large
Fast to moderate
Detail and summary
Current and historical
Predefined and ad hoc
Provide information
Design for queries
For analysis
Generally read-only
Throughout data content
Figure 15-2 OLTP and data warehouse environments.
378 OLAP IN THE DATA WAREHOUSE
410.
retrievalandspreadsheetsforpresentingtheresults.Buthereisthecatch:inareal-worldanaly-
sis session, manyqueries follow one after the other. Each query may translate into a numberof
intricate SQL statements, with each of the statements likely to invoke full table scans, multiple
joins, aggregations, groupings, and sorting. Analysis of the type we are discussing requires
complex calculations and handling time series data. SQL is notably weak in these areas.
Even if you can imagine an analyst accurately formulating such complex SQL statements,
the overhead on the systems would still be enormous and seriously impact response times.
OLAP is the Answer
Users certainly need the ability to perform multidimensional analysis with complex calcu-
lations, but we find that the traditional tools of report writers, query products, spreadsheets,
and language interfaces are distressfully inadequate. What is the answer? Clearly, the tools
being used in the OLTP and basic data warehouse environments do not match up to the task.
We need a different set of tools and products that are specifically meant for serious analysis.
We need OLAP in the data warehouse.
In this chapter, we will thoroughly examine the various aspects of OLAP. We will come
up with formal definitions and detailed characteristics. We will highlight all the features
and functions. We will explore the different OLAP models. But now that you have an initial
appreciation for OLAP, let us list the basic virtues of OLAP to justify our proposition.
† Enables analysts, executives, and managers to gain useful insights from the presen-
tation of data.
† Can reorganize metrics along several dimensions and allow data to be viewed from
different perspectives.
† Supports multidimensional analysis.
† Is able to drill down or roll up within each dimension.
† Is capable of applying mathematical formulas and calculations to measures.
† Provides fast response, facilitating speed-of-thought analysis.
† Complements the use of other information delivery techniques such as data mining.
† Improves the comprehension of result sets through visual presentations using graphs
and charts.
† Can be implemented on the Web.
† Designed for highly interactive analysis.
Even at this stage, you will further appreciate the nature and strength of OLAP by study-
ing a typical OLAP session (see Fig. 15-3). The analyst starts with a query requesting a high-
level summary by product line. Next, the user moves to drilling down for details by year. In
the following step, the analyst pivots the data to view totals by year rather than totals by pro-
duct line. Even in such a simple example, you observe the power and features of OLAP.
OLAP Definitions and Rules
Where did the term OLAP originate? We know that multidimensionality is at the core of
OLAP systems. We have also mentioned some other basic features of OLAP. Is it a
vague collection of complex factors for serious analysis? Is there a formal definition and
a set of fundamental guidelines identifying OLAP systems?
DEMAND FOR ONLINE ANALYTICAL PROCESSING 379
411.
The term OLAPor online analytical processing was introduced in a paper entitled
“Providing On-Line Analytical Processing to User Analysts,” by Dr. E. F. Codd, the
acknowledged father of the relational database model. The paper, published in 1993, defined
12 rules or guidelines for an OLAP system. Later, in 1995, six additional rules were
included. We will discuss these rules. Before that, let us look for a short and precise
definition for OLAP. Such a succinct definition comes from the OLAP council
(www.olapcouncil.org), which provides membership, sponsors research, and promotes the
use of OLAP. Here is the definition:
On-Line Analytical Processing (OLAP) is a category of software technology that enables ana-
lysts, managers and executives to gain insight into data through fast, consistent, interactive
access in a wide variety of possible views of information that has been transformed from raw
data to reflect the real dimensionality of the enterprise as understood by the user.
The definition from the OLAP council contains all the key ingredients. Speed, consist-
ency, interactive access, and multiple dimensional views—all of these are principal
elements. As one trade magazine described it as early as in 1995, OLAP is a fancy term
for multidimensional analysis.
The guidelines proposed by Dr. Codd form the yardstick for measuring any sets of OLAP
tools and products. A true OLAP system must conform to these guidelines. When your
project team is looking for OLAP tools, it can prioritize these guidelines and select tools
that meet the set of criteria at the top of your priority list. First, let us consider the initial
12 guidelines for an OLAP system:
Multidimensional Conceptual View. Provide a multidimensional data model that
is intuitively analytical and easy to use. Business users’ view of an enterprise is
LINE TOTAL SALES
Clothing $12,836,450
Electronics $16,068,300
Video $21,262,190
Kitchen $17,704,400
Appliances $19,600,800
Total $87,472,140
LINE 1998 1999 2000 TOTAL
Clothing $3,457,000 $3,590,050 $5,789,400 $12,836,450
Electronics $5,894,800 $4,078,900 $6,094,600 $16,068,300
Video $7,198,700 $6,057,890 $8,005,600 $21,262,190
Kitchen $4,875,400 $5,894,500 $6,934,500 $17,704,400
Appliances $5,947,300 $6,104,500 $7,549,000 $19,600,800
Total $27,373,200 $25,725,840 $34,373,100 $87,472,140
YEAR Clothing Electronics Video Kitchen Appliances TOTAL
1998 $3,457,000 $5,894,800 $7,198,700 $4,875,400 $5,947,300 $27,373,200
1999 $3,590,050 $4,078,900 $6,057,890 $5,894,500 $6,104,500 $25,725,840
2000 $5,789,400 $6,094,600 $8,005,600 $6,934,500 $7,549,000 $34,373,100
Total $12,836,450 $16,068,300 $21,262,190 $17,704,400 $19,600,800 $87,472,140
High level
summary by
product line
Drill down
by year
Rotate
columns to
rows
1
2
3
Figure 15-3 Simple OLAP session.
380 OLAP IN THE DATA WAREHOUSE
412.
multidimensional in nature.Therefore, a multidimensional data model conforms to
how the users perceive business problems.
Transparency. Make the technology, underlying data repository, computing architec-
ture, and the diverse nature of source data totally transparent to users. Such transpar-
ency, supporting a true open system approach, helps to enhance the efficiency and
productivity of the users through front-end tools that are familiar to them.
Accessibility. Provide access only to the data that is actually needed to perform the speci-
fic analysis, presenting a single, coherent, and consistent view to the users. The OLAP
system must map its own logical schema to the heterogeneous physical data stores and
perform any necessary transformations.
Consistent Reporting Performance. Ensure that the users do not experience any signifi-
cant degradation in reporting performance as the number of dimensions or the size of
the database increases. Users must perceive consistent run time, response time, or
machine utilization every time a given query is run.
Client/Server Architecture. Conform the system to the principles of client/server archi-
tecture for optimum performance, flexibility, adaptability, and interoperability. Make
the server component sufficiently intelligent to enable various clients to be attached
with a minimum of effort and integration programming.
Generic Dimensionality. Ensure that every data dimension is equivalent in both structure
and operational capabilities. Have one logical structure for all dimensions. The basic
data structure or the access techniques must not be biased toward any single data
dimension.
Dynamic Sparse Matrix Handling. Adapt the physical schema to the specific analytical
model being created and loaded that optimizes sparse matrix handling. When encoun-
tering a sparse matrix, the system must be able to dynamically deduce the distribution
of the data and adjust the storage and access to achieve and maintain consistent level of
performance.
Multiuser Support. Provide support for end users to work concurrently with either the
same analytical model or to create different models from the same data. In short,
provide concurrent data access, data integrity, and access security.
Unrestricted Cross-Dimensional Operations. Provide ability for the system to recognize
dimensional hierarchies and automatically perform roll-up and drill-down operations
within a dimension or across dimensions. Have the interface language allow calcu-
lations and data manipulations across any number of data dimensions, without restrict-
ing any relations between data cells, regardless of the number of common data
attributes each cell contains.
Intuitive Data Manipulation. Enable consolidation path reorientation (pivoting), drill
down and roll up, and other manipulations to be accomplished intuitively and directly
via point-and-click and drag-and-drop actions on the cells of the analytical model.
Avoid the use of a menu or multiple trips to a user interface.
Flexible Reporting. Provide capabilities to the business user to arrange columns, rows,
and cells in a manner that facilitates easy manipulation, analysis, and synthesis of
information. Every dimension, including any subsets, must be able to be displayed
with equal ease.
Unlimited Dimensions and Aggregation Levels. Accommodate at least 15, preferably 20,
data dimensions within a common analytical model. Each of these generic dimensions
DEMAND FOR ONLINE ANALYTICAL PROCESSING 381
413.
must allow apractically unlimited number of user-defined aggregation levels within
any given consolidation path.
In addition to these 12 basic guidelines, also take into account the following require-
ments, not all distinctly specified by Dr. Codd.
Drill-Through to Detail Level. Allowa smooth transition from the multidimensional, pre-
aggregated database to the detail record level of the source data warehouse repository.
OLAP Analysis Models. Support Dr. Codd’s four analysis models: exegetical (or
descriptive), categorical (or explanatory), contemplative, and formulaic.
Treatment of Nonnormalized Data. Prohibit calculations made within an OLAP system
from affecting the external data serving as the source.
Storing OLAP Results. Do not deploy write-capable OLAP tools on top of transactional
systems.
Missing Values. Ignore missing values, irrespective of their source.
Incremental Database Refresh. Provide for incremental refreshes of the extracted and
aggregated OLAP data.
SQL Interface. Seamlessly integrate the OLAP system into the existing enterprise
environment.
OLAP Characteristics
Let us summarize in simple terms what we have covered so far. We explored why business
users absolutely need online analytical processing. We examined why the other methods
of information delivery do not satisfy the requirements for multidimensional analysis
with powerful calculations and fast access. We discussed how OLAP is the answer to satisfy
these requirements. We reviewed the definitions and authoritative guidelines for the
OLAP system.
Before we get into a more detailed discussion of the major features of OLAP systems, let
us list the most fundamental characteristics in plain language. OLAP systems
† Let business users have a multidimensional and logical view of the data in the data
warehouse.
† Facilitate interactive query and complex analysis for the users.
† Allow users to drill down for greater details or roll up for aggregations of metrics
along a single business dimension or across multiple dimensions.
† Provide the ability to perform intricate calculations and comparisons.
† Present results in a number of meaningful ways, including charts and graphs.
MAJOR FEATURES AND FUNCTIONS
Very often, you are faced with the question of whether OLAP is not just data warehousing
in a nice wrapper? Can you not consider online analytical processing as just an informa-
tion delivery technique and nothing more? Is it not another layer in the data warehouse, pro-
viding an interface between the data and the users? In some sense, OLAP is an information
delivery system for the data warehouse. But OLAP is much more than that. A data warehouse
382 OLAP IN THE DATA WAREHOUSE
414.
stores data andprovides simpler access to business intelligence. An OLAP system comp-
lements the data warehouse by lifting the information delivery capabilities to new heights.
General Features
In this section, we will pay special attention to a few major features and functions of OLAP
systems. You will gain greater insight into dimensional analysis, find deeper meanings
about the necessity for drill downs and roll ups during analysis sessions and gain greater
appreciation for the role of slicing and dicing operations in analysis. Before getting into
greater details about these, let us recapitulate the general features of OLAP. Figure 15-4
summarizes these features. Also note the distinction between basic features and advanced
features. The list shown in the figure includes the general features you observe in practice
in most OLAP environments. Use the list as a quick checklist of features your project
team must consider for your OLAP system.
Dimensional Analysis
By this time, you are perhaps tired of the term “dimensional analysis.” We have used the term
many times so far. You have been told that dimensional analysis is a strong suit in the arsenal
of OLAP. Any OLAP system devoid of multidimensional analysis is utterly useless. So try to
get a clear picture of the facility provided in OLAP systems for dimensional analysis.
Let us begin with a simple STAR schema. This STAR schema has three business dimen-
sions, namely, product, time, and store. The fact table contains sales. Figure 15-5 shows the
STAR schema and a three-dimensional representation of the model as a cube, with products
on the X-axis, time on the Y-axis, and stores on the Z-axis. What are the values represented
along each axis? For example, in the STAR schema, time is one of the dimensions and
month is one of the attributes of the time dimension. Values of this attribute month are
BASIC
FEATU
RES
ADVANCED
FEATURES
Multidimensional
analysis
Consistent
performance
Fast response times
for interactive queries
Drill-down and
roll-up
Navigation in and out
of details
Slice-and-dice or
rotation
Multiple view
modes
Easy
scalability
Time intelligence (year-
to-date, fiscal period)
Powerful
calculations
Cross-dimensional
calculations
Pre-calculation or
pre-consolidation
Drill-through across
dimensions or details
Sophisticated
presentation displays
Collaborative
decision making
Derived data values
through formulas
Application of alert
technology
Report generation with
agent technology
Figure 15-4 General features of OLAP.
MAJOR FEATURES AND FUNCTIONS 383
415.
represented on theY-axis. Similarly, values of the attributes product name and store name
are represented on the other two axes.
This schema with just three business dimensions does not even look like a star. Never-
theless, it is a dimensional model. From the attributes of the dimension tables, pick the
attribute product name from the product dimension, month from the time dimension, and
store name from the store dimension. Now look at the cube representing the values of
these attributes along the primary edges of the physical cube. Go further and visualize the
sales for coats in the month of January at the New York store to be at the intersection of
the three lines representing the product: coats, month: January, and store: New York.
If you are displaying the data for sales along these three dimensions on a spreadsheet, the
columns may display the product names, the rows the months, and pages the data along the
third dimension of store names. See Figure 15-6, which shows a screen display of a page of
this three-dimensional data.
The page displayed on the screen shows a slice of the cube. Now look at the cube and
move along a slice or plane passing through the point on the Z-axis representing store:
New York. The intersection points on this slice or plane relate to sales along product
and time business dimensions for store: New York. Try to relate these sale numbers to the
slice on the cube representing store: New York.
Now we have a way of depicting three business dimensions and a single fact on a two-
dimensional page and also on a three-dimensional cube. The numbers in each cell on the
page are the sale numbers. What could be the types of multidimensional analysis on this
particular set of data? What types of queries could be run during the course of analysis
sessions? You could get sale numbers along the hierarchies of a combination of the three
business dimensions of product, store, and time. You could perform various types of
three-dimensional analysis of sales. The results of queries during analysis sessions will be
displayed on the screen with the three dimensions represented in columns, rows, and
Product Key
Time Key
Store Key
Fixed Costs
Variable Costs
Indirect Sales
Direct Sales
Profit Margin
SALES FACTS
STORE
PRODUCT
TIME
Store Key
Store Name
Territory
Region
Time Key
Date
Month
Quarter
Year
Product Key
Product Name
Sub-category
Category
Product Line
Department
Months
S
t
o
r
e
s
Products
Coats, January, New York
550
Figure 15-5 Simple STAR schema.
384 OLAP IN THE DATA WAREHOUSE
416.
pages. The followingis a sample of simple queries and the result sets during a multidimen-
sional analysis session.
Query
Display the total sales of all products for past five years in all stores.
Display of Results
Rows: Year numbers 2009, 2008, 2007, 2006, 2005
Columns: Total Sales for all products
Page: One store per page
Query
Compare total sales for all stores, product by product, between years 2009 and 2008.
Display of Results
Rows: Year numbers 2009, 2008; difference; percentage increase or decrease
Columns: One column per product, showing all products
Page: All stores
Query
Show comparison of total sales for all stores, product by product, between years 2009 and
2008 only for those products with reduced sales.
Display of Results
Rows: Year numbers 2009, 2008; difference; percentage decrease
Columns: One column per product, showing only the qualifying products
Page: All stores
COLUMNS: PRODUCT dimension
Products
ROWS:
TIME
dimension
Months
Store: New York
PAGES: STORE dimension
Hats Coats Jackets Dresses Shirts Slacks
Jan
Feb
Mar
Apr
May
Jun
Jul
Aug
Sep
Oct
Nov
Dec
200 550 350 500 520 490
210 480 390 510 530 500
190 480 380 480 500 470
190 430 350 490 510 480
160 530 320 530 550 520
150 450 310 540 560 330
130 480 270 550 570 250
140 570 250 650 670 230
160 470 240 630 650 210
170 480 260 610 630 250
180 520 280 680 700 260
200 560 320 750 770 310
Figure 15-6 A three-dimensional display.
MAJOR FEATURES AND FUNCTIONS 385
417.
Query
Show comparison ofsales by individual stores, product by product, between years 2009
and 2008 only for those products with reduced sales.
Display of Results
Rows: Year numbers 2009, 2008; difference; percentage decrease
Columns: One column per product, showing only the qualifying products
Page: One store per page
Query
Show the results of the previous query, but rotating and switching the columns with rows.
Display of Results
Rows: One row per product, showing only the qualifying products
Columns: Year numbers 2009, 2008; difference; percentage decrease
Page: One store per page
Query
Show the results of the previous query, but rotating and switching the pages with rows.
Display of Results
Rows: One row per store
Columns: Year numbers 2009, 2008; difference; percentage decrease
Page: One product per page, displaying only the qualifying products.
This multidimensional analysis can continue on until the analyst determines how many
products showed reduced sales and which stores suffered the most.
In the above example, we had only three business dimensions and each of the dimensions
could, therefore, be represented along the edges of a cube or the results displayed as columns,
rows, and pages. Now add another business dimension, promotion. That will bring the
number of business dimensions to four. When you have three business dimensions, you
are able to represent these three as a cube with each edge of the cube denoting one dimension.
You are also able to display the data on a spreadsheet with two dimensions as rows and
columns and the third dimension as pages. But when you have four dimensions or more,
how can you represent the data? Obviously, a three-dimensional cube does not work.
And you also have a problem when trying to display the data on a spreadsheet as rows, col-
umns, and pages. So what about multidimensional analysis when there are more than three
dimensions? This leads us to a discussion of hypercubes.
What Are Hypercubes?
Let us begin with the two business dimensions of product and time. Usually, business users
wish to analyze not just sales but other metrics as well. Assume that the metrics to be
386 OLAP IN THE DATA WAREHOUSE
418.
analyzed are fixedcost, variable cost, indirect sales, direct sales, and profit margin. These are
five common metrics.
The data described here may be displayed on a spreadsheet showing metrics as columns,
time as rows, and products as pages. Figure 15-7 shows a sample page of the spreadsheet
display. In the figure, note the three straight lines, two of which represent the two business
dimensions and the third, the metrics. You can independently move up or down along
the straight lines. Some experts refer to this representation as a multidimensional domain
structure (MDS).
The figure also shows a cube representing the data points along the edges. Relate the three
straight lines to the three edges of the physical cube. Now the page you see in the figure is a
slice passing through a single product and the divisions along the other two straight lines
shown on the page as columns and rows. With three groups of data—two groups of business
dimensions and one group of metrics—we can easily visualize the data as being along the
three edges of a cube.
Now add another business dimension to the model. Let us add the store dimension. That
results in three business dimensions plus the metrics data. How can you represent these four
groups as edges of a three-dimensional cube? How do you represent a four-dimensional
model with data points along the edges of a three-dimensional cube? How do you slice
the data to display pages?
This is where an MDS diagram comes in handy. Now you need not try to perceive four-
dimensional data as along the edges of the three-dimensional cube. All you have to do
is draw four straight lines to represent the data as an MDS. These four lines represent
the data (see Fig. 15-8). Looking at this figure, you realize that the metaphor of a physical
cube to represent data breaks down when you try to represent four dimensions. But, as
COLUMNS: Metrics
ROWS:
TIME
dimension
PRODUCT: Coats
PAGES: PRODUCT dimension
Months
P
r
o
d
u
c
t
s
Metrics
Coats
Jan
Feb
Mar
Apr
May
Jun
Jul
Aug
Sep
Oct
Nov
Dec
TIME
Fixed Cost
Variable
Cost
Indirect
Sales
Direct
Sales
Profit
Margin
METRICS
Hats
Coats
Jackets
Dresses
Shirts
Slacks
PRODUCT
Multidimensional
Domain Structure
Fixed Variable Indirect Direct Profit
Cost Cost Sales Sales Margin
Jan 340 110 230 320 100
Feb 270 90 200 260 100
Mar 310 100 210 270 70
Apr 340 110 210 320 80
May 330 110 230 300 90
Jun 260 90 150 300 100
Jul 310 100 180 300 70
Aug 380 130 210 360 60
Sep 300 100 180 290 70
Oct 310 100 170 310 70
Nov 330 110 210 310 80
Dec 350 120 200 360 90
Figure 15-7 Display of columns, rows, and pages.
MAJOR FEATURES AND FUNCTIONS 387
419.
you see, theMDS is well suited to represent four dimensions. Can you think of the four
straight lines of the MDS intuitively to represent a “cube” with four primary edges?
This intuitive representation is a hypercube, a representation that accommodates more
than three dimensions. At a lower level of simplification, a hypercube can very well accom-
modate three dimensions. A hypercube is a general metaphor for representing multidimen-
sional data.
You now have a way of representing four dimensions as a hypercube. The next question
relates to display of four-dimensional data on the screen. How can you possibly show
four dimensions with only three display groups of rows, columns, and pages? Please turn
your attention to Figure 15-9. What do you notice about the display groups? How does
the display resolve the problem of accommodating four dimensions with only three display
groups? By combining multiple logical dimensions within the same display group. Notice
how product and metrics are combined to display as columns. The displayed page represents
the sales for store: New York.
Let us look at just one more example of an MDS representing a hypercube. Let us move
up to six dimensions. Please study Figure 15-10 with six straight lines showing the data
representations. The dimensions shown in this figure are product, time, store, promotion,
customer demographics, and metrics.
There are several ways you can display six-dimensional data on the screen. Figure 15-11
illustrates one such six-dimensional display. Notice how product and metrics are combined
and represented as columns, store and time are combined as rows, and demographics and
promotion as pages.
We have reviewed two specific issues. First, we have noted a special method for repre-
senting a data model with more than three dimensions using an MDS. This method is an
intuitive way of showing a hypercube. A model with three dimensions can be represented
Jan
Feb
Mar
Apr
May
Jun
Jul
Aug
Sep
Oct
Nov
Dec
TIME
Fixed Cost
Variable
Cost
Indirect
Sales
Direct
Sales
Profit
Margin
METRICS
Hats
Coats
Jackets
Dresses
Shirts
Slacks
PRODUCT
Multidimensional
Domain Structure
New York
San Jose
Dallas
Denver
Cleveland
Boston
STORE
Figure 15-8 MDS for four dimensions.
388 OLAP IN THE DATA WAREHOUSE
420.
TIME
Sales
Cost
METRICS
PRODUCT
Multidimensional
Domain Structure
New York
SanJose
Dallas
STORE
Jan
Feb
Mar
Hats
Coats
Jackets
PAGE: Store Dimension
ROWS: Time Dimension
COLUMNS: Product Metrics
combined
HOW DISPLAYED
ON A PAGE
New York Store
Hats:Sales Hats:Cost Coats:Sales Costs:Cost Jackets:Sales Jackets:Cost
Jan 450 350 550 450 500 400
Feb
Mar
380 280 460 360 400 320
400 310 480 410 450 400
Figure 15-9 Page displays for four-dimensional data.
Jan
Feb
Mar
Apr
May
Jun
Jul
Aug
Sep
Oct
Nov
Dec
TIME
Fixed Cost
Variable
Cost
Indirect
Sales
Direct
Sales
Profit
Margin
METRICS
Hats
Coats
Jackets
Dresses
Shirts
Slacks
PRODUCT
Multidimensional
Domain Structure
Marital Status
Life Style
Income Level
Home Owner
Credit Rating
Purchase Habit
DEMO-
GRAPHICS
New York
San Jose
Dallas
Denver
Cleveland
Boston
STORE
Type
Display Type
Coupon Type
Media Type
Cost
Style
PROMO-
TION
Figure 15-10 Six-dimensional MDS.
MAJOR FEATURES AND FUNCTIONS 389
421.
by a physicalcube. But a physical cube is limited to only three dimensions or less. Second,
we have also discussed the methods for displaying the data on a flat screen when the number
of dimensions is three or more. Building on the resolution of these two issues, let us now
move on to two very significant aspects of multidimensional analysis. One of these is the
drill-down and roll-up exercise; the other is the slice-and-dice operation.
Drill Down and Roll Up
Return to Figure 15-5. Look at the attributes of the product dimension table of the STAR
schema. In particular, note these specific attributes of the product dimension: product
name, subcategory, category, product line, and department. These attributes signify an
ascending hierarchical sequence from product name to department. A department includes
product lines, a product line includes categories, a category includes subcategories, and each
subcategory consists of products with individual product names. In an OLAP system, these
attributes are called hierarchies of the product dimension.
OLAP systems provide drill-down and roll-up capabilities. Try to understand what we
mean by these capabilities with reference to the above example. Figure 15-12 illustrates
these capabilities with reference to the product dimension hierarchies. Note the different
types of information given in the figure. It shows the rolling up to higher hierarchical
levels of aggregation and the drilling down to lower levels of detail. Also note the sales
numbers shown alongside. These are sales for one particular store in one particular month
at these levels of aggregation. The sale numbers you notice as you go down the hierarchy
are for a single department, a single product line, a single category, and so on. You drill
down to get the lower level breakdown of sales. The figure also shows the drill across to
another OLAP summarization using a different set of hierarchies of other dimensions.
Notice also the drill through to the lower levels of granularity, as stored in the source data
warehouse repository. Roll up, drill down, drill across, and drill through are extremely
useful features of OLAP systems supporting multidimensional analysis.
TIME
Sales
Cost
METRICS
PRODUCT
Multidimensional
Domain Structure
New York
San Jose
STORE
Jan
Feb
Hats
Coats
PAGE: Demographics
Promotion Dimensions
combined
ROWS: Store Time
Dimensions combined
COLUMNS: Product
Metrics combined
HOW DISPLAYED
ON A PAGE
Type
Coupon
PROMO
Life Style
Income
DEMO
Life Style : Coupon
Hats
Sales
Hats
Cost
Coats
Sales
Coats
Cost
220 170 270 220
190 140 230 180
200 160 240 200
New York Jan
Jan
Feb
Feb
Boston
180 130 220 170
Figure 15-11 Page displays for six-dimensional data.
390 OLAP IN THE DATA WAREHOUSE
422.
One more questionremains. While you are rolling up or drilling down, how do the
page displays change on the spreadsheets? For example, return to Figure 15-6 and look at
the page display on the spreadsheet. The columns represent the various products, the rows
represent the months, and the pages represent the stores. At this point, if you want to roll
up to the next higher level of subcategory, how will the display in Figure 15-6 change?
The columns on the display will have to change to represent subcategories instead of pro-
ducts. Figure 15-13 indicates this change.
DATA WAREHOUSE
Detailed Data Detailed Data
Summary Data
OLAP
Aggregation
Levels
Sales in one
month in
one store
Department
Product Line
Category
Product
Sub-category
300,000
60,000
5,000
15,000
1,200
Another
instance of
OLAP
Drill-
down /
Rollup
Drill-
through
to detail
Drill-
across to
another
OLAP
instance
Figure 15-12 Roll-up and drill-down features of OLAP.
COLUMNS: PRODUCT dimension
Sub-categories
ROWS:
TIME
dimension
Months
Store: New York
PAGES: STORE dimension
Outer Dress Casual
Jan 1,100 1,020 490
Feb 1,080 1,040 500
Mar 1,050 980 470
Apr 970 1,000 480
May 1,010 1,080 520
Jun 910 1,100 330
Jul 880 1,120 250
Aug 960 1,320 230
Sep 870 1,280 210
Oct 910 1,240 250
Nov 980 1,380 260
Dec 1,080 1,520 310
Figure 15-13 Three-dimensional display with roll-up.
MAJOR FEATURES AND FUNCTIONS 391
423.
Let us askjust one more question before we leave this subsection. When you have rolled
up to the subcategory level in the product dimension, what happens to the display if you
also roll up to the next higher level of the store dimension, territory? How will the display
on the spreadsheet change? Now the spreadsheet will display the sales with columns repre-
senting subcategories, rows representing months, and the pages representing territories.
Slice and Dice or Rotation
Let us revisit Figure 15-6 showing the display of months as rows, products as columns, and
stores as pages. Each page represents the sales for one store. The data model corresponds to a
physical cube with these data elements represented by its primary edges. The page displayed
is a slice or two-dimensional plane of the cube. In particular, this display page for the
New York store is the slice parallel to the product and time axes. Now look at Figure 15-14
carefully. On the left side, the first part of the diagram shows this alignment of the cube.
For the sake of simplicity, only three products, three months, and three stores are chosen
for illustration.
Now rotate the cube so that products are along the Z-axis, months are along the X-axis,
and stores are along the Y-axis. The slice we are considering also rotates. What happens to
the display page that represents the slice? Months are now shown as columns and stores as
rows. The display page represents the sales of one product, namely product: hats.
You can go to the next rotation so that months are along the Z-axis, stores are along the
X-axis, andproductsarealong theY-axis. Thesliceweareconsideringalsorotates.Whathap-
pens to the display page that represents the slice? Stores are now shown as columns and pro-
ducts as rows. The display page represents the sales of one month, namely month: January.
Hats Coats Jackets
Jan 200 550 350
Feb 210 480 390
Mar 190 480 380
Months
S
t
o
r
e
s
Products
Product: Hats
X-axis: Columns; Y-axis: Rows; Z-axis: Pages
X
Y
Z
X
Y
Z
X
Y
Z
P
r
o
d
u
c
t
s
M
o
n
t
h
s
Stores
Months
P
r
o
d
u
c
t
s
Stores
Store: New York Month: January
Jan Feb Mar
New York 200 210 190
Boston 210 250 240
San Jose 130 90 70
New York Boston San Jose
Hats 200 210 130
Coats 550 500 200
Jackets 350 400 100
Figure 15-14 Slicing and dicing.
392 OLAP IN THE DATA WAREHOUSE
424.
What is thegreat advantage of all of this for the users? Did you notice that with each
rotation, the users can look at page displays representing different versions of the slices in
the cube. The users can view the data from many angles, understand the numbers better,
and arrive at meaningful conclusions.
Uses and Benefits
After exploring the features of OLAP in sufficient detail, you must have already deduced the
enormous benefits of OLAP. We have discussed multidimensional analysis as provided
in OLAP systems. The ability to perform multidimensional analysis with complex queries
sometimes also entails complex calculations.
Let us summarize the benefits of OLAP systems:
† Increased productivity of business managers, executives, and analysts.
† Inherent flexibility of OLAP systems means that users may be self-sufficient in running
their own analysis without IT assistance.
† Benefit for IT developers because using software specifically designed for the system
development results in faster delivery of applications.
† Self-sufficiency for users, resulting in reduction in backlog.
† Faster delivery of applications following from the previous benefits.
† More efficient operations through reducing time on query executions and in network
traffic.
† Ability to model real-world challenges with business metrics and dimensions.
OLAP MODELS
Have you heard of the terms ROLAP or MOLAP? How about the variation, DOLAP? Avery
simple explanation of the variations relates to the way data is stored for OLAP. The proces-
sing is still online analytical processing; basically, the storage methodology is different.
ROLAP. Refers to relational online analytical processing. In this case, the OLAP system
is built on top of a relational database.
MOLAP. Refers to multidimensional online analytical processing. In this case, the
OLAP system is implemented through a specialized multidimensional database.
HOLAP. Refers to hybrid online analytical processing. This models attempts to combine
the strengths and features of ROLAP and MOLAP.
DOLAP. Refers for desktop online analytical processing. DOLAP is meant to provide
portability to users of online analytical processing. In the DOLAP methodology,
multidimensional datasets are created and transferred to the desktop machine, requir-
ing only the DOLAP software to exist on that machine. DOLAP is a variation of
ROLAP.
Database OLAP. Refers to a relational database management system (RDBMS)
designated to support OLAP structures and to perform OLAP calculations.
Web OLAP. Refers to online analytical processing where OLAP data is accessible from a
Web browser.
OLAP MODELS 393
425.
Overview of Variations
MOLAPand ROLAP are the fundamental models; therefore, we will discuss these in
sufficient depth. In the MOLAP model, online analytical processing is best implemented
by storing the data multidimensionally, that is, easily viewed in a multidimensional way.
Here the data structure is fixed so that the logic to process multidimensional analysis
can be based on well-defined methods of establishing data storage coordinates. Usually,
multidimensional databases (MDDBs) are vendors’ proprietary systems. On the other
hand, the ROLAP model relies on the existing relational DBMS of the data warehouse.
OLAP features are provided against the relational database.
See Figure 15-15 contrasting the two models. Notice the MOLAP model shown on the
left side of the figure. The OLAP engine resides on a special server. Proprietary multi-
dimensional databases (MDDBs) store data in the form of multidimensional hypercubes.
You have to run special extraction and aggregation jobs from the relational database of
the data warehouse to create these multidimensional data cubes in the MDDBs. The special
server presents the data as OLAP cubes for processing by the users.
On the right side of the figure you see the ROLAP model. The OLAP engine resides on
the desktop. Prefabricated multidimensional cubes are not created beforehand and stored in
special databases. The relational data is presented as virtual multidimensional data cubes.
The MOLAP Model
As discussed, in the MOLAP model, data for analysis is stored in specialized multidimen-
sional databases. Large multidimensional arrays form the storage structures. For example,
Desktop
MDDB
OLAP
Server
Data
Warehouse
Database
Server
MOLAP
Data
Warehouse
Database
Server
OLAP
Services
Desktop
ROLAP
Figure 15-15 OLAP models.
394 OLAP IN THE DATA WAREHOUSE
426.
to store salesnumber of 500 units for product ProductA, in month number 2009/01, in
store StoreS1, under distributing channel Channe105, the sales number of 500 is stored in
an array represented by the values (ProductA, 2009/01, StoreS1. Channe105).
The array values indicate the location of the cells. These cells are intersections of the
values of dimension attributes. If you note how the cells are formed, you will realize that
not all cells have values of metrics. If a store is closed on Sundays, then the cells representing
Sundays will all be nulls.
Let us now consider the architecture for the MOLAP model. Please go over each part of
Figure 15-16 carefully. Note the three layers in the multitier architecture. Precalculated and
prefabricated multidimensional data cubes are stored in multidimensional databases. The
MOLAP engine in the application layer pushes a multidimensional view of the data from
the MDDBs to the users.
As mentioned earlier, multidimensional database management systems are proprietary
software systems. These systems provide the capability to consolidate and fabricate sum-
marized cubes during the process that loads data into the MDDBs from the main data
warehouse. The users who need summarized data enjoy fast response times from the pre-
consolidated data.
The ROLAP Model
In the ROLAP model, data is stored as rows and columns as in a relational data model. This
model presents data to the users in the form of business dimensions. In order to hide the
storage structure to the user and present data multidimensionally, a semantic layer of meta-
data is created. The metadata layer supports the mapping of dimensions to the relational
MDDB
MOLAP
Engine
Data
Warehouse
RDBMS
Server
MDBMS
Server
C
r
e
a
t
e
a
n
d
s
t
o
r
e
s
u
m
m
a
r
y
d
a
t
a
c
u
b
e
s
Desktop
Client
APPLICATION
LAYER
Proprietary Data
Language
DATA LAYER
PRESENTATION
LAYER
Figure 15-16 The MOLAP model.
OLAP MODELS 395
427.
tables. Additional metadatasupports summarizations and aggregations. You may store the
meta-data in relational databases.
Now see Figure 15-17. This figure shows the architecture of the ROLAP model. What
you see is a three-tier architecture. The analytical server in the middle tier application
layer creates multidimensional views on the fly. The multidimensional system at the presen-
tation layer provides a multidimensional view of the data to the users. When the users issue
complex queries based on this multidimensional view, the queries are transformed into
complex SQL directed to the relational database. Unlike the MOLAP model, static multi-
dimensional structures are not created and stored.
True ROLAP has three distinct characteristics:
† Supports all the basic OLAP features and functions discussed earlier
† Stores data in a relational form
† Supports some form of aggregation
Local hypercubing is a variation of ROLAP provided by vendors. This is how it works:
1 The user issues a query.
2 The results of the query get stored in a small, local, multidimensional database.
3 The user performs analysis against this local database.
4 If additional data is required to continue the analysis, the user issues another query and
the analysis continues.
Data
Warehouse
RDBMS
Server
Desktop
Client
Analytical
Server
Complex SQL
Create data cubes
dynamically
User Request
APPLICATION
LAYER
DATA LAYER
PRESENTATION
LAYER
Multidimensional
view
Figure 15-17 The ROLAP model.
396 OLAP IN THE DATA WAREHOUSE
428.
ROLAP Versus MOLAP
Shouldyou use the relational approach or the multidimensional approach to provide online
analytical processing for your users? That depends on how important query performance
is for your users. Again, the choice between ROLAP and MOLAP also depends on the
complexity of the queries from your users. Figure 15-18 charts the solution options based
ROLAP
MOLAP
Complexity of Analysis
Query
Performance
Figure 15-18 ROLAP or MOLAP?
Data stored as relational
tables in the warehouse.
Detailed and light
summary data available.
Very large data volumes.
All data access from the
warehouse storage.
Data Storage Underlying Technologies Functions and Features
ROLA
P
MOLA
P
Data stored as relational
tables in the warehouse.
Various summary data kept
in proprietary databases
(MDDBs)
Moderate data volumes.
Summary data access from
MDDB, detailed data
access from warehouse.
Use of complex SQL to
fetch data from
warehouse.
ROLAP engine in
analytical server creates
data cubes on the fly.
Multidimensional views
by presentation layer.
Creation of pre-fabricated
data cubes by MOLAP
engine. Propriety
technology to store
multidimensional views in
arrays, not tables. High
speed matrix data retrieval.
Sparse matrix technology
to manage data sparsity in
summaries.
Faster access.
Large library of functions
for complex calculations.
Easy analysis irrespective
of the number of
dimensions.
Extensive drill-down and
slice-and-dice capabilities.
Known environment and
availability of many tools.
Limitations on complex
analysis functions.
Drill-through to lowest
level easier. Drill-across
not always easy.
Figure 15-19 ROLAP versus MOLAP.
OLAP MODELS 397
429.
on the considerationsof query performance and complexity of queries. MOLAP is the
choice for faster response and more intensive queries. These are just two broad consider-
ations. Figure 15-19 provides a comprehensive comparison between the two.
OLAP IMPLEMENTATION CONSIDERATIONS
Before considering implementation of OLAP in your data warehouse, you have to take
into account two key issues with regard to the MOLAP model running under MDDBMS.
The first issue relates to the lack of standardization. Each vendor tool has its own client inter-
face. Another issue is scalability. OLAP is generally good for handling summary data, but
not good for volumes of detailed data.
On the other hand, highly normalized data in the data warehouse can give rise to proces-
sing overhead when you are performing complex analysis. You may reduce this by using
a STAR schema multidimensional design. In fact, for some ROLAP tools, the multidimen-
sional representation of data in a STAR schema arrangement is a prerequisite.
Consider a few choices of architecture. Look at Figure 15-20 showing four architectural
options.
You have now studied the various implementation options for providing OLAP function-
ality in your data warehouse. These are important choices. Remember, without OLAP, your
users have very limited means for analyzing data. Let us now examine some specific design
considerations.
MDDB
OLAP
Server
Data
Warehouse
Database
Server
OLAP
Services
MDDB Data
Mart
Thin
Client
Client Client
MDDB
Data
Mart
OLAP
Server
Fat
Client
FOUR ARCHITECTURAL
OPTIONS
Figure 15-20 OLAP architectural options.
398 OLAP IN THE DATA WAREHOUSE
430.
Data Design andPreparation
The data warehouse feeds data to the OLAP system. In the MOLAP model, separate proprie-
tary multidimensional databases store the data fed from the data warehouse in the form of
multidimensional cubes. On the other hand, in the ROLAP model, although no static inter-
mediary data repository exists, data is still pushed into the OLAP system with cubes created
dynamically on the fly. Thus, the sequence of the flow of data is from the operational source
systems to the data warehouse and from there to the OLAP system.
Sometimes, you may have the desire to short-circuit the flow of data. You may wonder
why you should not build the OLAP system on top of the operational source systems them-
selves. Why not extract data into the OLAP system directly? Why bother moving data
into the data warehouse and then into the OLAP system? Here are a few reasons why this
approach is flawed:
† An OLAP system needs transformed and integrated data. The system assumes that the
data has been consolidated and cleansed somewhere before it arrives. The disparity
among operational systems does not support data integration directly.
† The operational systems keep historical data only to a limited extent. An OLAP system
needs extensive historical data. Historical data from the operational systems must be
combined with archived historical data before it reaches the OLAP system.
† An OLAP system requires data in multidimensional representations. This calls for
summarization in many different ways. Trying to extract and summarize data from
the various operational systems at the same time is untenable. Data must be consoli-
dated before it can be summarized at various levels and in different combinations.
† Assume there are a few OLAP systems in your environment. That is, one supports the
marketing department, another supports the inventory control department, yet another
supports the finance department, and so on. To accomplish this, you have to build a
separate interface with the operational systems for data extraction into each OLAP
system. Can you imagine how difficult this would be?
In order to help prepare the data for the OLAP system, let us first examine some signifi-
cant characteristics of data in this system. Please review the following list:
† An OLAP system stores and uses much less data compared to a data warehouse.
† Data in the OLAP system is summarized. You will rarely find data at the lowest level of
detail as in the data warehouse.
† OLAP data is more flexible for processing and analysis partly because there is much
less data to work with.
† Every instance of the OLAP system in your environment is customized for the purpose
that instance of the system serves.
In order words, OLAP data tends to be more departmentalized, whereas data in the data
warehouse serves corporate-wide needs.
An overriding principle is that OLAP data is generally customized. When you build the
OLAP system with system instances servicing different user groups, you need to keep this in
mind. For example, one instance or specific set of summarizations would be meant for one
group of users, say, the marketing department. Let us quickly go through the techniques for
OLAP IMPLEMENTATION CONSIDERATIONS 399
431.
preparing OLAP datafor a specific group of users or a particular department, for example,
marketing.
Define Subset Select the subset of detailed data the marketing department is
interested in.
Summarize Summarize and prepare aggregate data structures in the way the marketing
department needs for summarizing. For example, summarize products along product
categories as defined by marketing. Sometimes, marketing and accounting departments
may categorize products in different ways.
Denormalize Combine relational tables in exactly the same way the marketing
department needs denormalized data. If marketing needs tables A and B joined, but finance
needs tables B and C joined, go with the join for tables A and B for the marketing OLAP
subset.
Calculate and Derive If some calculations and derivations of the metrics are depart-
ment-specific in your company, use the ones for marketing.
Index Choose those attributes that are appropriate for marketing to build indexes.
What about data modeling for the OLAP data structure? The OLAP structure contains
several levels of summarization and a few kinds of detailed data. How do you model
these levels of summarization?
Please see Figure 15-21 indicating the types and levels of data in OLAP systems. These
types and levels must be taken into consideration while performing data modeling for the
OLAP systems. Pay attention to the different types of data in an OLAP system. When you
model the data structures for your OLAP system, you need to provide for these types of data.
PERMANENT DETAILED DATA
Detailed data retrieved from the data warehouse
repository and stored in the OLAP system.
TRANSIENT DETAILED DATA
Detailed data brought in from the data warehouse
repository on temporary, one-time basis for
special purposes.
STATIC
SUMMARY DATA
DYNAMIC
SUMMARY DATA
Most of the OLAP
summary data is
static. This is the
data summarized
from the data
retrieved from the
data warehouse.
This type of
summary data is
very rare in the
OLAP environment
although this
happens because of
new business rules.
Figure 15-21 Data modeling considerations for OLAP.
400 OLAP IN THE DATA WAREHOUSE
432.
Administration and Performance
Letus now turn our attention to two important though not directly connected issues.
Administration One of these issues is the matter of administration and management
of the OLAP environment. The OLAP system is part of the overall data warehouse
environment and, therefore, administration of the OLAP system is part of the data ware-
house administration. Nevertheless, we must recognize some key considerations for
administering and managing the OLAP system. Let us briefly indicate a few of these
considerations.
† Expectations on what data will be accessed and how
† Selection of the right business dimensions
† Selection of the right filters for loading the data from the data warehouse
† Methods and techniques for moving data into the OLAP system (MOLAP model)
† Choosing the aggregation, summarization, and precalculation
† Developing application programs using the proprietary software of the OLAP vendor
† Size of the multidimensional database
† Handling of the sparse-matrix feature of multidimensional structures
† Drill down to the lowest level of detail
† Drill through to the data warehouse or to the source systems
† Drill across among OLAP system instances
† Access and security privileges
† Backup and restore facilities
Performance First you need to recognize that the presence of an OLAP system in your
data warehouse environment shifts the workload. Some of the queries that usually must
run against the data warehouse will now be redistributed to the OLAP system. The types
of queries that need OLAP are complex and filled with involved calculations. Long and
complicated analysis sessions consist of such complex queries. Therefore, when such
queries get directed to the OLAP system, the workload on the main data warehouse becomes
substantially reduced.
A corollary of shifting the complex queries to the OLAP system is the improvement in
the overall query performance. The OLAP system is designed for complex queries. When
such queries run in the OLAP system, they run faster. As the size of the data warehouse
grows, the size of the OLAP system still remains manageable and comparably small.
Multidimensional databases provide a reasonably predictable, fast, and consistent
response to every complex query. This is mainly because OLAP systems preaggregate
and precalculate many, if not, all possible hypercubes and store these. The queries run
against the most appropriate hypercubes. For instance, assume that there are only three
dimensions. The OLAP system will calculate and store summaries as follows:
† A three-dimensional low-level array to store base data
† A two-dimensional array of data for dimension-1 and dimension-2
† A 2-dimensional array of data for dimension-2 and dimension-3
† A high-level summary array by dimension-1
OLAP IMPLEMENTATION CONSIDERATIONS 401
433.
† A high-levelsummary array by dimension-2
† A high-level summary array by dimension-3
All of these precalculations and preaggregations result in faster response to queries at
any level of summarization. But this speed and performance do not come without any
cost. You pay the price to some extent in the load performance. OLAP systems are not
refreshed daily for the simple reason that load times for precalculating and loading all the
possible hypercubes are exhorbitant. Enterprises use longer intervals between refreshes of
their OLAP systems. Most OLAP systems are refreshed once a month.
OLAP Platforms
Where does the OLAP system physically reside? Should it be on the same platform as
the main data warehouse? Should it be planned to be on a separate platform from the
beginning? What about growth of the data warehouse and the OLAP system? How do the
growth patterns affect the decision? These are some of the questions you need to answer
as you provide OLAP capability to your users.
Usually, the data warehouse and the OLAP system start out on the same platform. When
both are small, it is cost-justifiable to keep both on the same platform. Within a year, it is
usual to find rapid growth in the main data warehouse. The trend normally continues. As
this growth happens, you may want to think of moving the OLAP system to another platform
to ease the congestion. But how exactly would you know whether to separate the platforms
and when to do so? Here are some guidelines:
† When the size and usage of the main data warehouse escalate and reach the point where
the warehouse requires all the resources of the common platform, start acting on the
separation.
† If too many departments need the OLAP system, then the OLAP requires additional
platforms to run.
† Users expect the OLAP system to be stable and perform well. The data refreshes
to the OLAP system are much less frequent. Although this is true for the OLAP
system, daily application of incremental loads and full refreshes of certain tables are
needed for the main data warehouse. If these daily transactions applicable to the
data warehouse begin to disrupt the stability and performance of the OLAP system,
then move the OLAP system to another platform.
† Obviously, in decentralized enterprises with OLAP users spread out geographically,
one or more separate platforms for the OLAP system become necessary.
† If users of one instance of the OLAP system want to stay away from the users of
another, then separation of platforms needs to be looked into.
† If the chosen OLAP tools need a configuration different from the platform of the
main data warehouse, then the OLAP system requires a separate platform, configured
correctly.
OLAP Tools and Products
The OLAP market is becoming sophisticated. Many OLAP products have appeared and
most of the recent products are quite successful. Quality and flexibility of the products
have improved remarkably.
402 OLAP IN THE DATA WAREHOUSE
434.
Before we providea checklist to be used for evaluation of OLAP products, let us list a few
broad guidelines:
† Let your applications and the users drive the selection of the OLAP products. Do not be
carried away by flashy technology.
† Remember, your OLAP system will grow both in size and in the number of active
users. Determine the scalability of the products before you choose.
† Consider how easy it is to administer the OLAP product.
† Performance and flexibility are key ingredients in the success of your OLAP system.
† As technology advances, the differences in the merits between ROLAP and MOLAP
appear to be somewhat blurred. Do not worry too much about these two methods.
Concentrate on the matching of the vendor product with your users’ analytical require-
ments. Flashy technology does not always deliver.
Now let us get to the selection criteria for choosing OLAP tools and products. While you
evaluate the products, use the following checklist and rate each product against each item
on the checklist:
† Multidimensional representation of data
† Aggregation, summarization, precalculation, and derivations
† Formulas and complex calculations in an extensive library
† Cross-dimensional calculations
† Time intelligence such as year-to-date, current and past fiscal periods, moving
averages, and moving totals
† Pivoting, cross-tabs, drill-down, and roll-up along single or multiple dimensions
† Interface of OLAP with applications and software such as spreadsheets, proprietary
client tools, third-party tools, and 4GL environments.
Implementation Steps
At this point, perhaps your project team has been given the mandate to build and implement
an OLAP system. You know the features and functions. You know the significance. You are
also aware of the important considerations. How do you go about implementing OLAP? Let
us summarize the key steps. These are the steps or activities at a very high level. Each step
consists of several tasks to accomplish the objectives of that step. You will have to come up
with the tasks based on the requirements of your environment. Here are the major steps:
† Dimensional modeling
† Design and building of the MDDB
† Selection of the data to be moved into the OLAP system
† Data acquisition or extraction for the OLAP system
† Data loading into the OLAP server
† Computation of data aggregation and derived data
† Implementation of application on the desktop
† Provision of user training
OLAP IMPLEMENTATION CONSIDERATIONS 403
435.
Examples of TypicalImplementations
As OLAP is so very important for analysis to many organizations, we would like to list
some examples of OLAP implementations. See Figure 15-22.
CHAPTER SUMMARY
† OLAP is critical because its multidimensional analysis, fast access, and powerful
calculations exceed that of other analysis methods.
† OLAP is defined on the basis of Codd’s initial twelve guidelines.
† OLAP characteristics include multidimensional view of the data, interactive and com-
plex analysis facility, ability to perform intricate calculations, and fast response time.
† Dimensional analysis is not confined to three dimensions that can be represented by a
physical cube. Hypercubes provide a method for representing views with more
dimensions.
† ROLAP and MOLAP are the two major OLAP models. The difference between them
lies in the way the basic data is stored. Ascertain which model is more suitable for your
environment.
† OLAP tools have matured. Some RDBMSs include support for OLAP.
Time Warner: Supports users in three continents with a strategic market planning and analysis system.
COMPANIES AND OLAP IMPLEMENTATION NOTES
The World Bank: Performs complex statistical analyses on a mass of worldwide econometric data.
Hewlett-Packard: Provides speedy operational reports using a desktop OLAP over the corporate
intranet to numerous users.
Sun Microsystems: Supports business planning with a networked OLAP tool, entirely Web-based.
Dun Bradstreet: Provides a vital link between customers’ corporate data and underlying detailed
information.
British Airways: Reduces processing costs through better analysis using OLAP databases tied to new
general ledger.
Barclays Bank: Manages risk on loans for maximum profit.
British Petroleum: Performs worldwide planning with its second generation OLAP application.
IBM Finance: Provides finance portal for cost-effective analysis, reporting, and performance management.
Subaru of America: Improves customer service through more effective allocation of inventory to
franchised dealers.
GlaxoSmithKline: Performs international financial reporting through OLAP databases.
Deluxe Corp.: World’s No. 1 check printer, performs more accurate forecasting through planning/analysis
applications.
Source: Olapreport.com and vendor Web sites (paraphrased)
Figure 15-22 Typical OLAP implementations.
404 OLAP IN THE DATA WAREHOUSE
436.
REVIEW QUESTIONS
1. Brieflyexplain multidimensional analysis.
2. Name any four key capabilities of an OLAP system.
3. State any five of Dr. Codd’s guidelines for an OLAP system, giving a brief description
for each.
4. What are hypercubes? How do they apply in an OLAP system?
5. What is meant by slice-and-dice? Give an example.
6. What are the essential differences between the MOLAP and ROLAP models? Also list
a few similarities.
7. What are multidimensional databases? How do these store data?
8. Describe any one of the four OLAP architectural options.
9. Discuss two reasons why feeding data into the OLAP system directly from the source
operational systems is not recommended.
10. Name any four factors for consideration in OLAP administration.
EXERCISES
1. Indicate if true or false:
A. OLAP facilitates interactive queries and complex uses.
B. A hypercube can be represented by the physical cube.
C. Slice-and-dice is the same as the rotation of the columns and rows in presentation of
data.
D. DOLAP stands for departmental OLAP.
E. ROLAP systems store data in multidimensional, proprietary databases.
F. The essential difference between ROLAP and MOLAP is in the way data is stored.
G. OLAP systems need transformed and integrated data.
H. Data in an OLAP system is rarely summarized.
I. Multidimensional domain structure (MDS) can represent only up to six dimensions.
J. OLAP systems do not handle moving averages.
2. As a senior analyst on the project team of a publishing company exploring the options
for a data warehouse, make a case for OLAP. Describe the merits of OLAP and how it
will be essential in your environment.
3. Pick any six of Dr. Codd’s initial guidelines for OLAP. Give your reasons why the
selected six are important for OLAP.
4. You are asked to form a small team to evaluate the MOLAP and ROLAP models and
make your recommendations. This is part of the data warehouse project for a large
EXERCISES 405
437.
manufacturer of heavychemicals. Describe the criteria your team will use to make the
evaluation and selection.
5. Your company is the largest producer of chicken products, selling to supermarkets, fast-
food chains, and restaurants, and also exporting to many countries. The analysts from
many offices worldwide expect to use the OLAP system when implemented. Discuss
how the project team must select the platform for implementing OLAP for the company.
Explain your assumptions.
406 OLAP IN THE DATA WAREHOUSE
438.
CHAPTER 16
DATA WAREHOUSINGAND THE WEB
CHAPTER OBJECTIVES
† Understand what Web-enabling the data warehouse means and examine the reasons
for doing so
† Appreciate the implications of the convergence of Web technologies and those of
the data warehouse
† Probe into all the facets of Web-based information delivery
† Study how OLAP and the Web connect and learn the different approaches to connect-
ing them
† Examine the steps for building a Web-enabled data warehouse
What is the most dominant phenomenon in computing and communication that started
in the 1990s? Undoubtedly, it is the Internet with the World Wide Web. The impact of
the Web on our lives and businesses can hardly be matched by any other developments
over the past years.
In the 1970s, we experienced a major breakthrough when the personal computer was
ushered in with its graphical interfaces, pointing devices, and icons. Today’s breakthrough
is the Web, which is built on the earlier revolution. Making the personal computer useful
and effective was our goal in the 1970s and 1980s. Making the Web useful and effective
is our goal in the 1990s and onwards. The growth of the Internet and the use of the Web
have overshadowed the earlier revolution. At the beginning of the year 2000, about 50
million households worldwide were estimated to be using the Internet. By the end of
2005, this number has grown 10-fold. More than 500 million households worldwide are
browsing the Web.
Data Warehousing Fundamentals for IT Professionals, Second Edition. By Paulraj Ponniah
Copyright # 2010 John Wiley Sons, Inc.
407
439.
The Web changeseverything, as they say. Data warehousing is no exception. In the
1980s, data warehousing was still being defined and growing. During the 1990s, it was
maturing. Now, after the Web revolution of the 1990s, data warehousing has assumed a
prominent place in the Web movement. Why?
What is the one major benefit of the Web revolution? Dramatically reduced communi-
cation costs. The Web has sharply diminished the cost of delivering information. What is
the relevance of that? What is one major purpose of the data warehouse? It is the delivery
of business intelligence. So they match perfectly. The data warehouse is for delivering
strategic information; the Internet makes it cost effective to do so. We have arrived at the
concept of a Web-enabled data warehouse or a “data Webhouse.” The Web forces us to
rethink data warehouse design and deployment.
In Chapter 3, we briefly considered the Web-enabled data warehouse. Specifically, we
discussed two aspects of this topic. First, we considered how to use the Web as one of the
information delivery channels. This is taking the warehouse to the Web, opening up the
data warehouse to more than the traditional set of users. This chapter primarily focuses on
this aspect of the relationship between the Web and the data warehouse.
The other aspect, briefly discussed in Chapter 3, deals with bringing the Web to the ware-
house. This aspect relates to your company’s e-commerce, where the clickstream data of
your company’s Web site is brought into the data Webhouse for analysis. In this chapter,
we will briefly mention some points about this aspect of the Web–warehouse connection.
Many articles by several authors and practitioners and a recent excellent book coauthored
by Dr. Ralph Kimball do adequate justice to this aspect of the data Webhouse. The
References section at the end of this book provides more information.
WEB-ENABLED DATA WAREHOUSE
A Web-enabled data warehouse uses the Web for information delivery and collaboration
among users. In a maturing data warehousing environment, more and more data warehouses
have been connected to the Web. Essentially, this means an increase in the access to infor-
mation in the data warehouse. Increase in information access, in turn, means increase in
the knowledge level of the enterprise. It is true that even before connecting to the Web,
you could give access for information to more of your users, but with much difficulty and
a proportionate increase in communication costs. The Web has changed all that. It is now
a lot easier to add more users. The communications infrastructure is already there. Almost
all of your users have Web browsers. No additional client software is required. You can
leverage the Web that already exists. The exponential growth of the Web, with its networks,
servers, users, and pages, has brought about the adoption of the Internet, intranets, and
extranets as information transmission media. The Web-enabled data warehouse takes
center stage in the Web revolution. Let us see why.
Why the Web?
It appears to be quite natural to connect the data warehouse to the Web. Why do we say this?
For a moment, think of how your users view the Web. First, they view the Web as a tremen-
dous source of information. They find the data content useful and interesting. Your internal
users, customers, and business partners already use the Web frequently. They know how to
get connected. The Web is everywhere. The sun never sets on the Web. The only client soft-
ware needed is the Web browser, and almost everyone, young and old, has learned how to
408 DATA WAREHOUSING AND THE WEB
440.
launch and usea browser. Almost all software vendors have already made their products
Web-ready.
Now consider your data warehouse in relation to the Web. Your users need the data
warehouse for information. Your business partners can use some of the specific information
from the data warehouse. What do all of these have in common? Familiarity with the Web
and ability to access it easily. These are strong reasons for a Web-enabled data warehouse.
How do you exploit the Web technology for your data warehouse? How do you connect
the warehouse to the Web? Let us quickly review three information delivery mechanisms that
companies have adopted based on Web technology. In each case, users access information
with Web browsers.
Internet The first medium is, of course, the Internet, which provides low-cost trans-
mission of information. You may exchange information with anyone within or outside the
company. Because the information is transmitted over public networks, security concerns
must be addressed.
Intranet Since the time the term intranet was coined in 1995, this concept of a private
network has gripped the corporate world. An intranet is a private computer network based
on the data communications standards of the public Internet. The applications posting
information over the intranet all reside within the firewall and, therefore, are more secure.
You can have all the benefits of the popular Web technology. In addition, you can
manage security better on the intranet.
Extranet The Internet and the intranet have been followed by the extranet. An extranet
is not completely open like the Internet, nor is it restricted just for internal use only like
an intranet. An extranet is an intranet that is open to selective access by outside parties.
From your intranet, in addition to looking inward and downward, you can look outward
and upward to your customers, suppliers, and business partners.
Figure 16-1 illustrates how information from the data warehouse may be delivered over
these information delivery mechanisms. Note how your data warehouse may be deployed
over the Web. If you choose to restrict your data warehouse to internal users, then you
adopt the intranet. If it has to be opened up to outside parties with proper authorization,
you go with the extranet. In both cases, the information delivery technology and the trans-
mission protocols are the same.
The intranet and the extranet come with several advantages. Here are a few:
† With a universal browser, your users will have a single point of entry for information.
† Minimal training is required to access information. Users already know how to use a
browser.
† Universal browsers will run on any systems.
† Web technology opens up multiple information formats to the users. They can receive
text, images, charts, even video and audio.
† It is easy to keep the intranet/extranet updated so that there will be one source of
information.
† Opening up your data warehouse to your business partners over the extranet fosters and
strengthens these partnerships.
† Deployment and maintenance costs are low for Web-enabling your data warehouse.
Primarily, the network costs are less. Infrastructure costs are also low.
WEB-ENABLED DATA WAREHOUSE 409
441.
Convergence of Technologies
Thereis no getting away from the fact that Web technology and data warehousing have con-
verged, and the bond is only getting stronger. If you do not Web-enable your data warehouse,
you will be left behind. For the past two decades, vendors have been racing one another
to release Web-enabled versions of their products. The Web offerings of the products are
exceeding the client/server offerings for the first time since Web offerings began to
appear. Indirectly, these versions are forcing the convergence of the Web and the data
warehouse even further.
Remember that the Web is more significant than the data warehouse. The Web and its
features will lead and the data warehouse has to follow. The Web has already pegged the
expectations of the users at a high level. Users will therefore expect the data warehouse to
perform at that high level. Consider some of the expectations promoted by the Web that
are now expected to be adopted by data warehouses:
† Fast response, although some Web pages may be comparatively slower
† Extremely easy and intuitive to use
† Up 24 hours a day, 7 days a week
† More up-to-date content
† Graphical, dynamic, and flexible user interfaces
† Almost personalized display
† Expectation to connect to anywhere and drill across.
Over the last few years, the number of Web-enabled data warehouses has increased sub-
stantially. How have these Web-enabled data warehouses fared so far? To understand the
SUPPLIERS
CUSTOMERS DISTRIBUTORS DEALERS
EXECUTIVES
MANAGERS
ANALYSTS
SUPPORT STAFF
IT STAFF
WAREHOUSE
ADMINISTRATORS
DATA
WAREHOUSE
INTERNAL
WAREHOUSE
USERS
EXTERNAL
WAREHOUSE
USERS
INTRANET
INTERNET
Firewall
EXTRANET
GENERAL
PUBLIC
Figure 16-1 Data warehouse and the Web.
410 DATA WAREHOUSING AND THE WEB
442.
effect of theconvergence of the two technologies, we must consider the three orders of
effects of decreasing costs as documented by Thomas W. Malone and John F. Rockart in
the early 1990s:
First-Order Effect: Simple substitution of the new technology for the old.
Second-Order Effect: Increased demand for the functions provided by the new
technology.
Third-Order Effect: The rise of new technology-intensive structures.
What has the convergence of the Web technology and data warehousing brought about
so far? Web warehousing appears to have passed through the first two stages. Companies
that have Web-enabled data warehouses have reduced costs by the substitution of the new
methods of information delivery. Also, the demand for information has increased following
the first stage. For most companies with Web-enabled data warehouses, progress stops when
they reach the end of the second stage.
Adapting the Data Warehouse for the Web
Much is expected of a Web-enabled data warehouse. That means you have to reinvent
your data warehouse. You have to carry out a number of tasks to adapt your data warehouse
for the Web. Let us consider the specific provisions for Web-enabling your data warehouse.
First, let us get back to the discussion of the three stages following the introduction
of a new technology. Apart from reducing costs from the substitution, demand for business
intelligence has increased. Many companies seem to be stuck at the end of the second stage.
Only a few companies have moved on to the next stage and have realized third-order results.
What are these results? Some include extranet and consumer data marts, management by
exception, and automated supply and value chains. When you adapt your data warehouse
for the Web, make sure that you do not stay put at the second stage. Make plans to exploit
the potential of the Web and move on to the third stage where the real benefits are found.
Study the following list of requisites for adapting the data warehouse to the Web.
Information “Push” Technique. The data warehouse was designed and implemented
using the “pull” technique. The information delivery system pulls information from
the data warehouse based on requests, and then provides it to the users. The Web
offers another technique. The Web can “push” information to users without their
askingforiteverytime.Yourdatawarehousemustbeabletoadoptthe“push”technique.
Ease of Usage. With the availability of clickstream data, you can very quickly check the
behavior of the user at the site. Among other things, clickstream data reveals how easy
or difficult it is for the users to browse the pages. Ease of use appears at the top of the
list of requirements.
Speedy Response. Some data warehouses allow jobs to run long to produce the desired
results. In the Web model, speed is expected and cannot be negotiated or
compromised.
No Downtime. The Web model is designed so that the system is available all the time.
Similarly, the Web-enabled data warehouse has no downtime.
Multimedia Output. Web pages have multiple data types: textual, numeric, graphics,
sound, video, animation, audio, and maps. These types are expected to show as
outputs in the information delivery system of the Web-enabled data warehouse.
WEB-ENABLED DATA WAREHOUSE 411
443.
Market of One.Web information delivery is tending to become highly personalized, with
dynamically created XML pages replacing static HTML coding. Web-enabled data
warehouses will have to follow suit.
Scalability. More access, more users, and more data—these are the results of Web-
enabling the data warehouse. Therefore, scalability becomes a primary concern.
The Web as a Data Source
When you talk about Web-enabling the data warehouse, the first and perhaps the only
thought that comes to mind is the use of Web technology as an information delivery mech-
anism. Ironically, it rarely crosses your mind that Web content is a valuable and potent data
source for your data warehouse. You may hesitate before extracting data from the Web for
your Web-enabled data warehouse.
Information content on the Web is so disparate and fragmented. You need to build a
special search and extract system to sift through the mounds of information and pick up
what is relevant for your data warehouse. Assume that your project team is able to build
such an extraction system, then selection and extraction consists of a few distinct steps.
Before extraction, you must verify the accuracy of the source data. Just because data
was found on the Web, you cannot automatically assume it is accurate. You can get clues
to accuracy from the types of sources. Figure 16-2 shows an arrangement of components
for data selection and extraction from the Web.
How can you use Web content to enrich your data warehouse? Here are a few
important uses:
† Add more descriptive attributes to the business dimensions.
† Include nominal or ordinal data about a dimension so that more options are available
for pivoting and cross-tabulations.
The Web
Data
Selection
and
Extraction
DATA
WAREHOUSE
Operational
Systems
External
Data
Queries Reports
Data Warehouse Users
Figure 16-2 Web data for the data warehouse.
412 DATA WAREHOUSING AND THE WEB
444.
† Add linkagedata to a dimension so that correlation analysis with other dimensions can
be performed.
† Create a new dimension table.
† Create a new fact table.
What we have discussed here is much beyond the usual use of the Web as an information
delivery medium. Data selection and data extraction from the Web is a radically new
paradigm. If your project team is willing to try it in your data warehouse environment, the
results will be worthwhile.
Clickstream Analysis
As you Web-enable your data warehouse, you find that enormous clickstream data of the
visitors to your organization’s Web site becomes available. This is valuable data. You can
set up mechanisms to extract, transform, and load the clickstream data to the Webhouse
repository. You may build this repository based on dimensional schemas and then deploy
information delivery systems to the repository.
Considerations for Clickstream Data Retrieval A few considerations regarding
extracting and preparing clickstream data:
† Server logs usually contain multiple entries from a single page request.
† Proxy servers pose problems of confusing the identity of a session and why
it ended.
† Basic clickstream data must be extracted from multiple servers.
† Retrieval of individual customer data is difficult as it gets buried in other data relating
to pages served, browser types, hosts, etc.
† Identifying the separate sessions in a data stream is very involved requiring cookies or
other session identification numbers.
† Clickstream data preparation is very time-consuming.
Usefulness of Clickstream Data Clickstream data may be the most important source
for identifying and retaining e-commerce customers. The following is a list of useful
information derivable from clickstream data:
† Effectiveness of sales promotions
† Affinities between products that are likely to be bought together
† Customer demographics
† General buying patterns of customers
† Referring partner links
† Site statistics
† Site navigations resulting in sales
† Site navigations not producing sales
† Ability to differentiate between customer types
WEB-ENABLED DATA WAREHOUSE 413
445.
WEB-BASED INFORMATION DELIVERY
Wehave seen how the convergence of Web technology and data warehousing is inevitable.
The two technologies deal with providing information. Web technology is able to deliver
information more easily, around the clock. It is no wonder that companies want to Web-
enable their data warehouses.
Other advantages and possibilities also emerge when you connect the warehouse to the
Web. One such benefit is the ability to come up with newer ways of making the data
warehouse more effective through extranet data marts and the like. We also looked at the
possibility of using the Web as a data source for your warehouse.
Nevertheless, better information delivery remains the most compelling reason for adapt-
ing the data warehouse for the Web. The Web brings a new outlook on information delivery
and revolutionizes the process. Let us, therefore, spend some time on Web-based infor-
mation delivery. How does the Web escalate the usage of the data warehouse? What
are the benefits and what are the challenges? How do you deal with the dramatic change
in information delivery brought about by the Web?
Expanded Usage
No matter how you look at it, the advantages of connecting the data warehouse to the Web
appear to be amazing. Users can use the browser to perform their queries easily and at
any time during the day. There are no headaches associated with synchronizing distributed
data warehouses present in client/server environments. Use of the data warehouse expands
beyond internal users. Interested parties from outside can now be granted access to use the
warehouse content. As the usage expands, scalability no longer poses a serious problem.
What about the cost of training the users? Of course, training costs are minimal because
of the use of the Web browser. Everything looks good and usage expands.
Let us understand what happens to the growth. Initially, your Web-enabled data ware-
house may receive only 500 to 5000 hits a day, but depending on your audience, this
number can skyrocket within a short time. What does more users imply? Simply, more
information delivery. Also, more information delivery in a 24/7 environment. The Web
never shuts down.
Examine this phenomenon of extraordinary growth. Universal access generates a
whole set of challenges that must be faced. Primarily, this imposes additional strain on
your Web-enabled data warehouse. Although scalability to accommodate more users and
rapid expansion in the usage is no longer as strenuous as in a client/server environment,
it is still a basic challenge.
Let us understand the pattern of this growth in usage. Two distinct factors foster the
growth: first, a totally open window that never shuts, next, an easy and intuitive access
mechanism via the ubiquitous Web browser. As a result, you have two challenges to contend
with. The first is the increase in the user population. The second is the rapid acceleration of
the growth. If you have opened your data warehouse to customers and business partners
through an extranet, you will notice the steep expansion curve even more.
Let us call this extraordinary growth “supergrowth” and inspect the phenomenon.
Refer to Figure 16-3, which charts this phenomenon. The striking feature of supergrowth
manifests itself in your inability to scale up in time to contain the growth. The user base
will grow faster than your ability to scale up your Web-enabled data warehouse to
meet the expanding usage requirements. You cannot simply add processors, disk drives,
414 DATA WAREHOUSING AND THE WEB
446.
or memory fastenough to meet the escalating demand, so how do you deal with
supergrowth?
Let us propose an initial approach. Is it possible to anticipate the problem and avoid it
altogether in the first place? In other words, can you control the growth and thereby come
to grips with the problem. When you Web-enable your data warehouse, the first instinct
is to become overenthusiastic and open the warehouse instantly to the public. This is like
opening the floodgates without warning. But in order to control the growth, you have to con-
tain your zeal and open up the warehouse in well-defined stages. This becomes absolutely
necessary if the usage pattern is not very clear. Do not open the warehouse to the public
at all, initially. First, let a few of your internal users have access. Then add some more
users to the group. Include more and more in staged increments. In this manner, you can con-
stantly monitor the growth pattern in usage. Adopt the same cautionary approach when it
comes to opening up the data warehouse to the public in the second wave.
What if your circumstances warrant opening up the Web-enabled data warehouse in one
swoop to all users, internal and external? What if the staged approach described above is not
feasible in your case? What if you cannot avoid supergrowth? The key to answering these
questions lies in a specific characteristic of the growth curve. Notice that supergrowth
occurs only in the very initial stages. After the initial stages, the usage curve seems to
level off, or at least the rate of increase becomes manageable. With this fact in mind, let
us see how we can deal with supergrowth.
The secret lies in finding the point up to which the usage will grow and then level off.
Go back to Figure 16-3 showing the supergrowth curve. The graph shows that the hyper-
growth stage lasts until early December and is expected to level off at 750 users. Even if
you start with 100 users, you are likely to hit the level of 750 users very soon. So, even if
the intention is to start with just 100 users, let your initial offering of the Web-enabled
data warehouse have enough resources to accommodate 750 users. But how do you come
up with the number of 750 users and that the point of leveling off is early December?
There are no industry-standard charts to predict the supergrowth patt


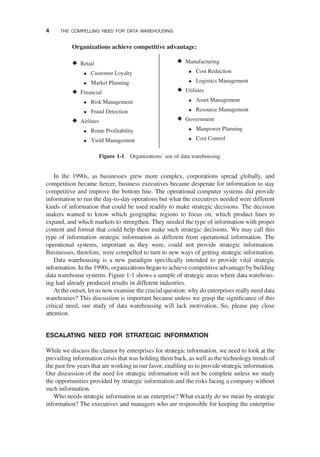
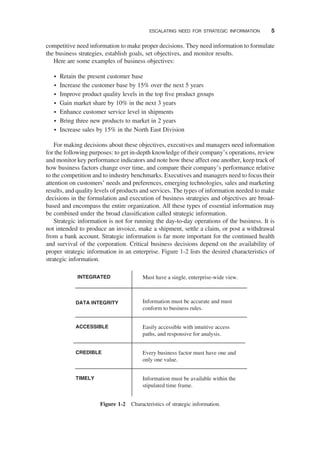
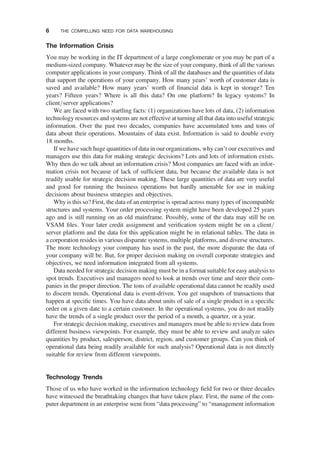
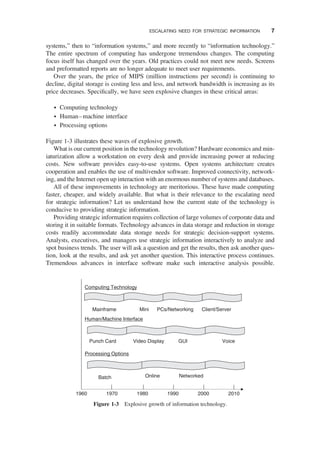
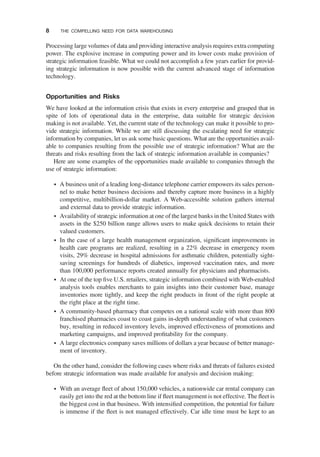
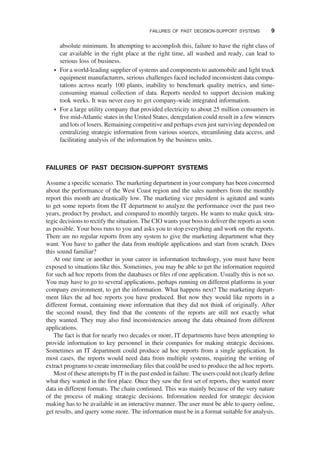
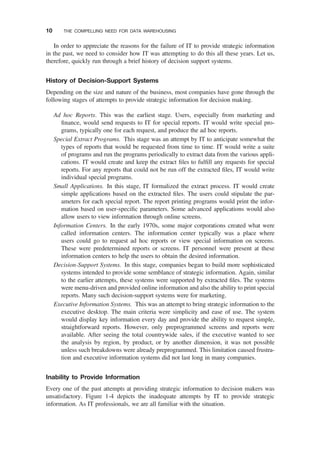
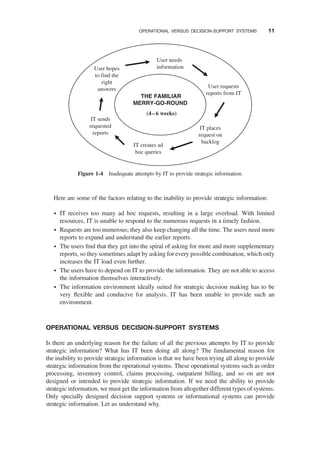
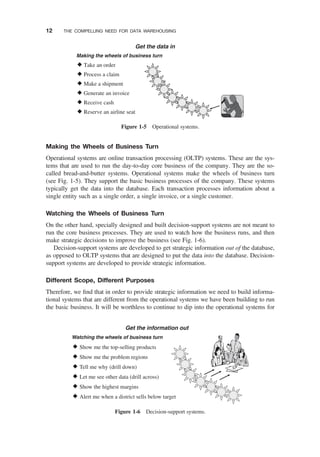
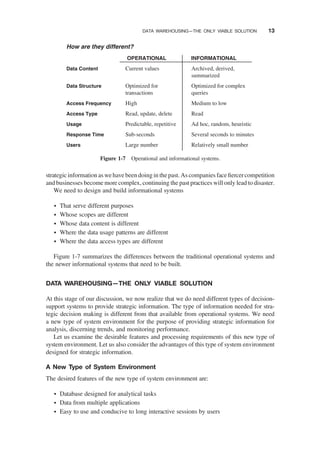
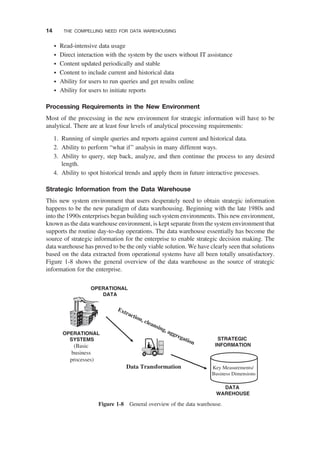
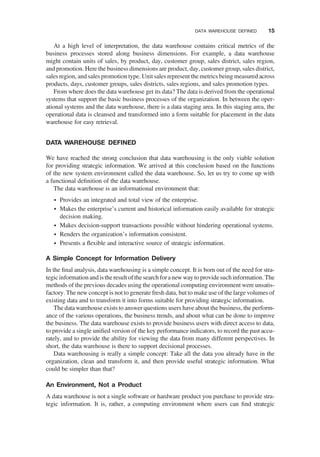
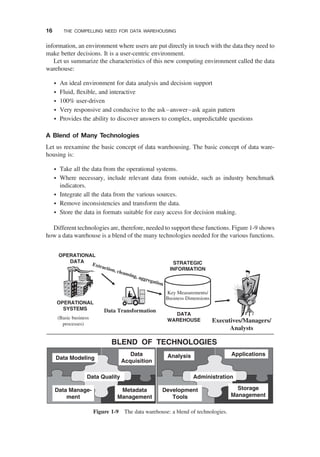
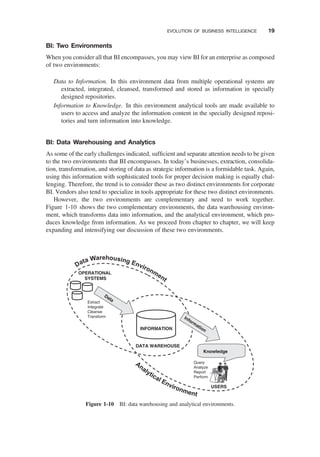

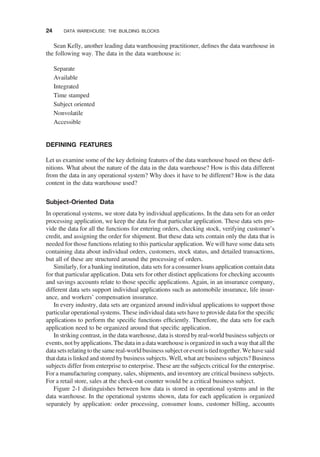
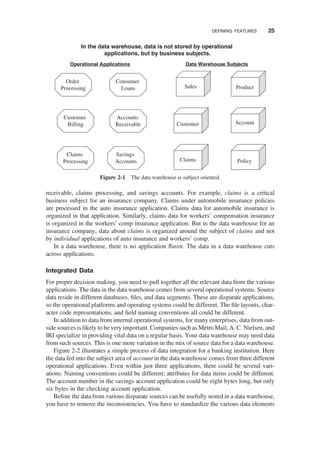
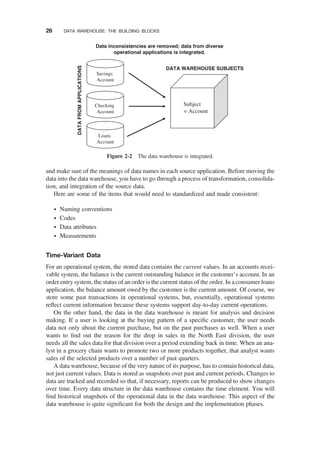
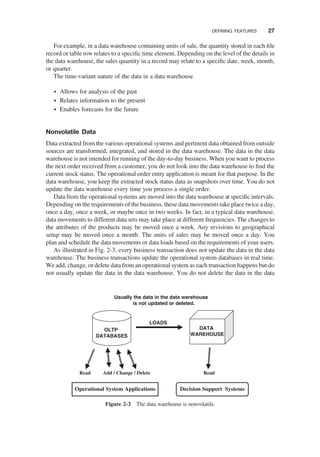
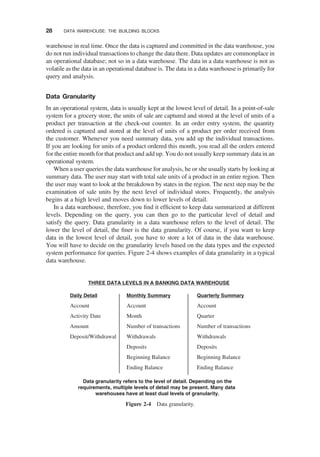
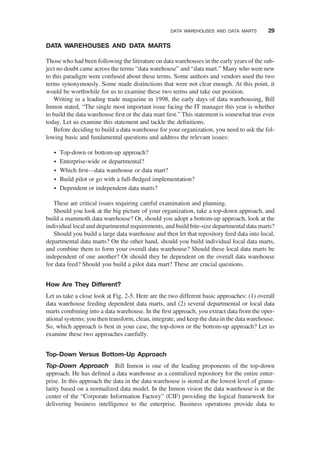
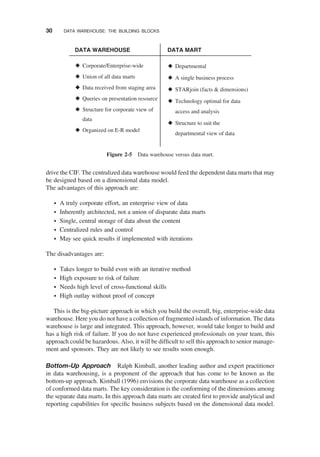
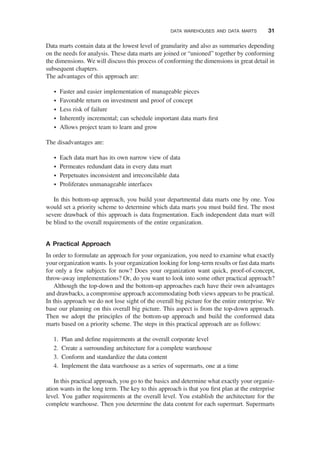
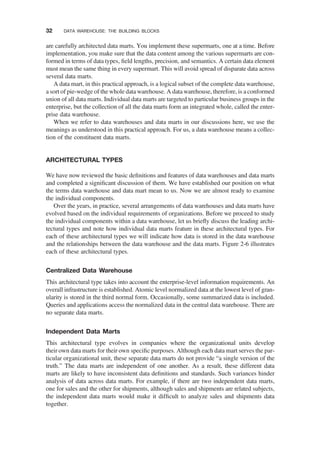
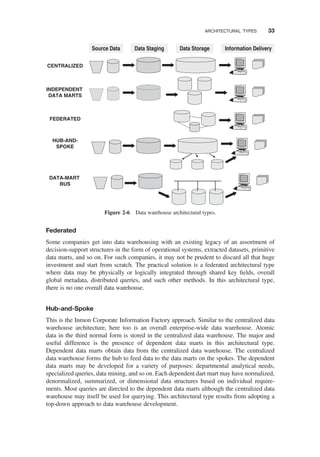
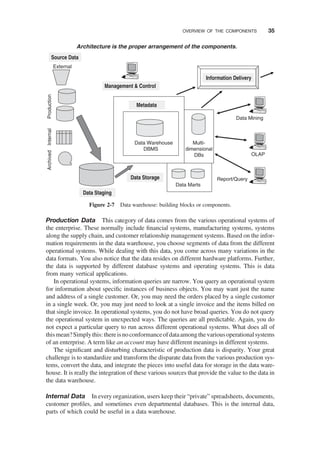
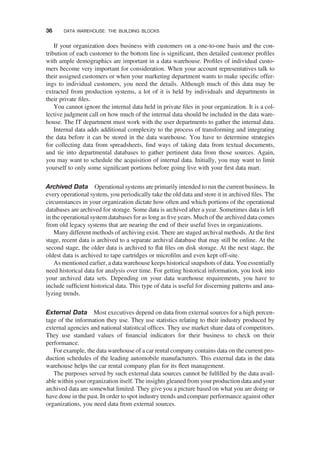
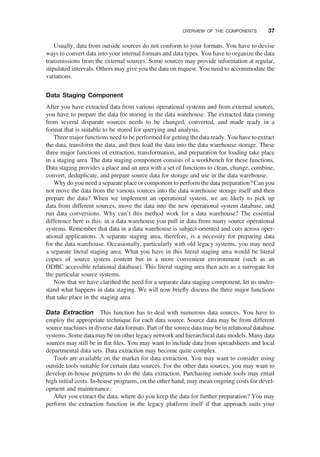
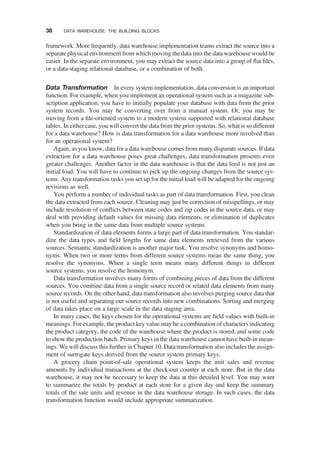
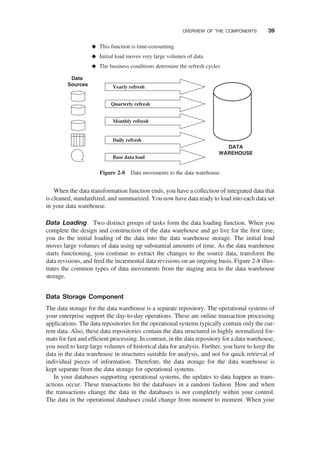
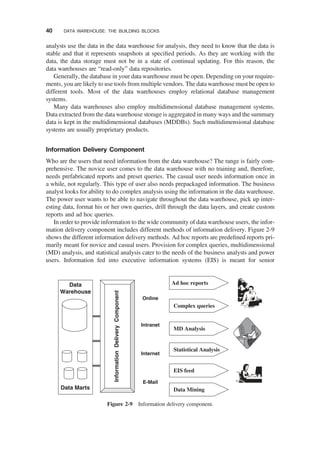
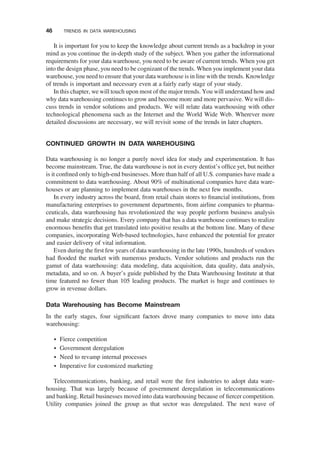
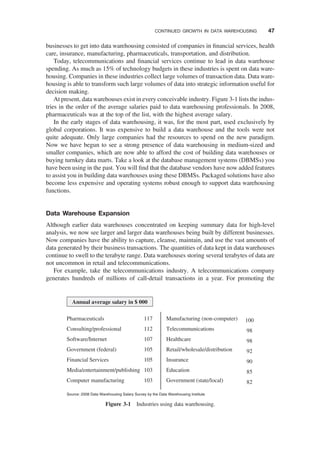
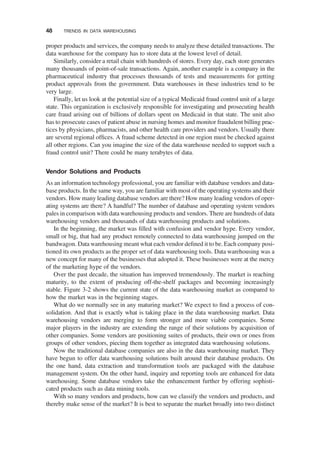
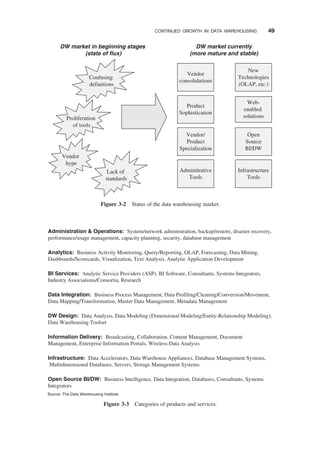
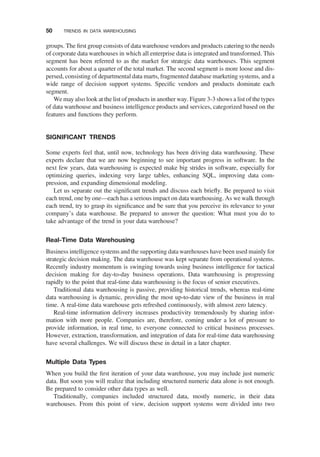
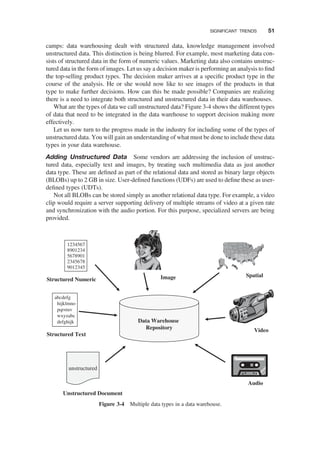
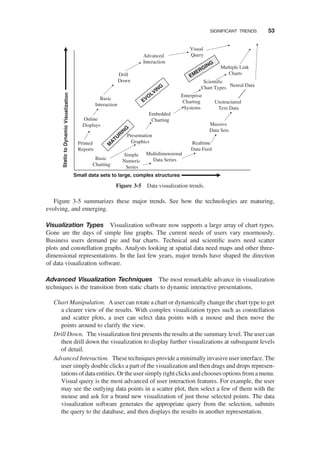
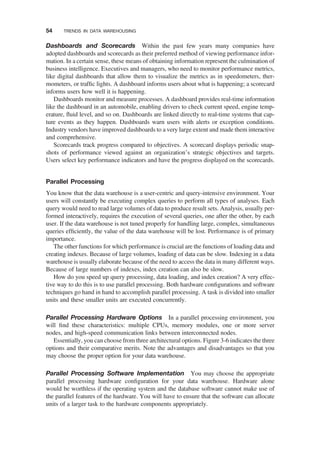
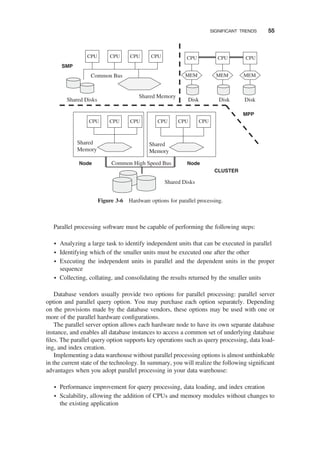
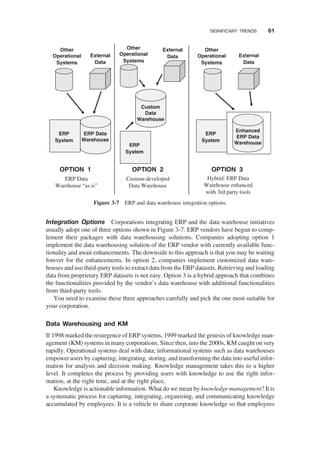
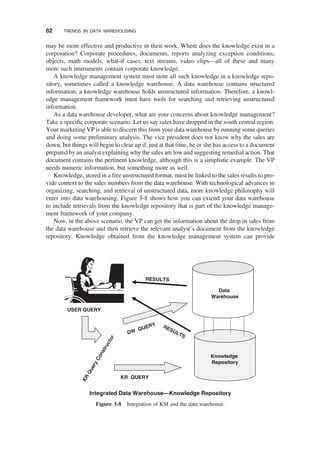
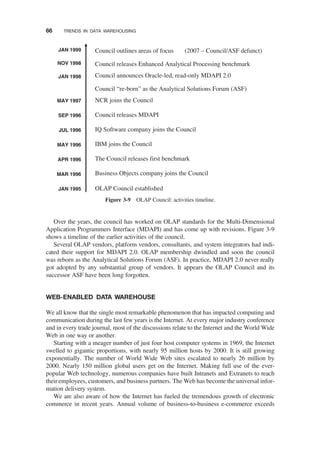
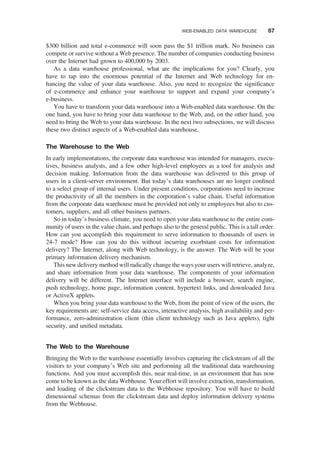
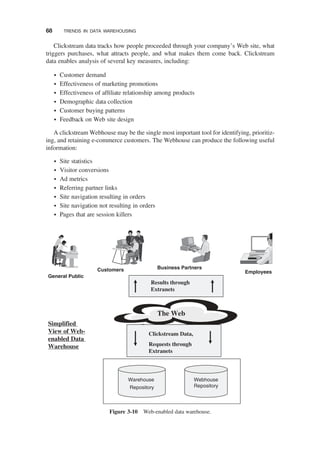


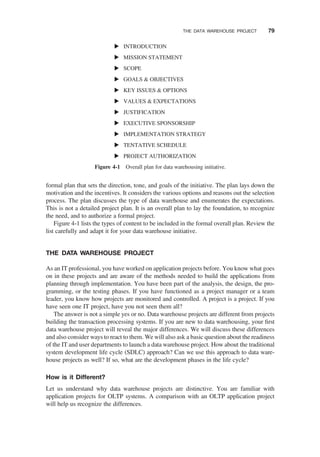
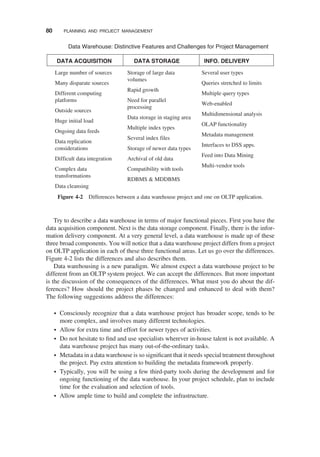
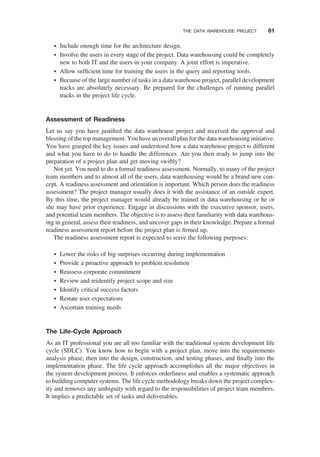
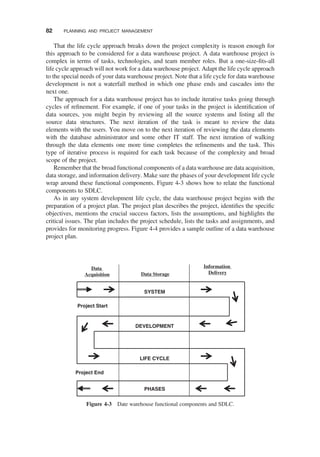
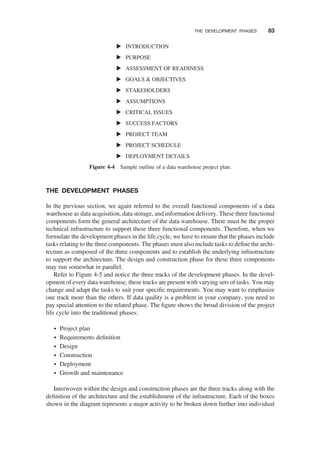
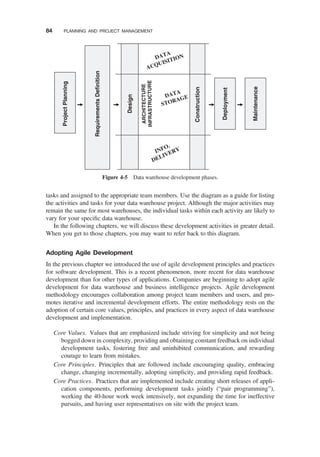
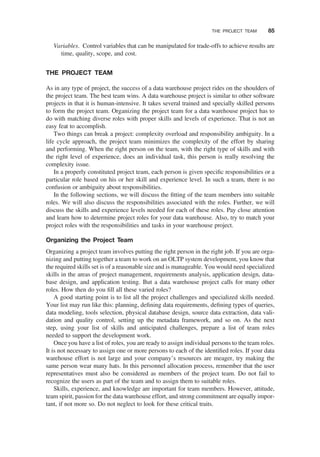
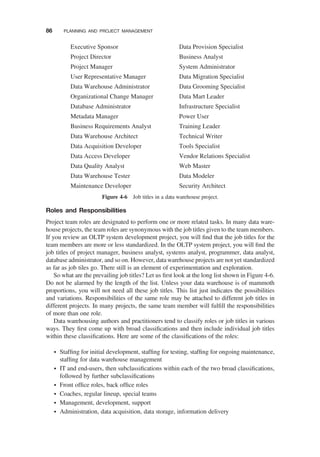
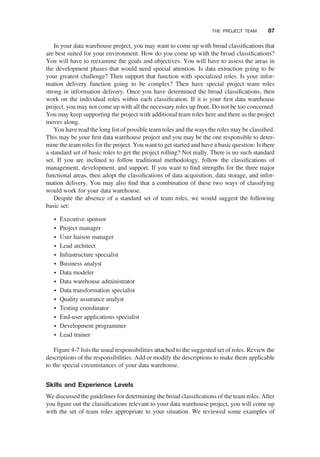
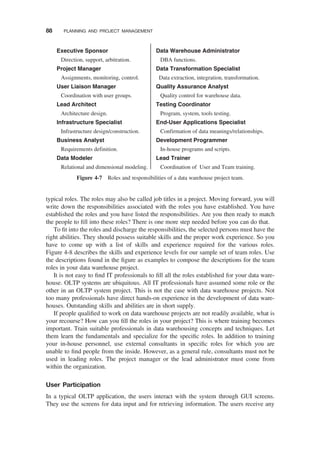
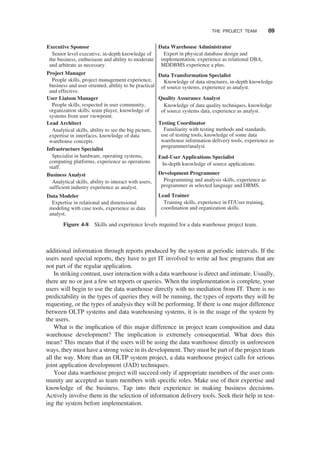
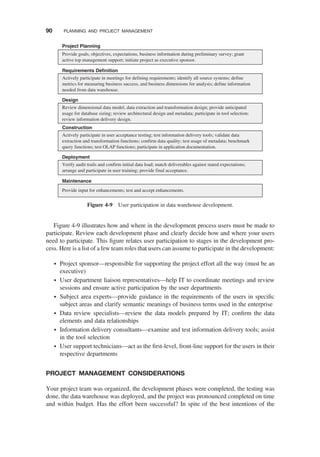
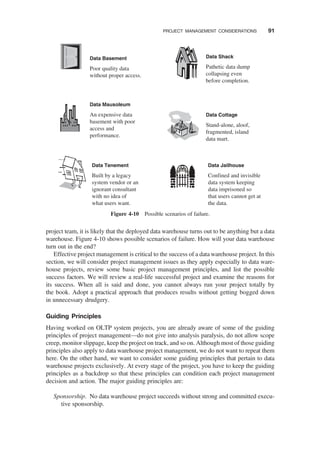
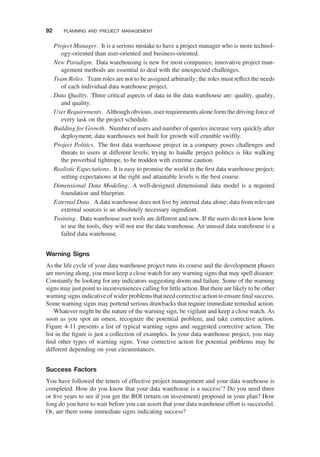
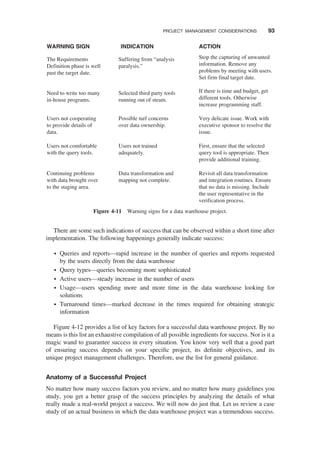
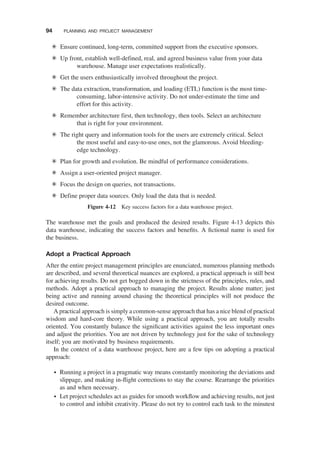
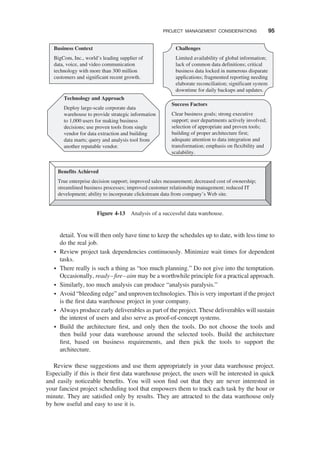

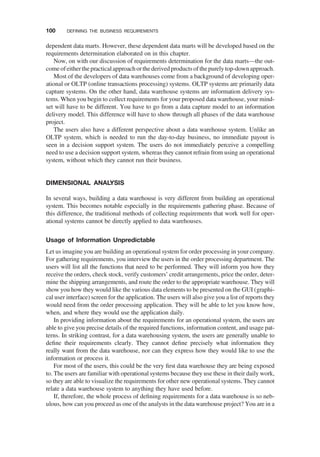
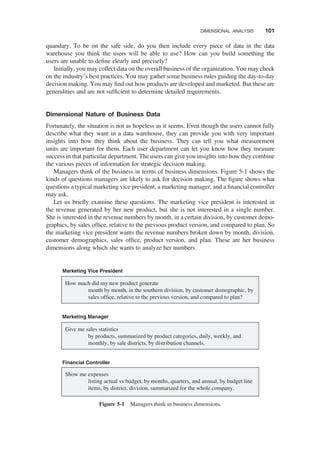
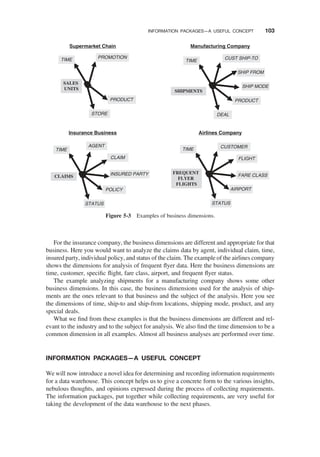
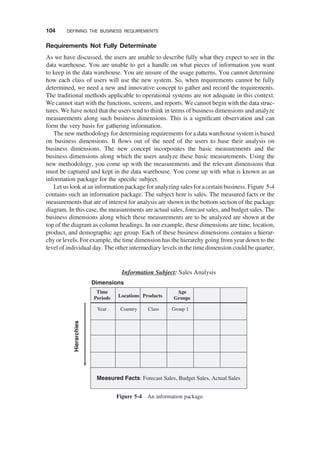
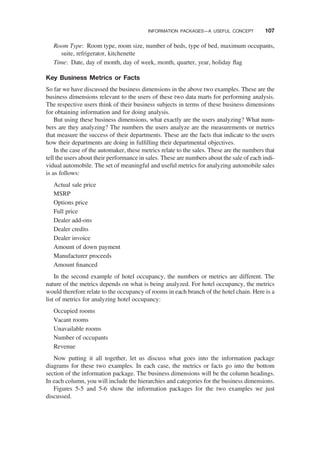
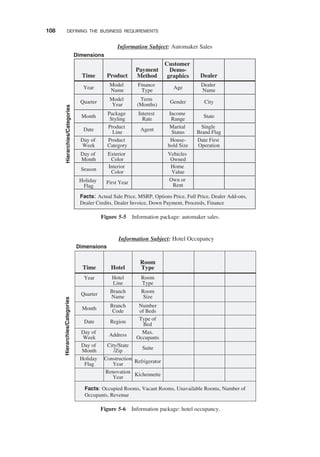
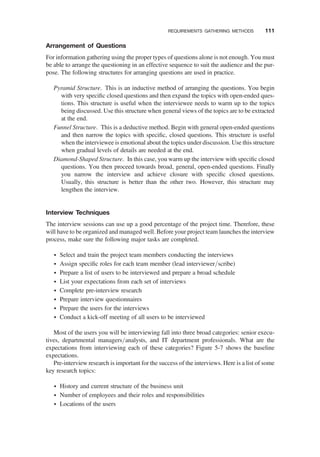
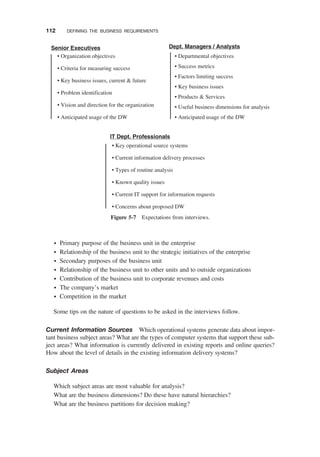
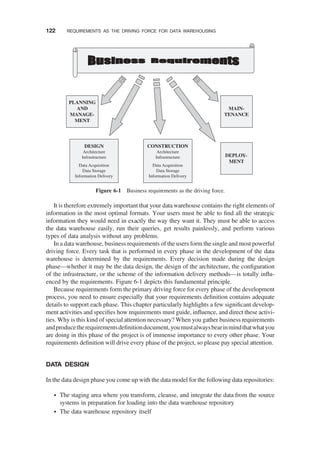
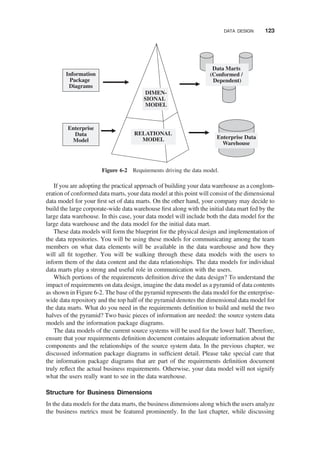
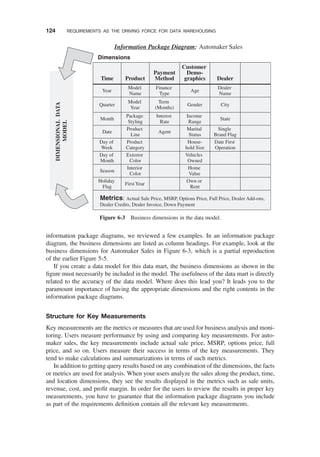
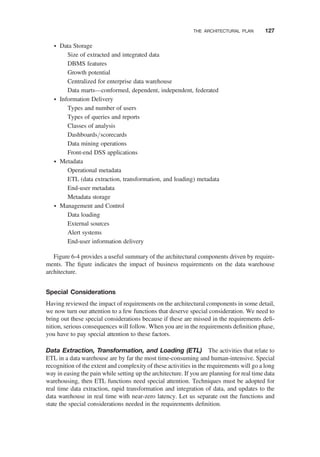
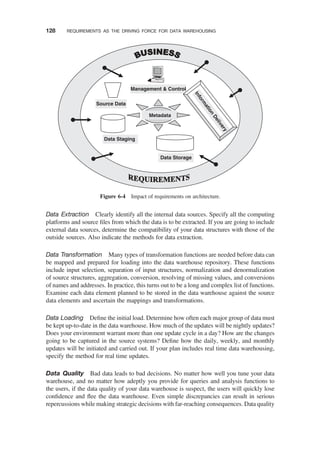
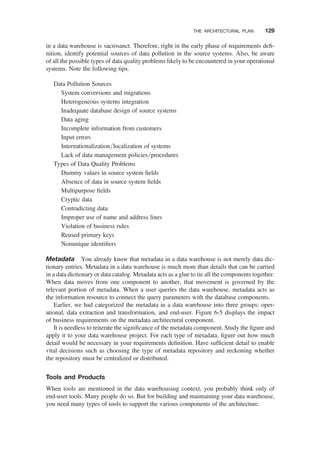
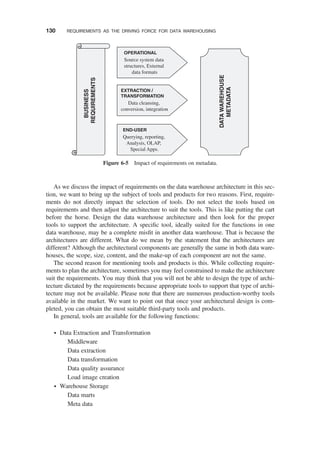
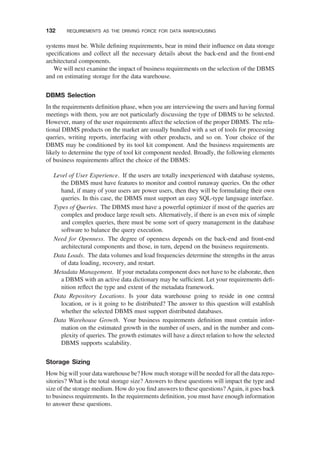
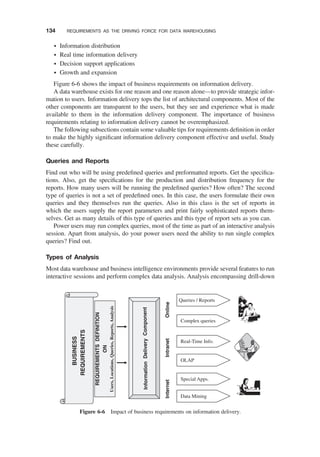


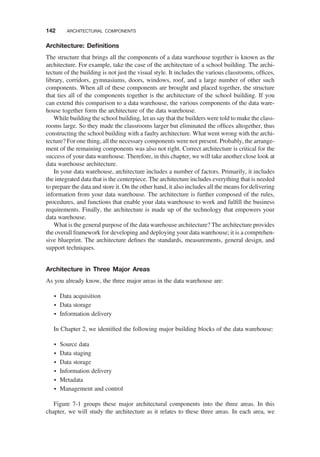
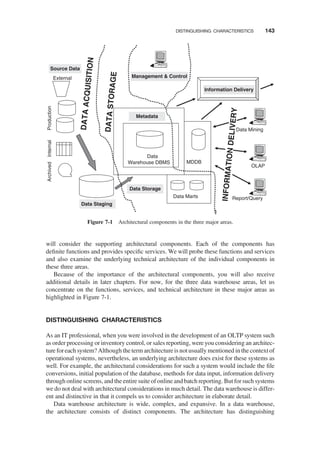
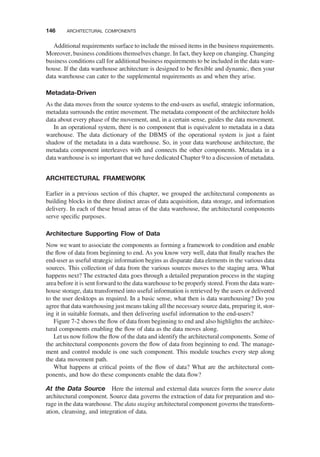
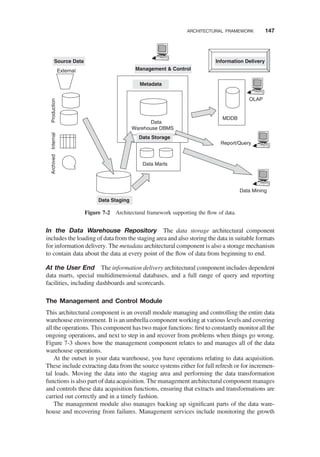
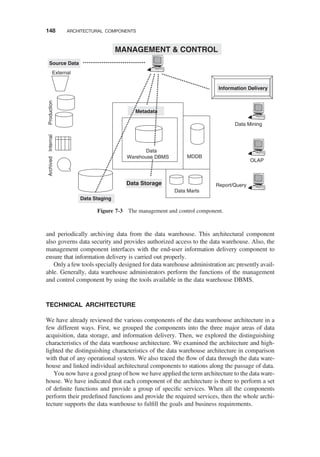
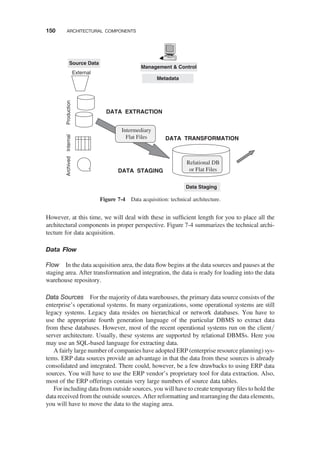
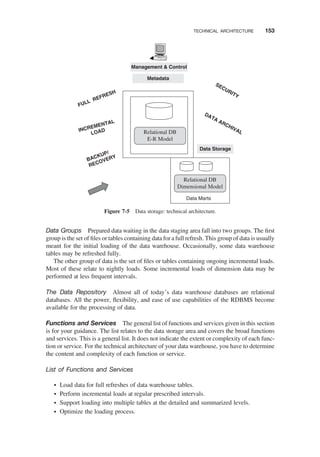
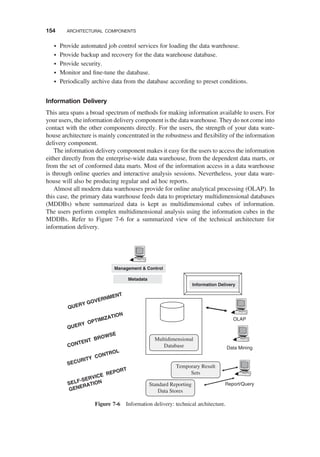
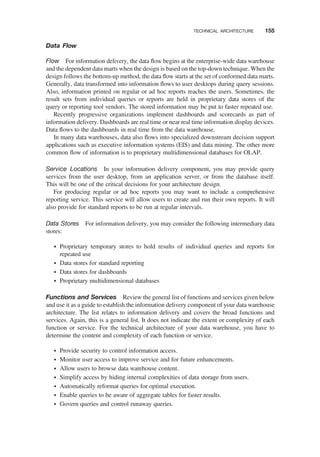
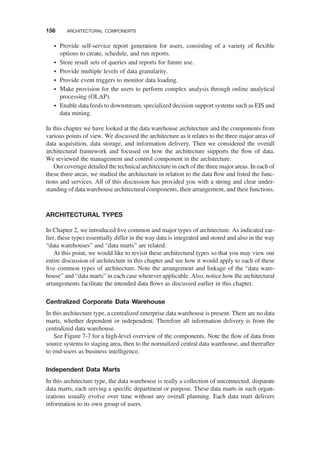
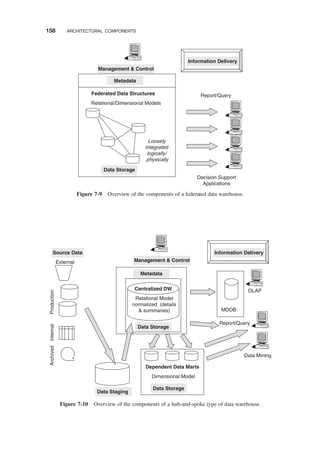

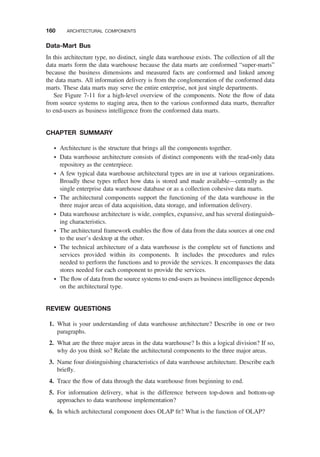

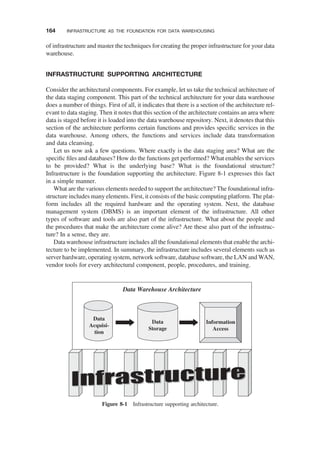
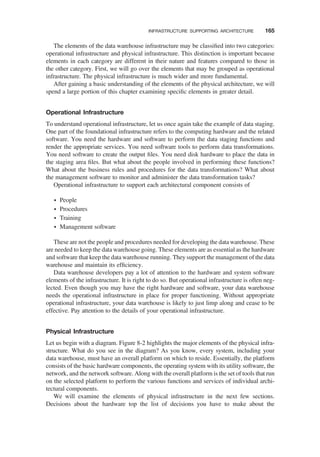
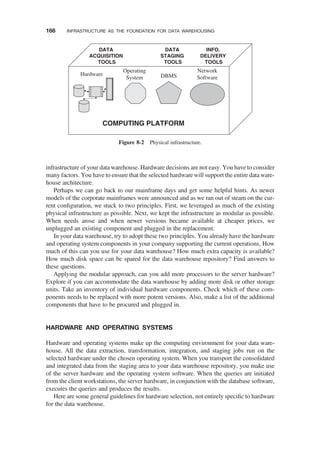
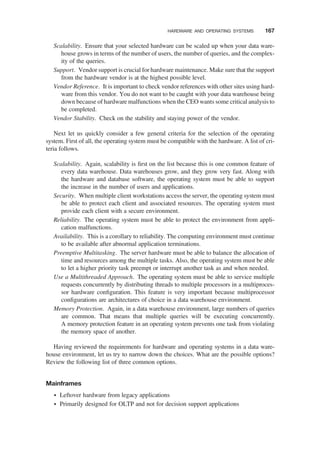
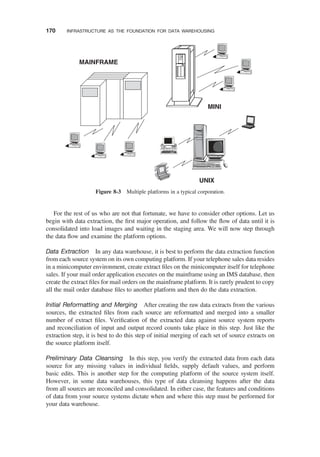
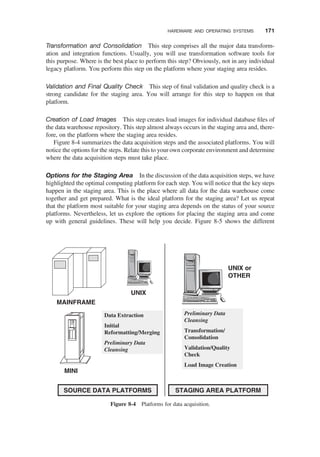
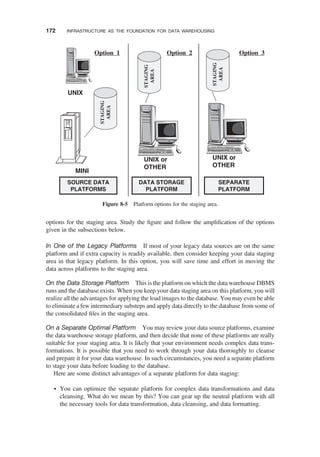

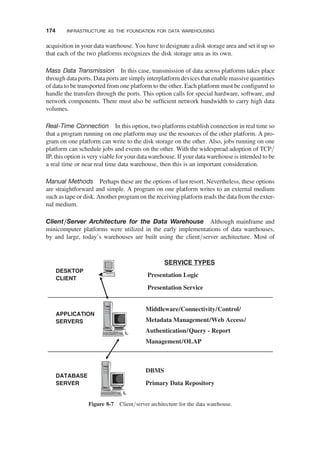
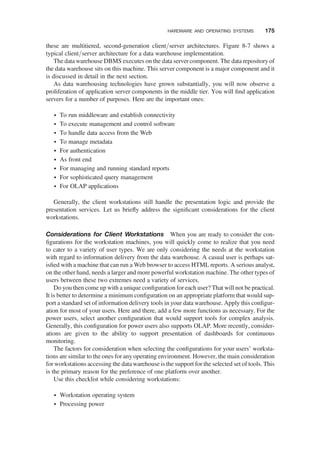
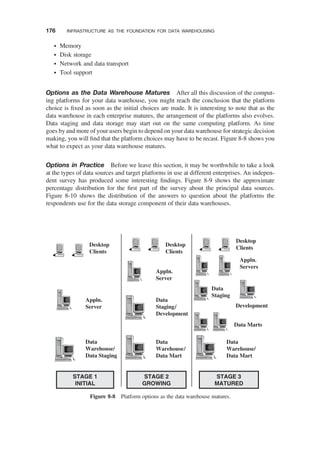
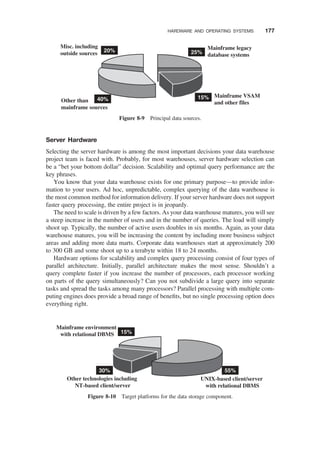
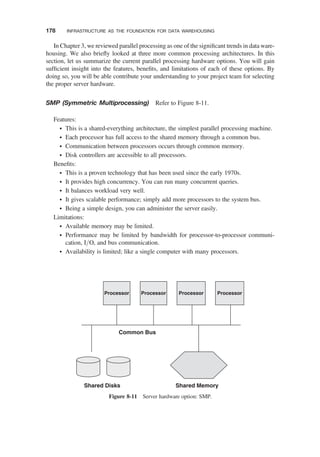
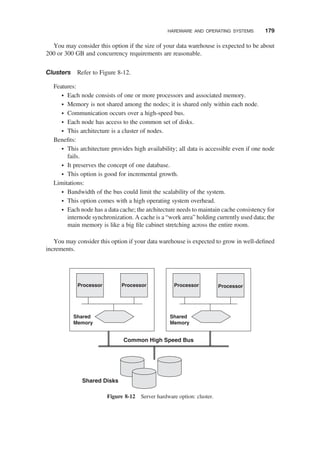
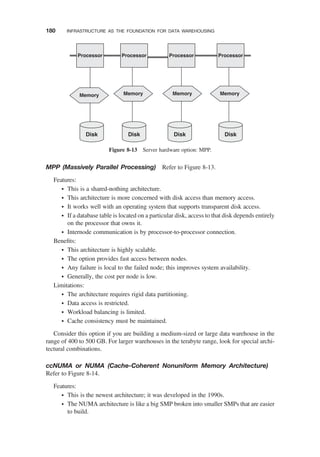
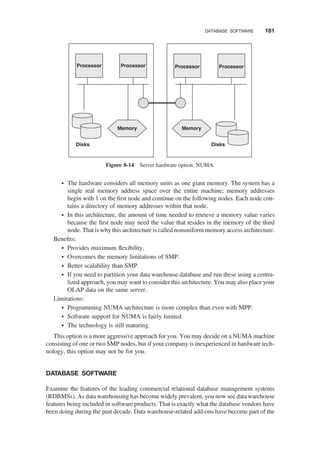
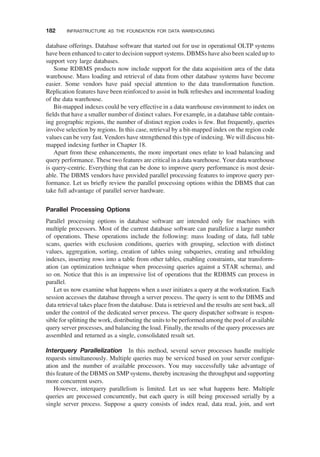
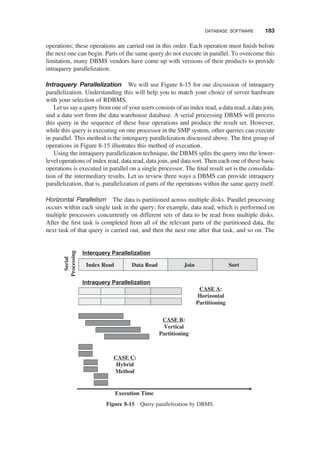
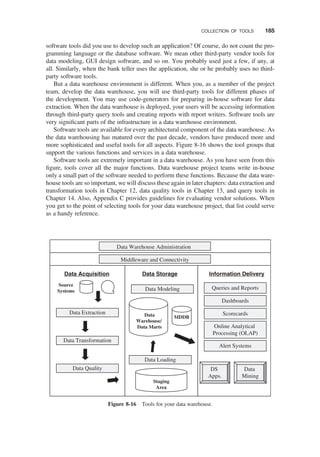
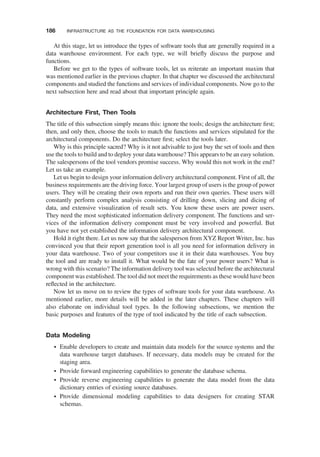
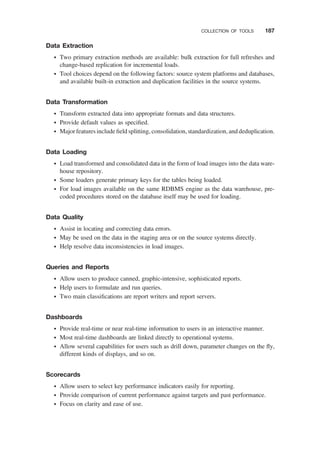
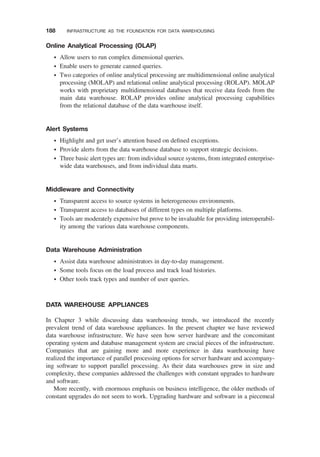
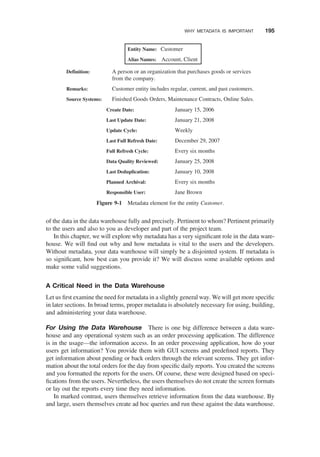
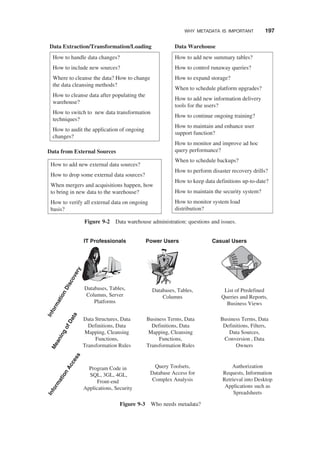
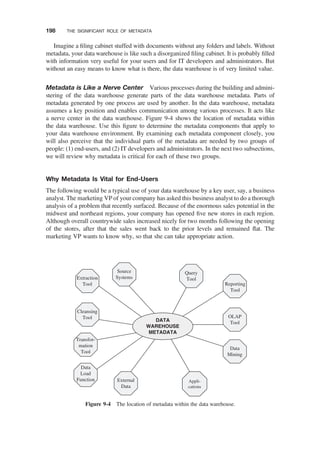
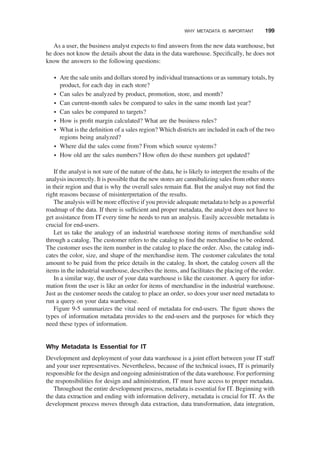
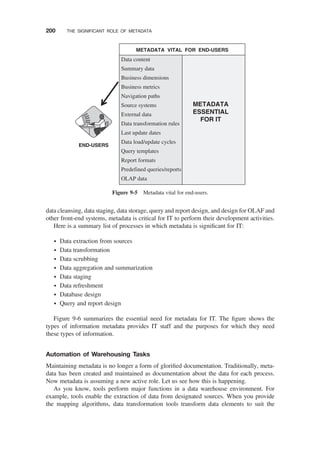
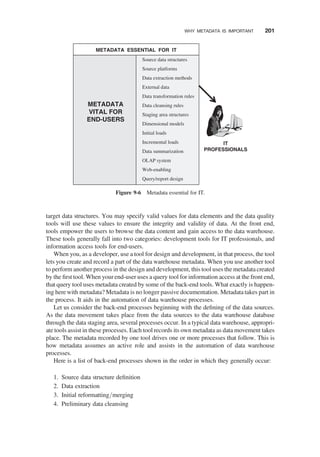
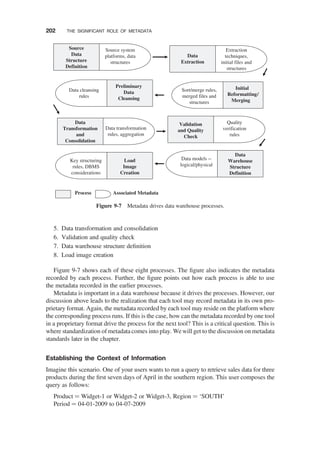
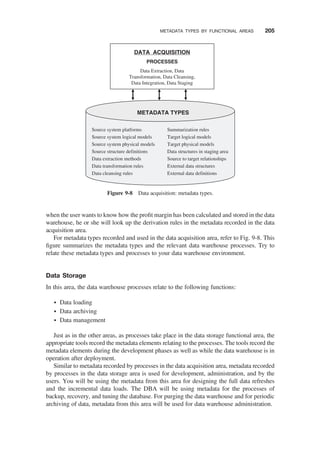
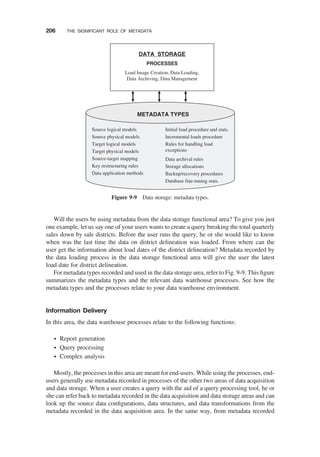
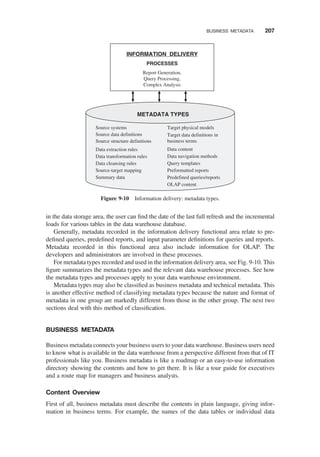
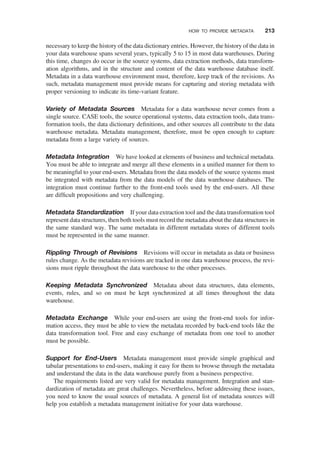
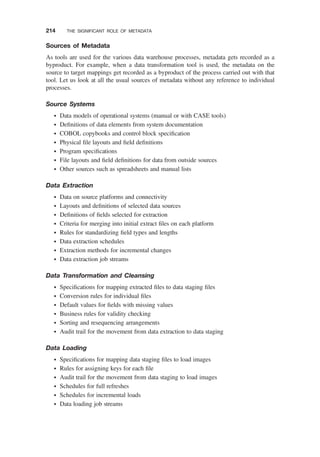
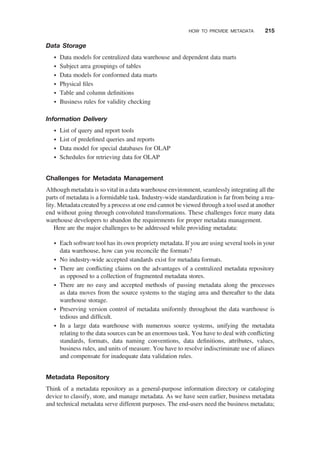
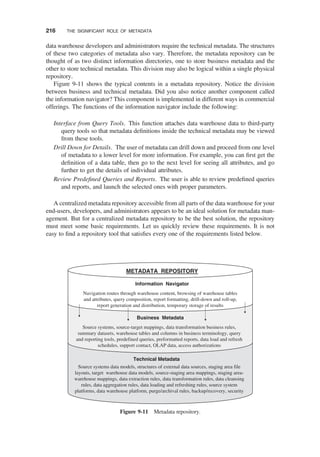
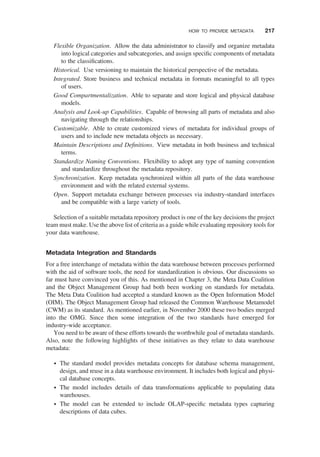
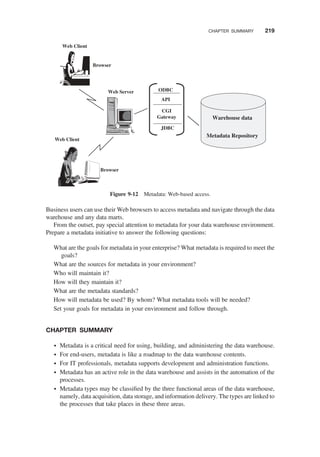


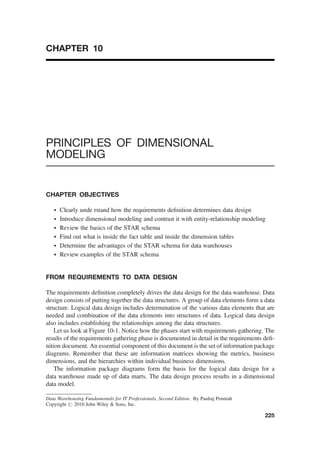
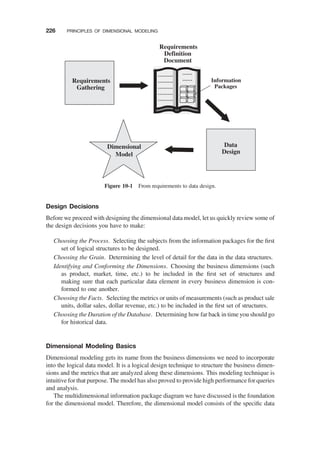
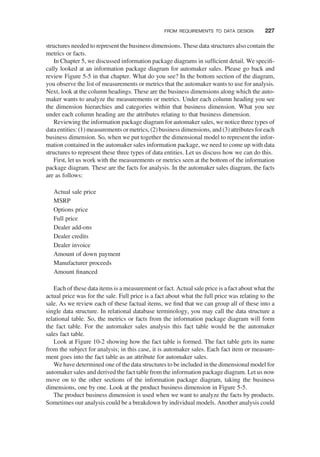
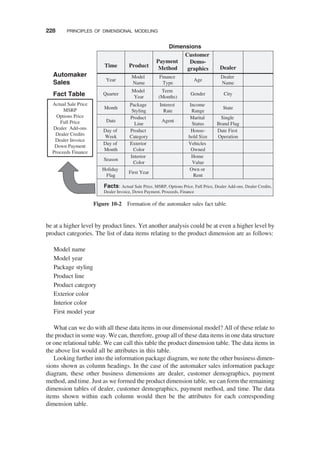
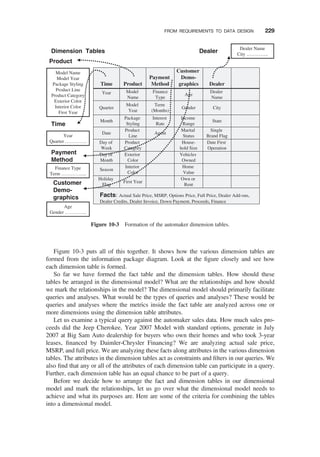
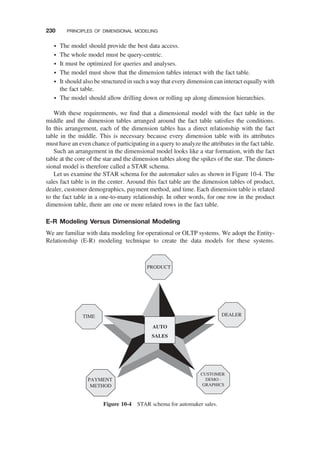
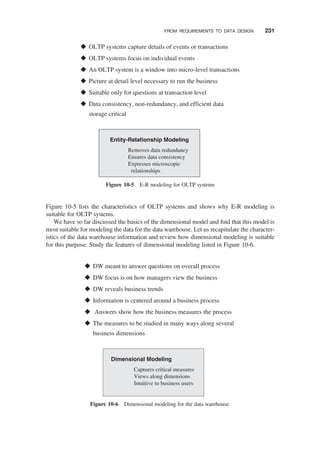
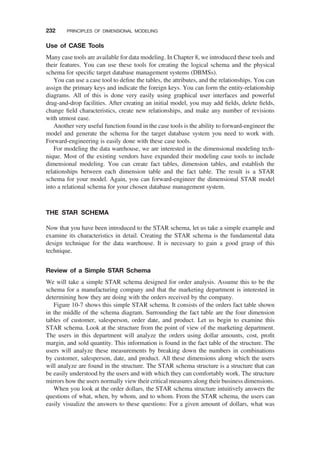
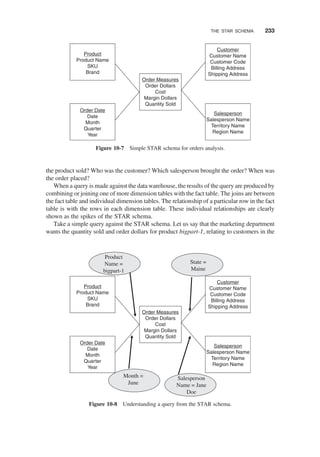
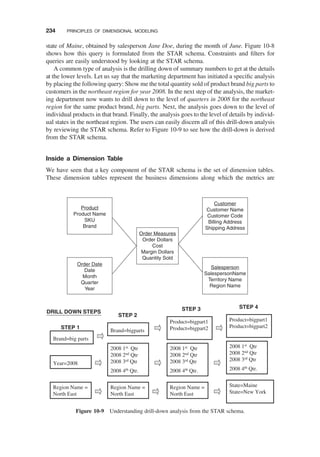
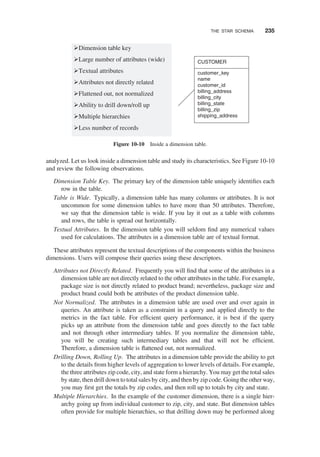
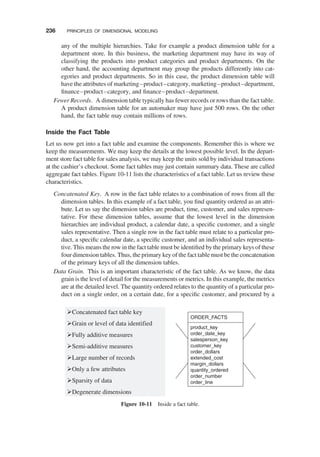
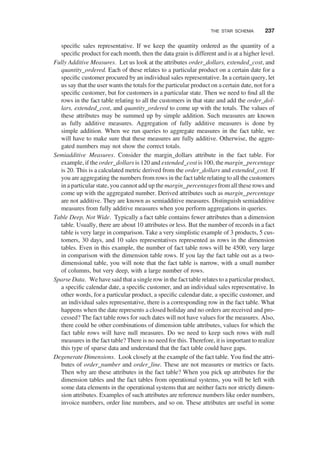
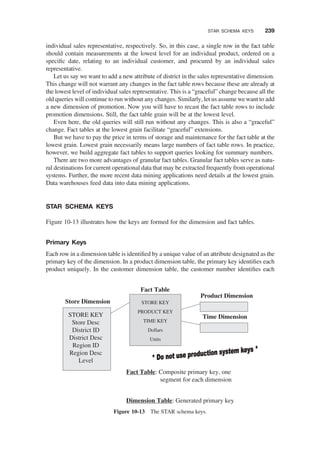
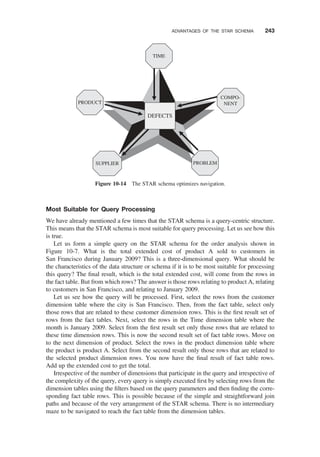
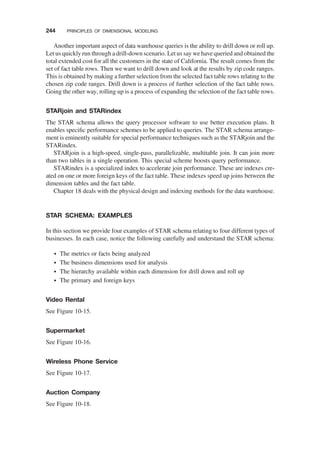
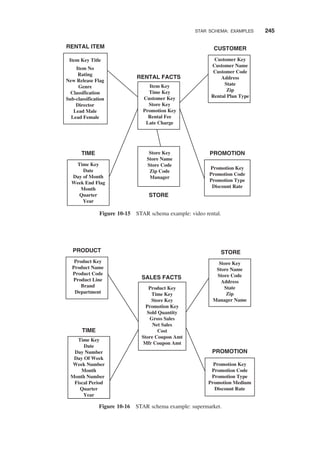
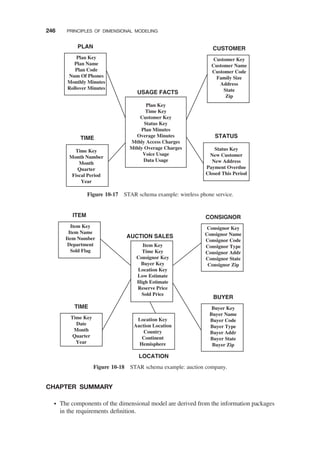

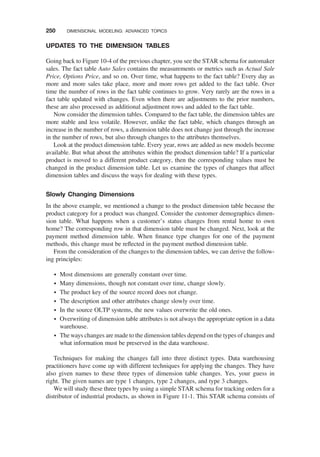

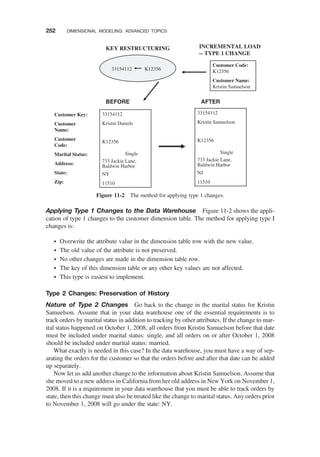
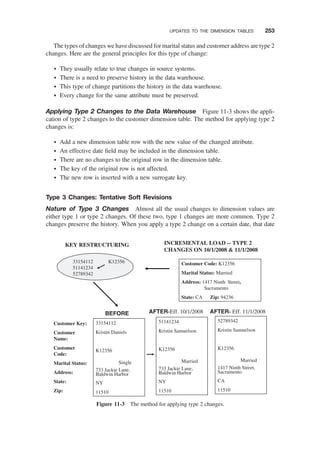
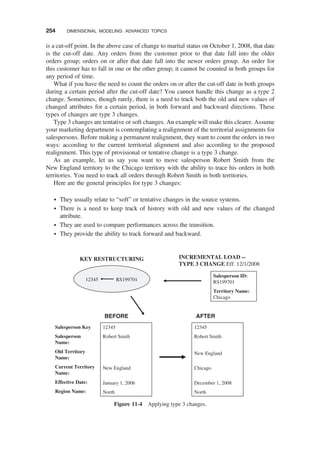
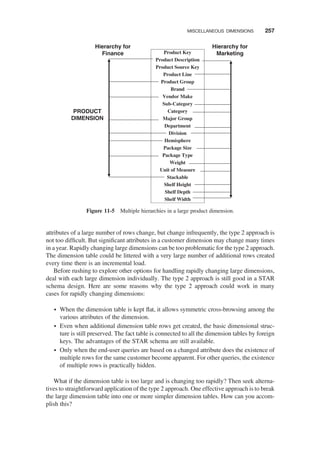
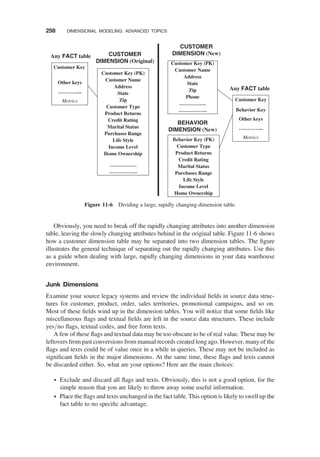

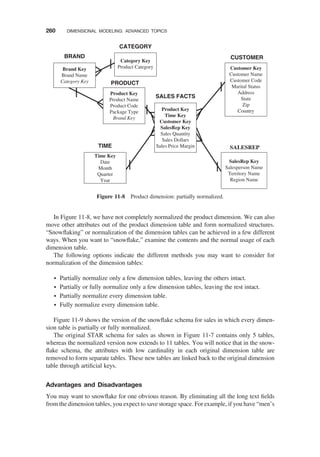
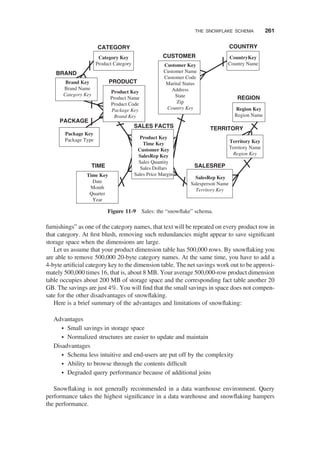
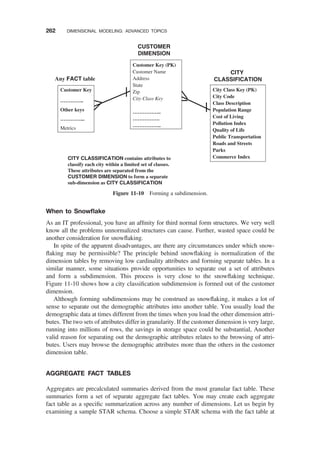
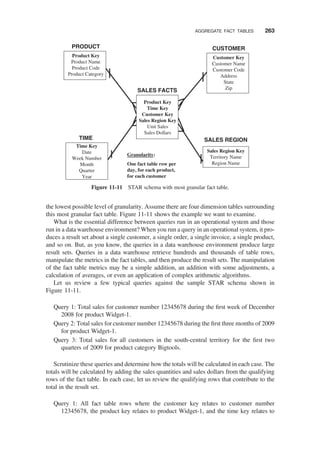
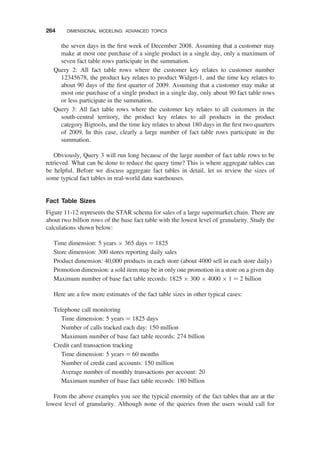
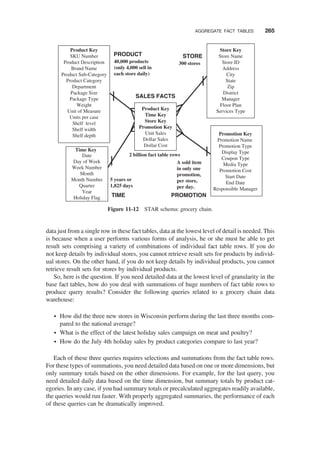
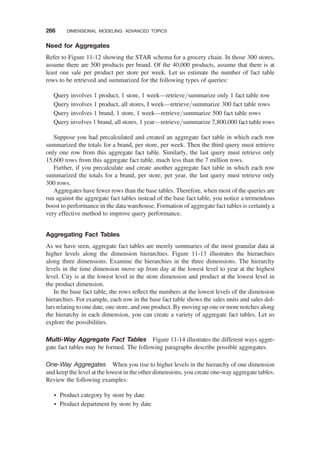
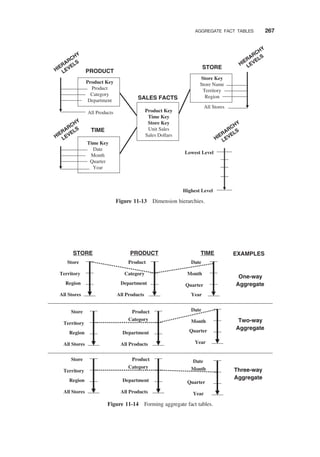
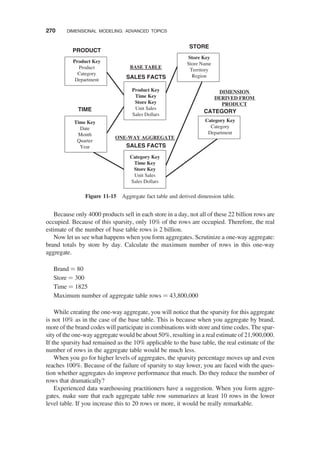
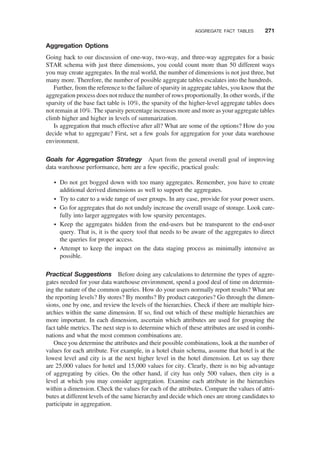
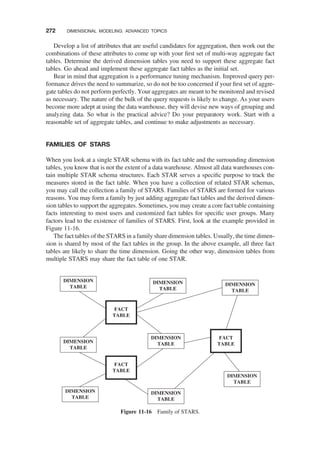
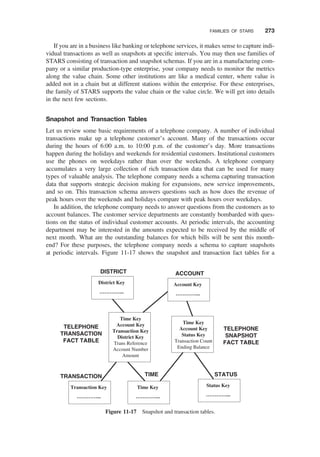
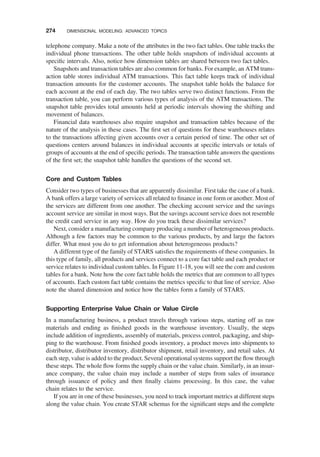
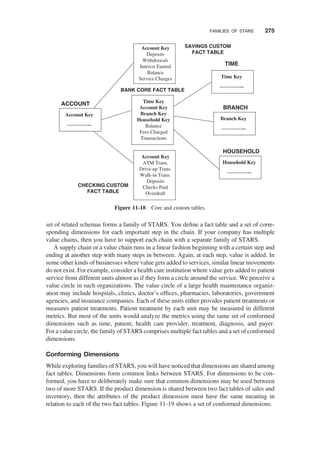
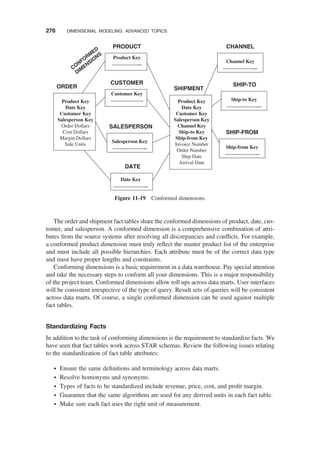
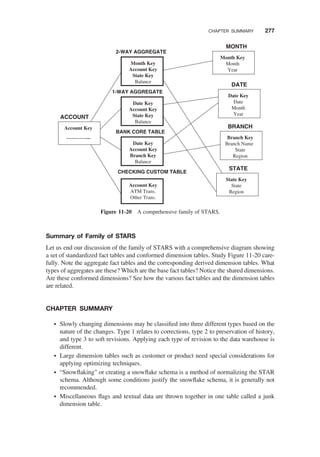


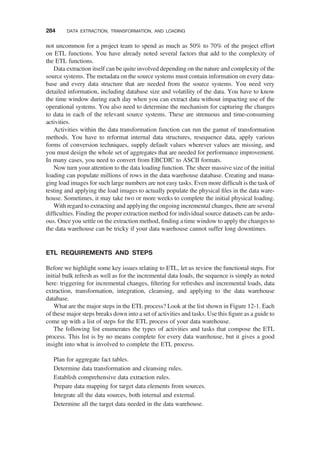
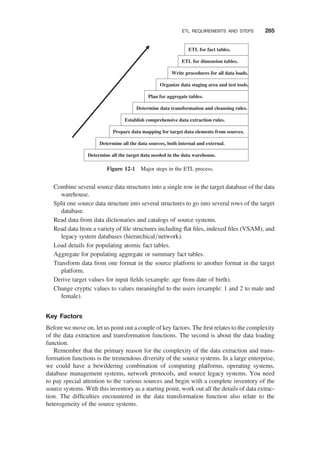
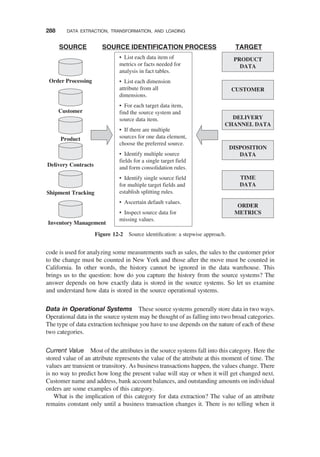
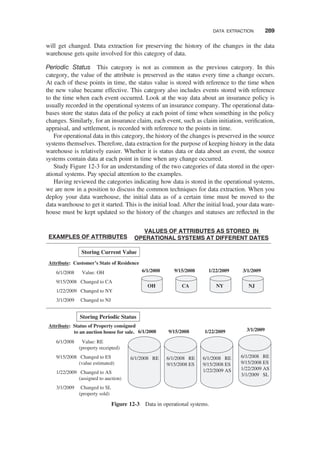
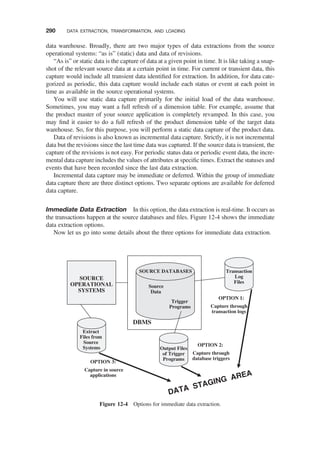
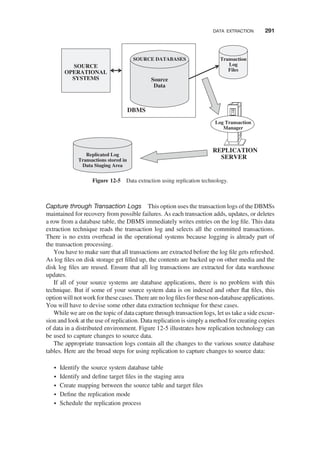
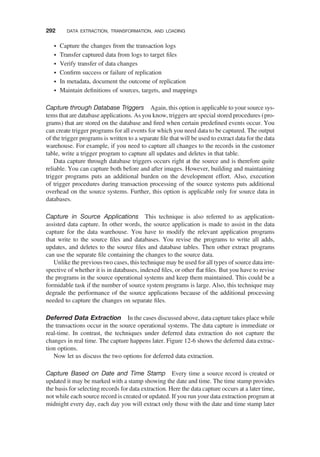

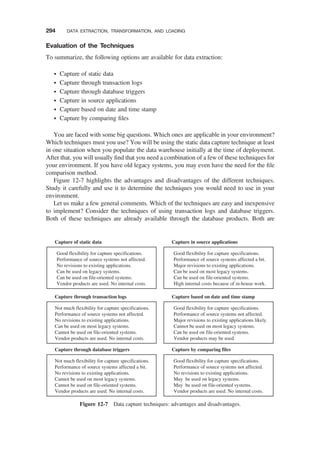
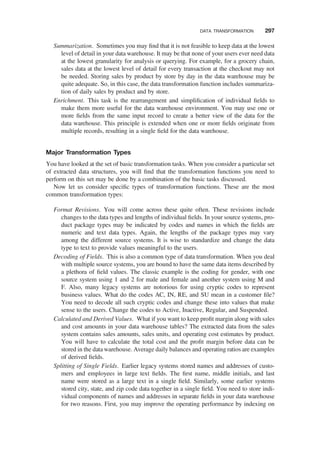
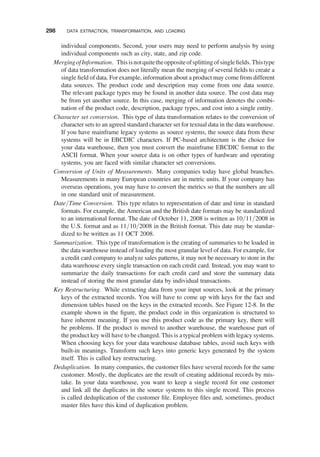
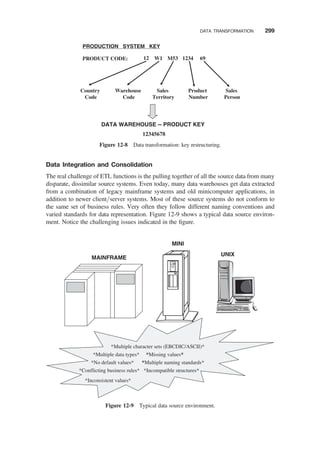
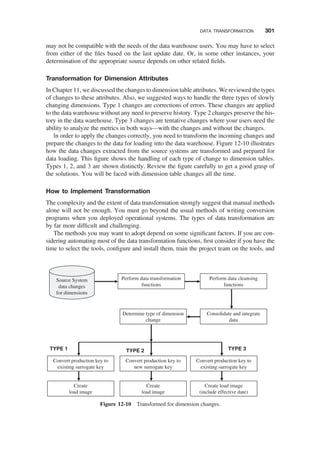
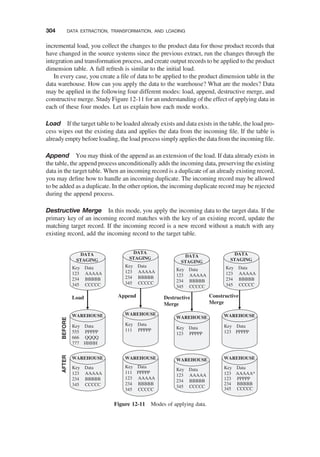
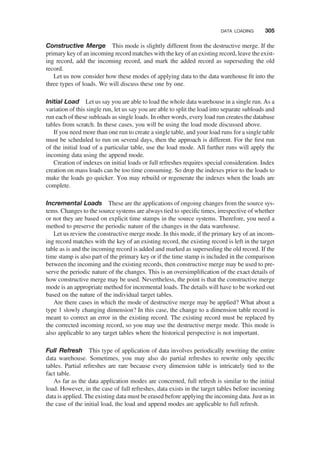
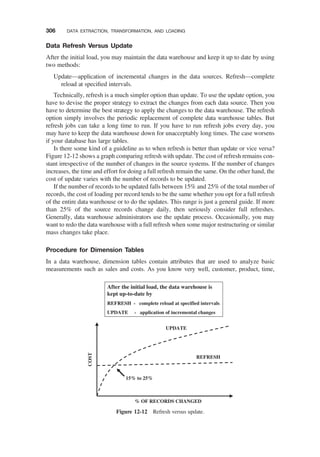
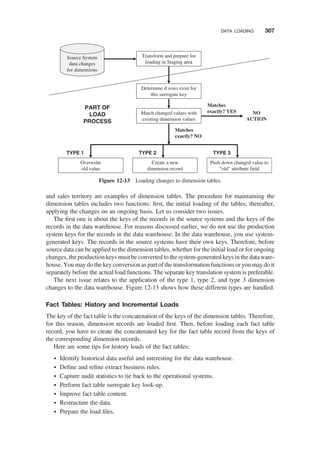
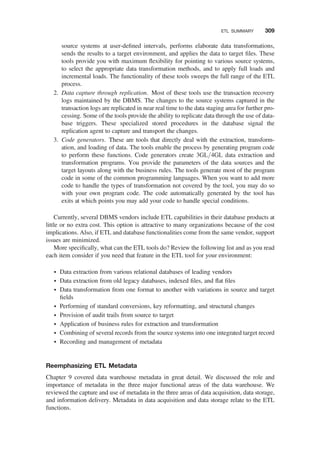

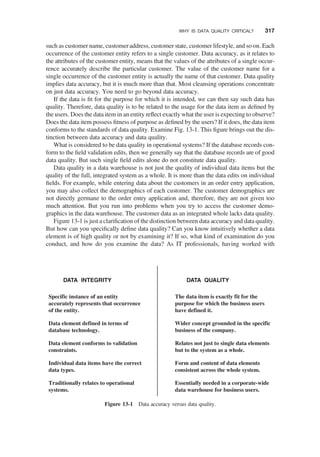
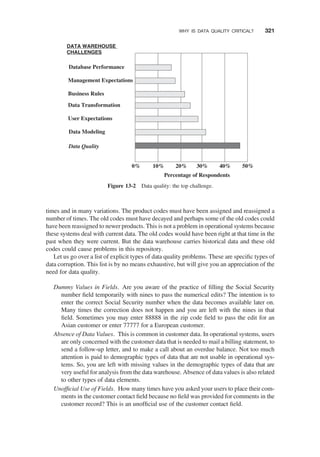
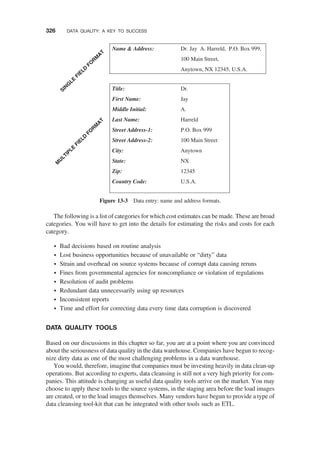
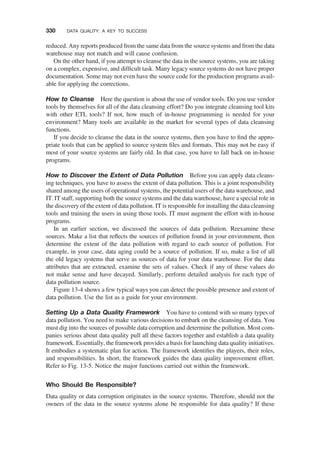
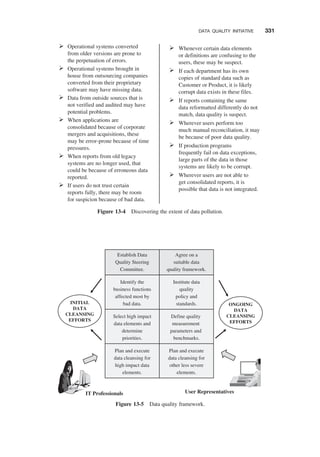
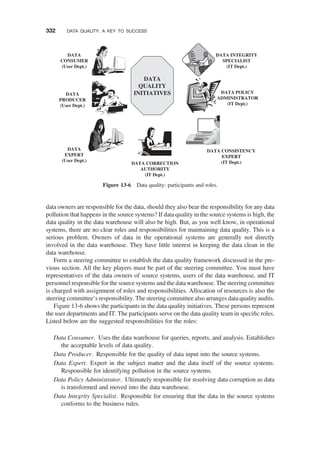
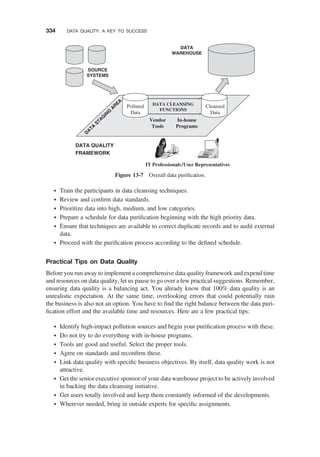


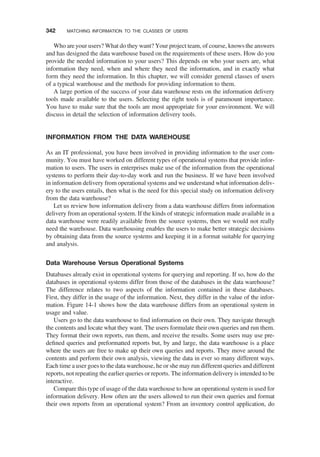
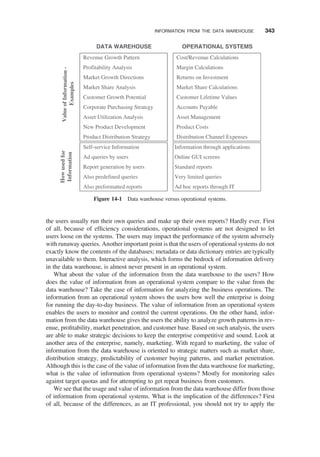
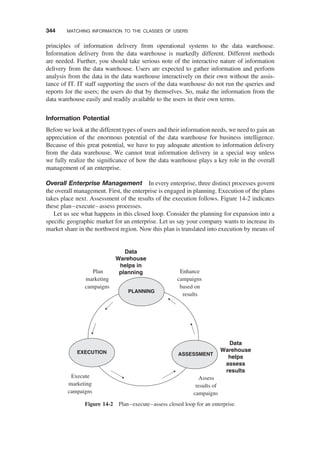
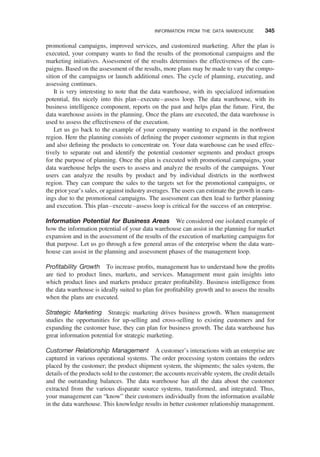
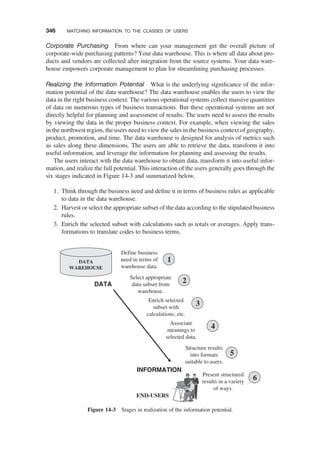
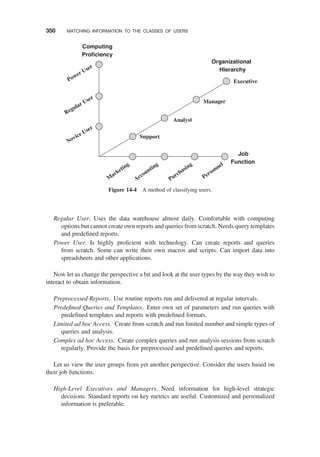
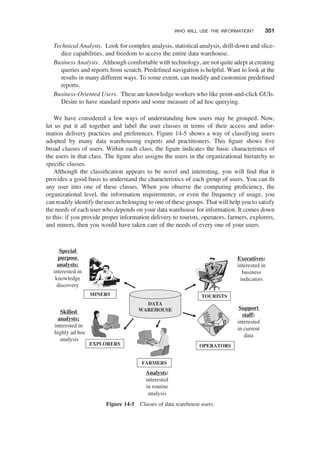
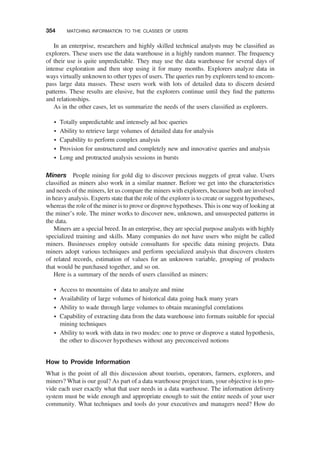
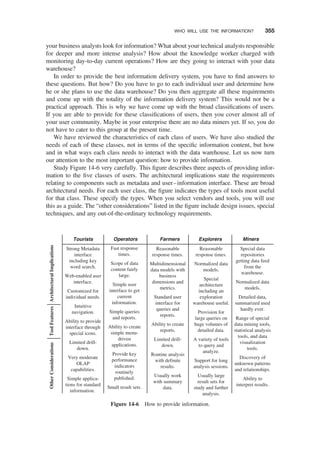
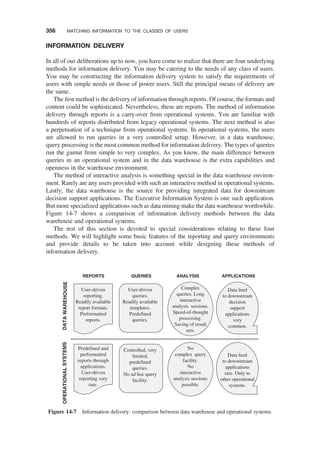
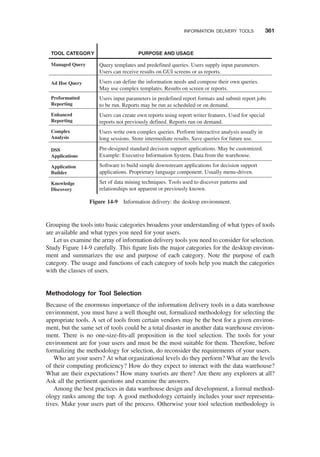
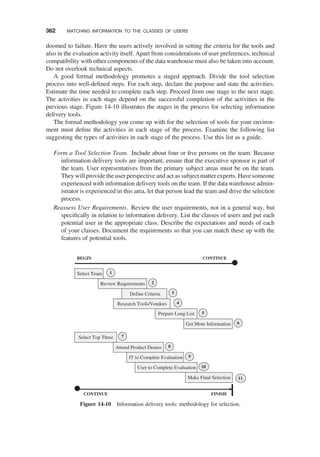
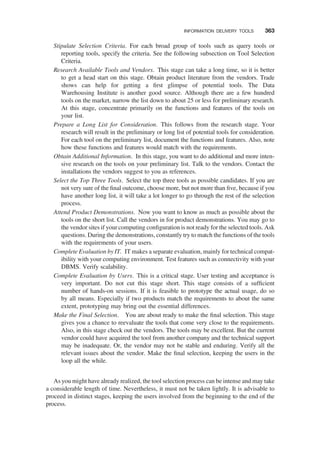
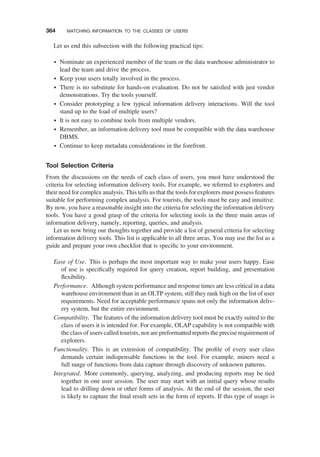
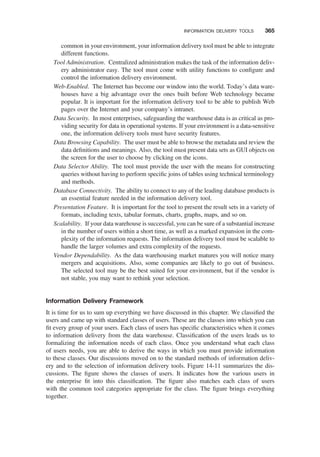
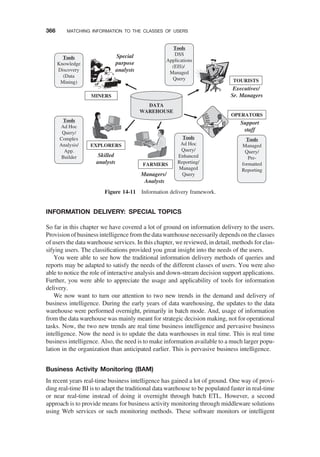
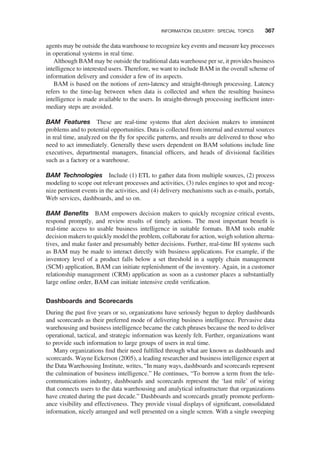
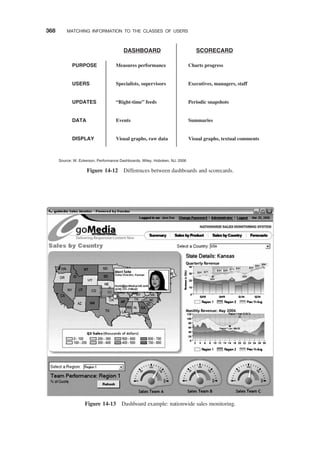
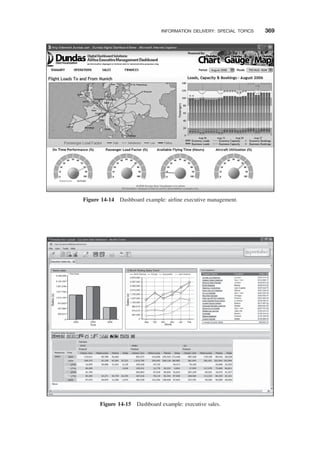
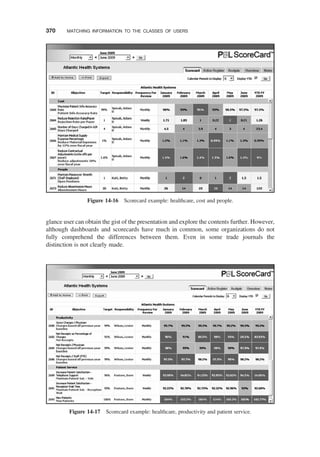
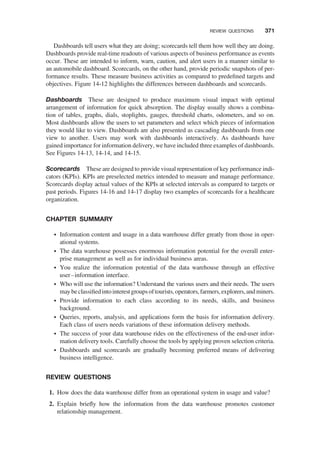
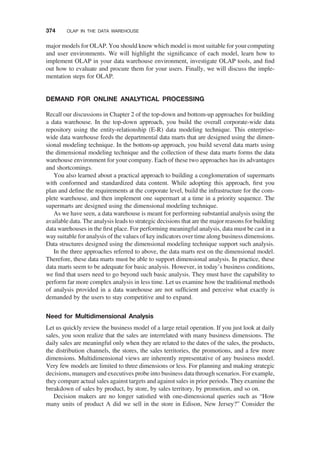
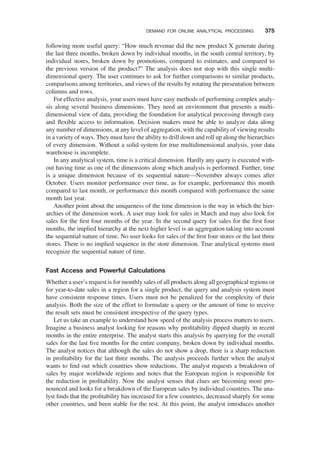
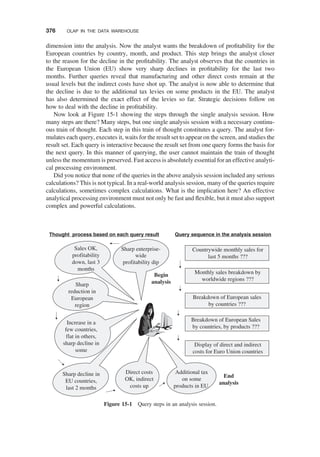
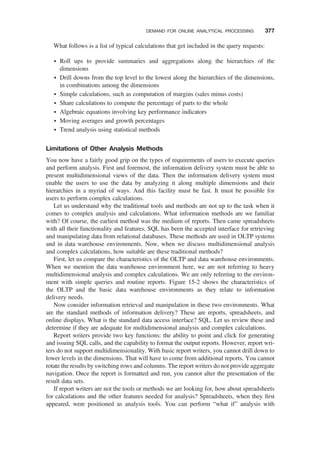
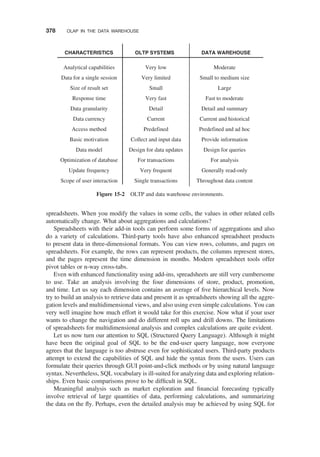
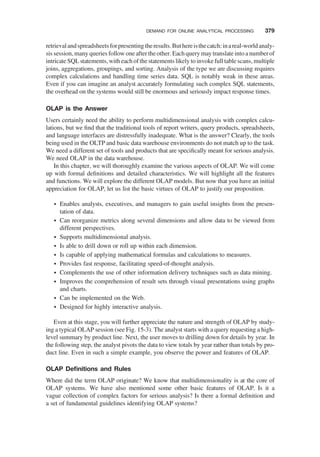
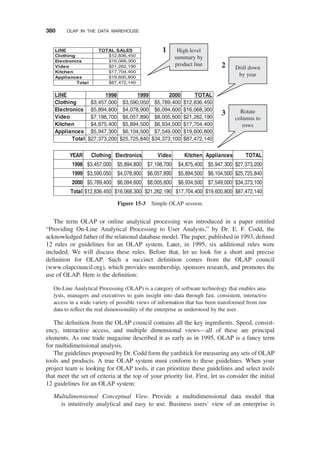
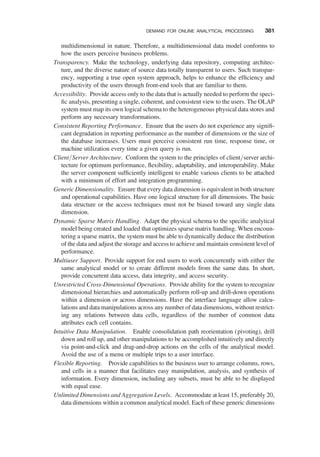
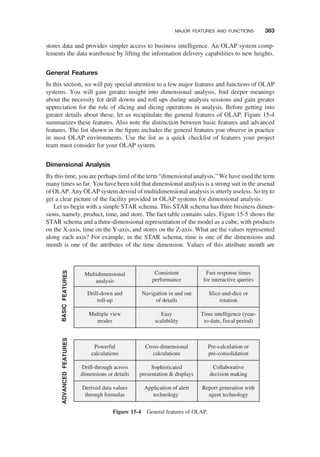
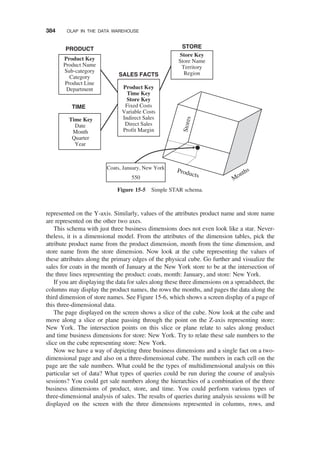
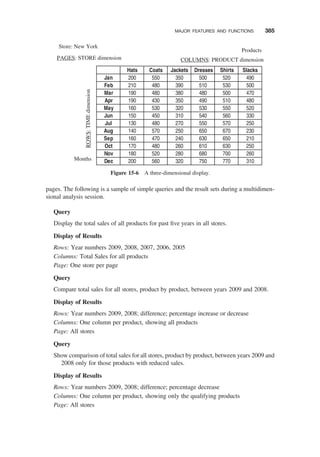
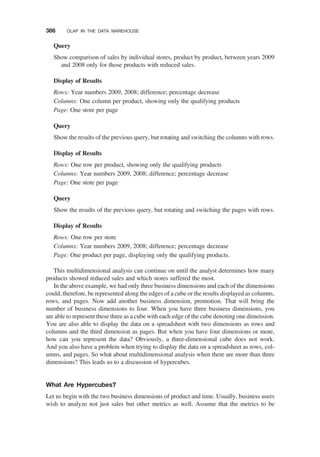
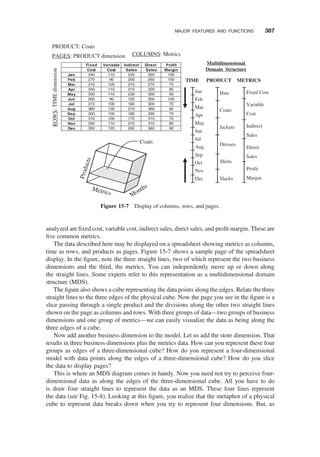
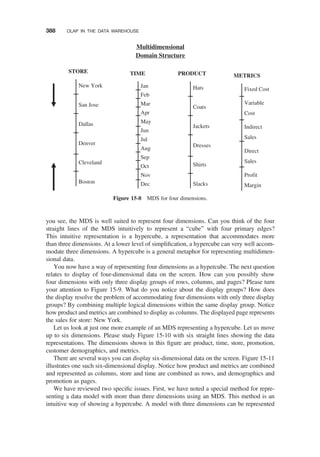
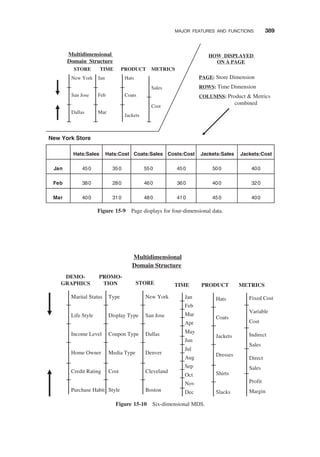
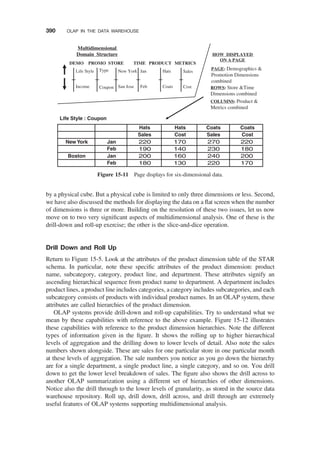
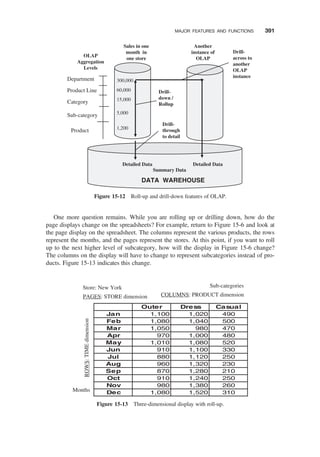

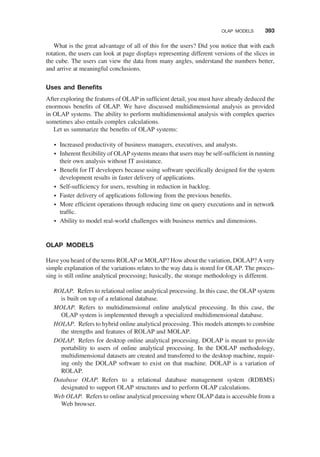
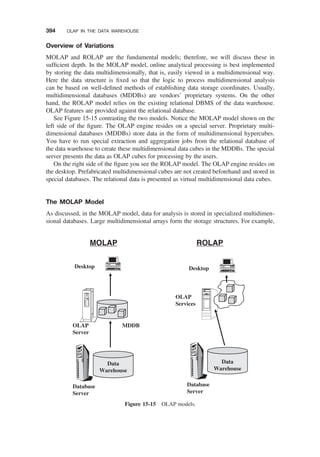
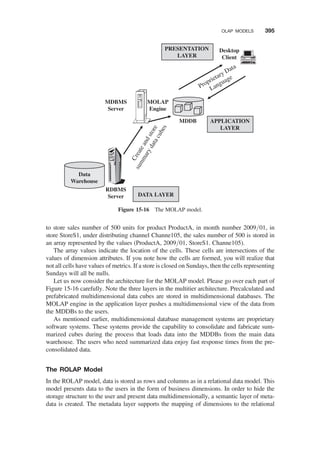
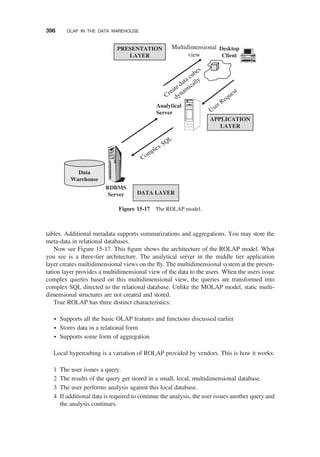
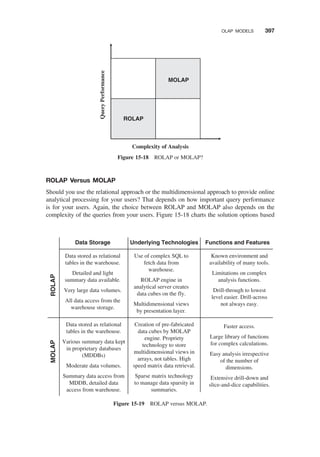
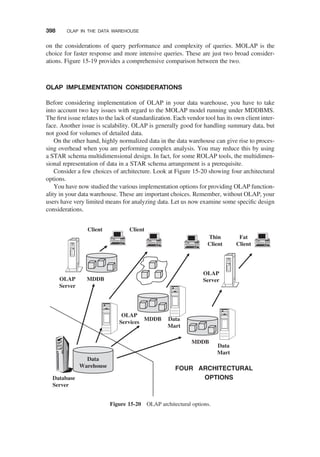
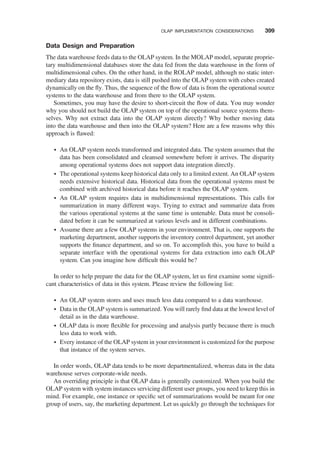
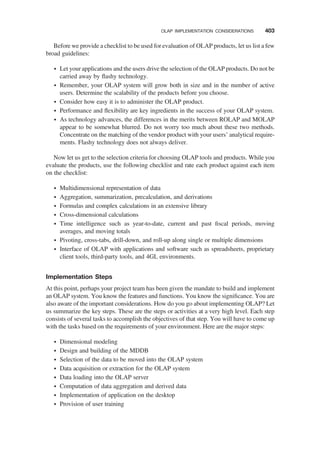
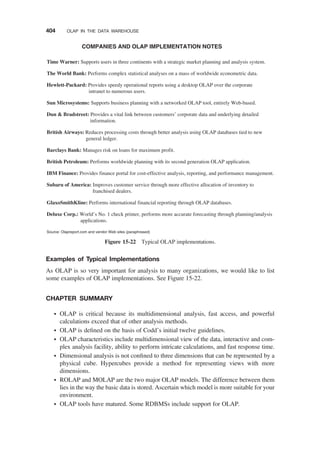

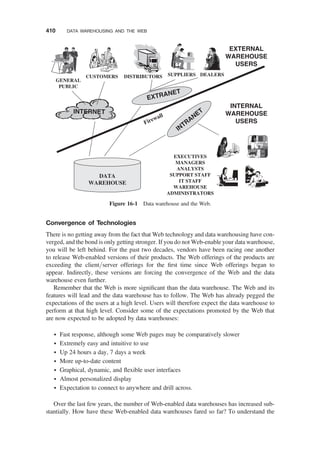
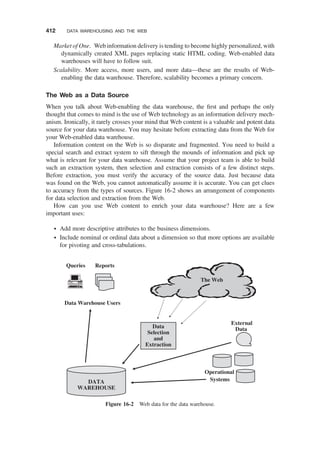
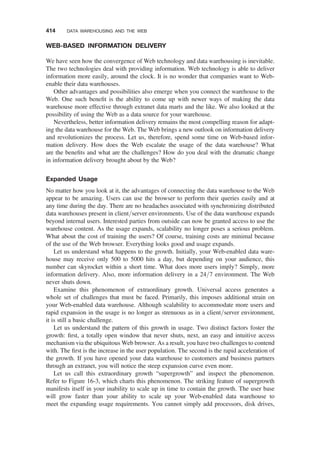
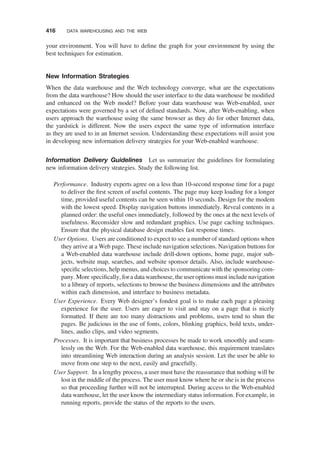
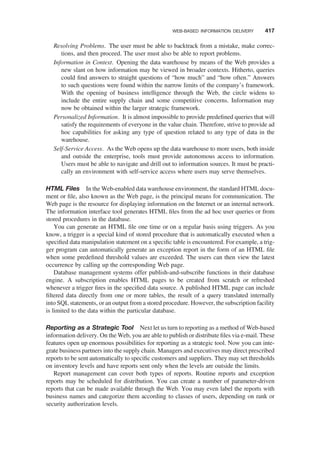
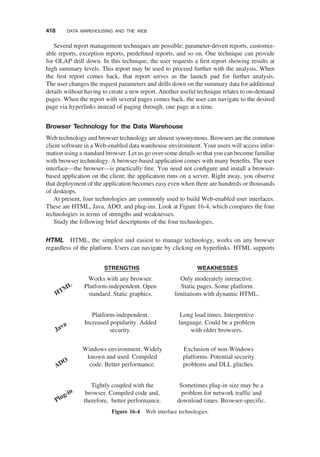
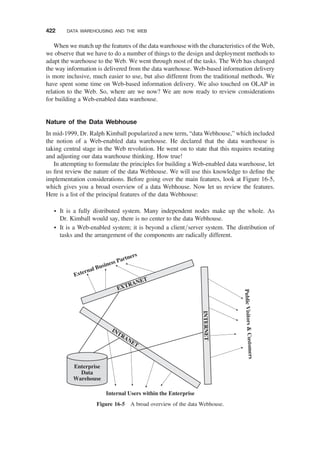
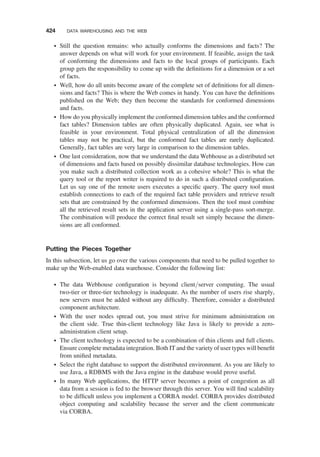
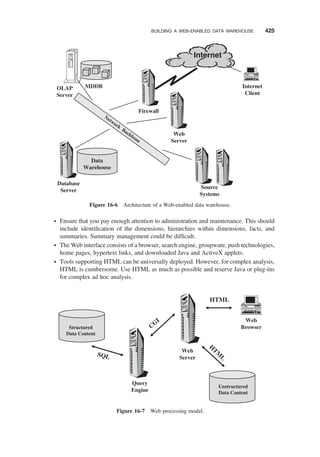

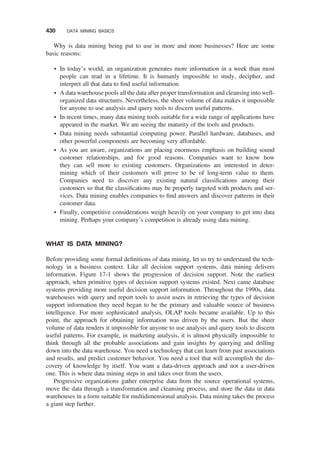
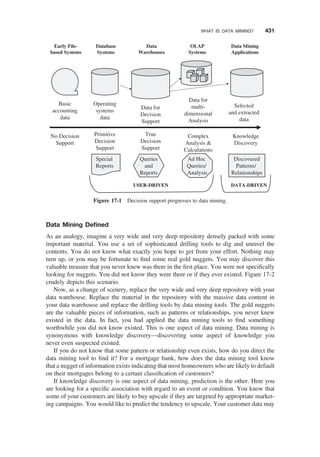
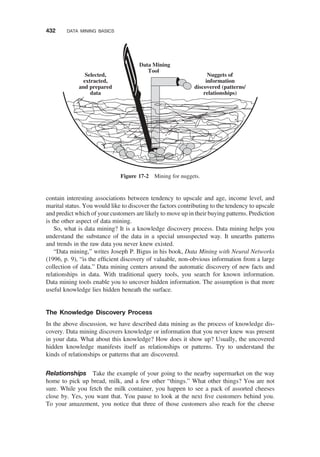
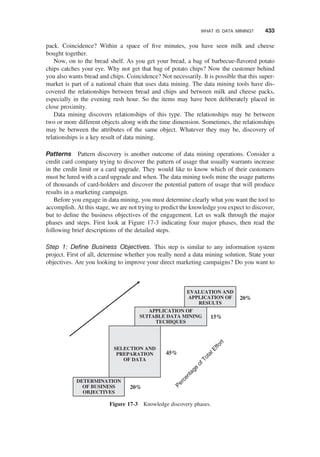
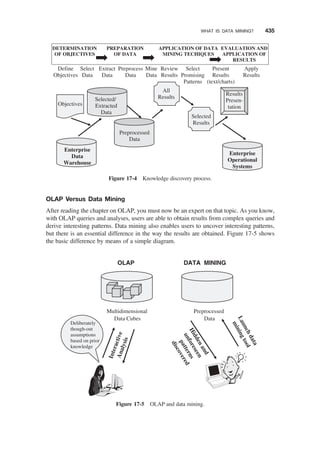
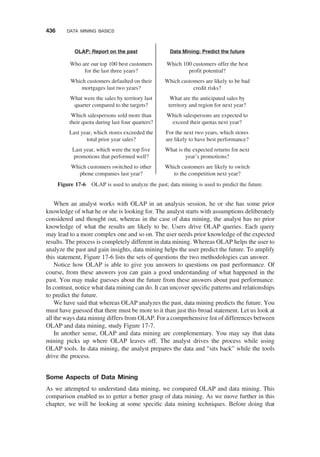
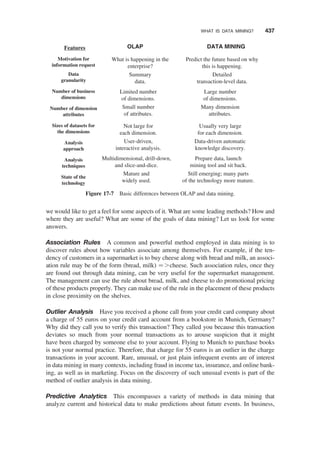
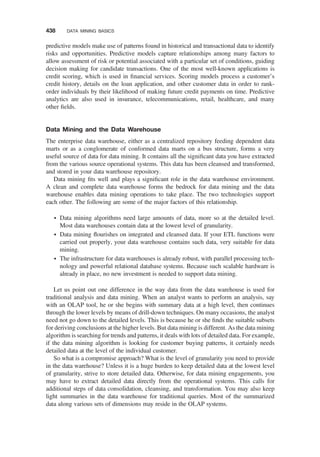
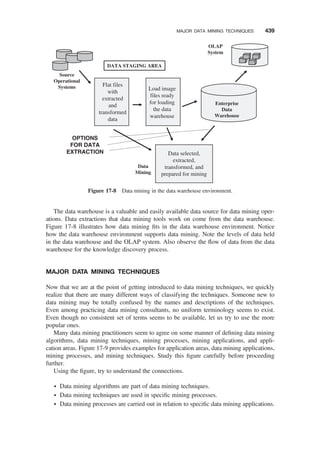
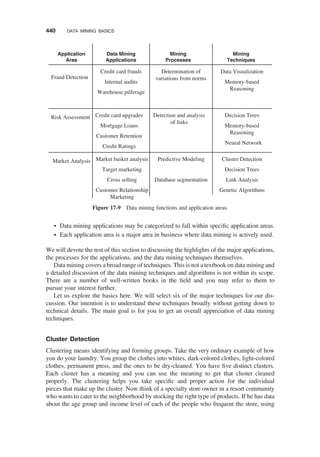
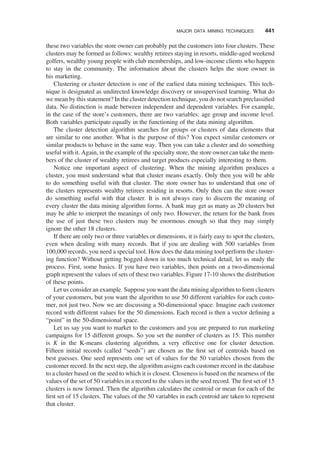
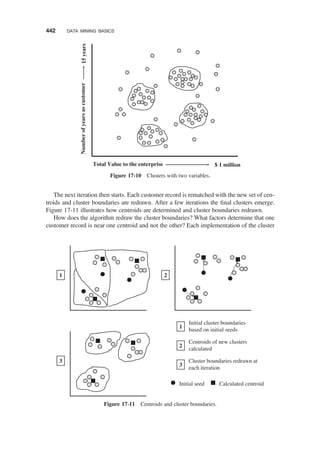
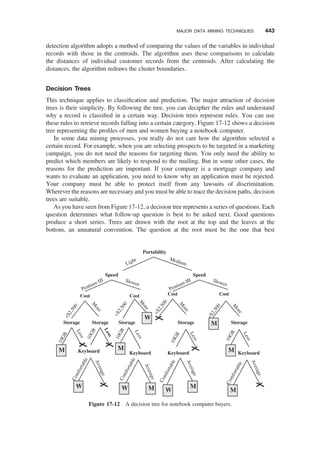
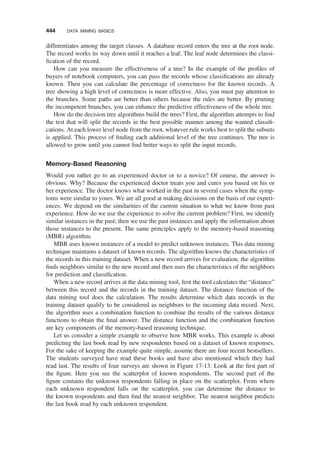
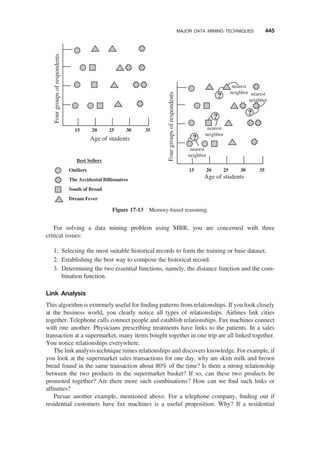
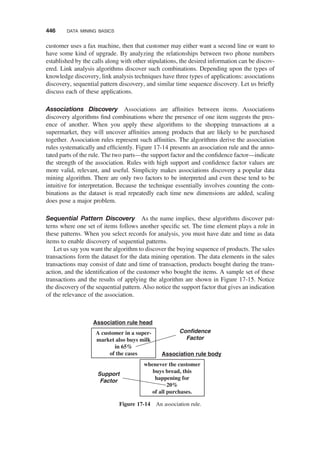
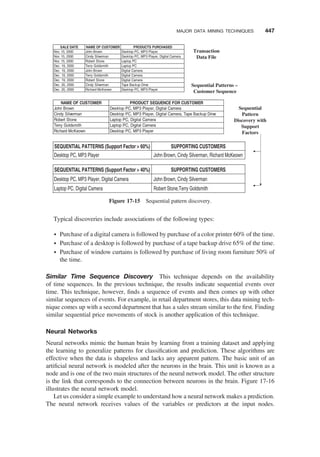
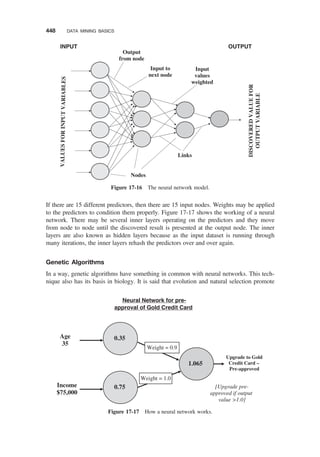
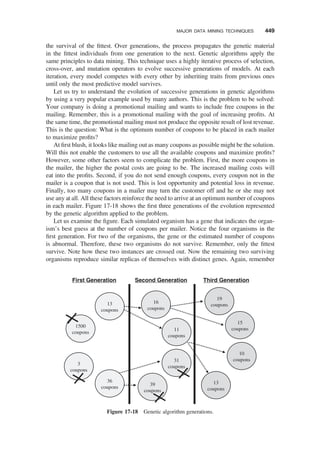
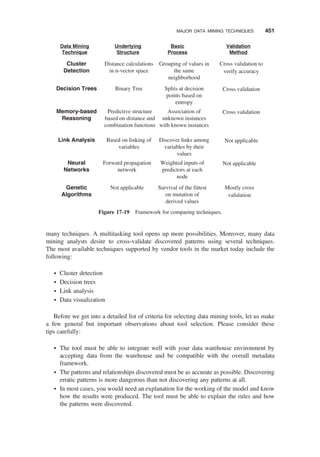
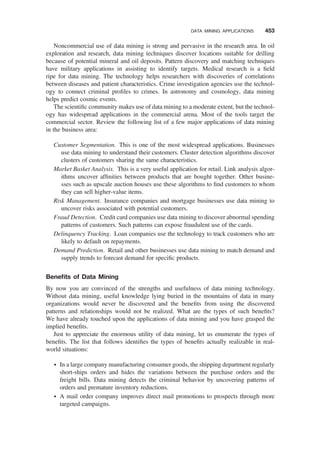
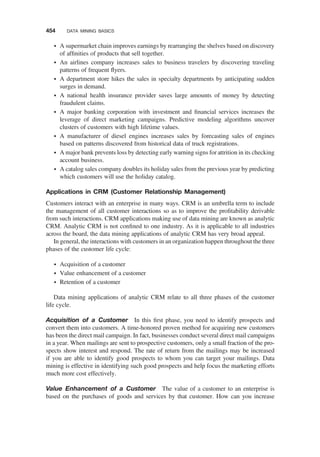
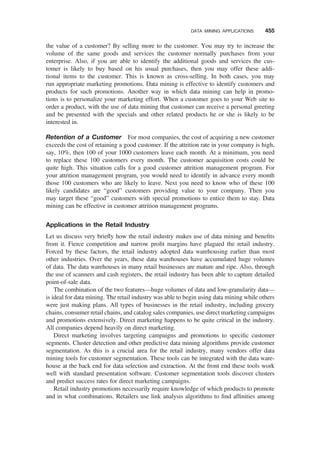
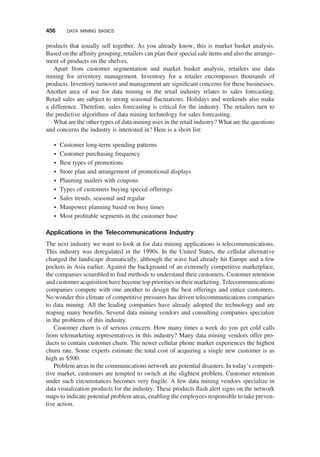


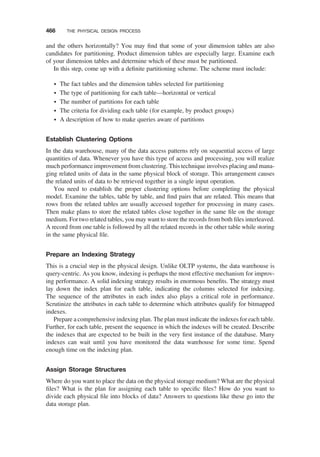
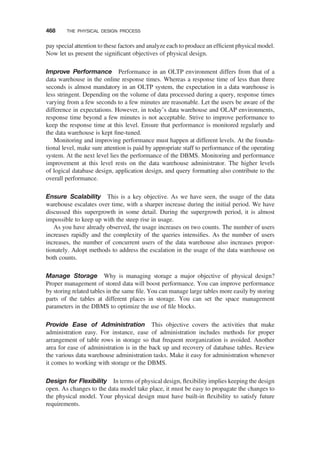
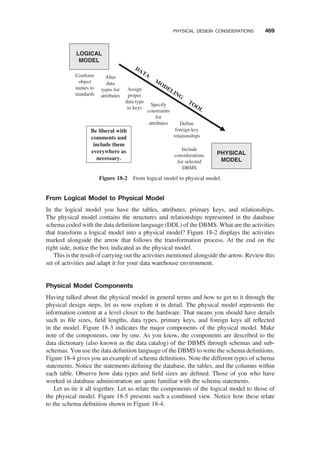
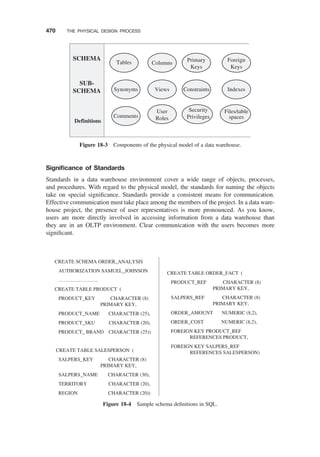
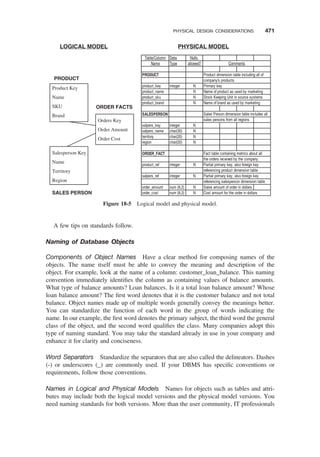
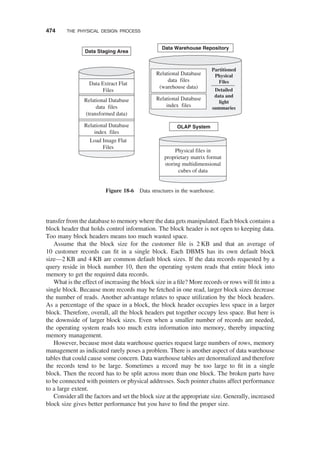
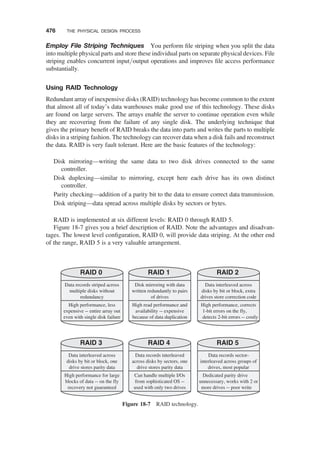
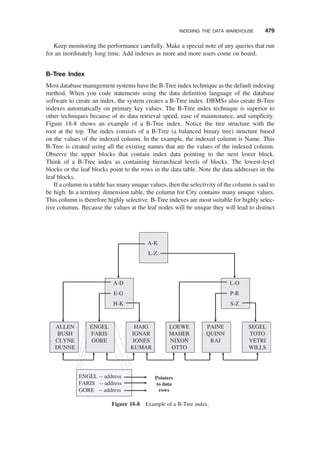
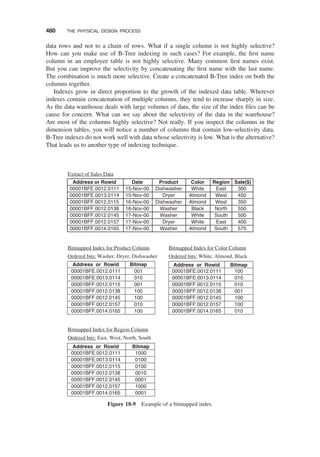
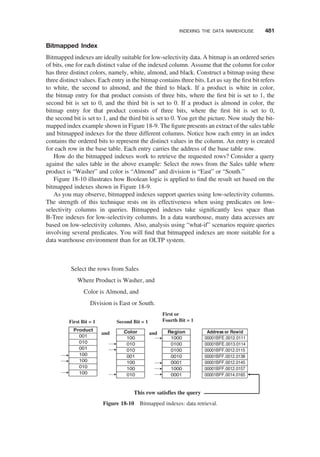

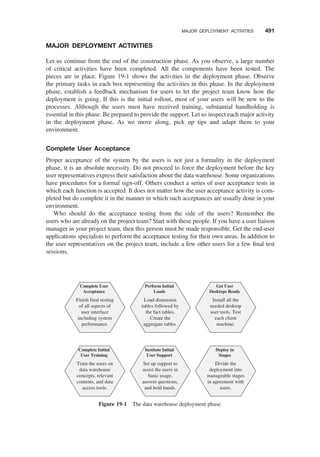
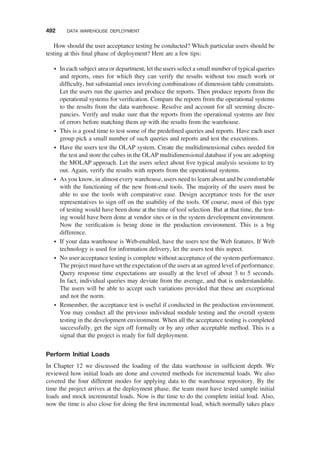

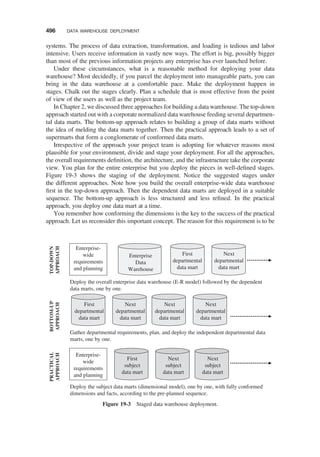
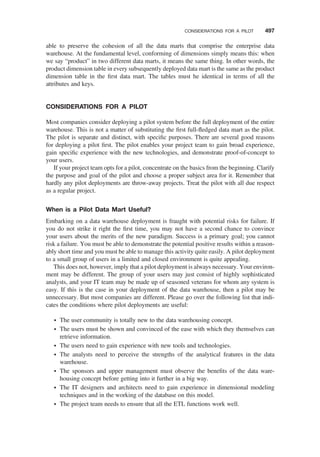
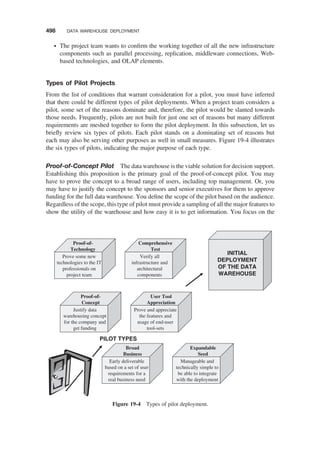
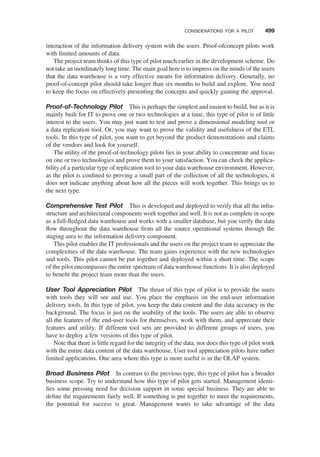
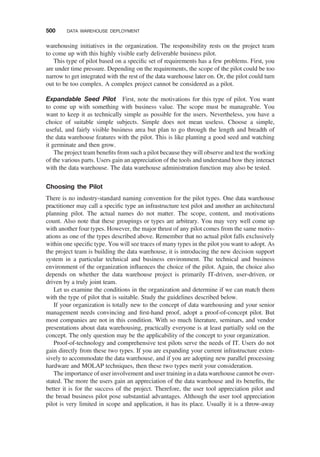
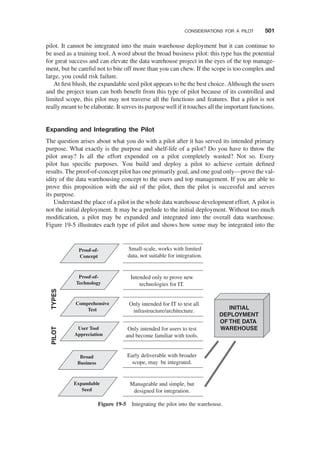
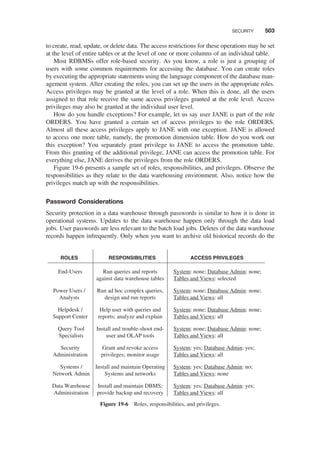
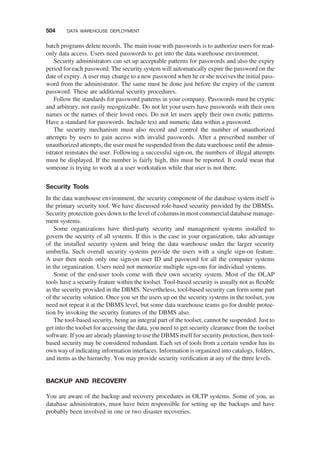
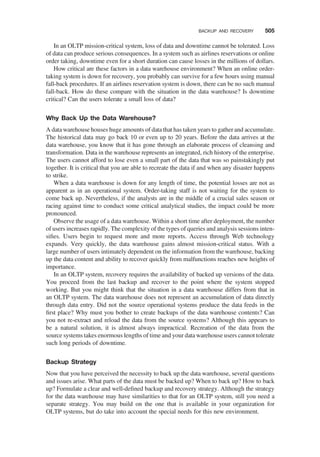
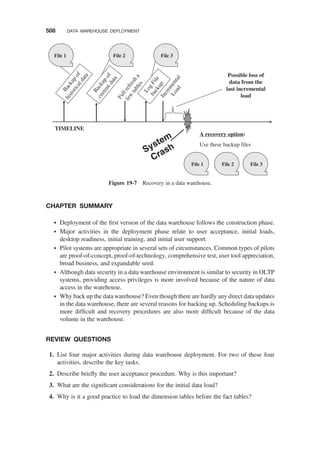

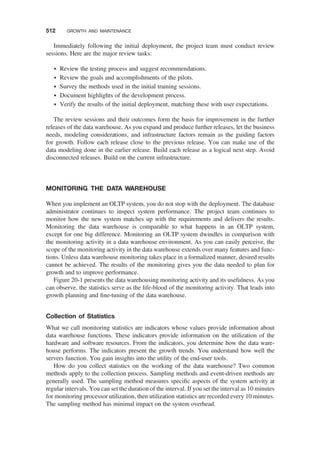
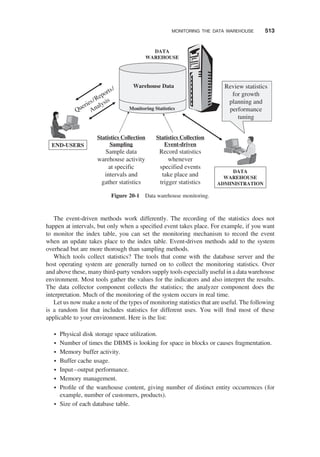
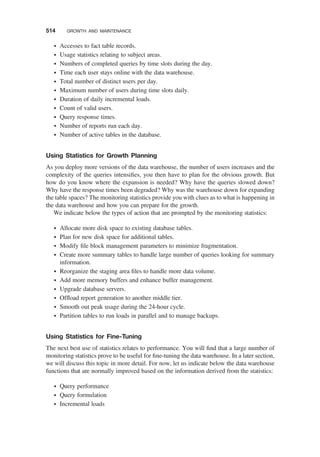
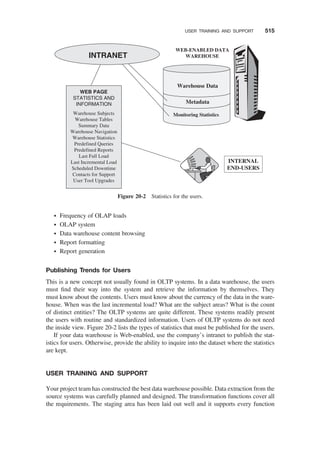
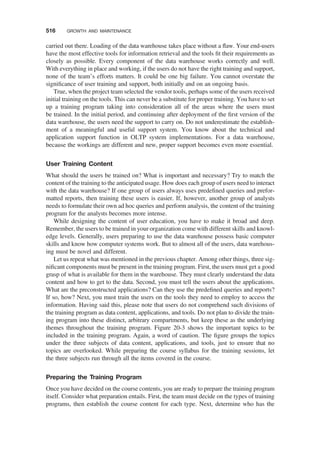
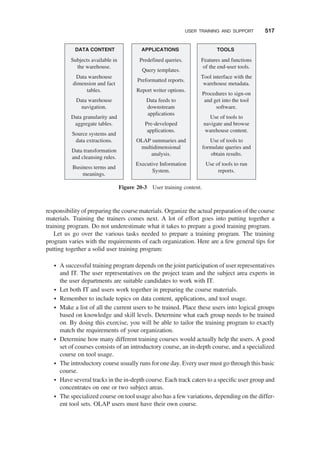
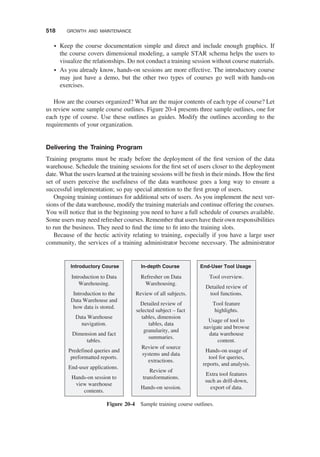
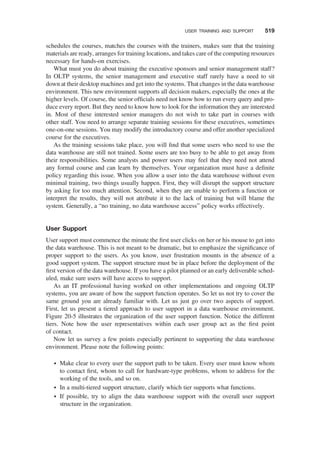


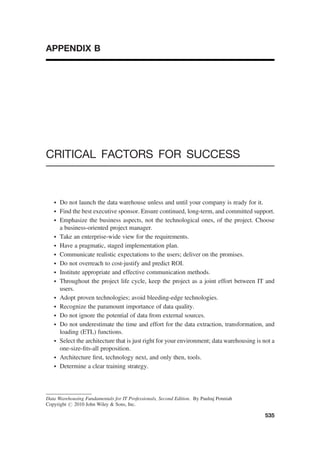

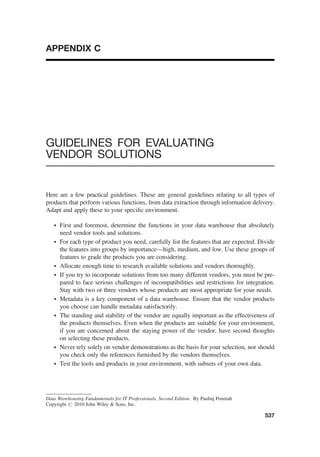


![[Ebooks PDF] download Building the Data Warehouse 3rd Edition W. H. Inmon fu...](https://cdn.slidesharecdn.com/ss_thumbnails/24784-241224030338-65617874-thumbnail.jpg?width=640&height=640&fit=bounds)


