This document describes a study that analyzed the association between fine particulate matter (PM2.5) concentration and adult asthma prevalence in Kent County, Michigan from 2005-2012. The study used health survey data and air quality monitoring data. Poisson regression was used to examine the relationship between annual PM2.5 levels and asthma prevalence, both with and without adjusting for potential confounding factors. The analysis found a non-significant 35% increase in asthma prevalence associated with a 10μg/m3 increase in same-year PM2.5 levels after adjustment. A one-year lag analysis also found a non-significant association. The study was limited by use of secondary data and missing information but adds to evidence on PM2.5
![PM2.5 AND ASTHMA IN KENT COUNTY, MI 2
Abstract
Asthma morbidity is associated with exposure to fine particulate matter concentration. To our
knowledge, there has not been a study that has assessed the association between PM2.5 and same-
year asthma prevalence, or prior-year PM2.5 concentration and subsequent year asthma
prevalence, in Kent County, MI. Using health information collected during BRFSS SMART
from 2005-2012, and air monitor data from AirData from 2004-2012, we conducted a cross-
sectional study to determine if there was an association between asthma prevalence and annual
PM2.5 concentration in Kent County. After adjusting for meteorological, health, and
demographic confounders, we identified a 35.0% increase in the prevalence of asthma for a
10µg/m3 increase in same-year PM2.5 concentration, although the findings were not statistically
significant (PR = 1.35, 95% CI [0.96, 1.90], p = 0.085). Findings were limited by the use of
secondary data, and missing data for some potential confounders including COPD, and
race/ethnicity, but the suggestive association identified highlights the importance of low ambient
PM2.5 concentration with adult asthma prevalence in Kent County, MI. Advocacy groups and
policymakers may benefit from these findings, to ensure low ambient PM2.5 concentrations are
maintained in Kent County, MI. Analysis of seasonal, climate, and meteorological changes,
additional health, and demographic confounders, as well as the geospatial distribution of PM2.5, is
recommended for future research.
Keywords: PM2.5, adult asthma prevalence, Kent County, Michigan](https://image.slidesharecdn.com/1d49d526-edf8-46a7-bbd4-dd4ca94a5c2c-160718213712/85/PM25-and-Asthma_Spiker_Final-2-320.jpg)
![PM2.5 AND ASTHMA IN KENT COUNTY, MI 3
Fine Particulate Matter Concentration and Adult Asthma Prevalence
in Kent County, MI from 2005-2012
Asthma is a respiratory disease that affects both children and adults, across the globe.
According to the 2013 National Health Interview Survey, 16.5 million adults, and 6.1 million
children in the United States (U.S.) suffered from asthma. This equates to approximately 7.0%
and 8.3% of the U.S. population, respectively (Centers for Disease Control and Prevention
[CDC], 2015a). The prevalence of asthma shifts from males to females from adolescence into
adulthood. Under 18 years, approximately 9.3% of boys and 7.3% of girls have been diagnosed
with asthma, whereas in adults (18+ years), approximately 5.2% of men, compared to 8.6% of
women, have asthma (CDC, 2015a). Furthermore, asthma disproportionately affects black
Americans, compared to whites, Hispanics, and other race/ethnicities, and is highest for low-
income persons under 100% of the federal poverty level (CDC, 2015a).
Asthma attacks occur when a person with asthma is exposed to various “triggers,”
including dust mites, cockroaches, tobacco smoke, pets, and environmental exposures such as air
pollution, although individuals respond differently (CDC, 2015c). Research has identified that
the cause of asthma is multifactorial, and there is evidence that air pollution plays a part in both
the formation of asthma, and morbidity or exacerbation of asthma symptoms, however there are
many components of air pollution (Burra, Moineddin, Agha, & Glazier, 2009; Canova et al.,
2012; Delfino et al., 2014; Laurent et al., 2008; Lemke et al., 2014; Slaughter, Lumley, Sheppard,
Koenig, & Shapiro, 2013; Young et al., 2014).
One component of air pollution, particulate matter (PM), is a category composed of
numerous different particles and liquid droplets. These subcomponents of PM include organic
chemicals, acids, metals, and dust, among others (EPA, 2015a). PM is further classified by the](https://image.slidesharecdn.com/1d49d526-edf8-46a7-bbd4-dd4ca94a5c2c-160718213712/85/PM25-and-Asthma_Spiker_Final-3-320.jpg)
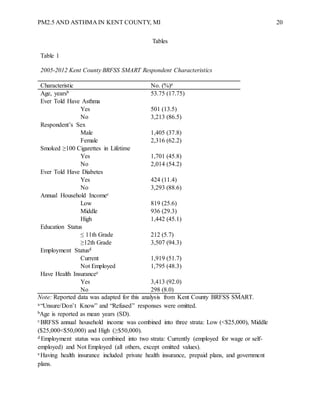
![PM2.5 AND ASTHMA IN KENT COUNTY, MI 9
mean age of 53.8 years (SD ± 17.8). Additionally, 45.8% of respondents had smoked at least
100 cigarettes in their lifetime, and 11.4% were ever told they had diabetes. Income was
reported as 25.6%, 29.3%, and 45.1%, in the low, middle, and high-income categories,
respectively. Furthermore, 94.3% of respondents reported they completed at least high school or
received their GED, 51.7% reported being employed, and 92.0% reported having any kind of
health care coverage (see Table 1). Only 1.6% of respondents reported their race/ethnicity, so
this variable was not included in the analyses.
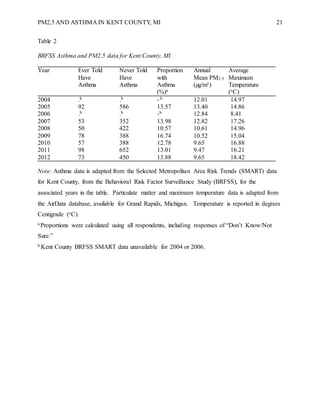
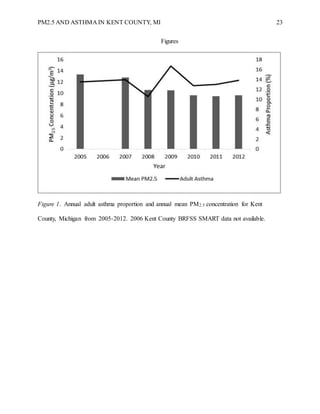
Average PM2.5 concentration was recorded for each year, and there was an overall
decreasing trend over time. In 2005, the annual average was highest at 13.40µg/m3, and lowest
in 2011 at 9.47 µg/m3. Figure 1 shows the annual trends for both asthma prevalence and PM2.5
concentration for the study period, in Kent County. While PM2.5 appears to be decreasing, the
asthma prevalence data does not exhibit any notable trend, with a sharp peak in 2009. Similarly,
the ambient maximum temperature did not demonstrate a noticeable trend over the study period,
changing each year, with the highest annual ambient temperature recorded in 2012 at 18.42oC,
and the lowest in 2016 at 8.41oC (see Table 2).
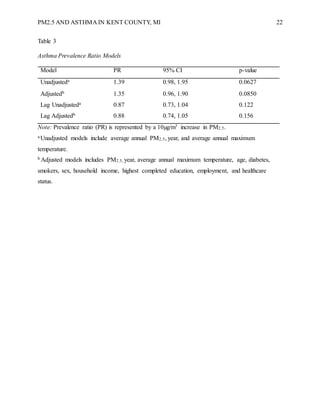
Same-year analysis using Poisson regression did not find a significant association
between PM2.5 and asthma prevalence in a simple model without controlling for health and
demographic variables. This model only included average annual PM2.5 concentration, year, and
average annual maximum temperature. The simple model identified a 10µg/m3 increase in PM2.5
was associated with approximately 39% increase in the prevalence of asthma in Kent County, MI
(PR = 1.39, 95% CI [0.98, 1.95], p = 0.0627). When all variables were added, the association
between PM2.5 and asthma was attenuated, but was still not significant (PR = 1.35, 95% CI [0.97,
1.92], p = 0.077). Controlling for average annual maximum temperature, the age of the](https://image.slidesharecdn.com/1d49d526-edf8-46a7-bbd4-dd4ca94a5c2c-160718213712/85/PM25-and-Asthma_Spiker_Final-9-320.jpg)
![PM2.5 AND ASTHMA IN KENT COUNTY, MI 10
respondent, diabetes, smoking, sex, annual household income, highest completed education,
employment status, and health care status resulted in a 35% increase in the prevalence of asthma
for each 10µg/m3 increase in PM2.5. The interaction between PM2.5 concentration and time was
not statistically significant (p = 0.227), and it was not included in the final model.
One-year lag analysis, using Poisson regression also failed to yield significant results.
The simple model identified a 10µg/m3 increase in PM2.5 was associated with a 12% lower odds
of asthma in Kent County, MI (PR = 0.87, 95% CI [0.73, 1.04], p = 0.122). The adjusted model,
controlling for average annual maximum temperature, age of respondent, diabetes, smoking, sex,
annual household income, highest completed education, employment status, and health care
status resulted in 12% lower odds of asthma for a 10µg/m3 increase in PM2.5 (PR = 0.88, 95% CI
[0.74, 1.05], p = 0.156) (see Table 3).
Discussion
We observed a suggestive, or borderline statistically significant association between
PM2.5 and same-year asthma prevalence after controlling for average annual maximum
temperature, the age of the respondent, diabetes, smoking, sex, annual household income, highest
completed education, employment status, and healthcare. Controlling for multiple variables did
improve the model fit considerably over the simpler model, but failed to be statistically
significant. All variables available for analysis were maintained in the models to reduce bias as
much as possible in this study.
We hypothesized that an increase in PM2.5 would be associated with an increase in the
adult asthma prevalence for Kent County, and we were correct for the same-year analysis,
despite not being significant. As of the most recent data, Kent County has a higher prevalence of
adult asthma, approximately 15%, than both the state of Michigan and the United States, 11.5%](https://image.slidesharecdn.com/1d49d526-edf8-46a7-bbd4-dd4ca94a5c2c-160718213712/85/PM25-and-Asthma_Spiker_Final-10-320.jpg)
![PM2.5 AND ASTHMA IN KENT COUNTY, MI 19
Qiu, H., Yu, I. T. S., Tian, L., Wang, X., Tse, L. A., Tam, W., & Wong, T. W. (2012). Effects of
coarse particulate matter on emergency hospital admissions for respiratory diseases: A
time-series analysis in Hong Kong. Environmental Health Perspectives, 120(4), 572–576.
http://doi.org/10.1289/ehp.1104002
Slaughter, J. C., Lumley, T., Sheppard, L., Koenig, J. Q., & Shapiro, G. G. (2003). Effects of
ambient air pollution on symptom severity and medication use in children with asthma.
Annals of Allergy, Asthma & Immunology, 91(4), 346–353. http://doi.org/10.1016/S1081-
1206(10)61681-X
SAS/STAT [Computer Software]. (2015). Retrieved from http://www.sas.com/en_us/home.html
United States Environmental Protection Agency. (2016). Airdata: Access to monitored air quality
data from EPA’s air quality system data mart. Retrieved from
https://www3.epa.gov/airdata/
United States Environmental Protection Agency. (2015a). Particulate matter. Retrieved from
http://www3.epa.gov/pm/
United States Environmental Protection Agency. (2015b). Particulate matter: Health. Retrieved
from http://www3.epa.gov/pm/health.html
Young, M. T., Sandler, D. P., DeRoo, L. A., Vedal, S., Kaufman, J. D., & London, S. J. (2014).
Ambient air pollution exposure and incident adult asthma in a nationwide cohort of U.S.
women. American Journal of Respiratory and Critical Care Medicine, 190(8), 914–921.
http://doi.org/10.1164/rccm.201403-0525OC](https://image.slidesharecdn.com/1d49d526-edf8-46a7-bbd4-dd4ca94a5c2c-160718213712/85/PM25-and-Asthma_Spiker_Final-19-320.jpg)