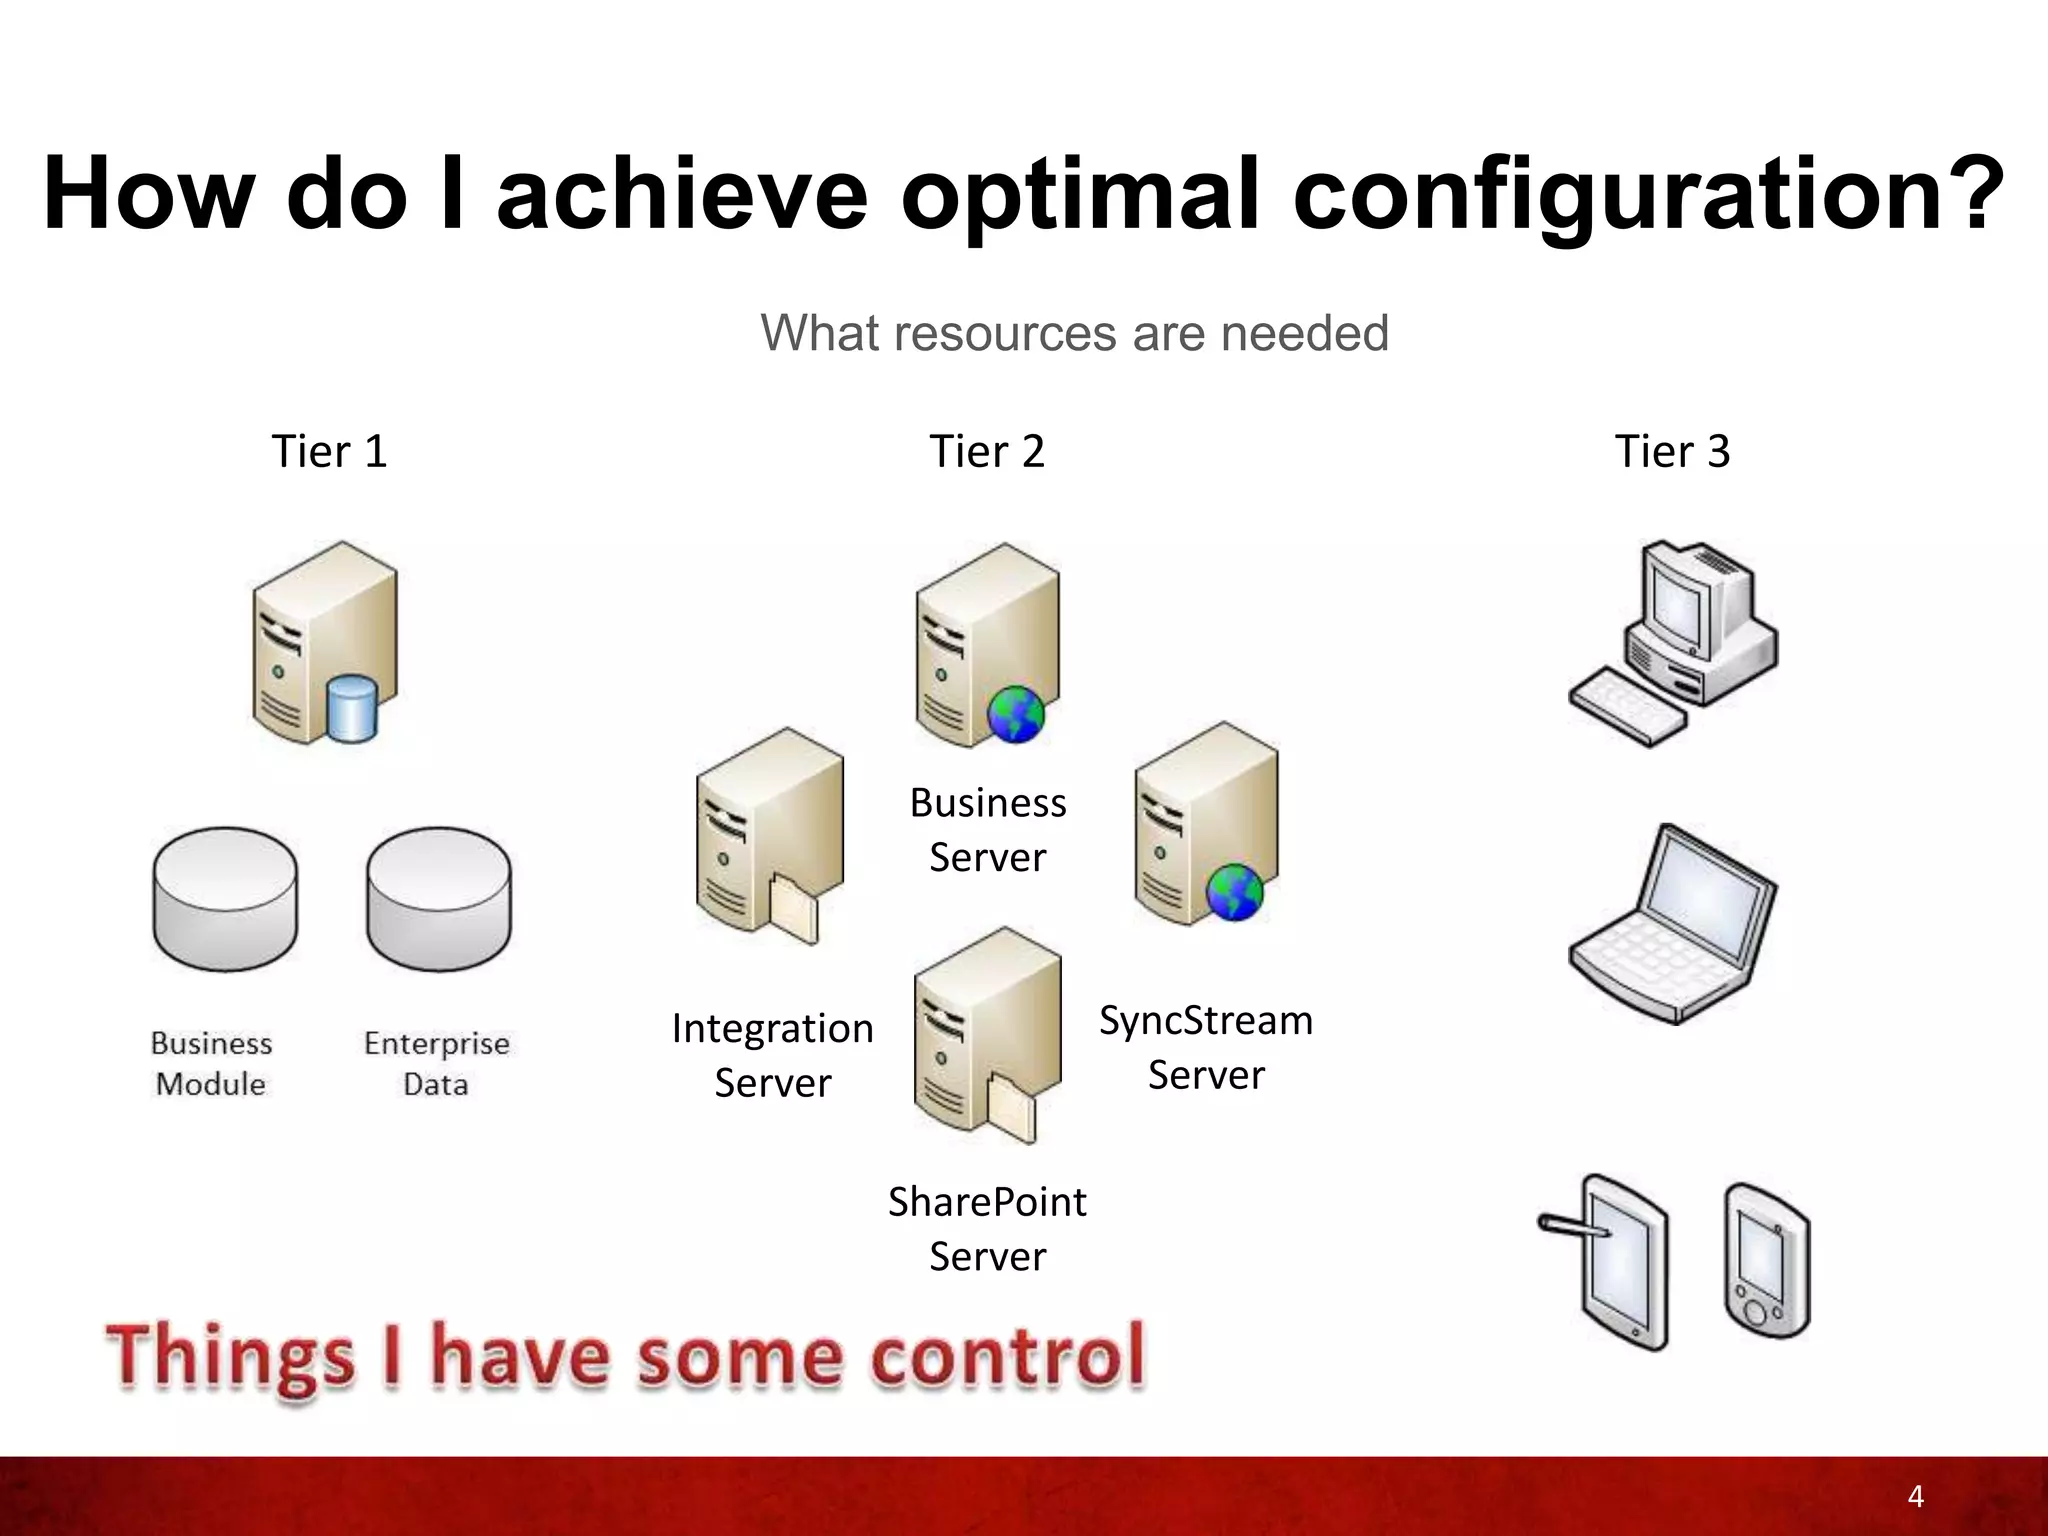
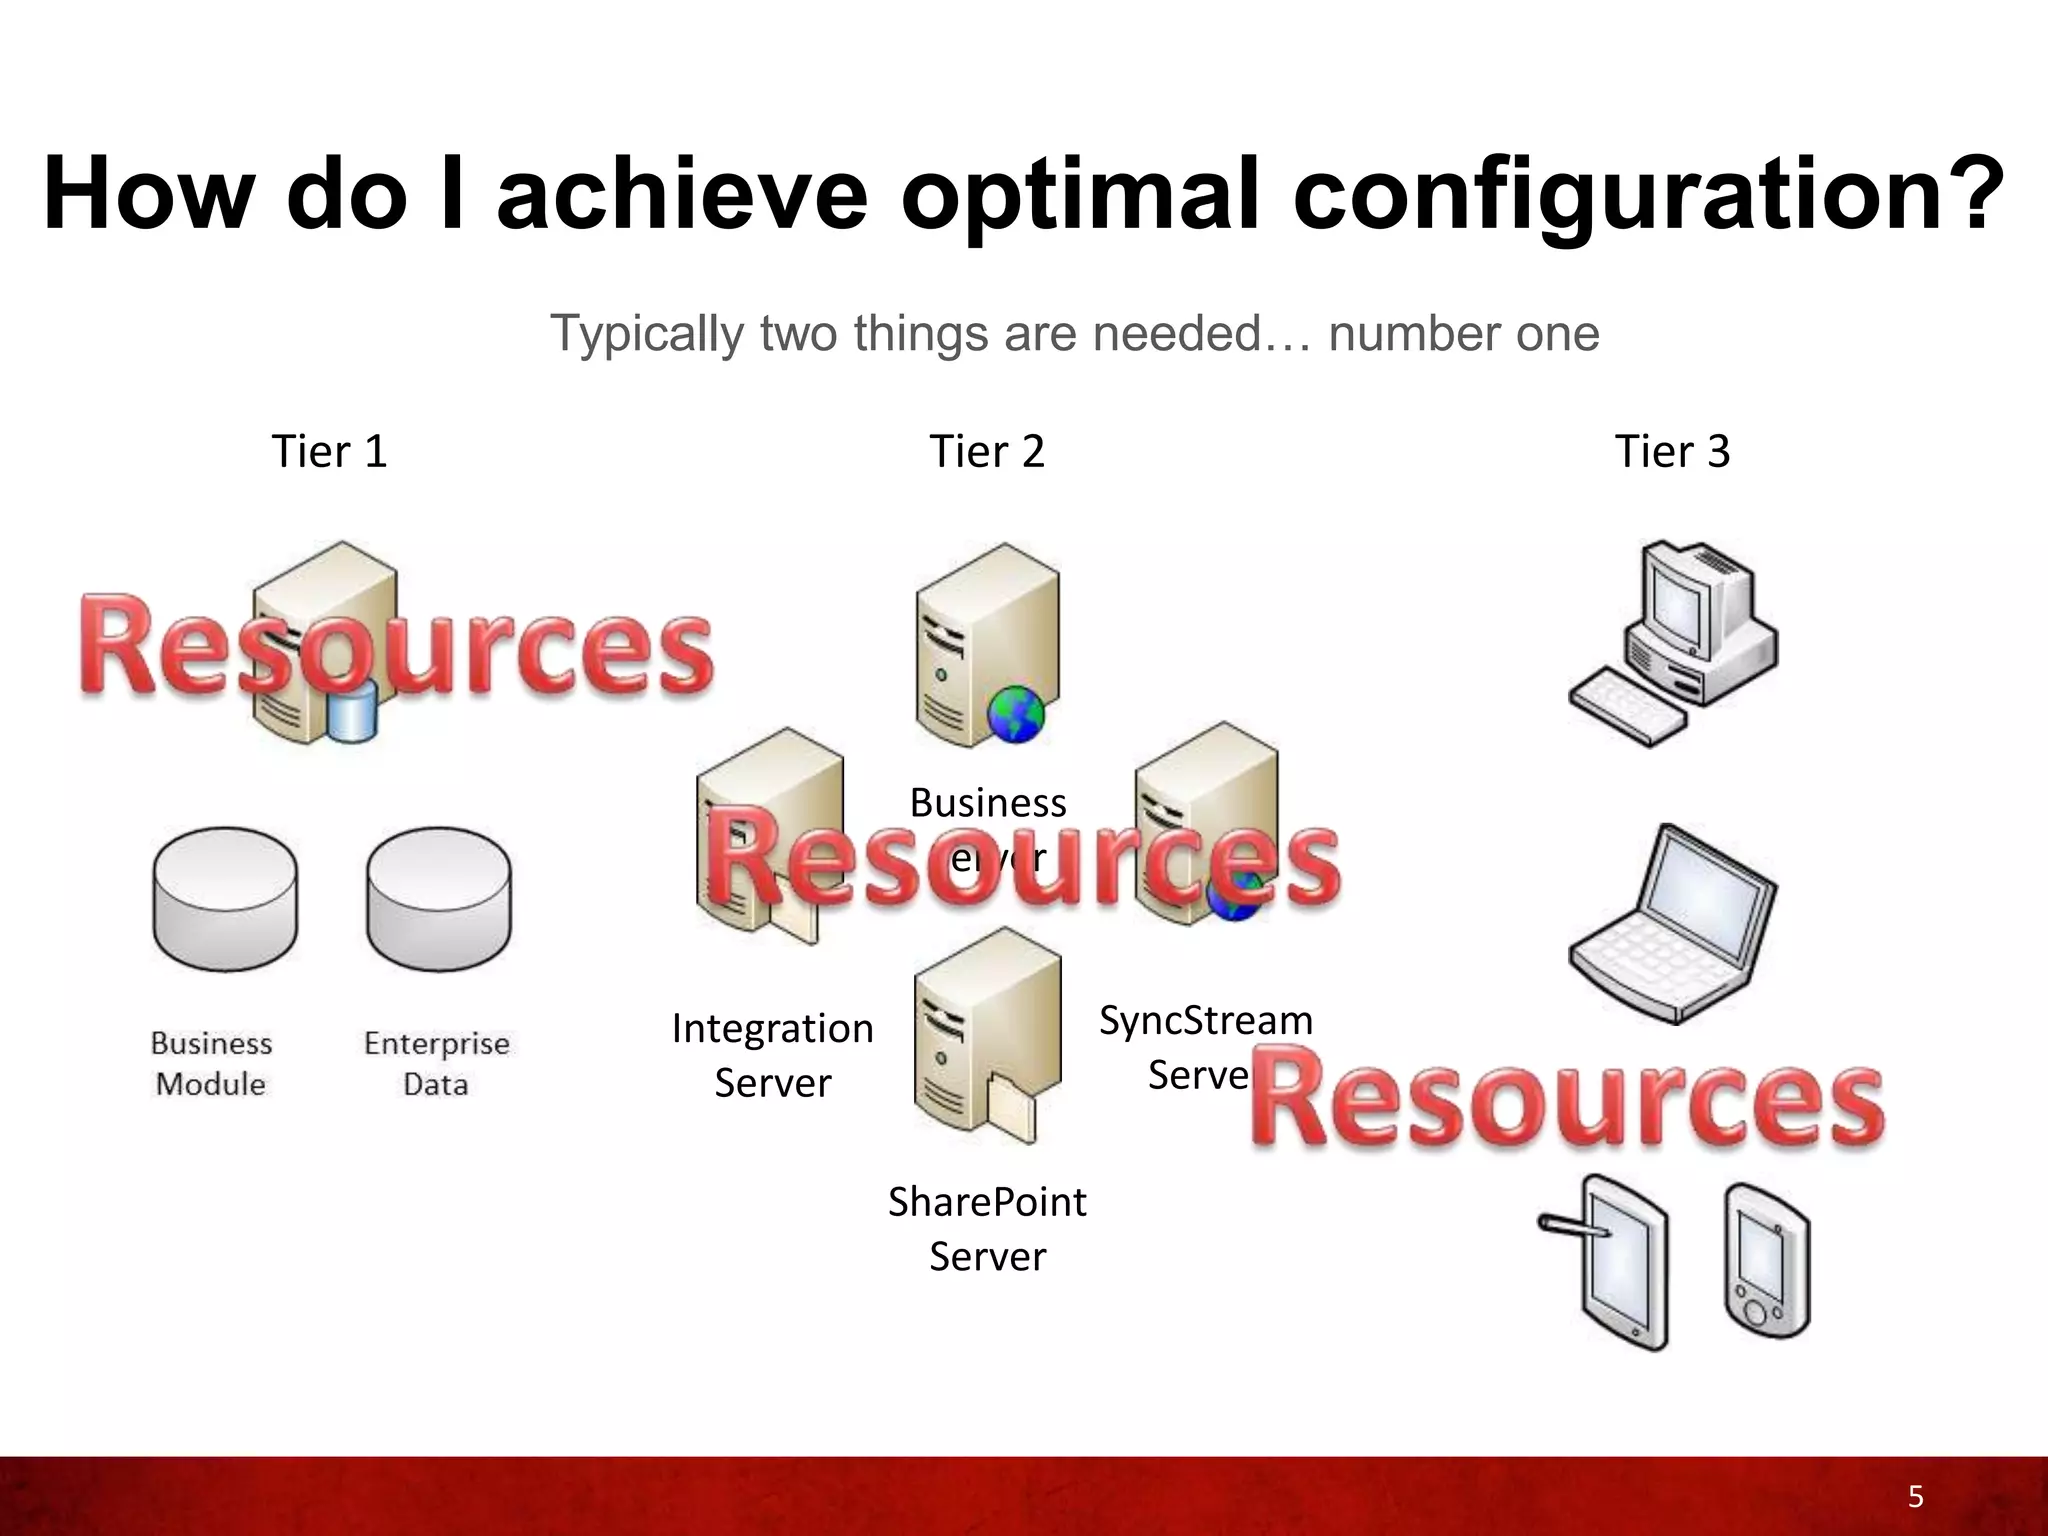
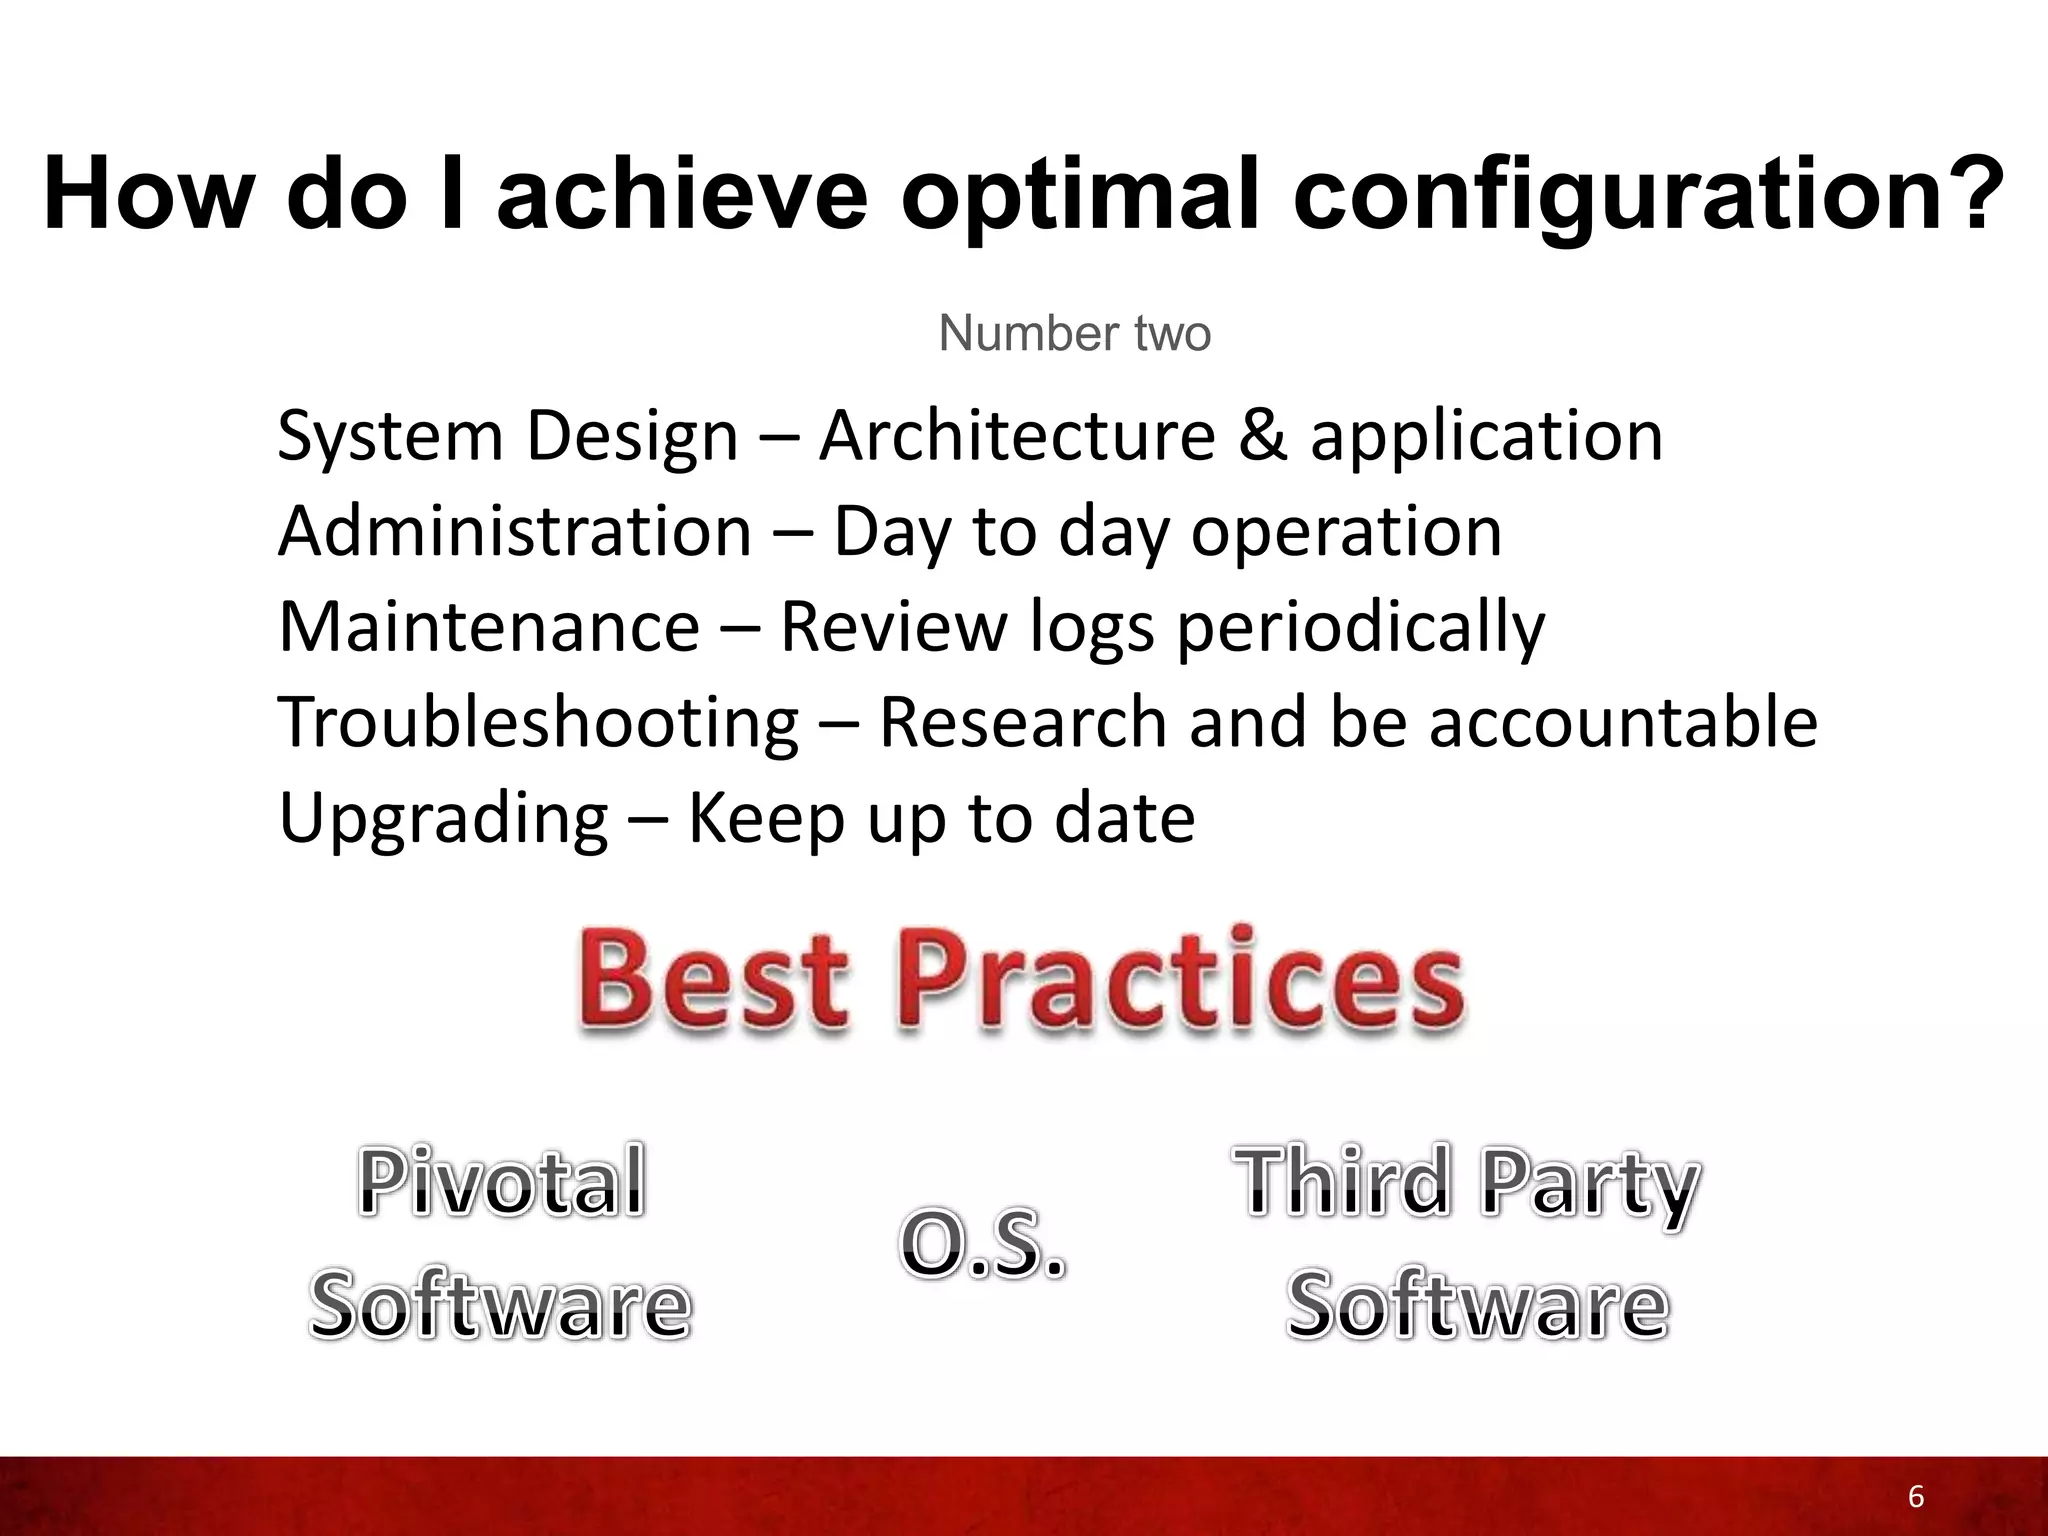
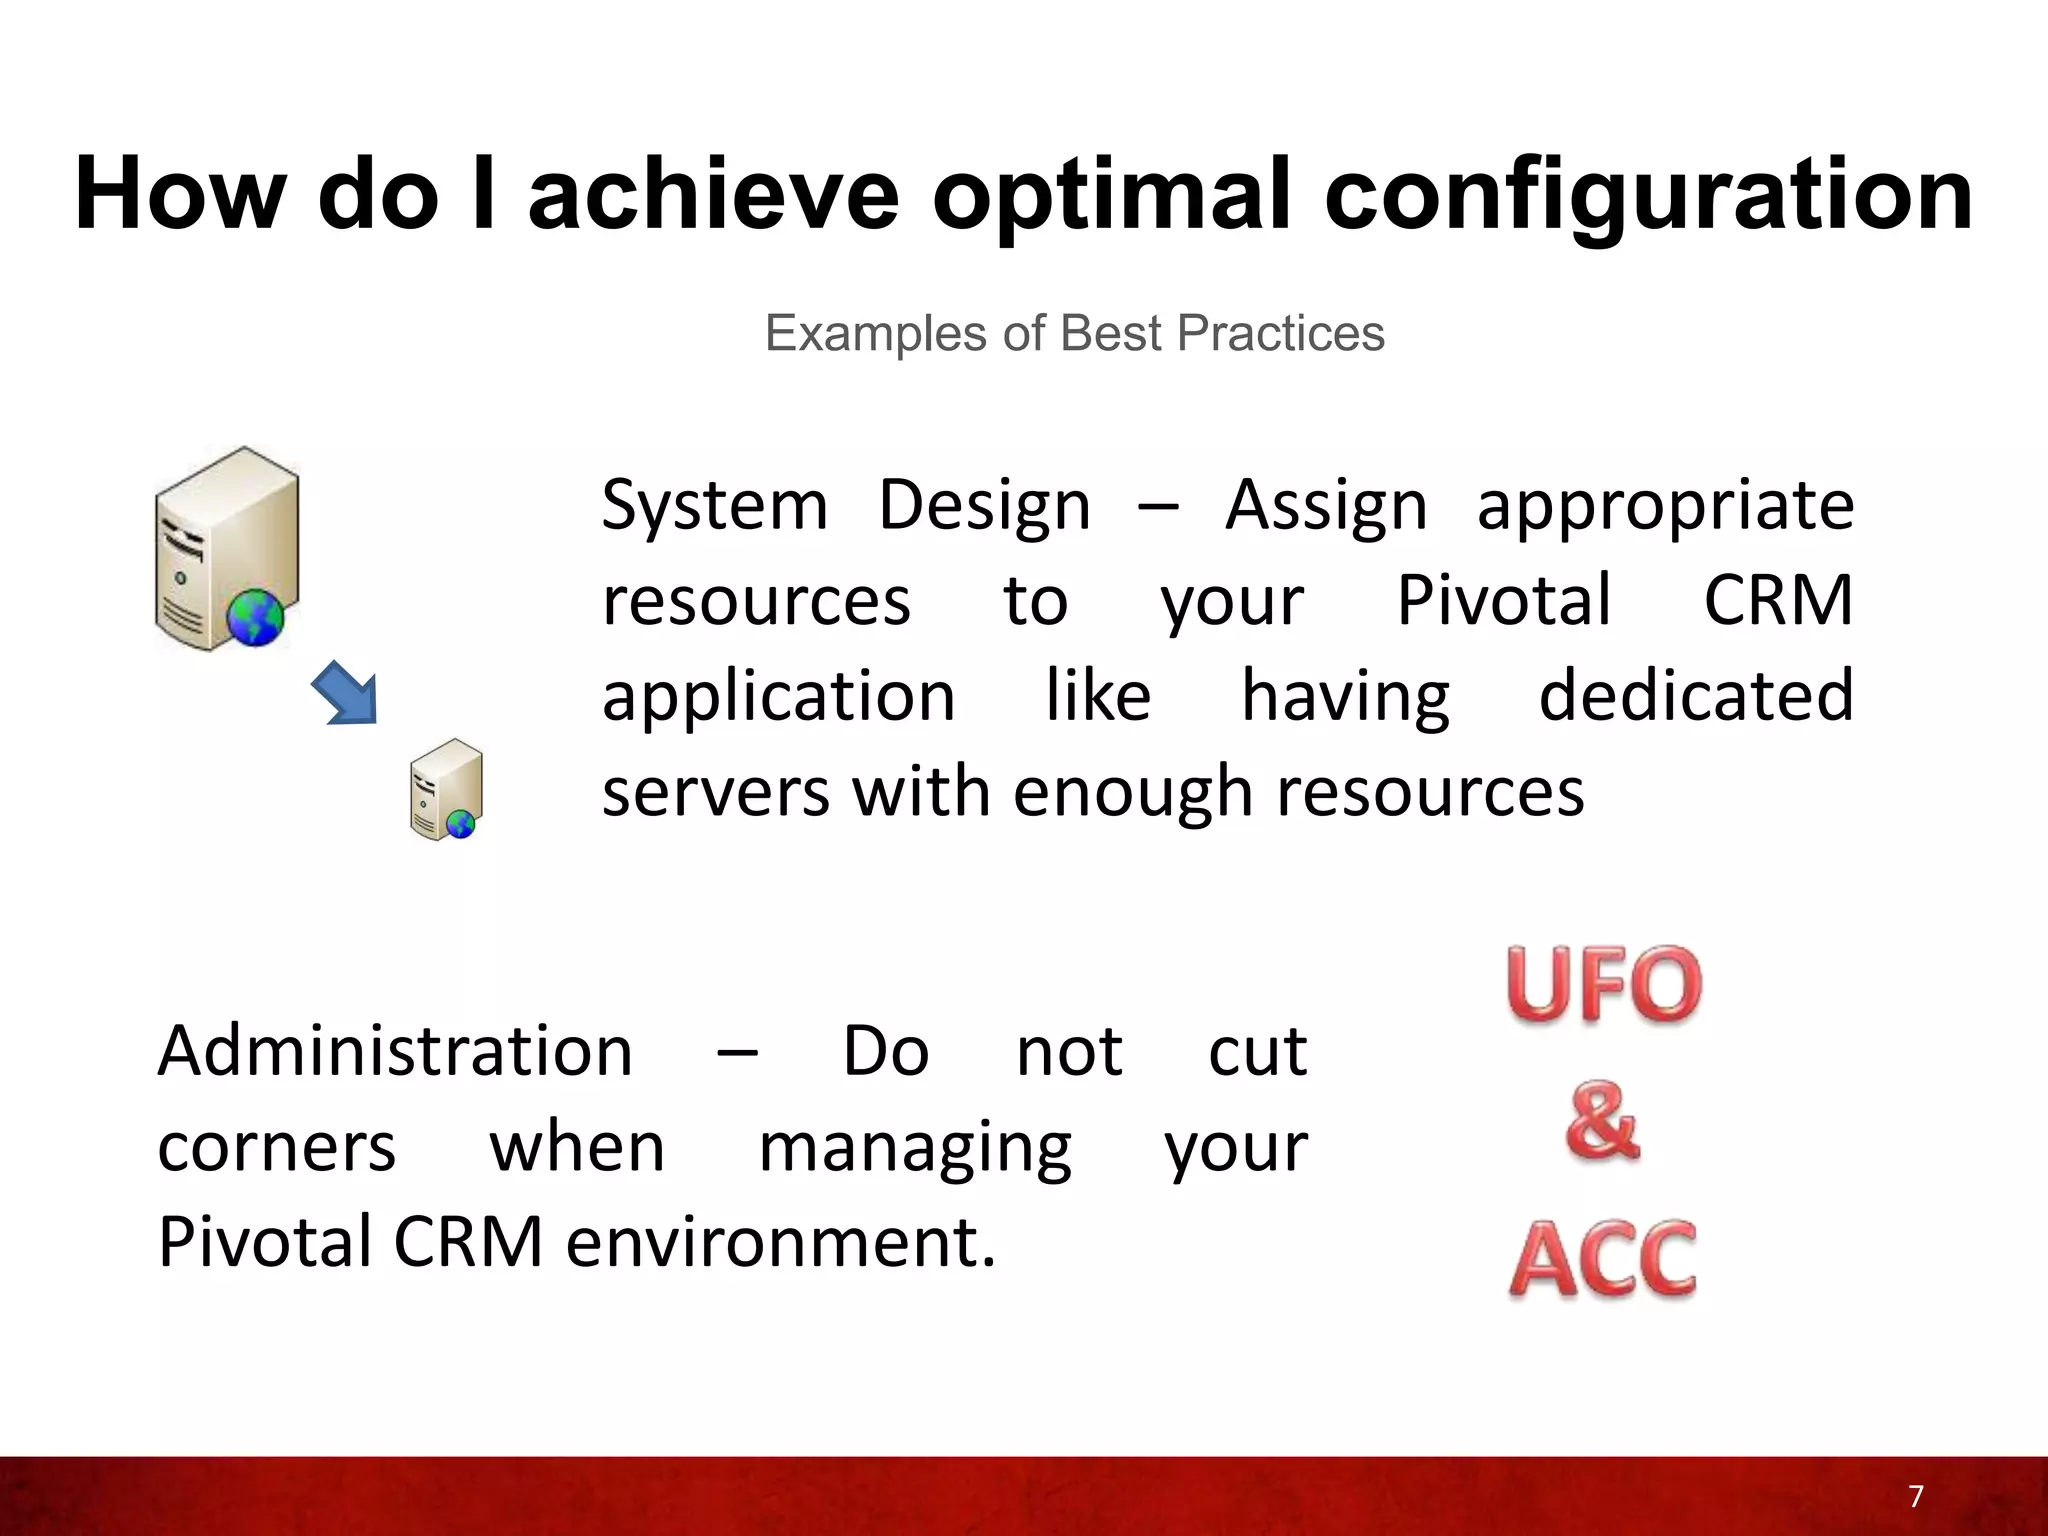
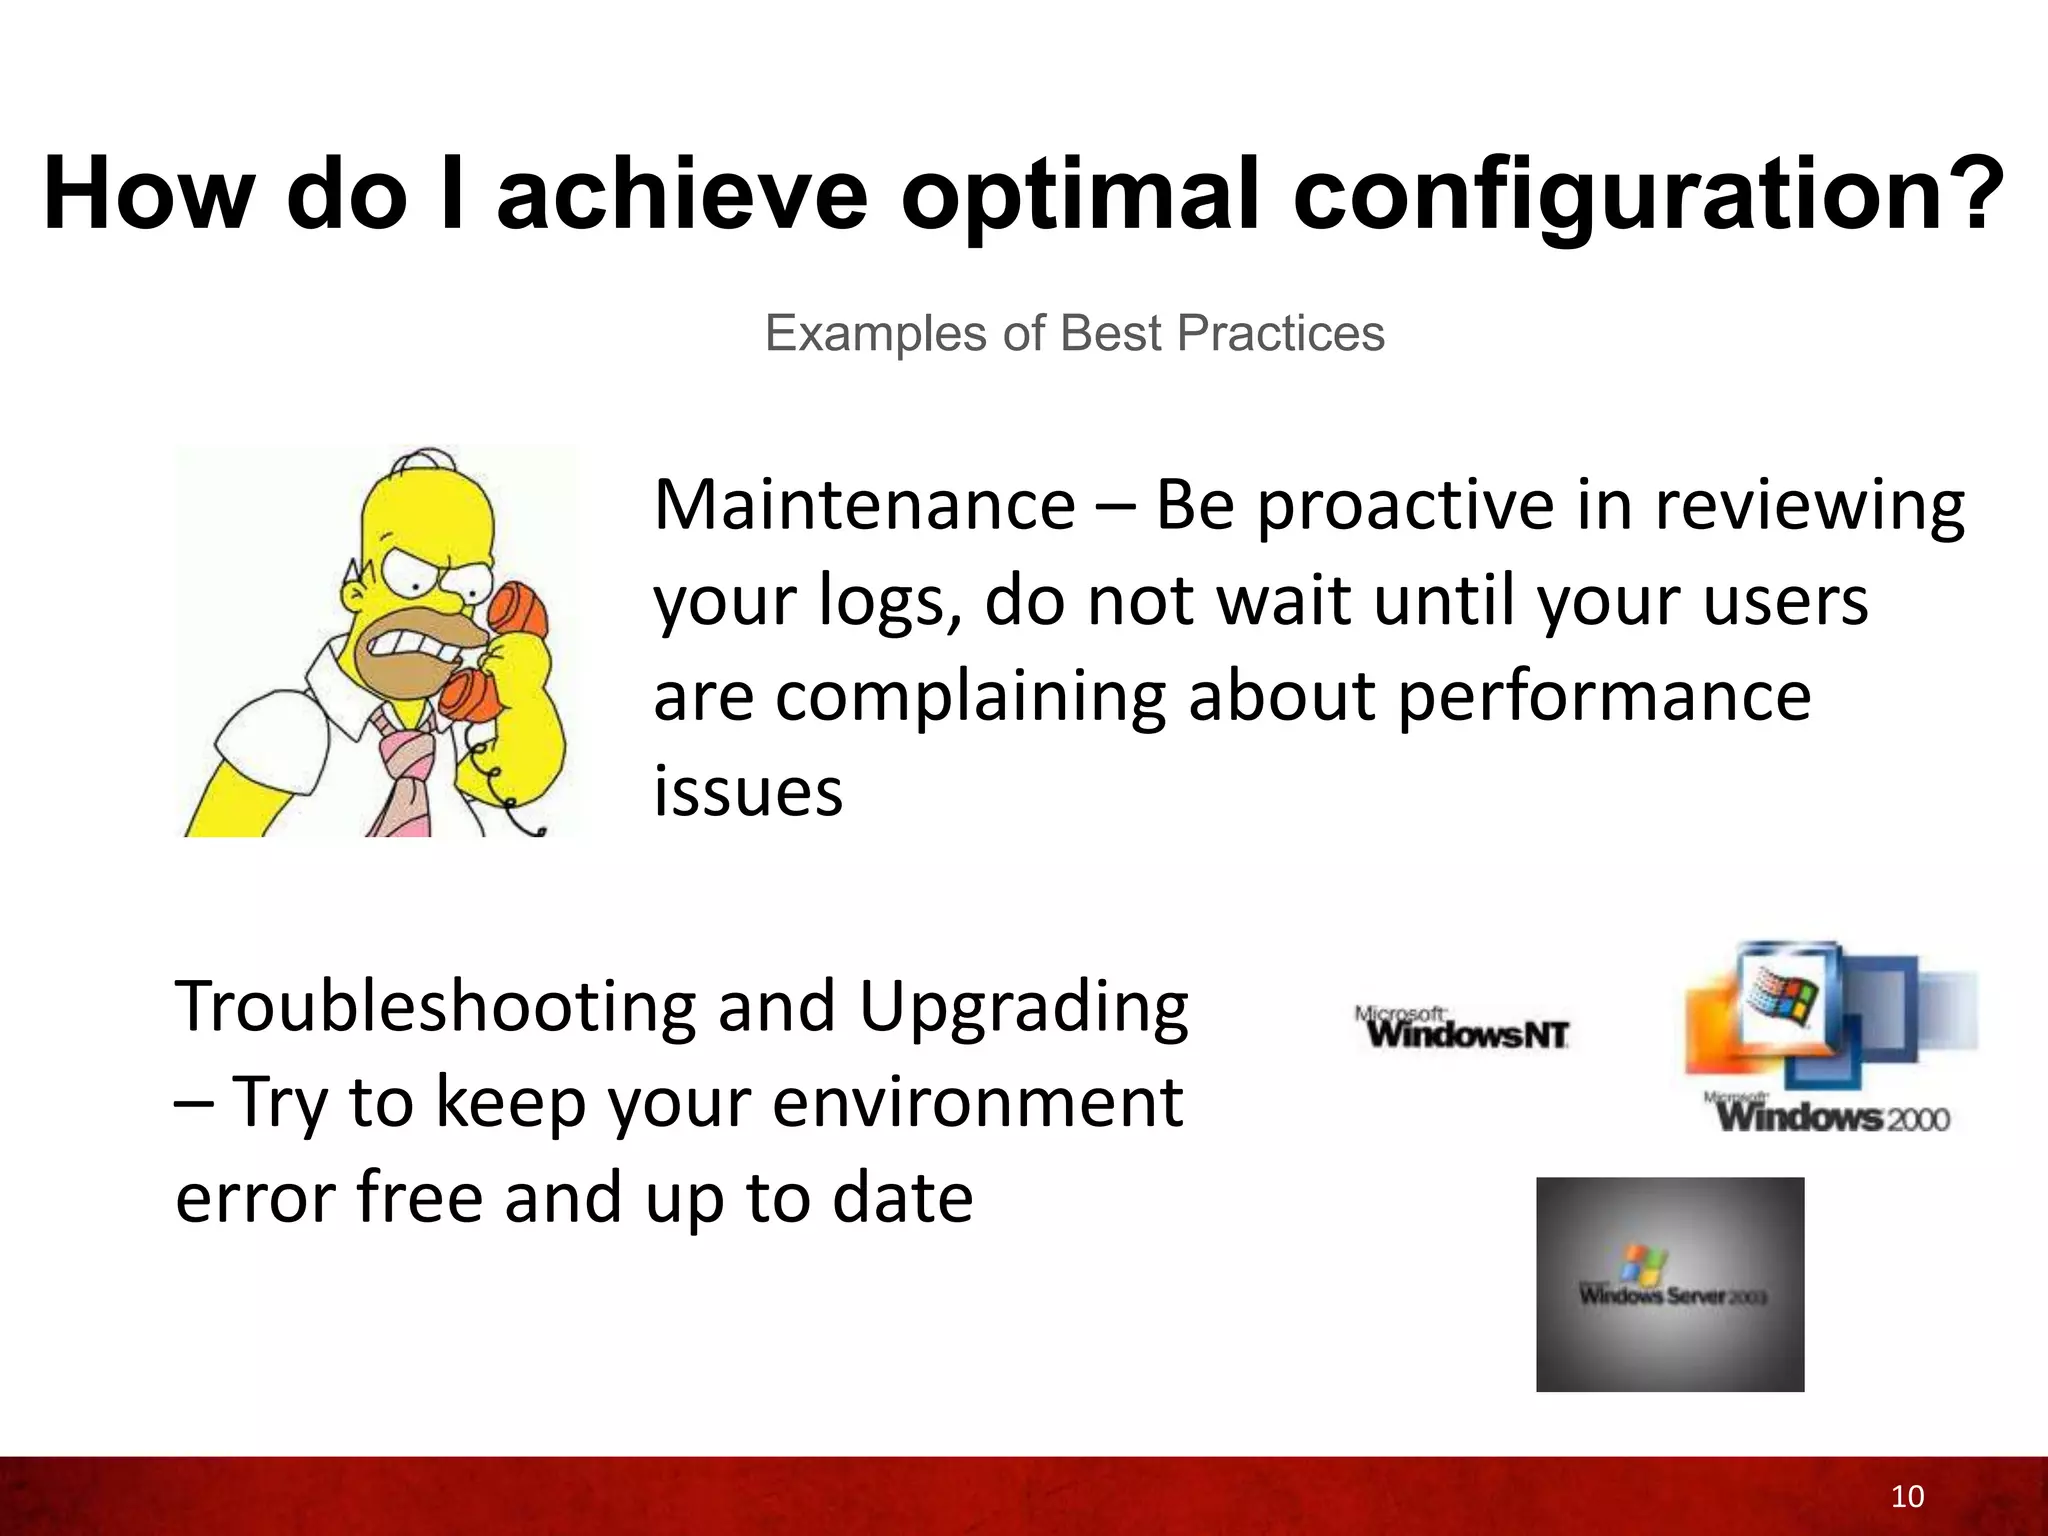
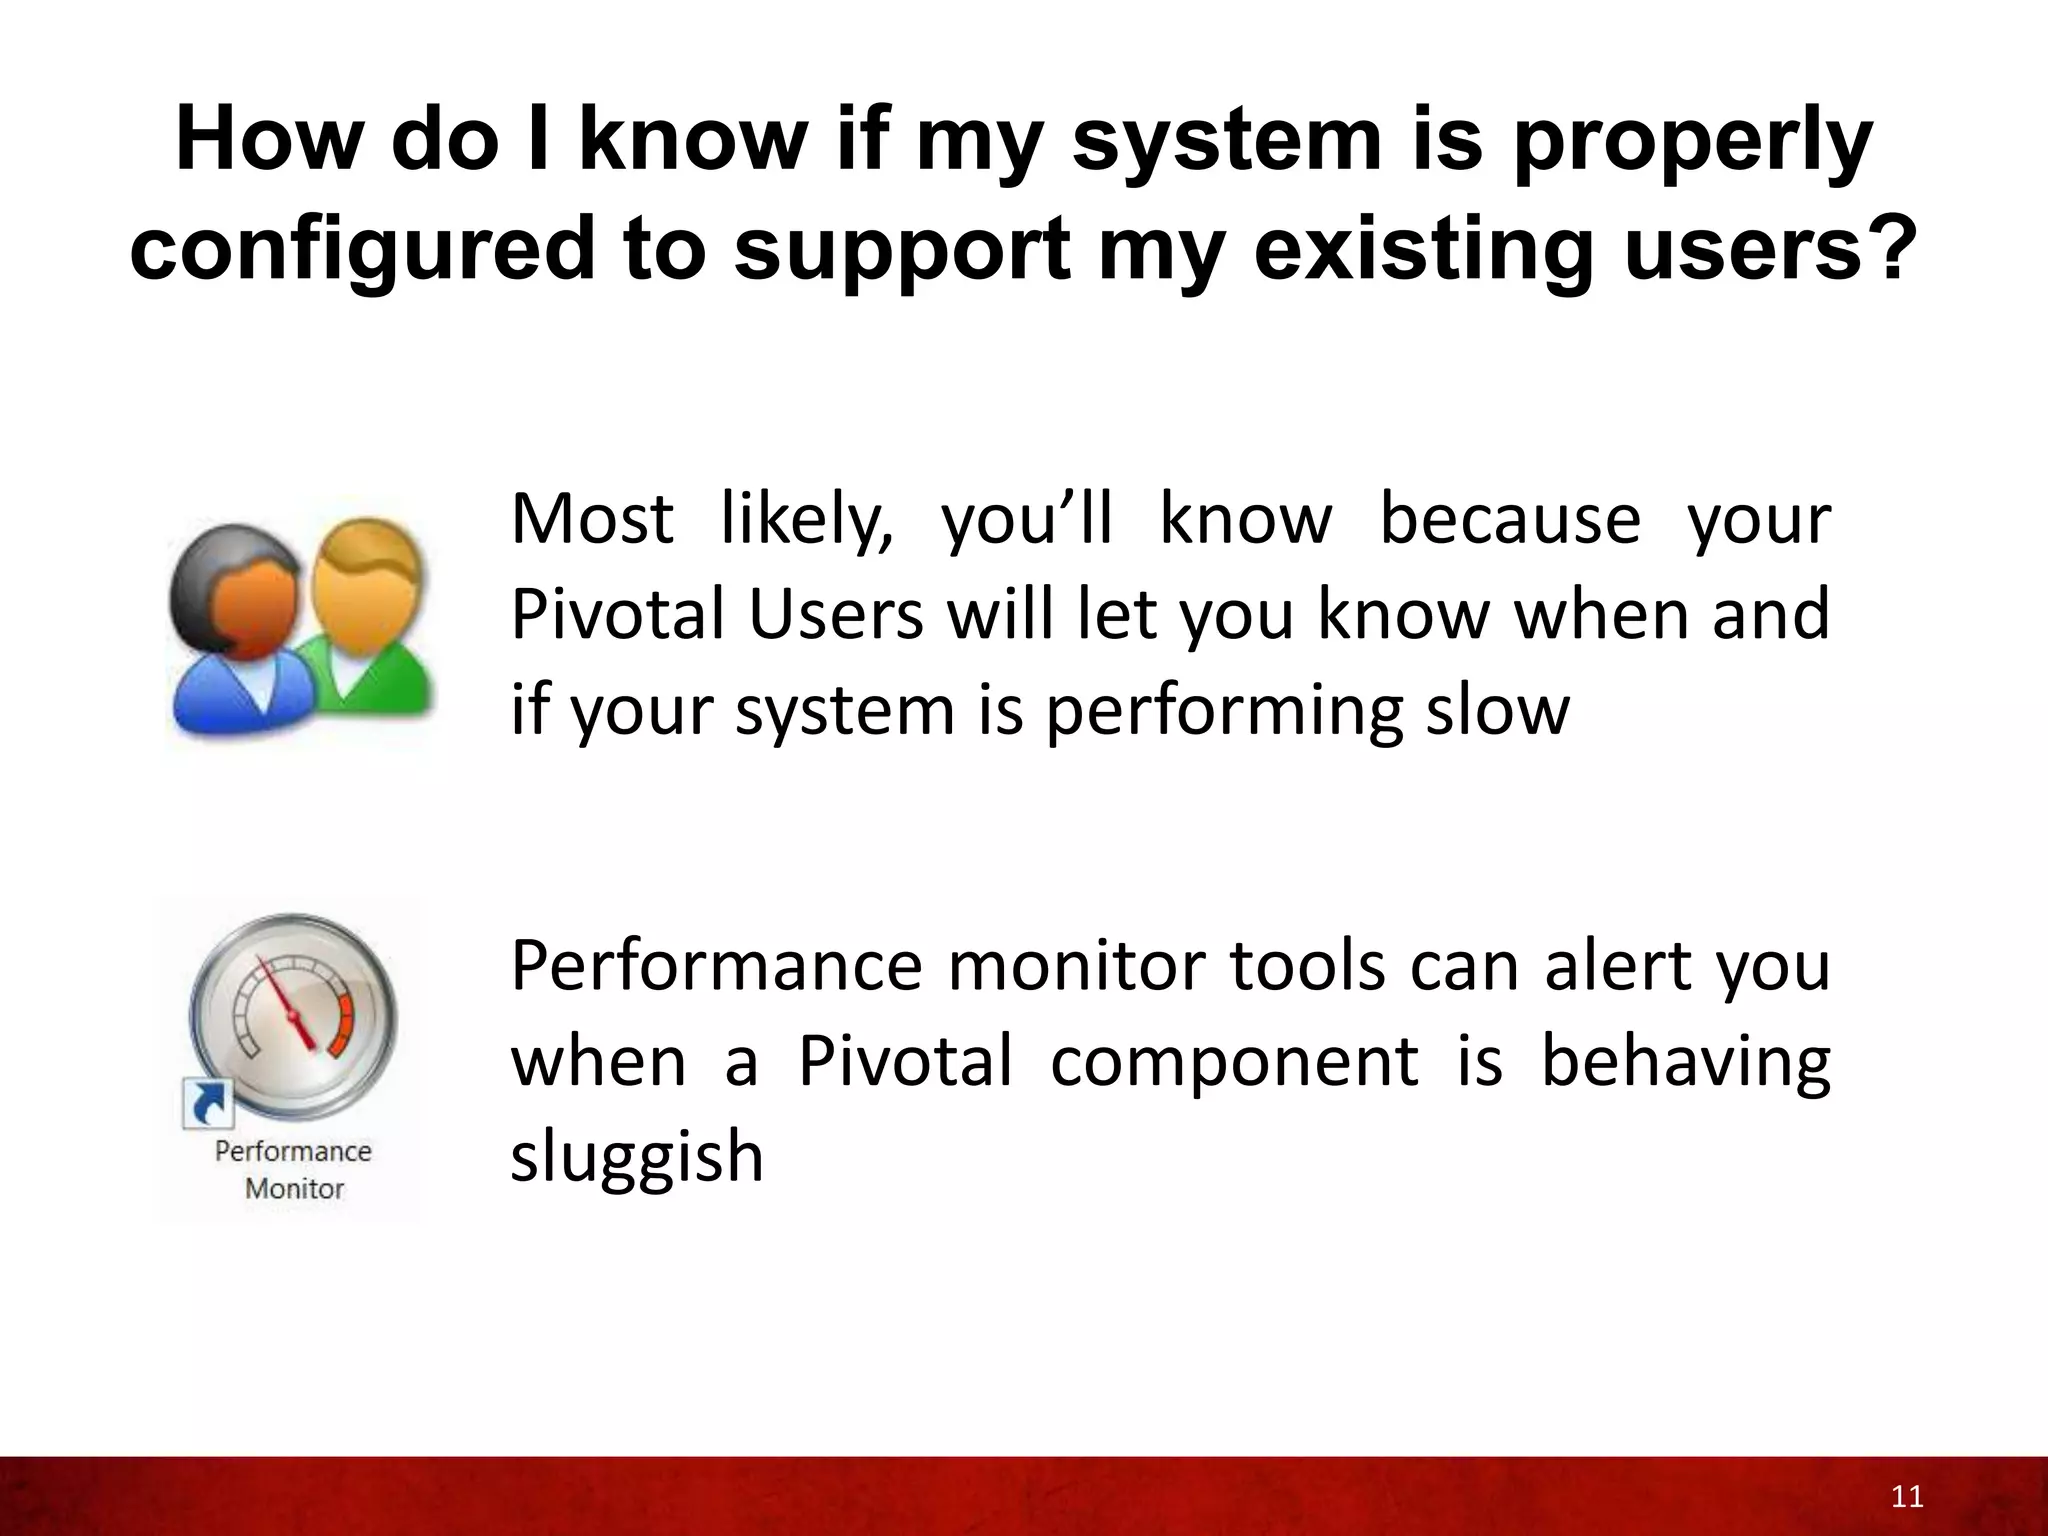
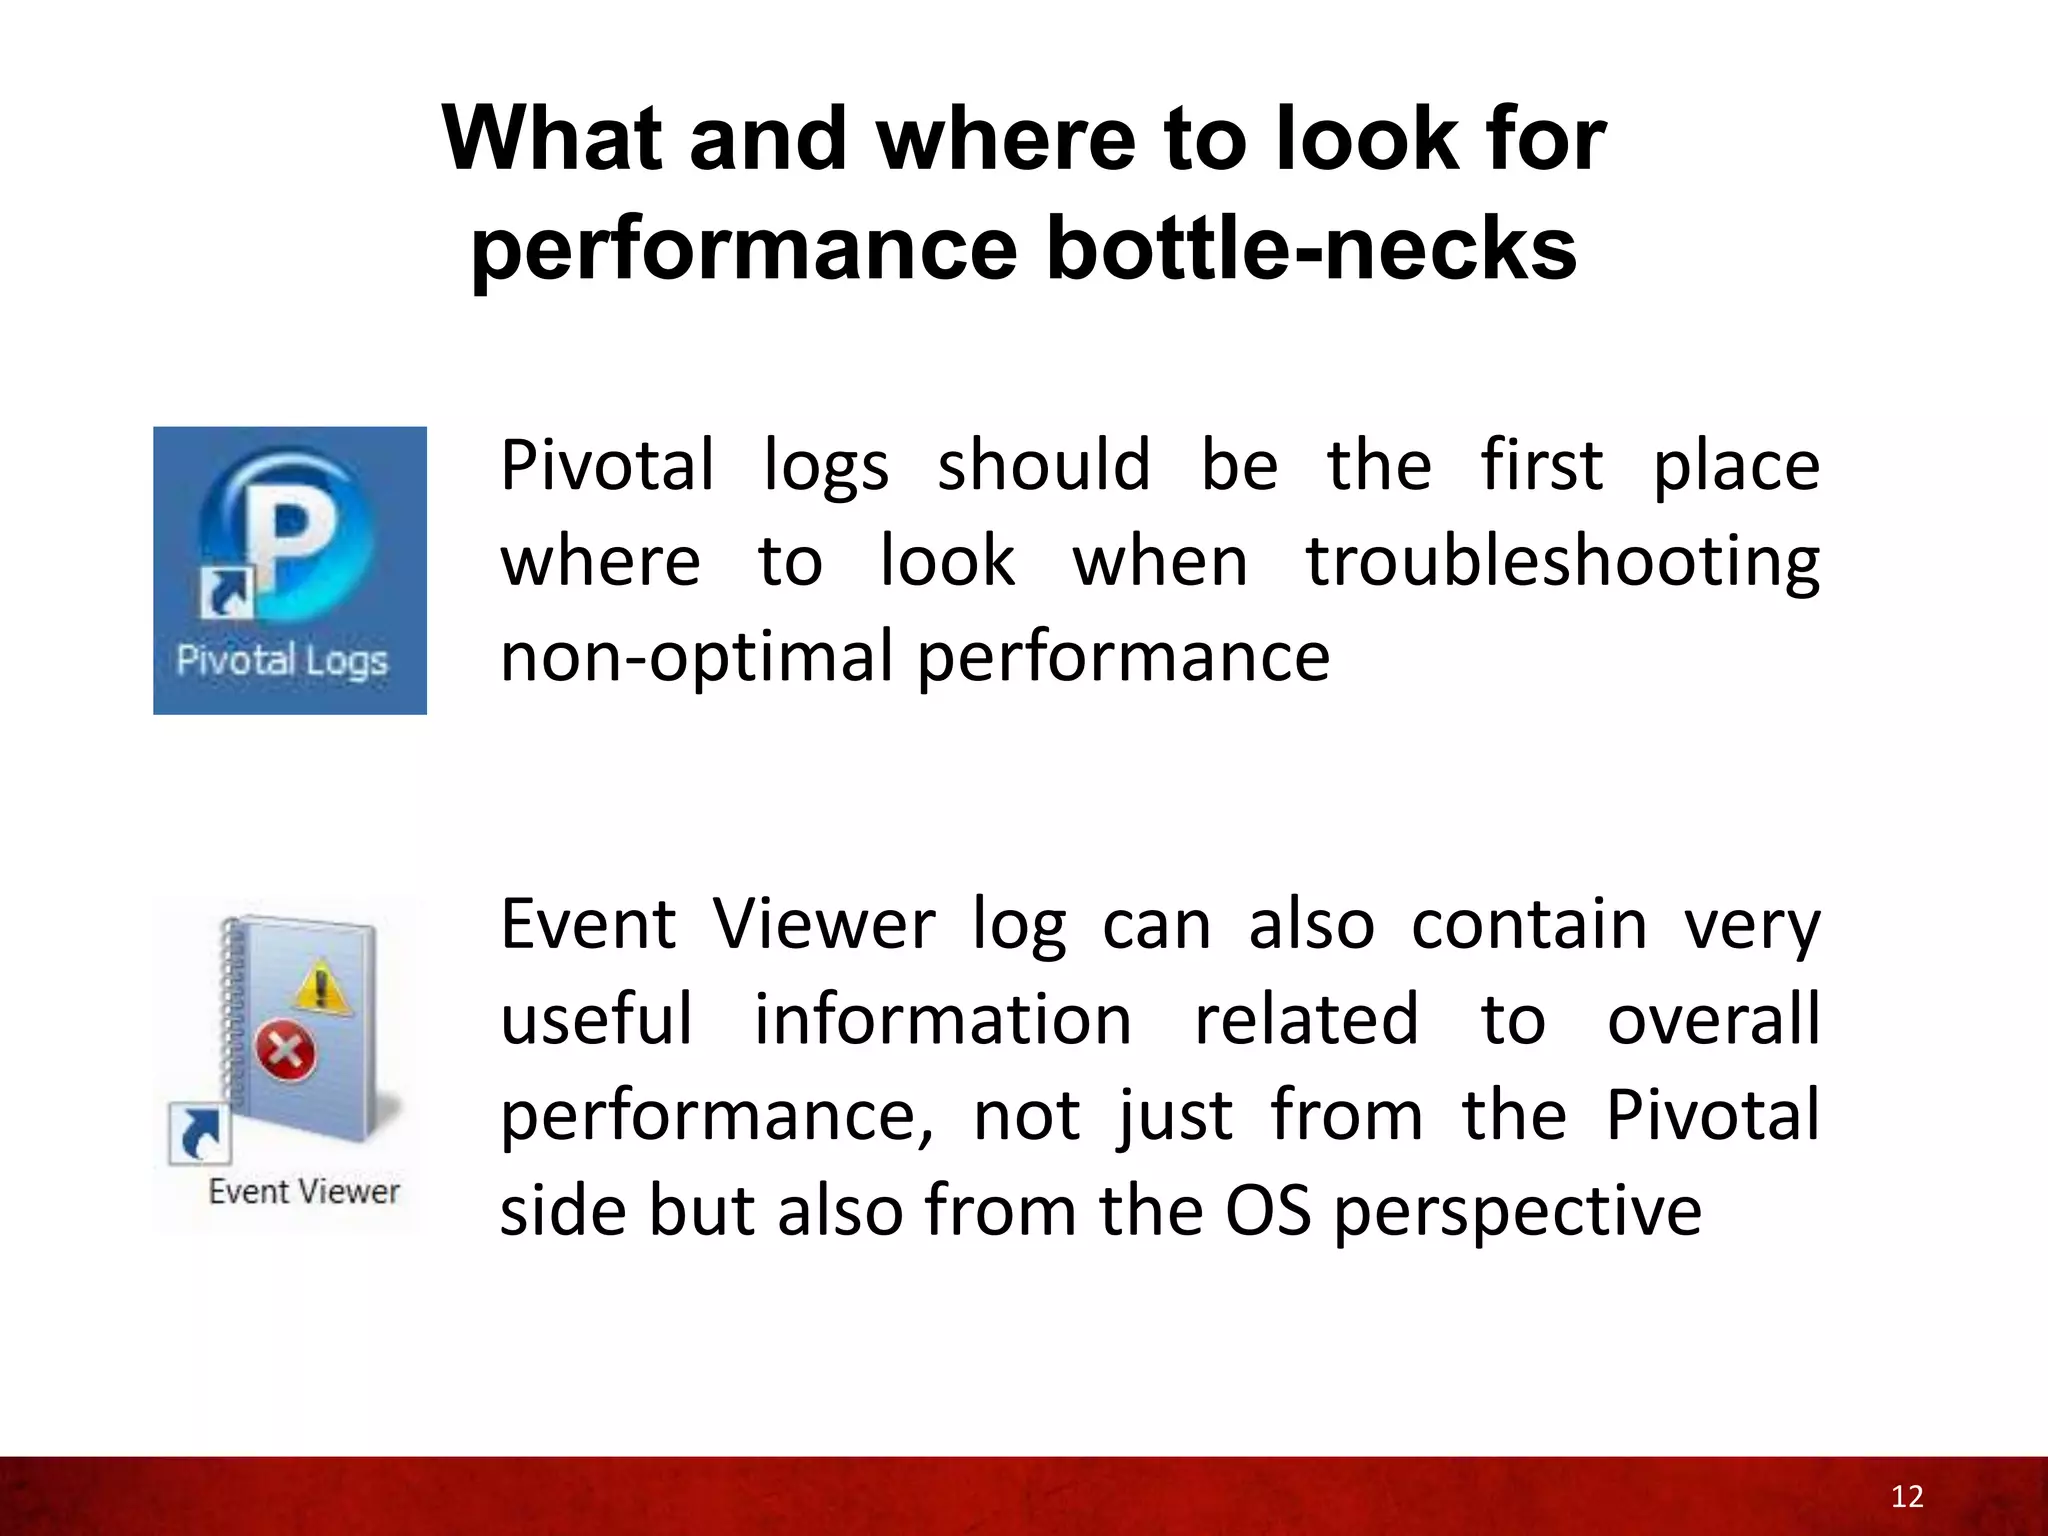
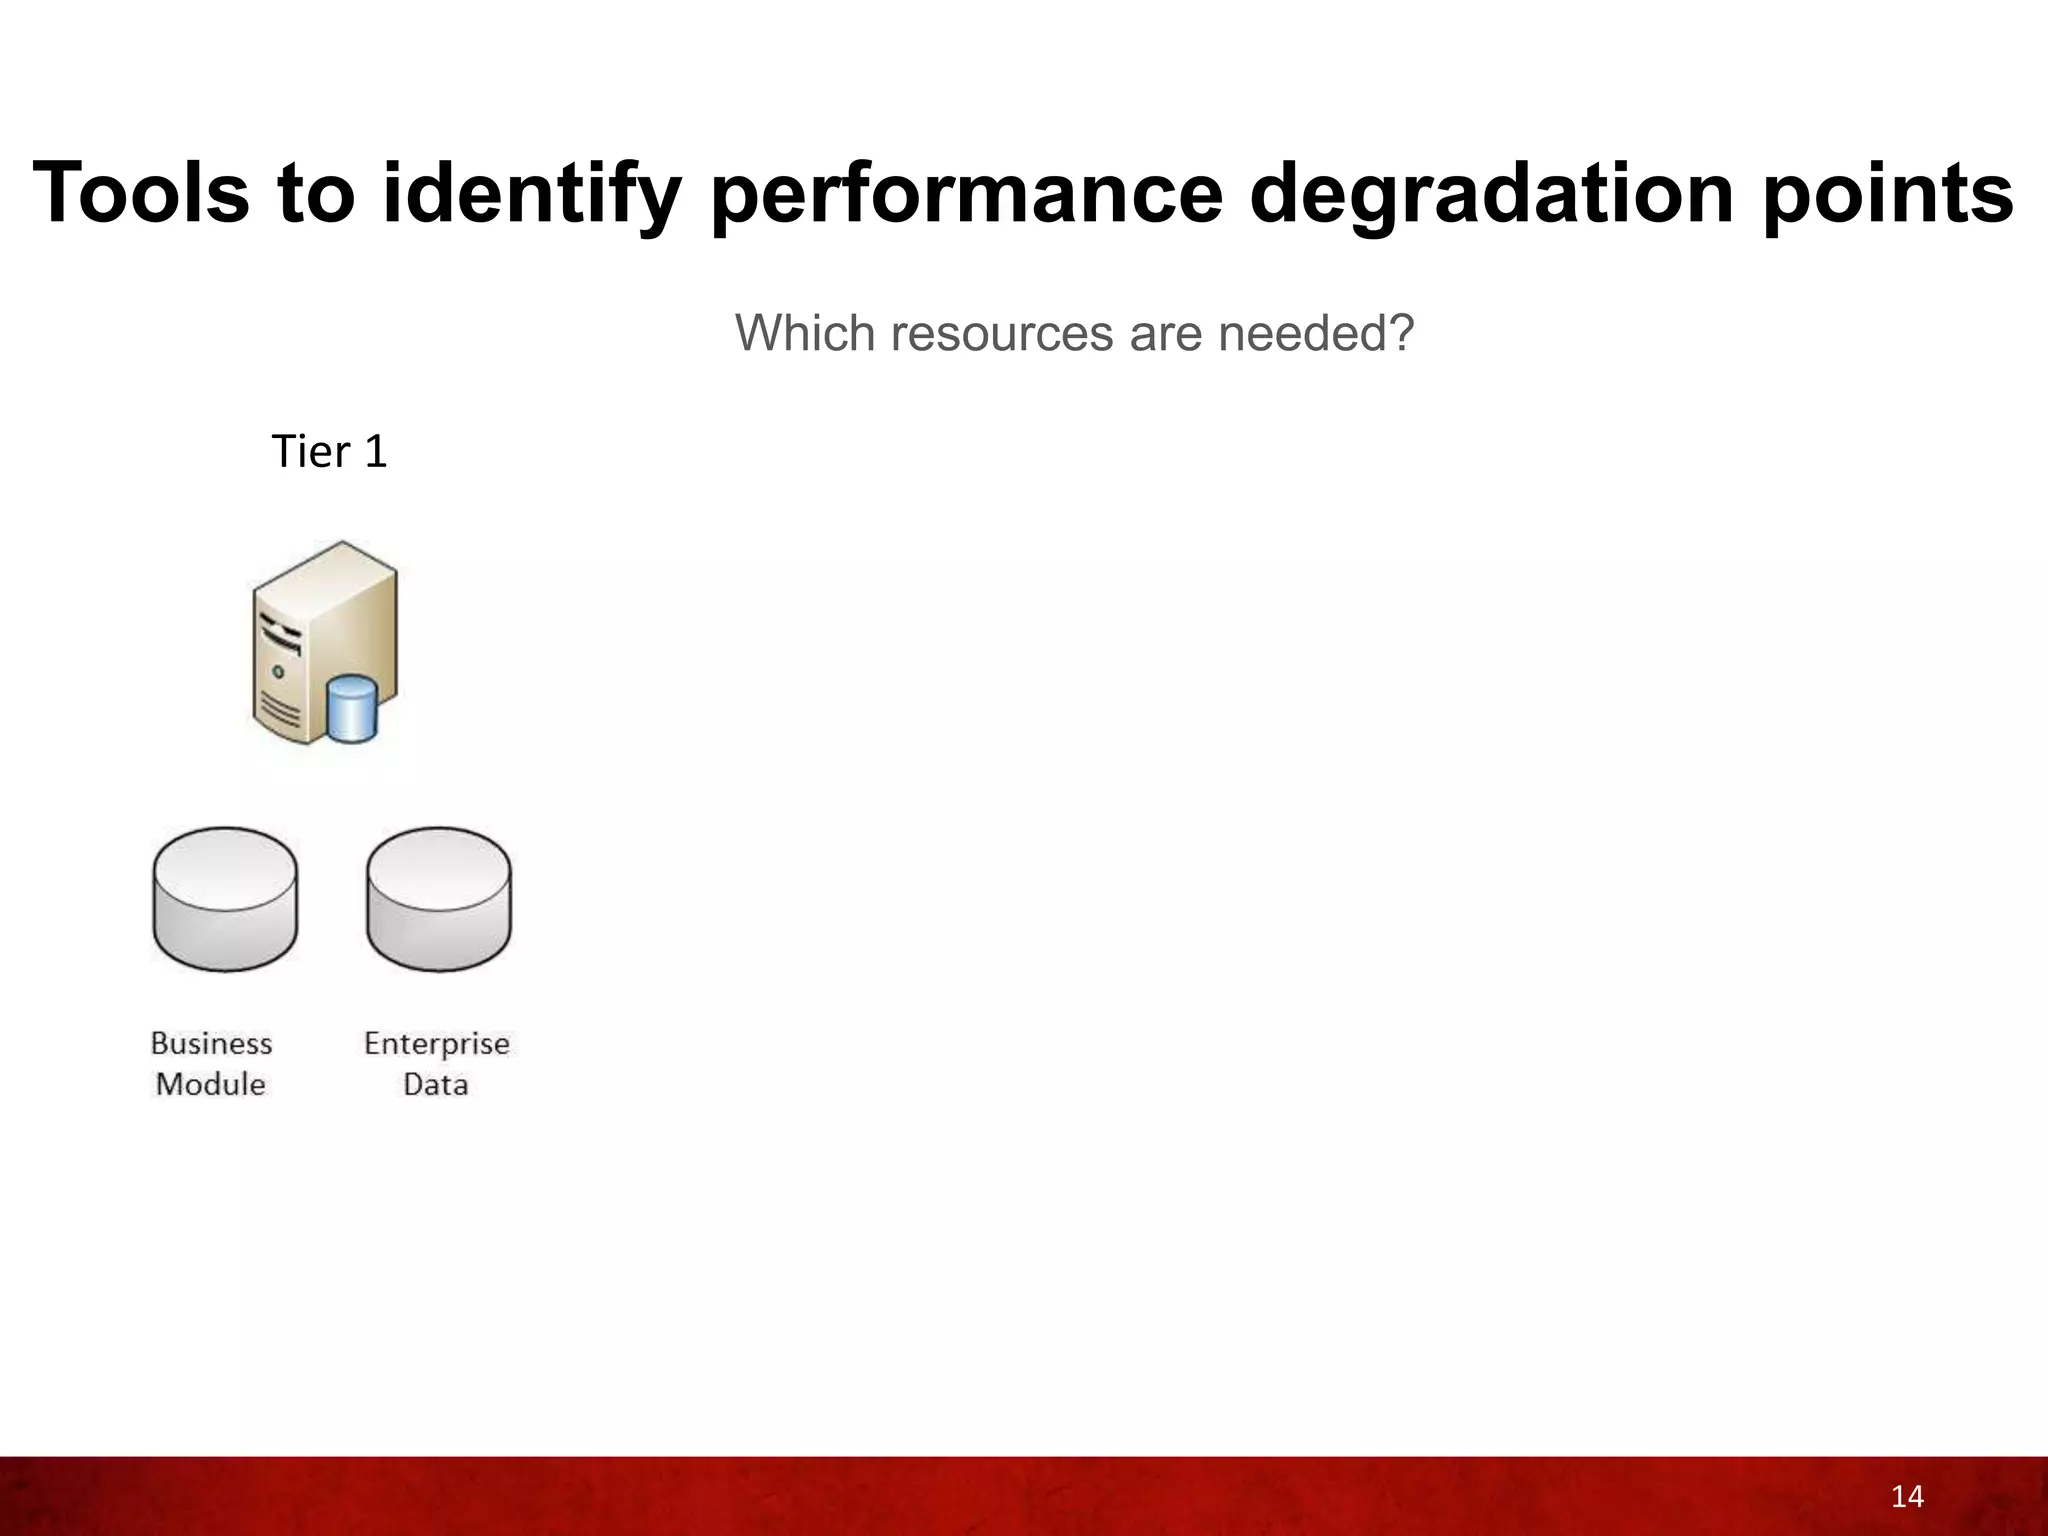
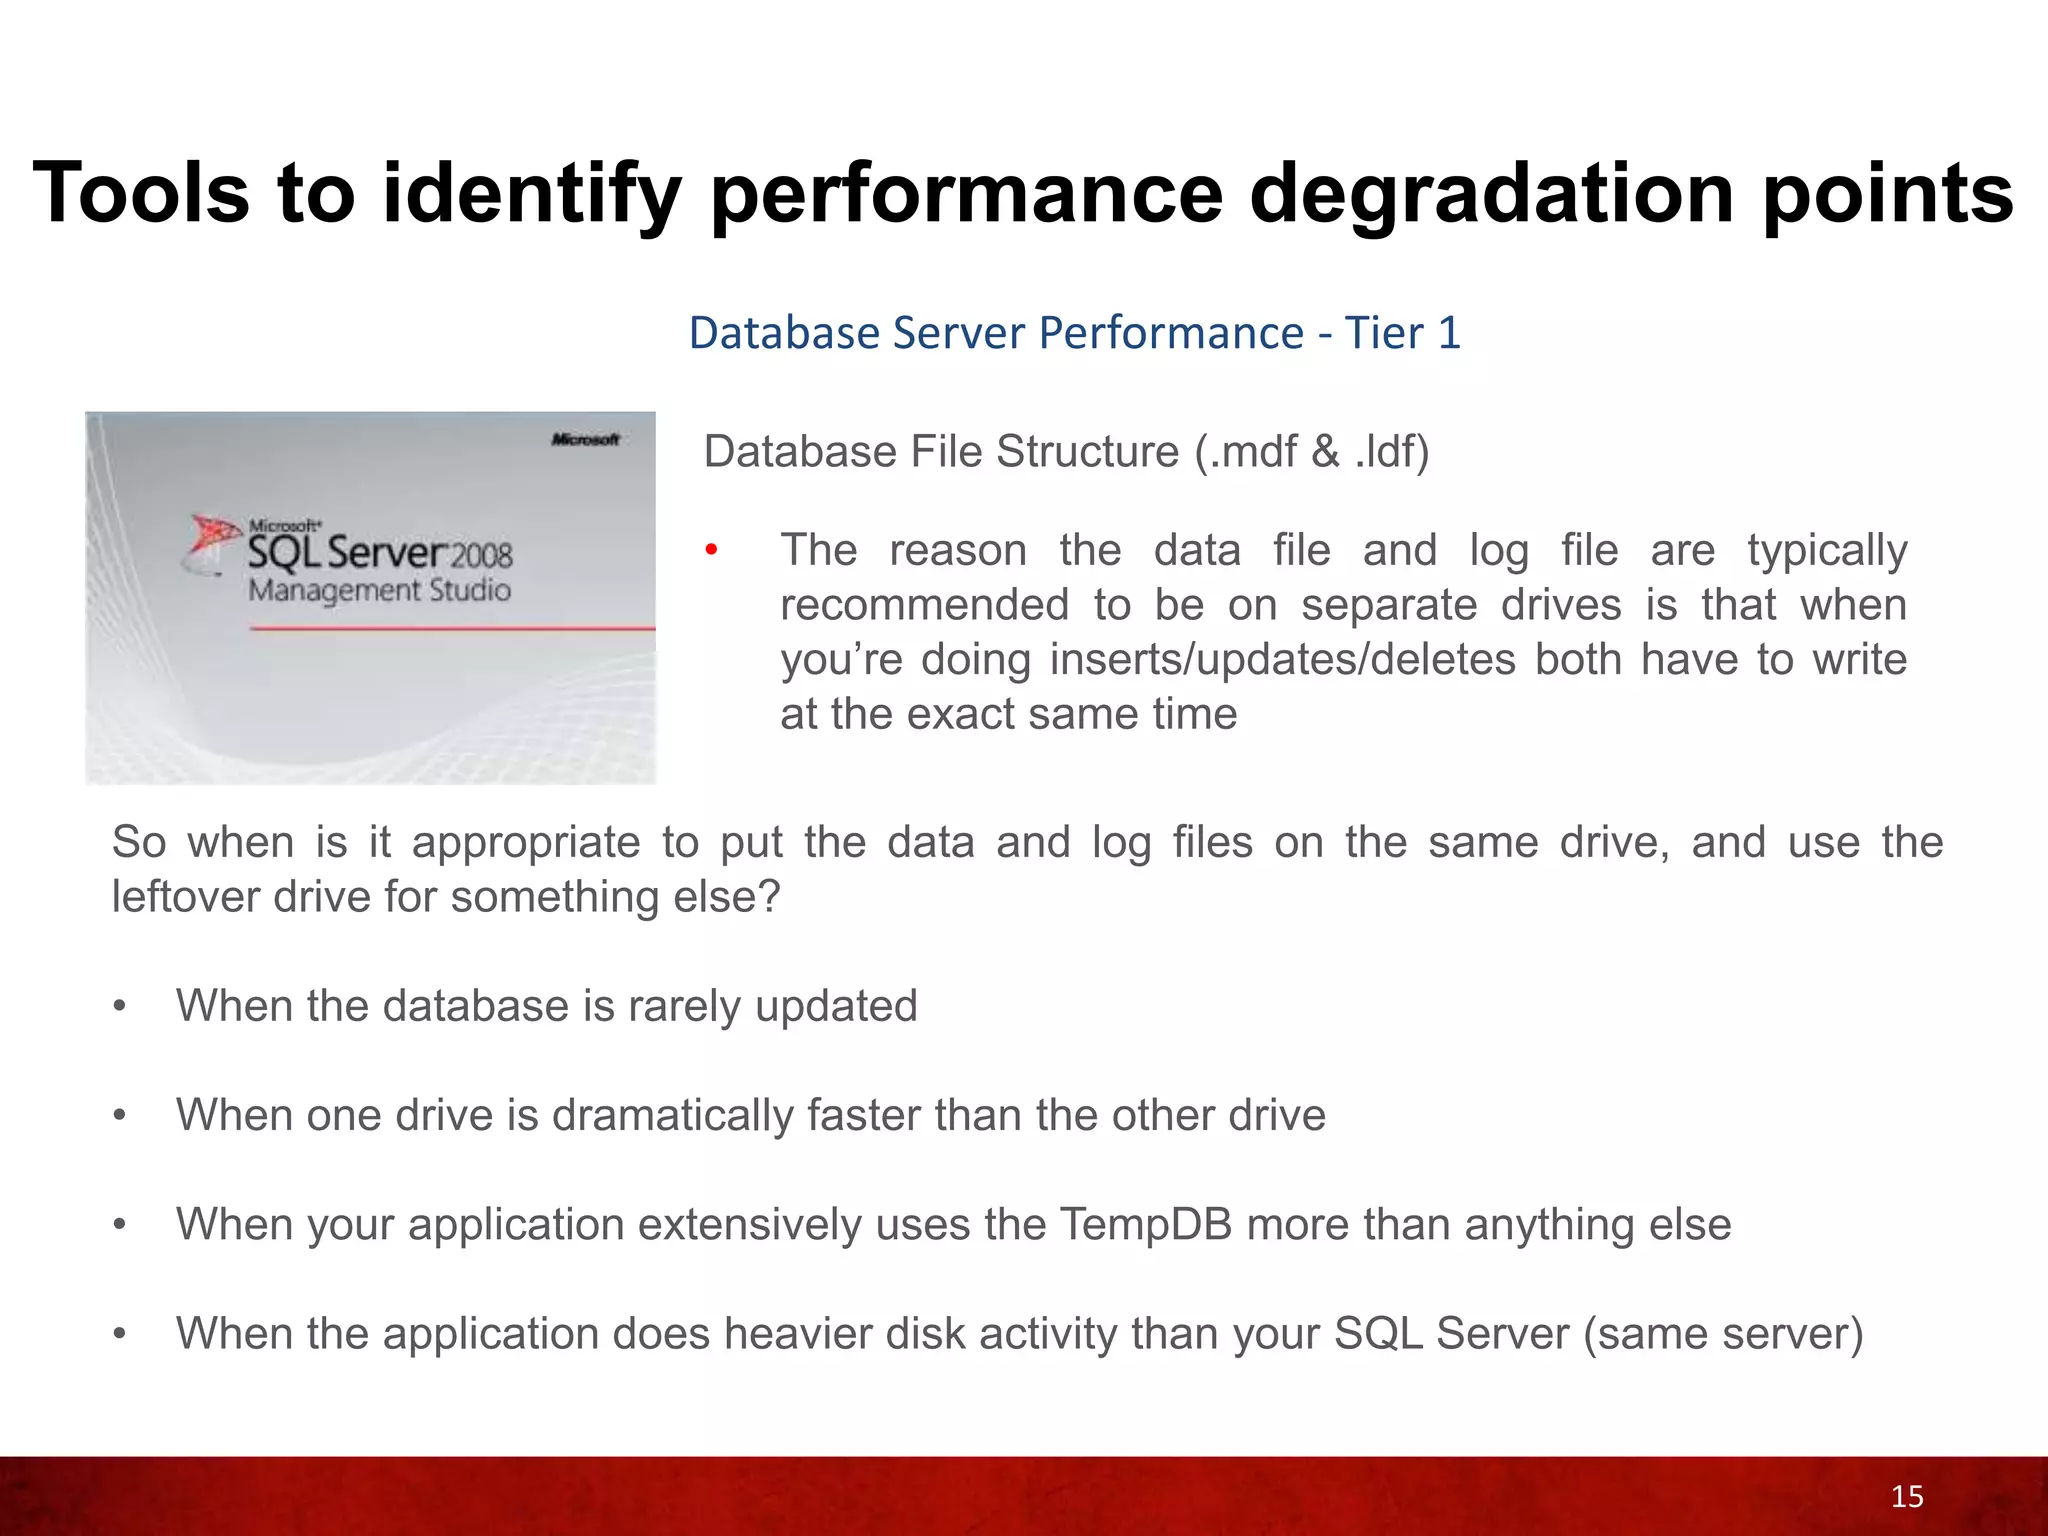
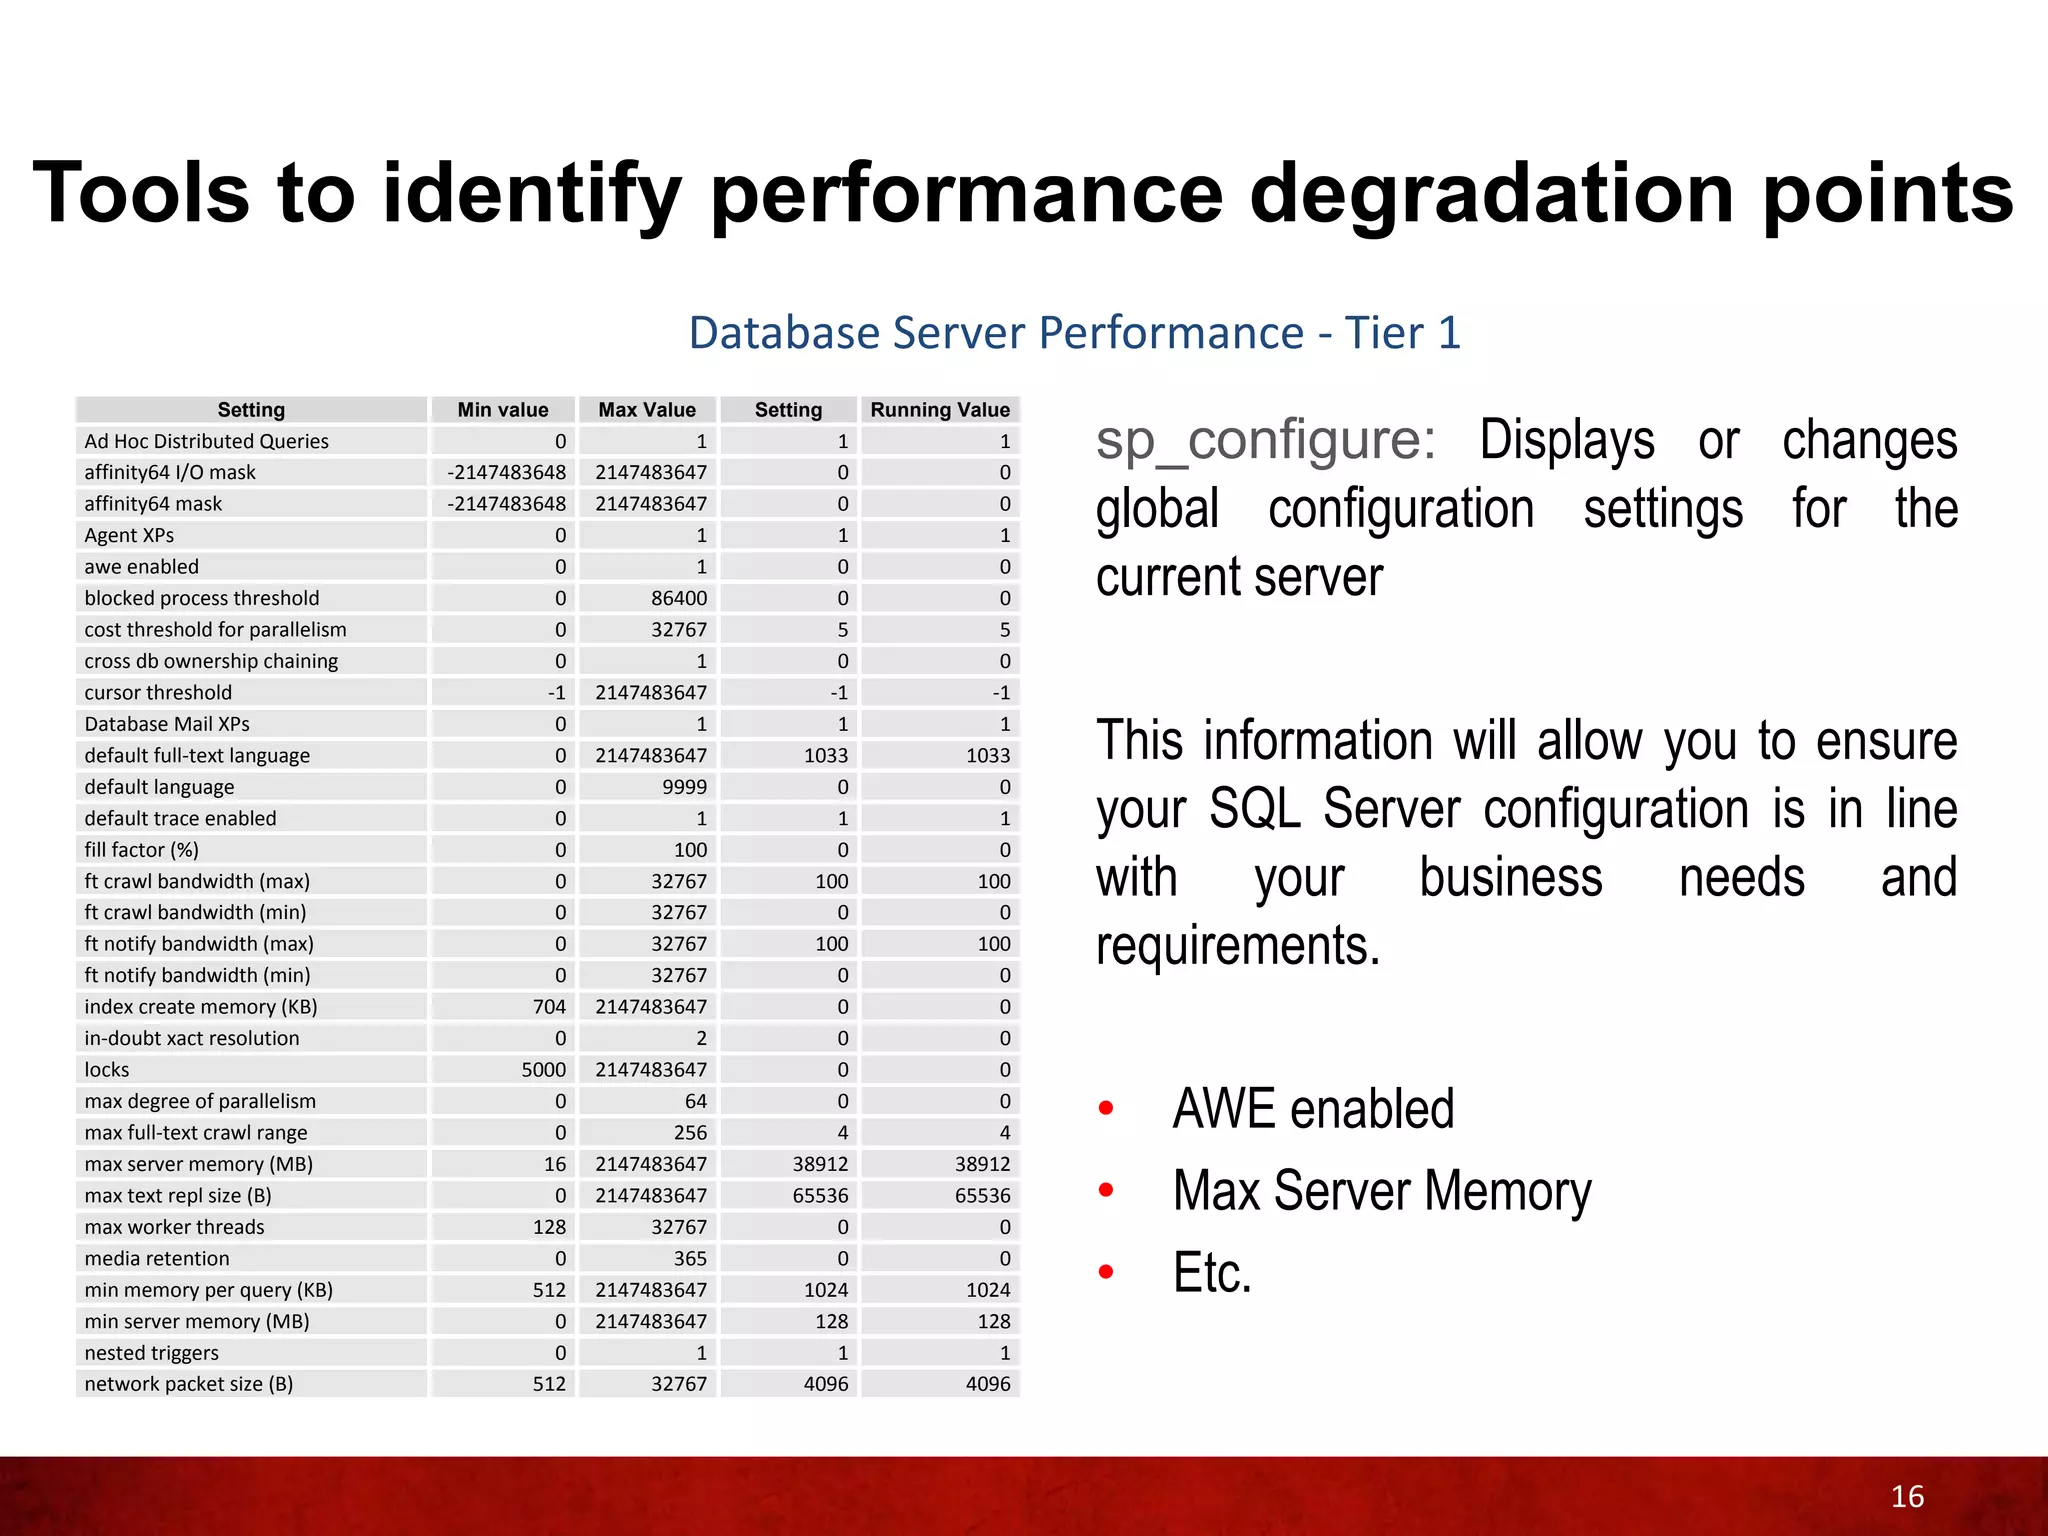
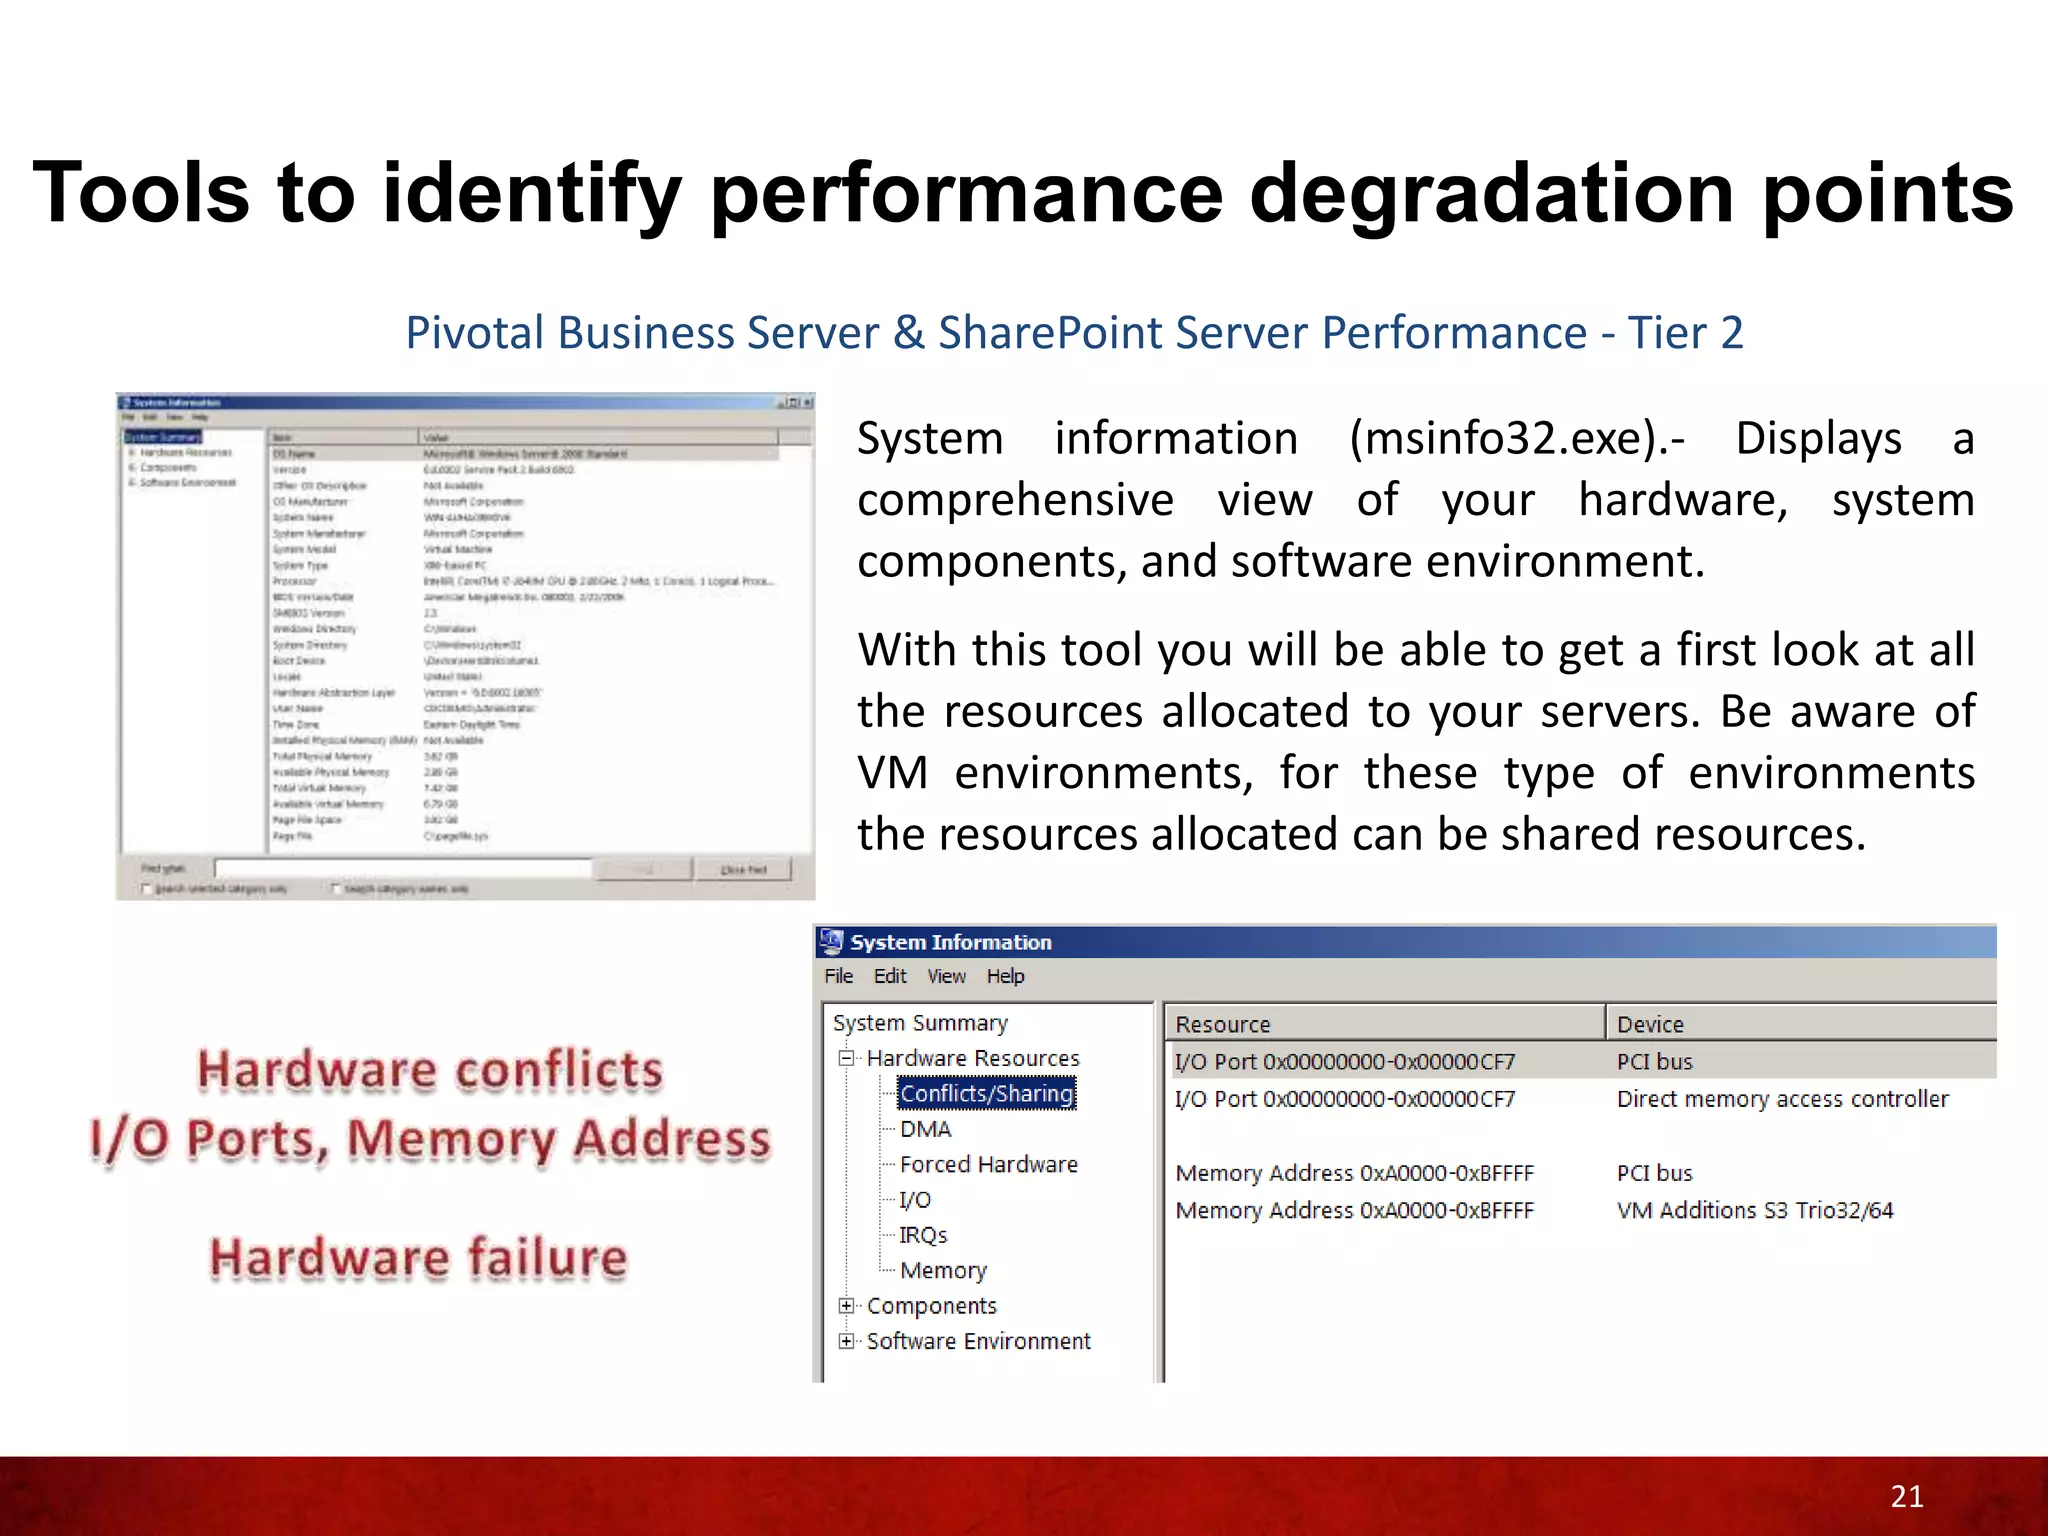
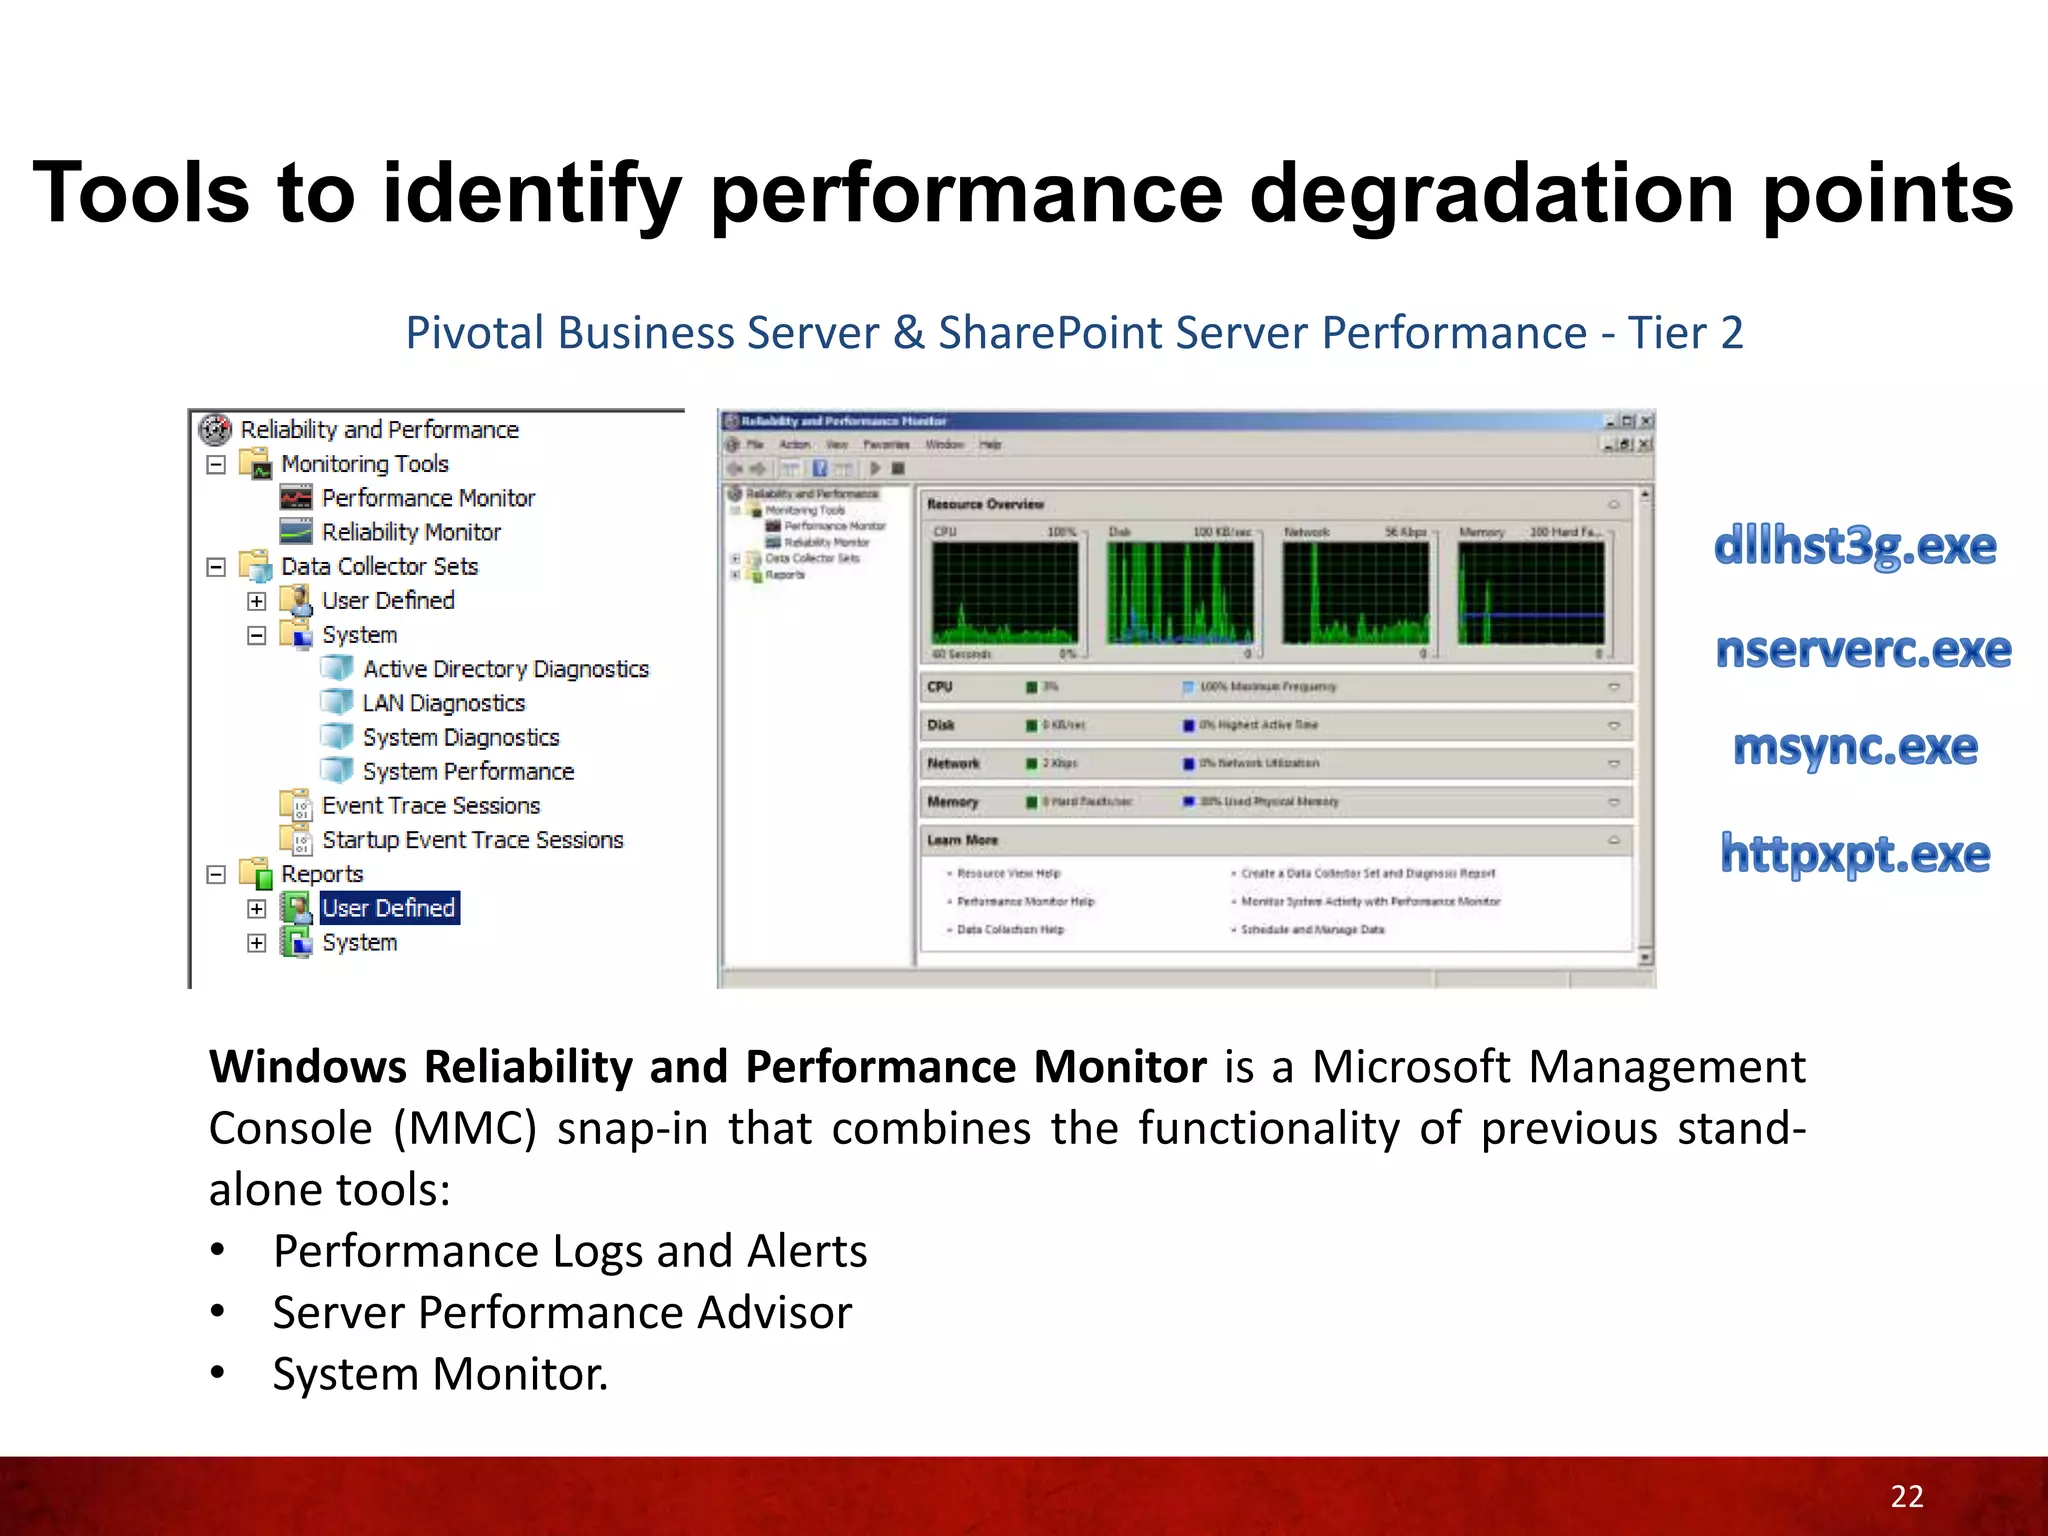
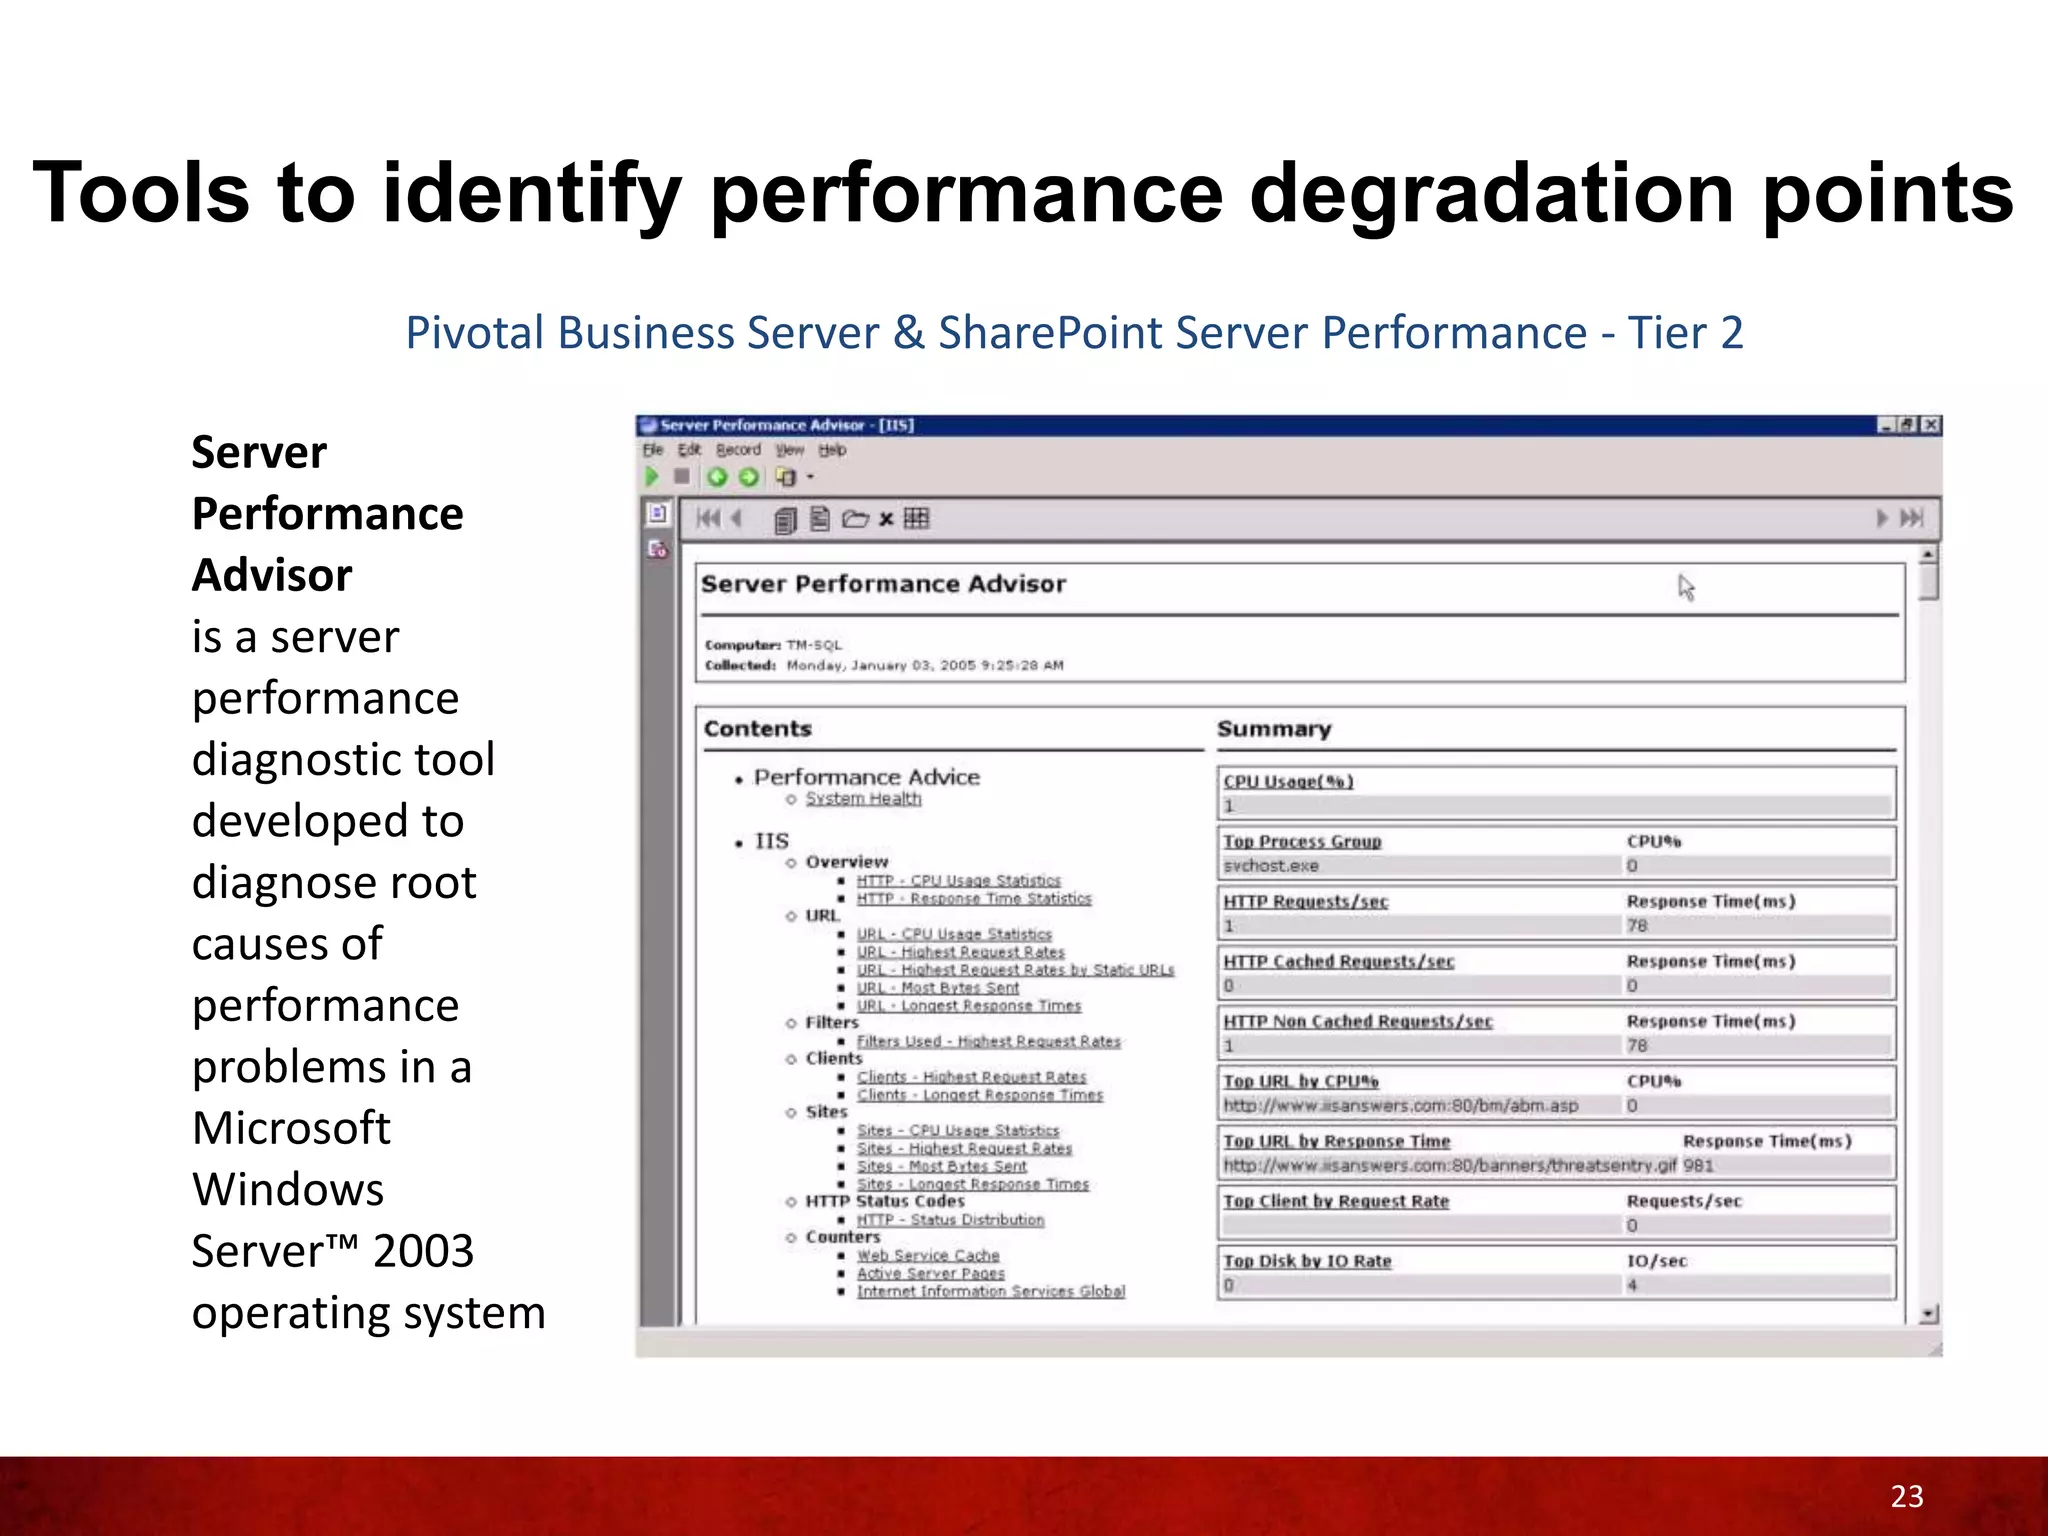
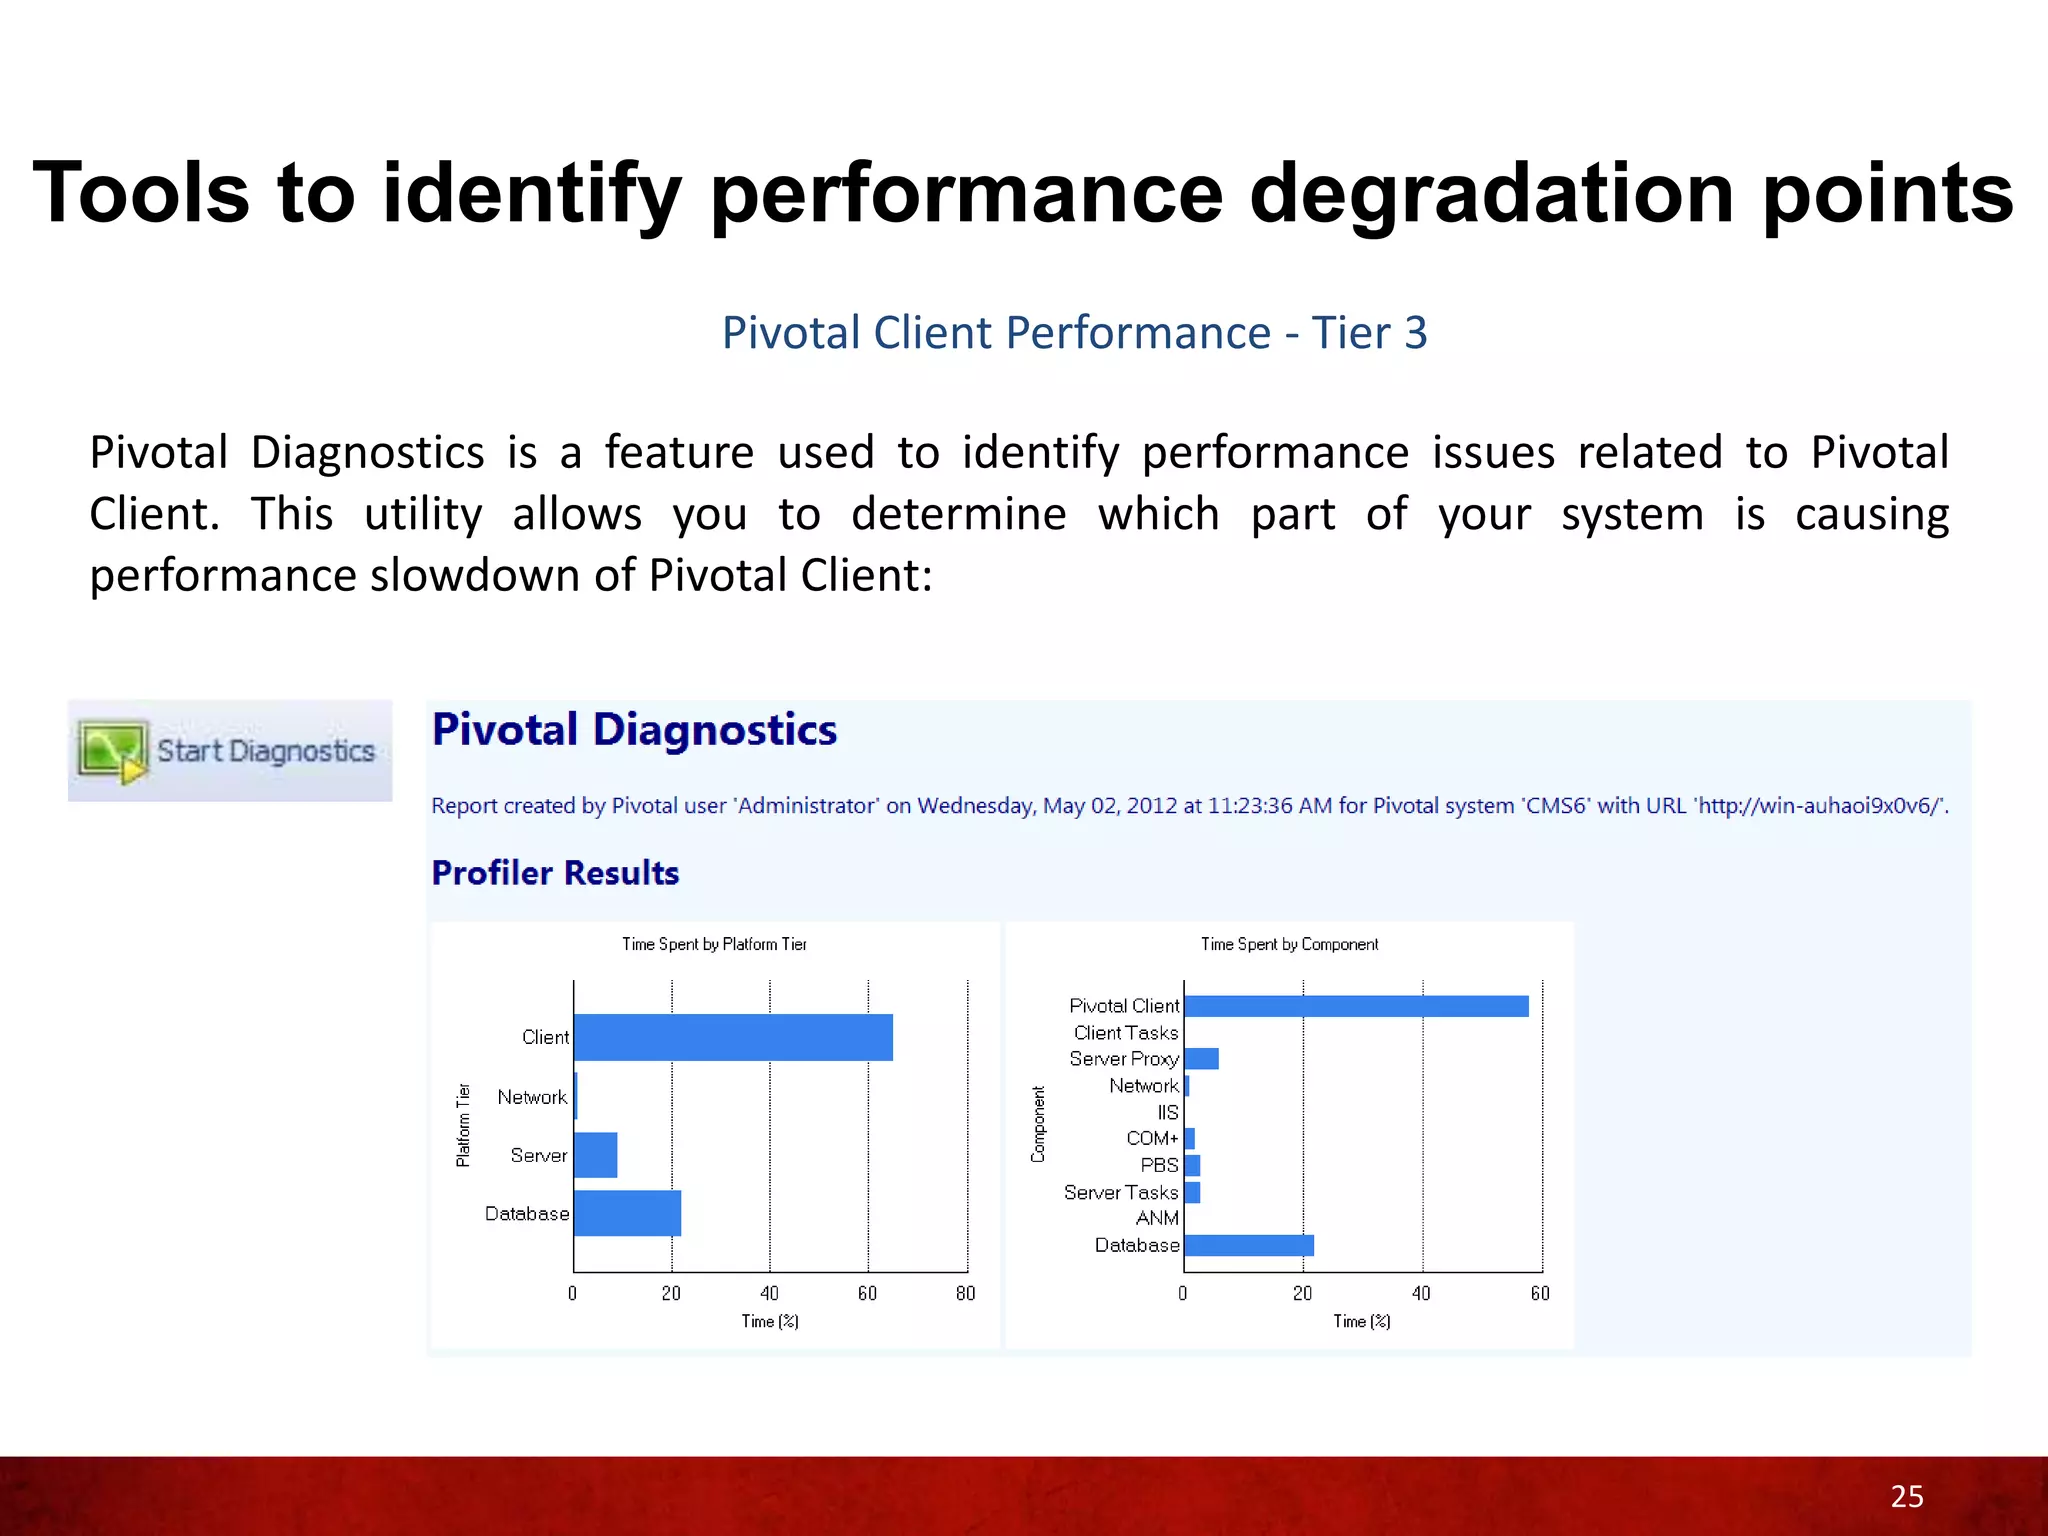
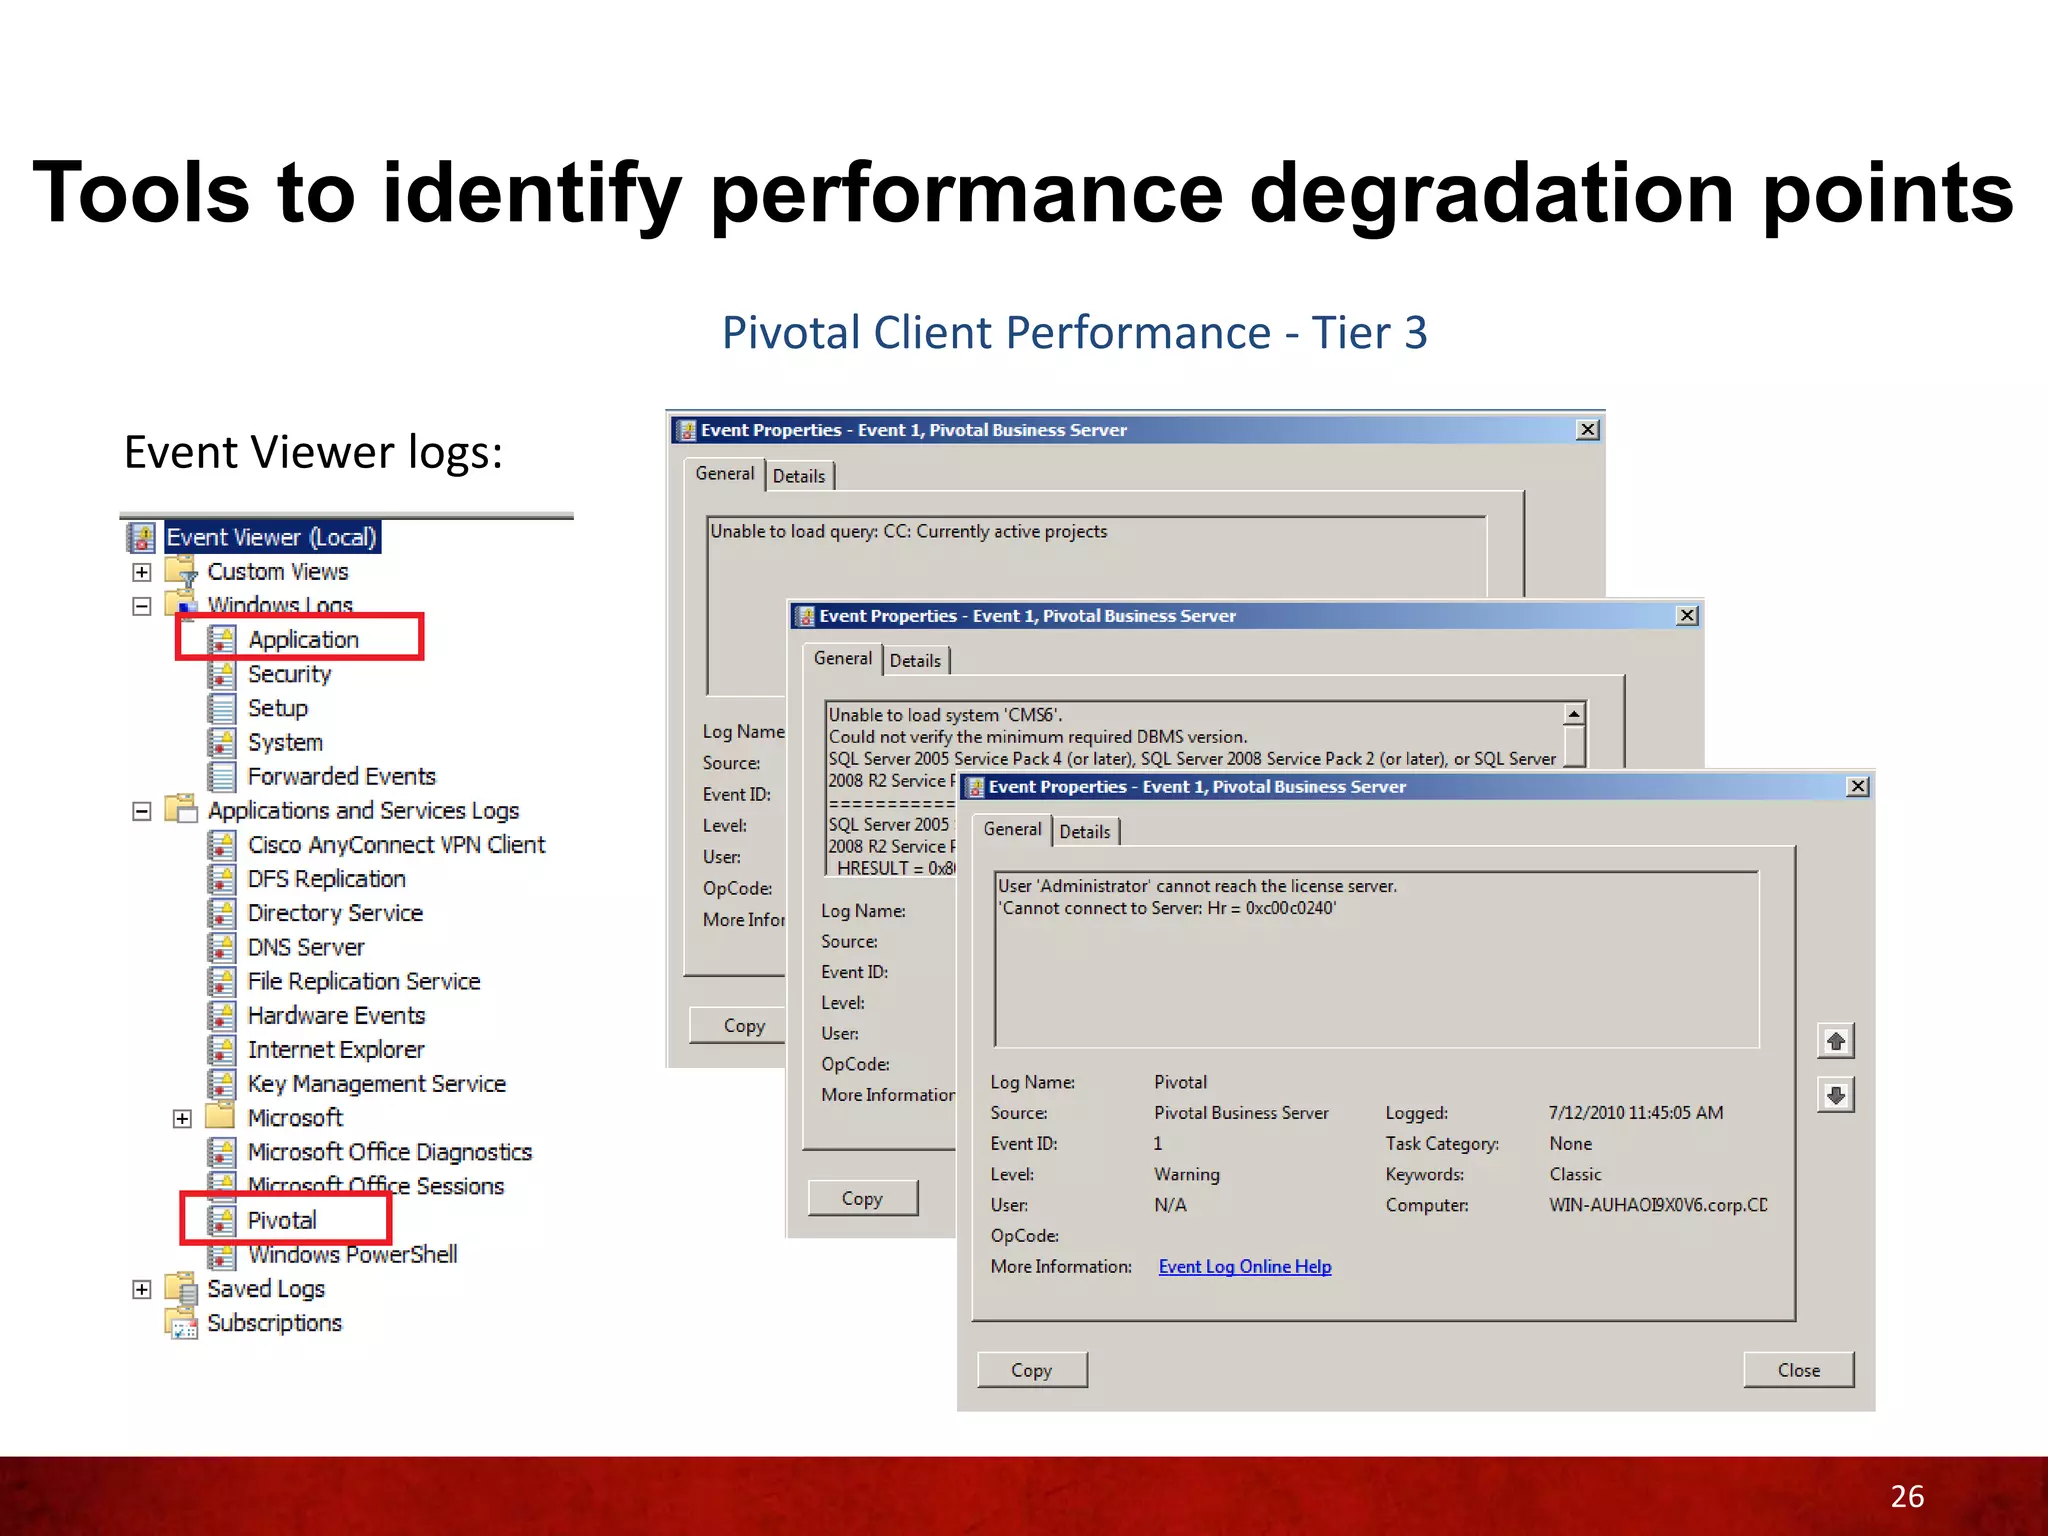
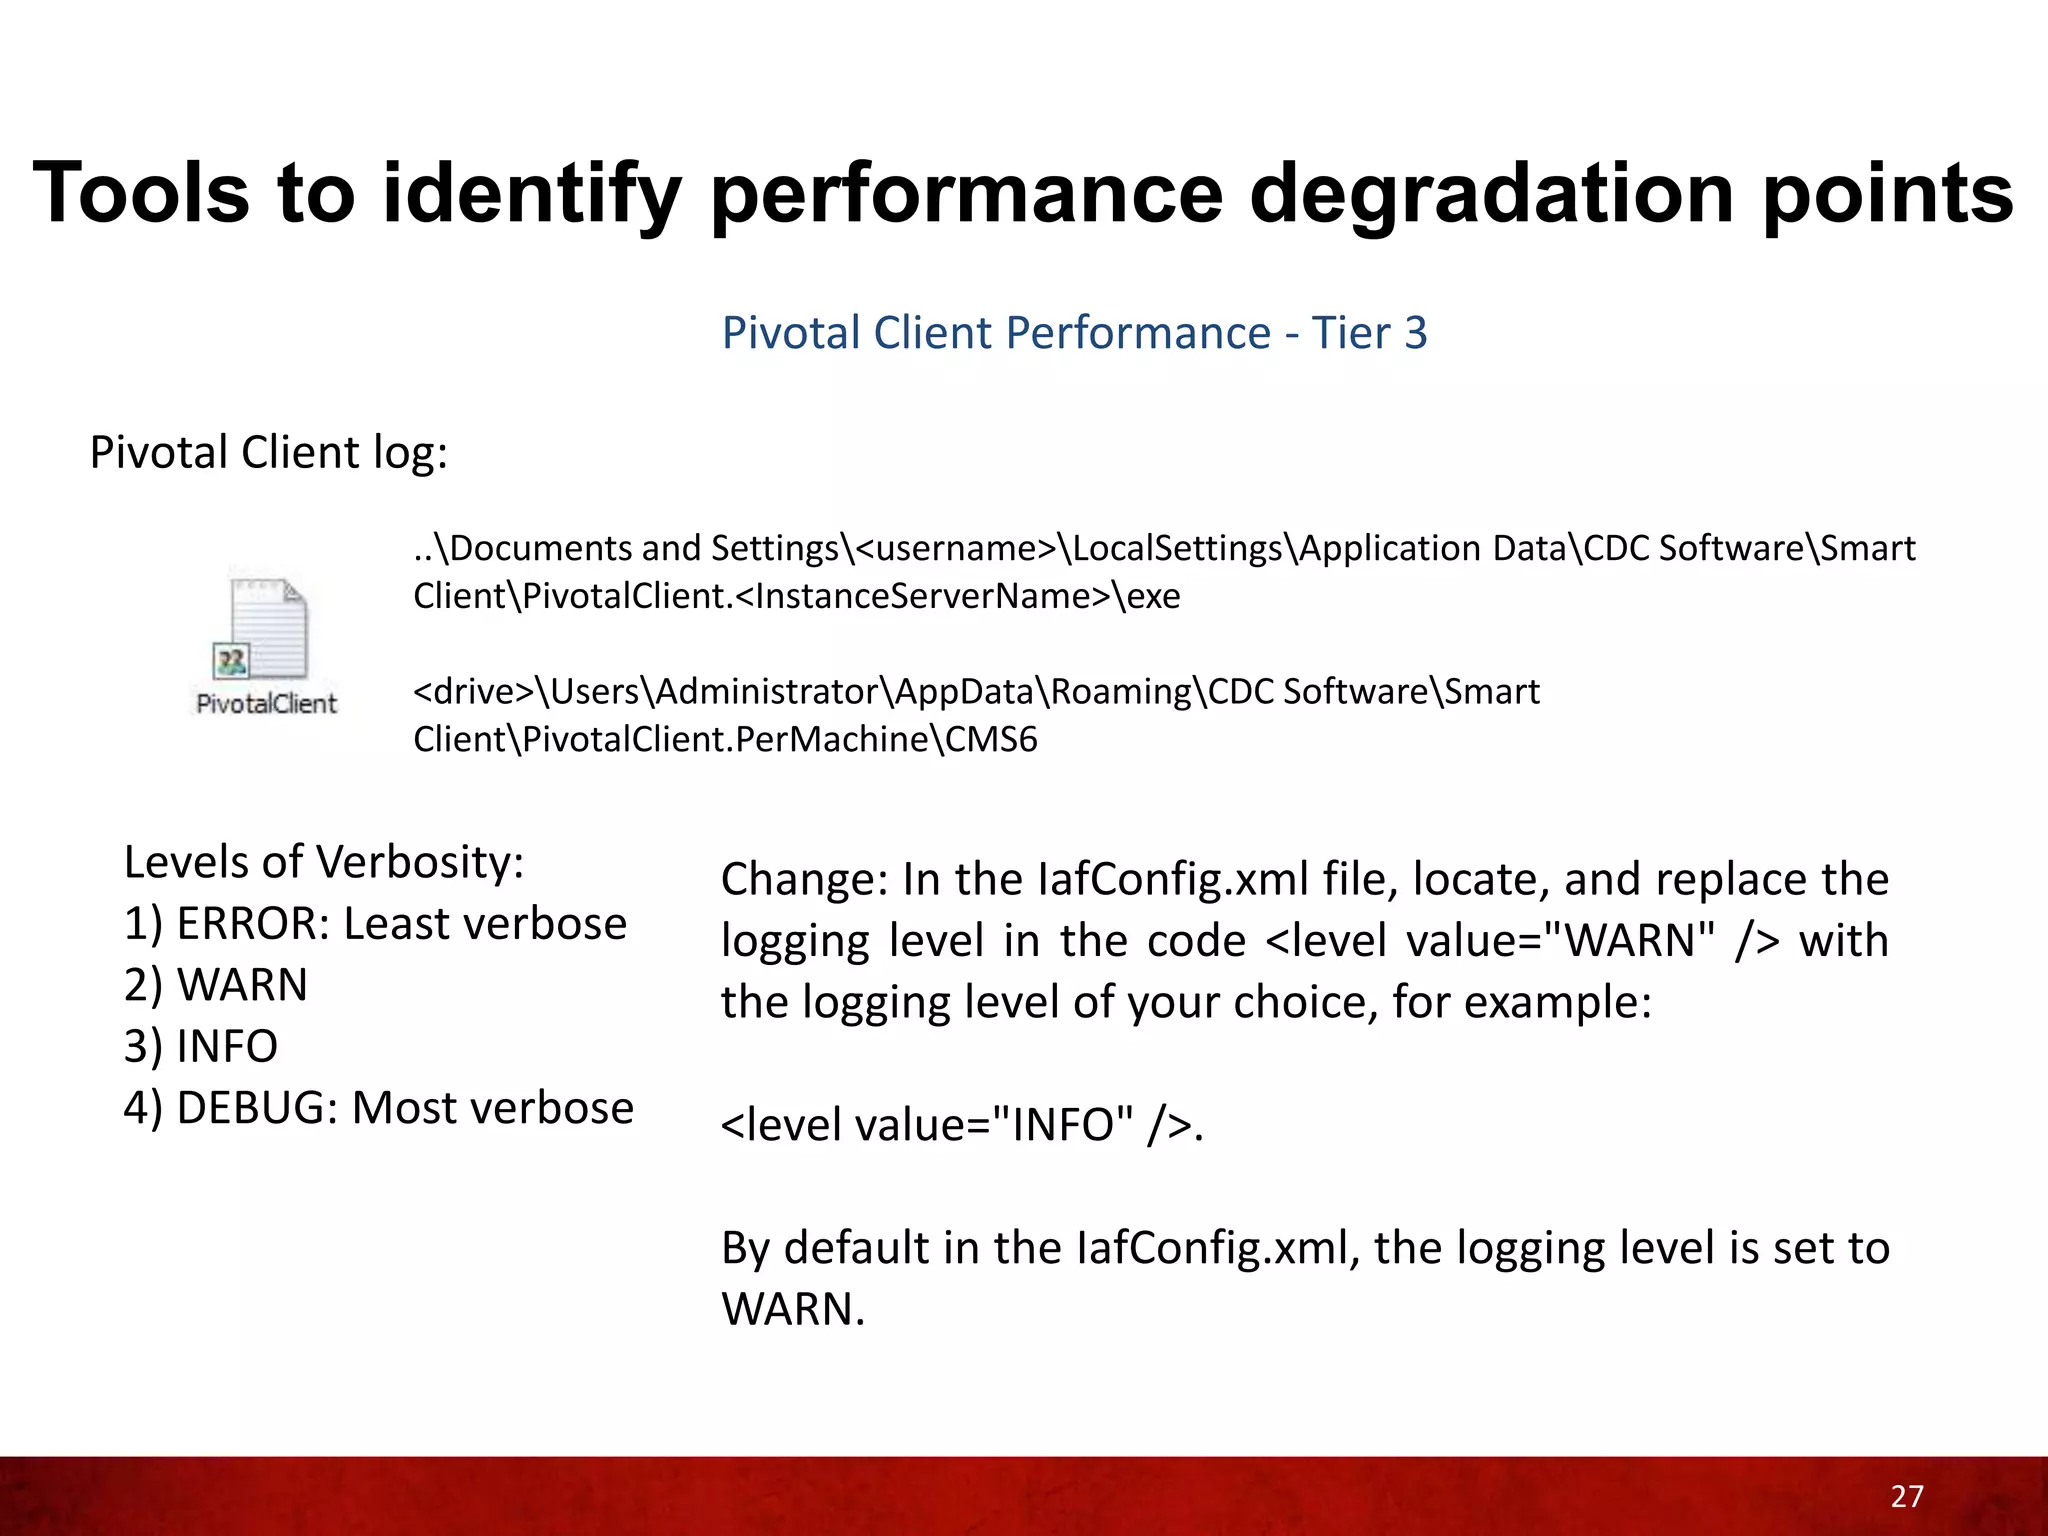
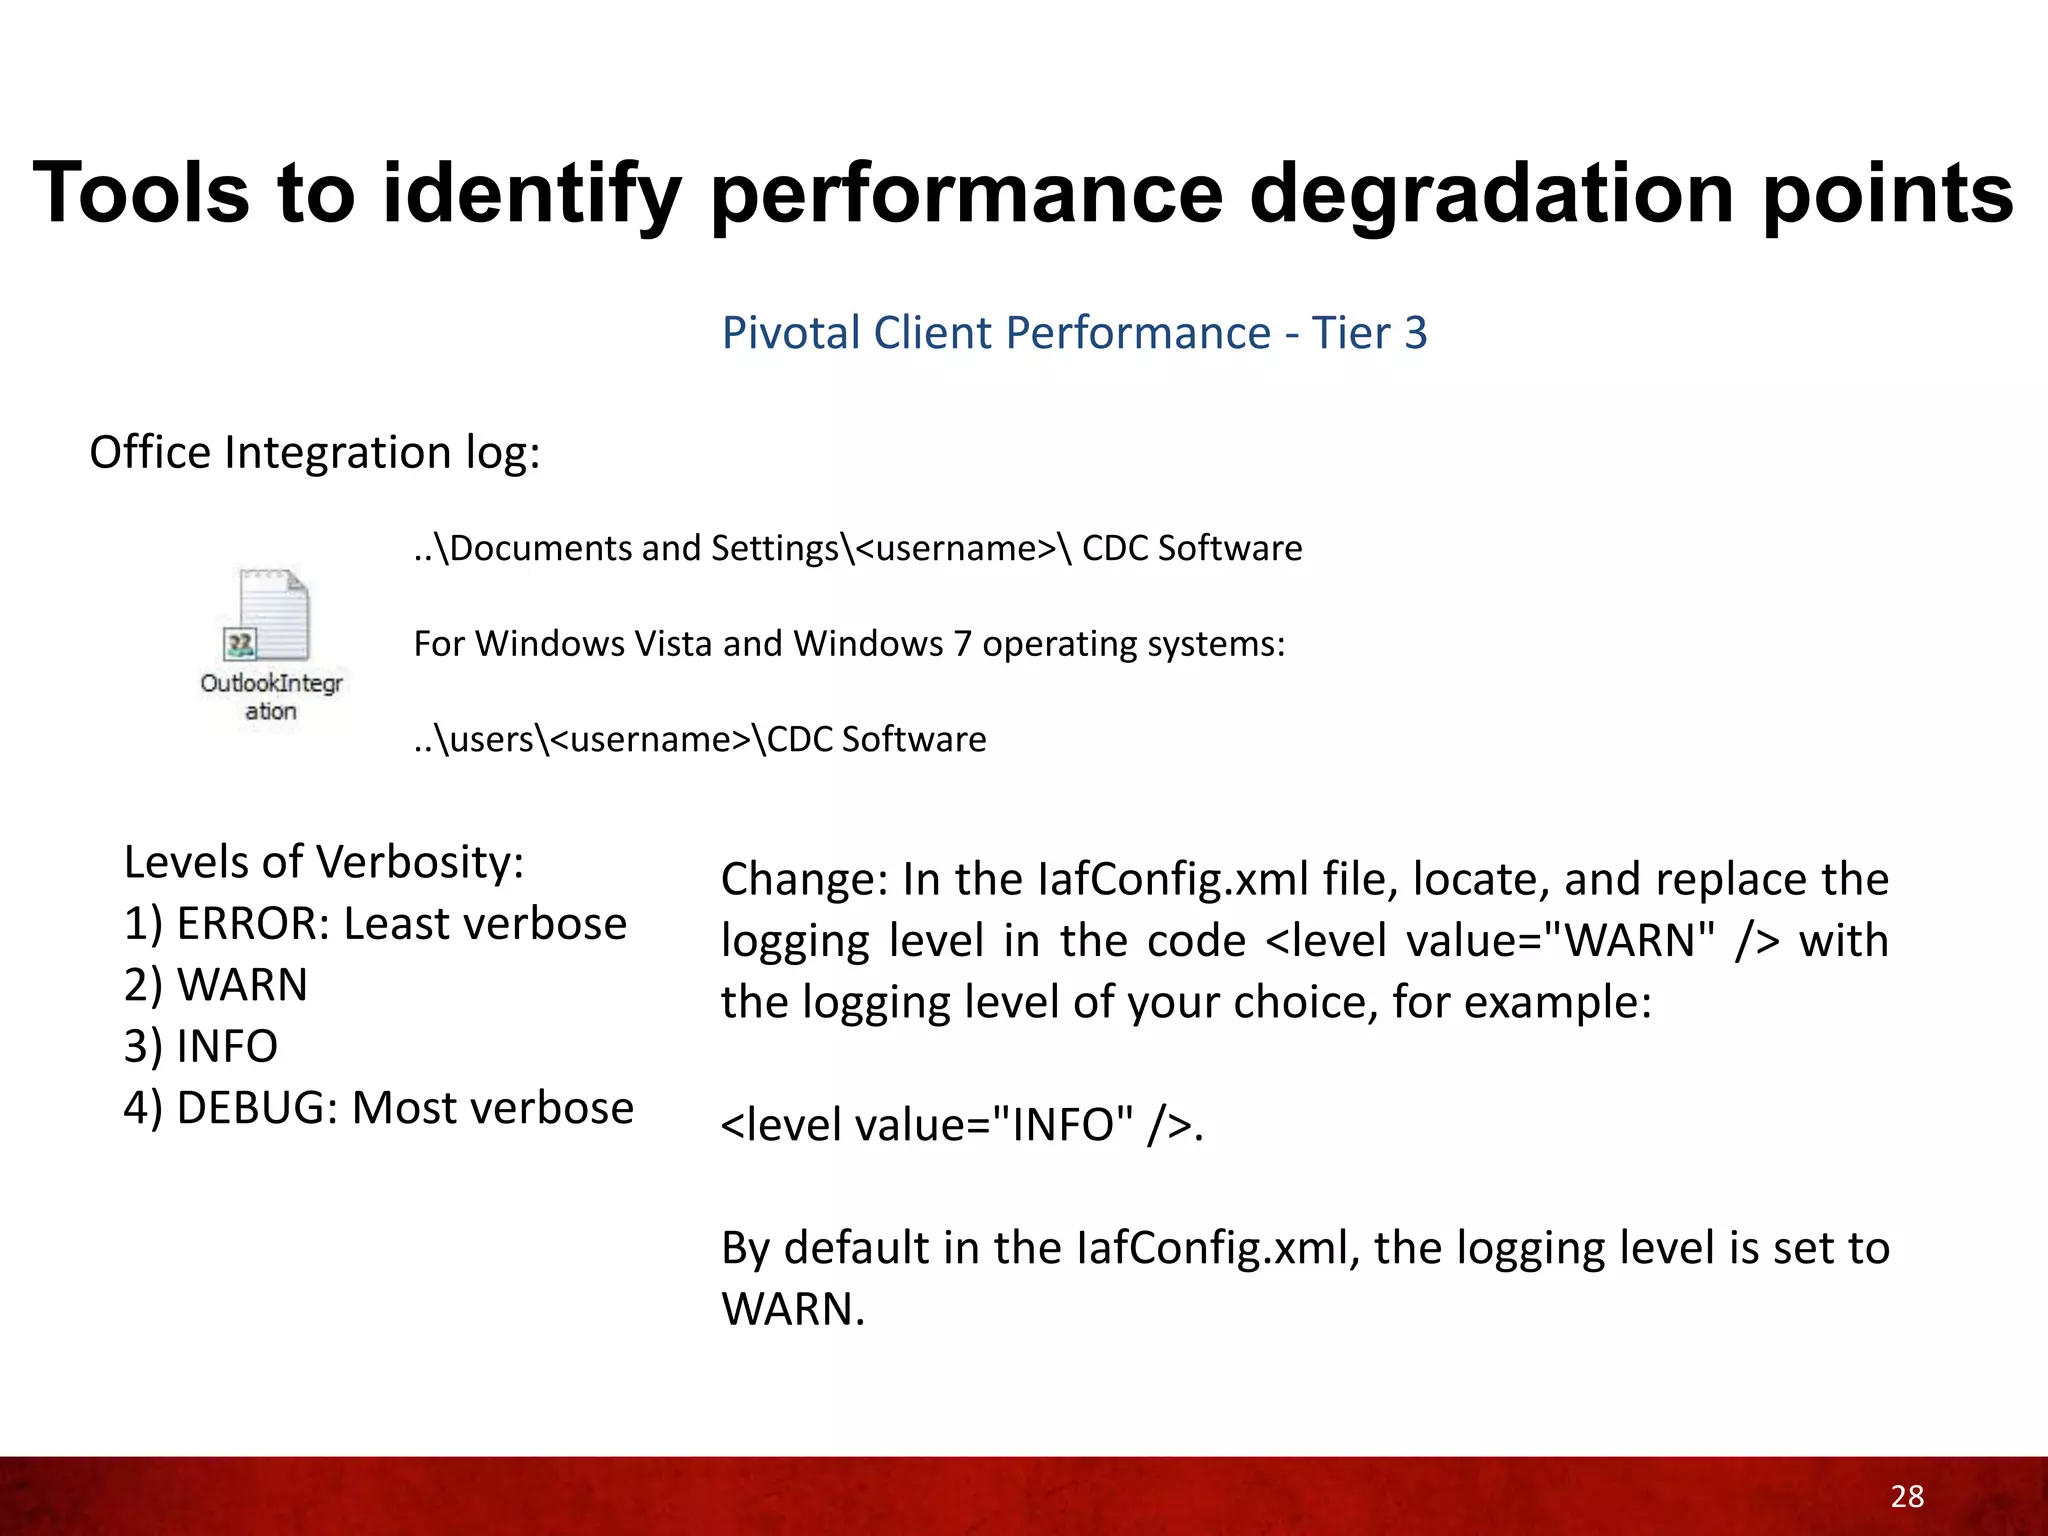
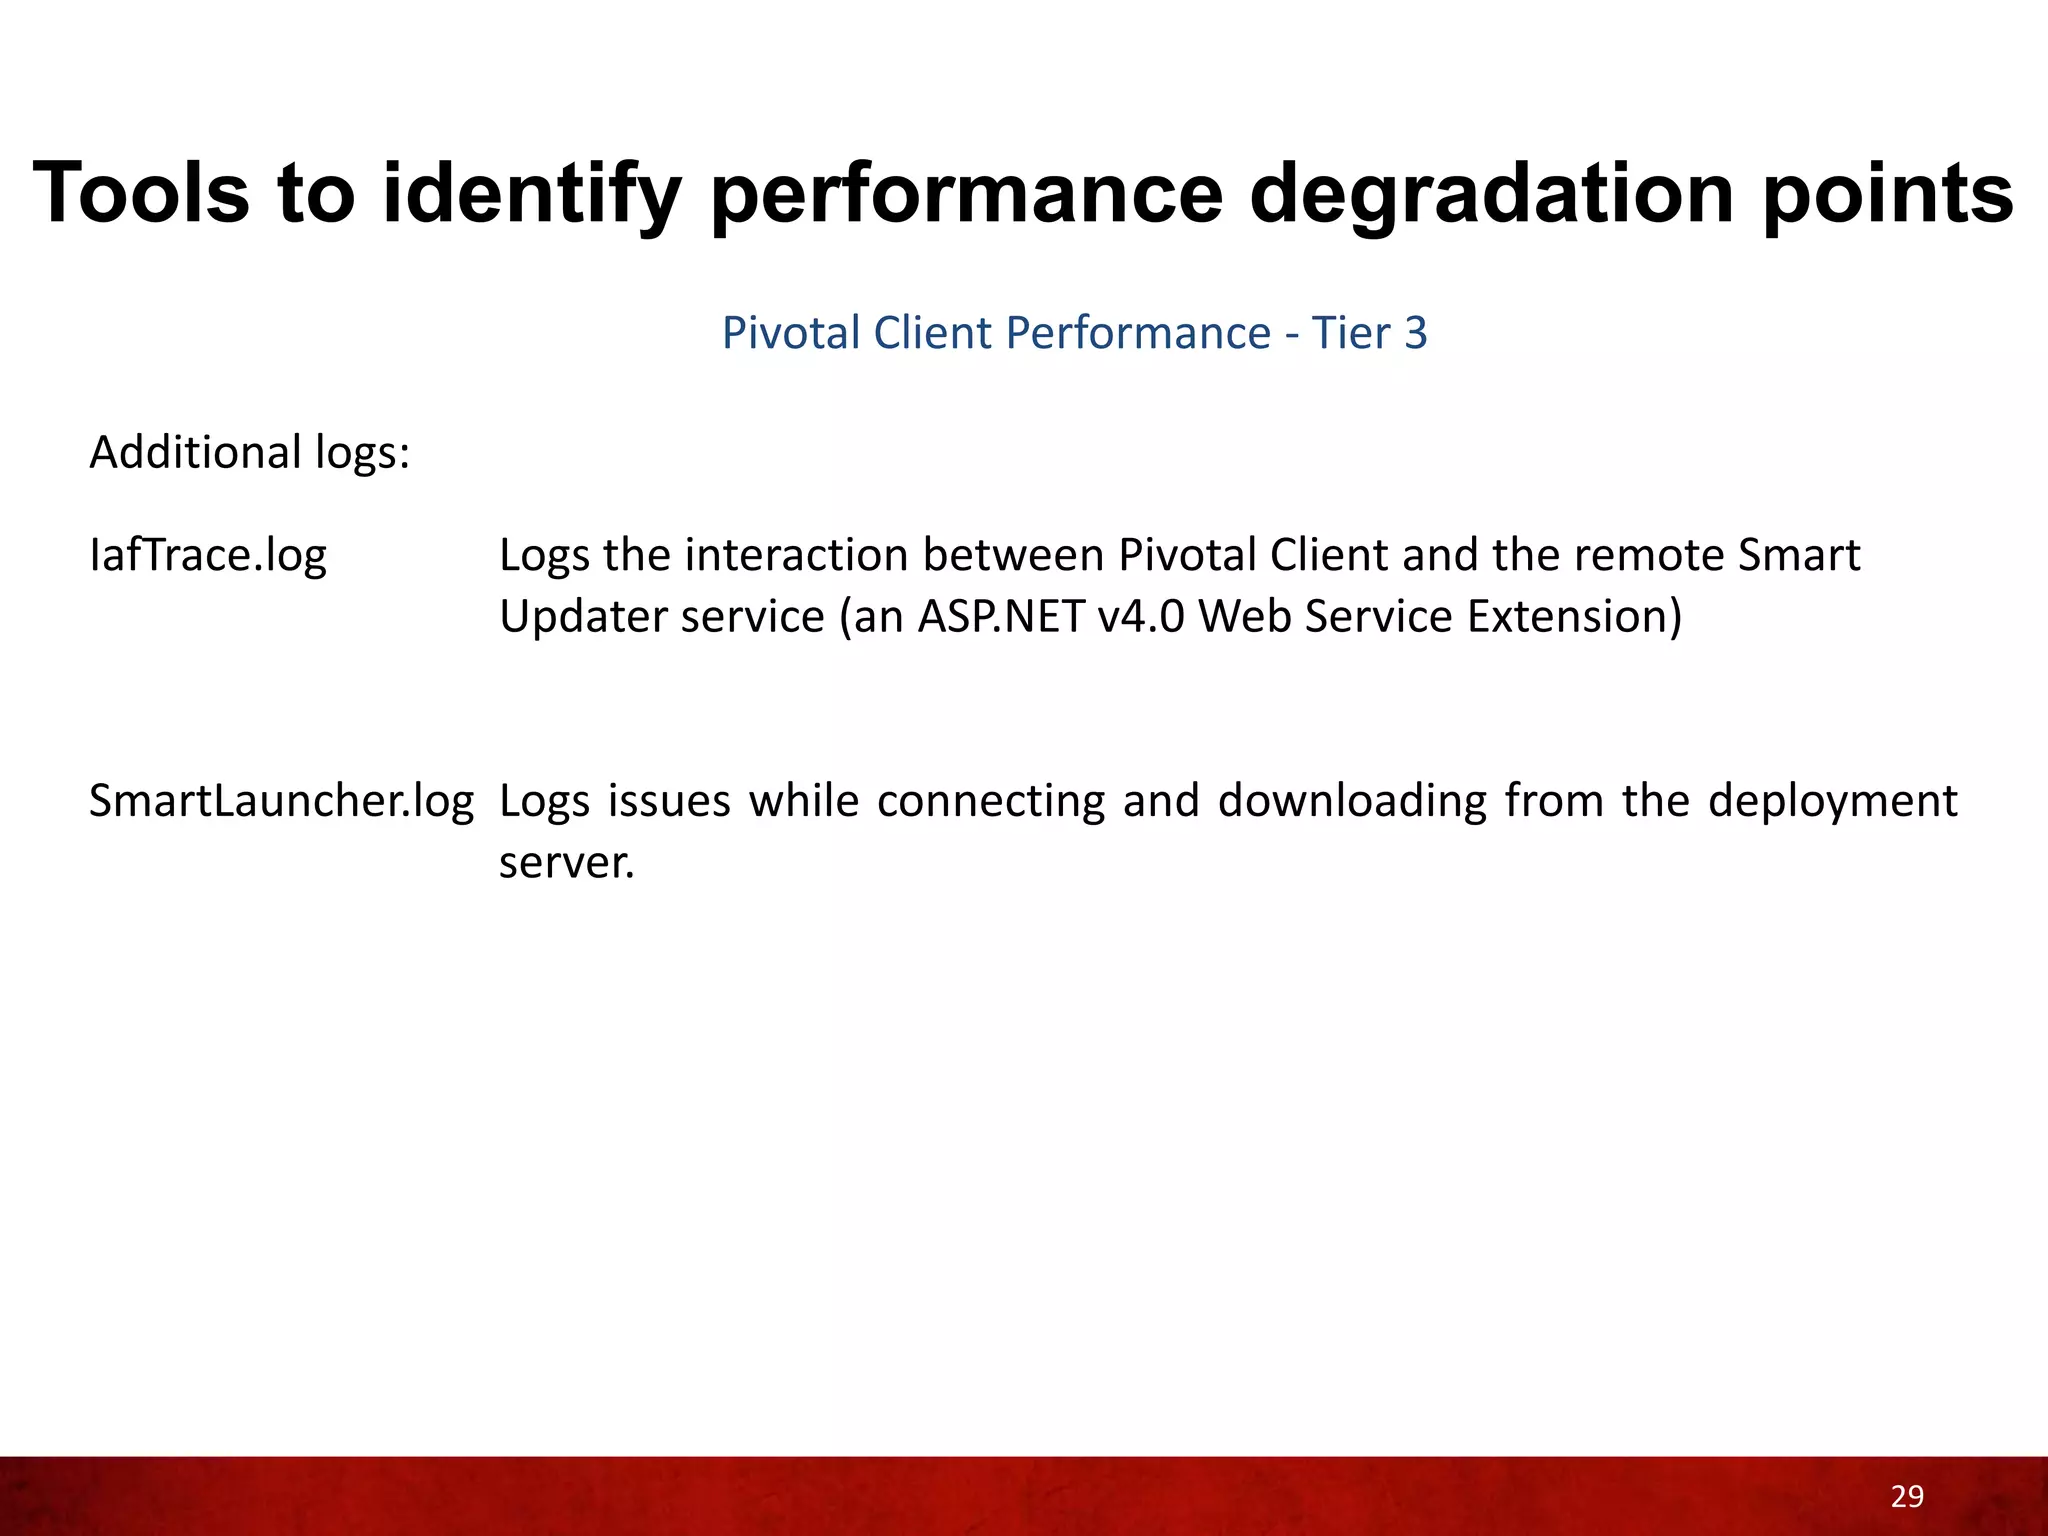
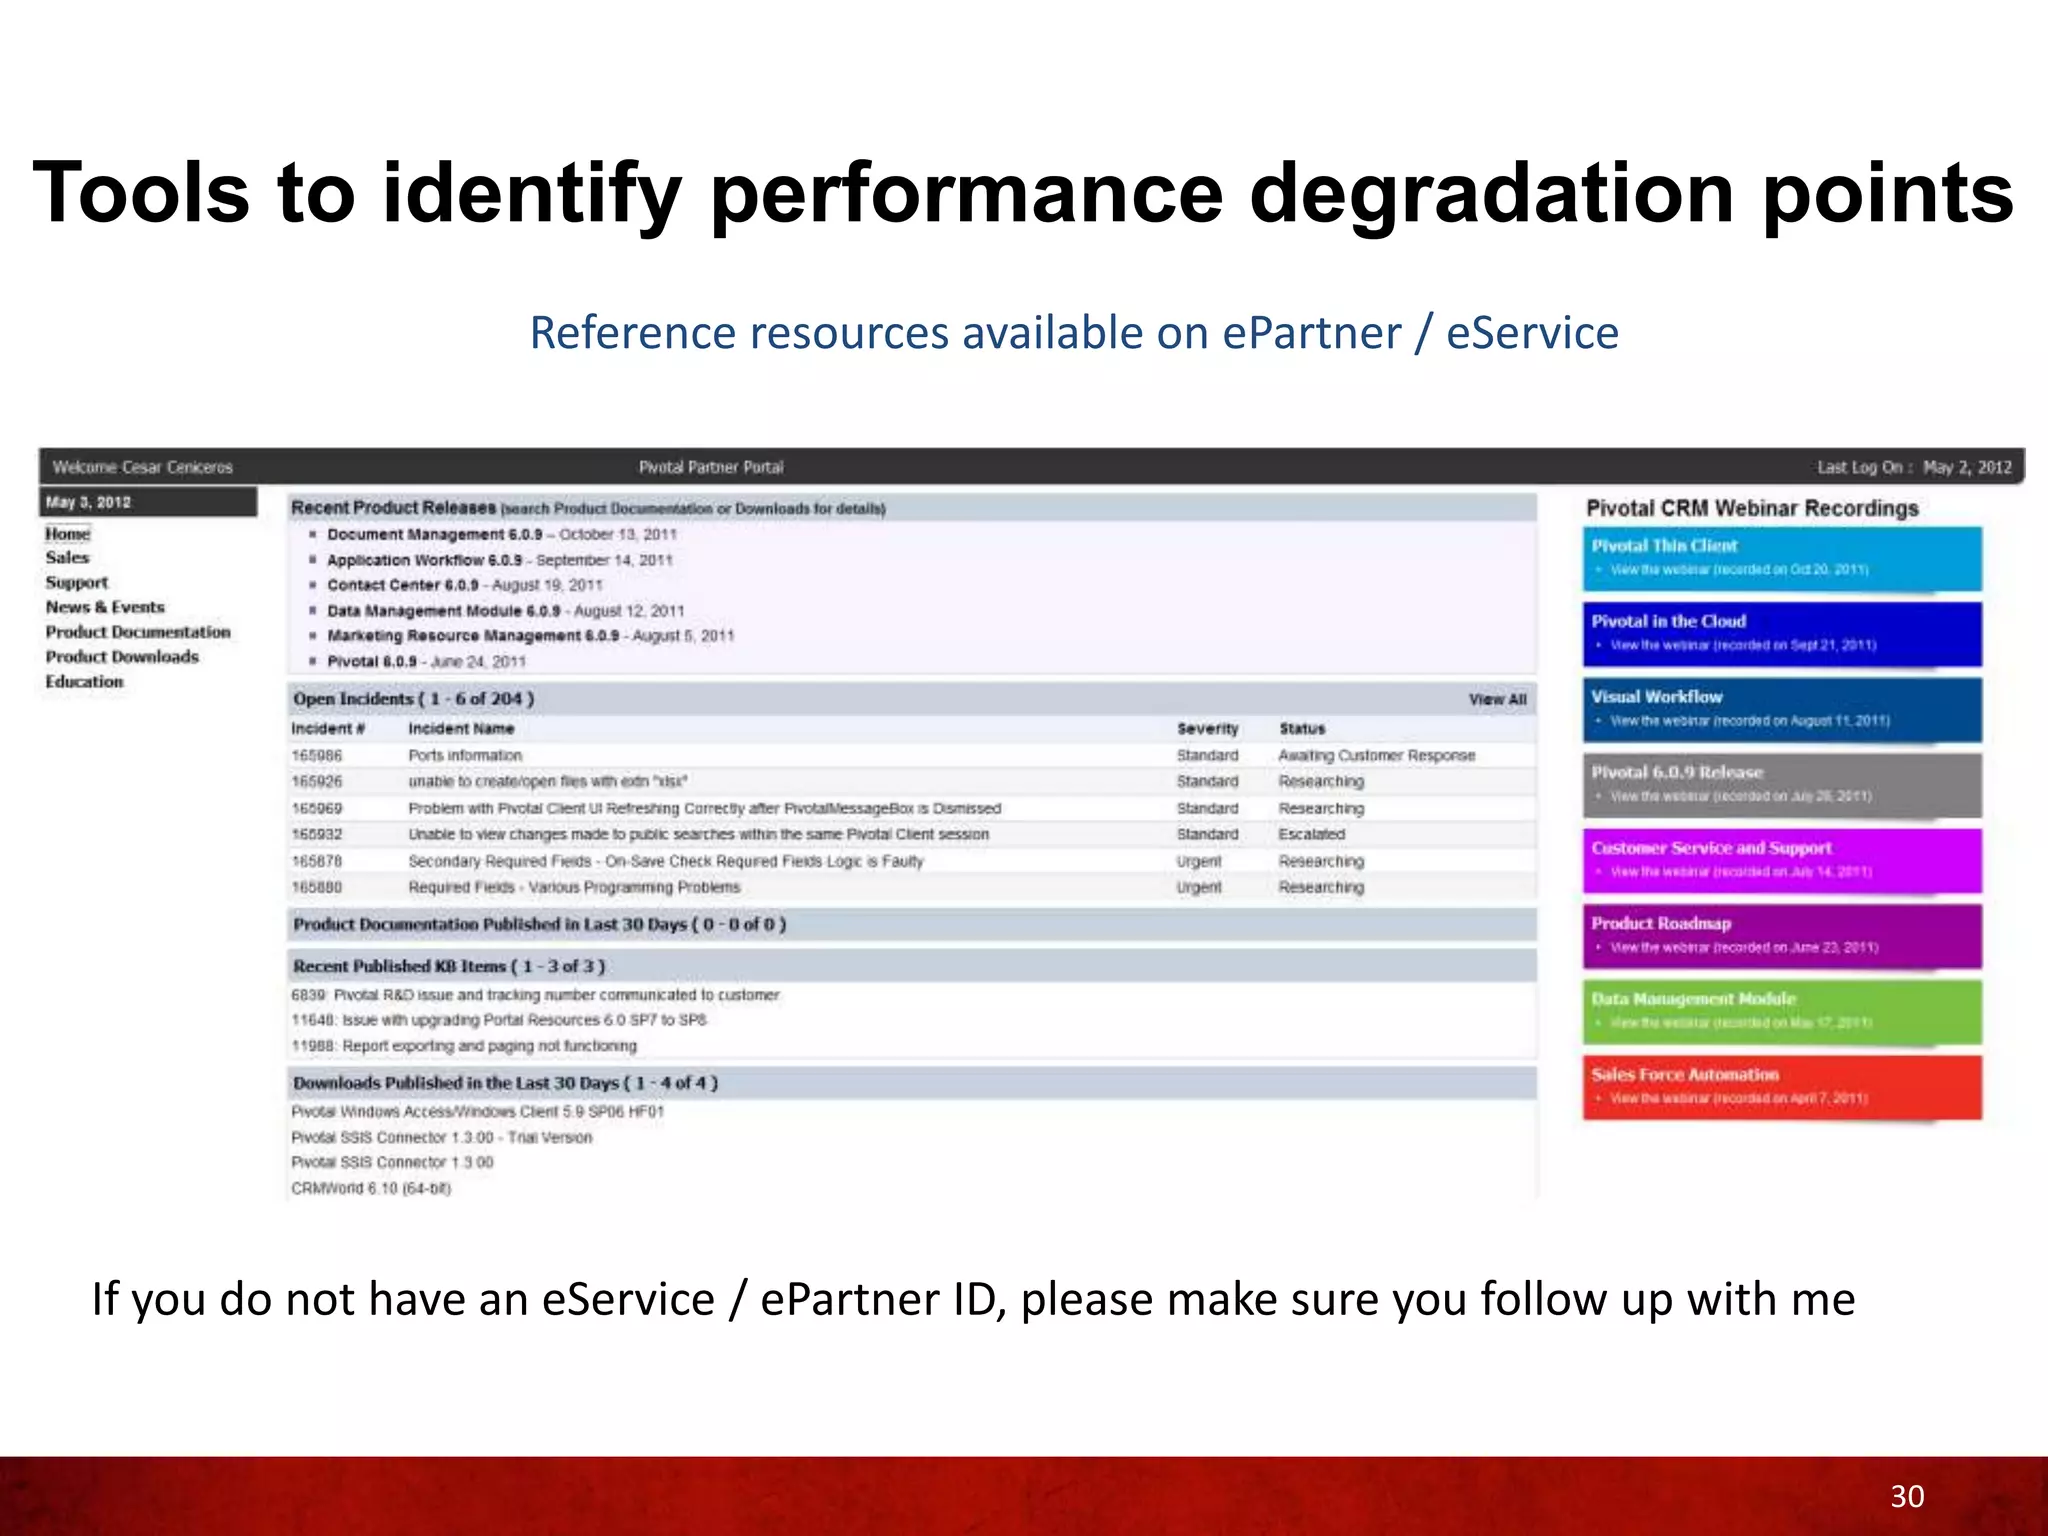
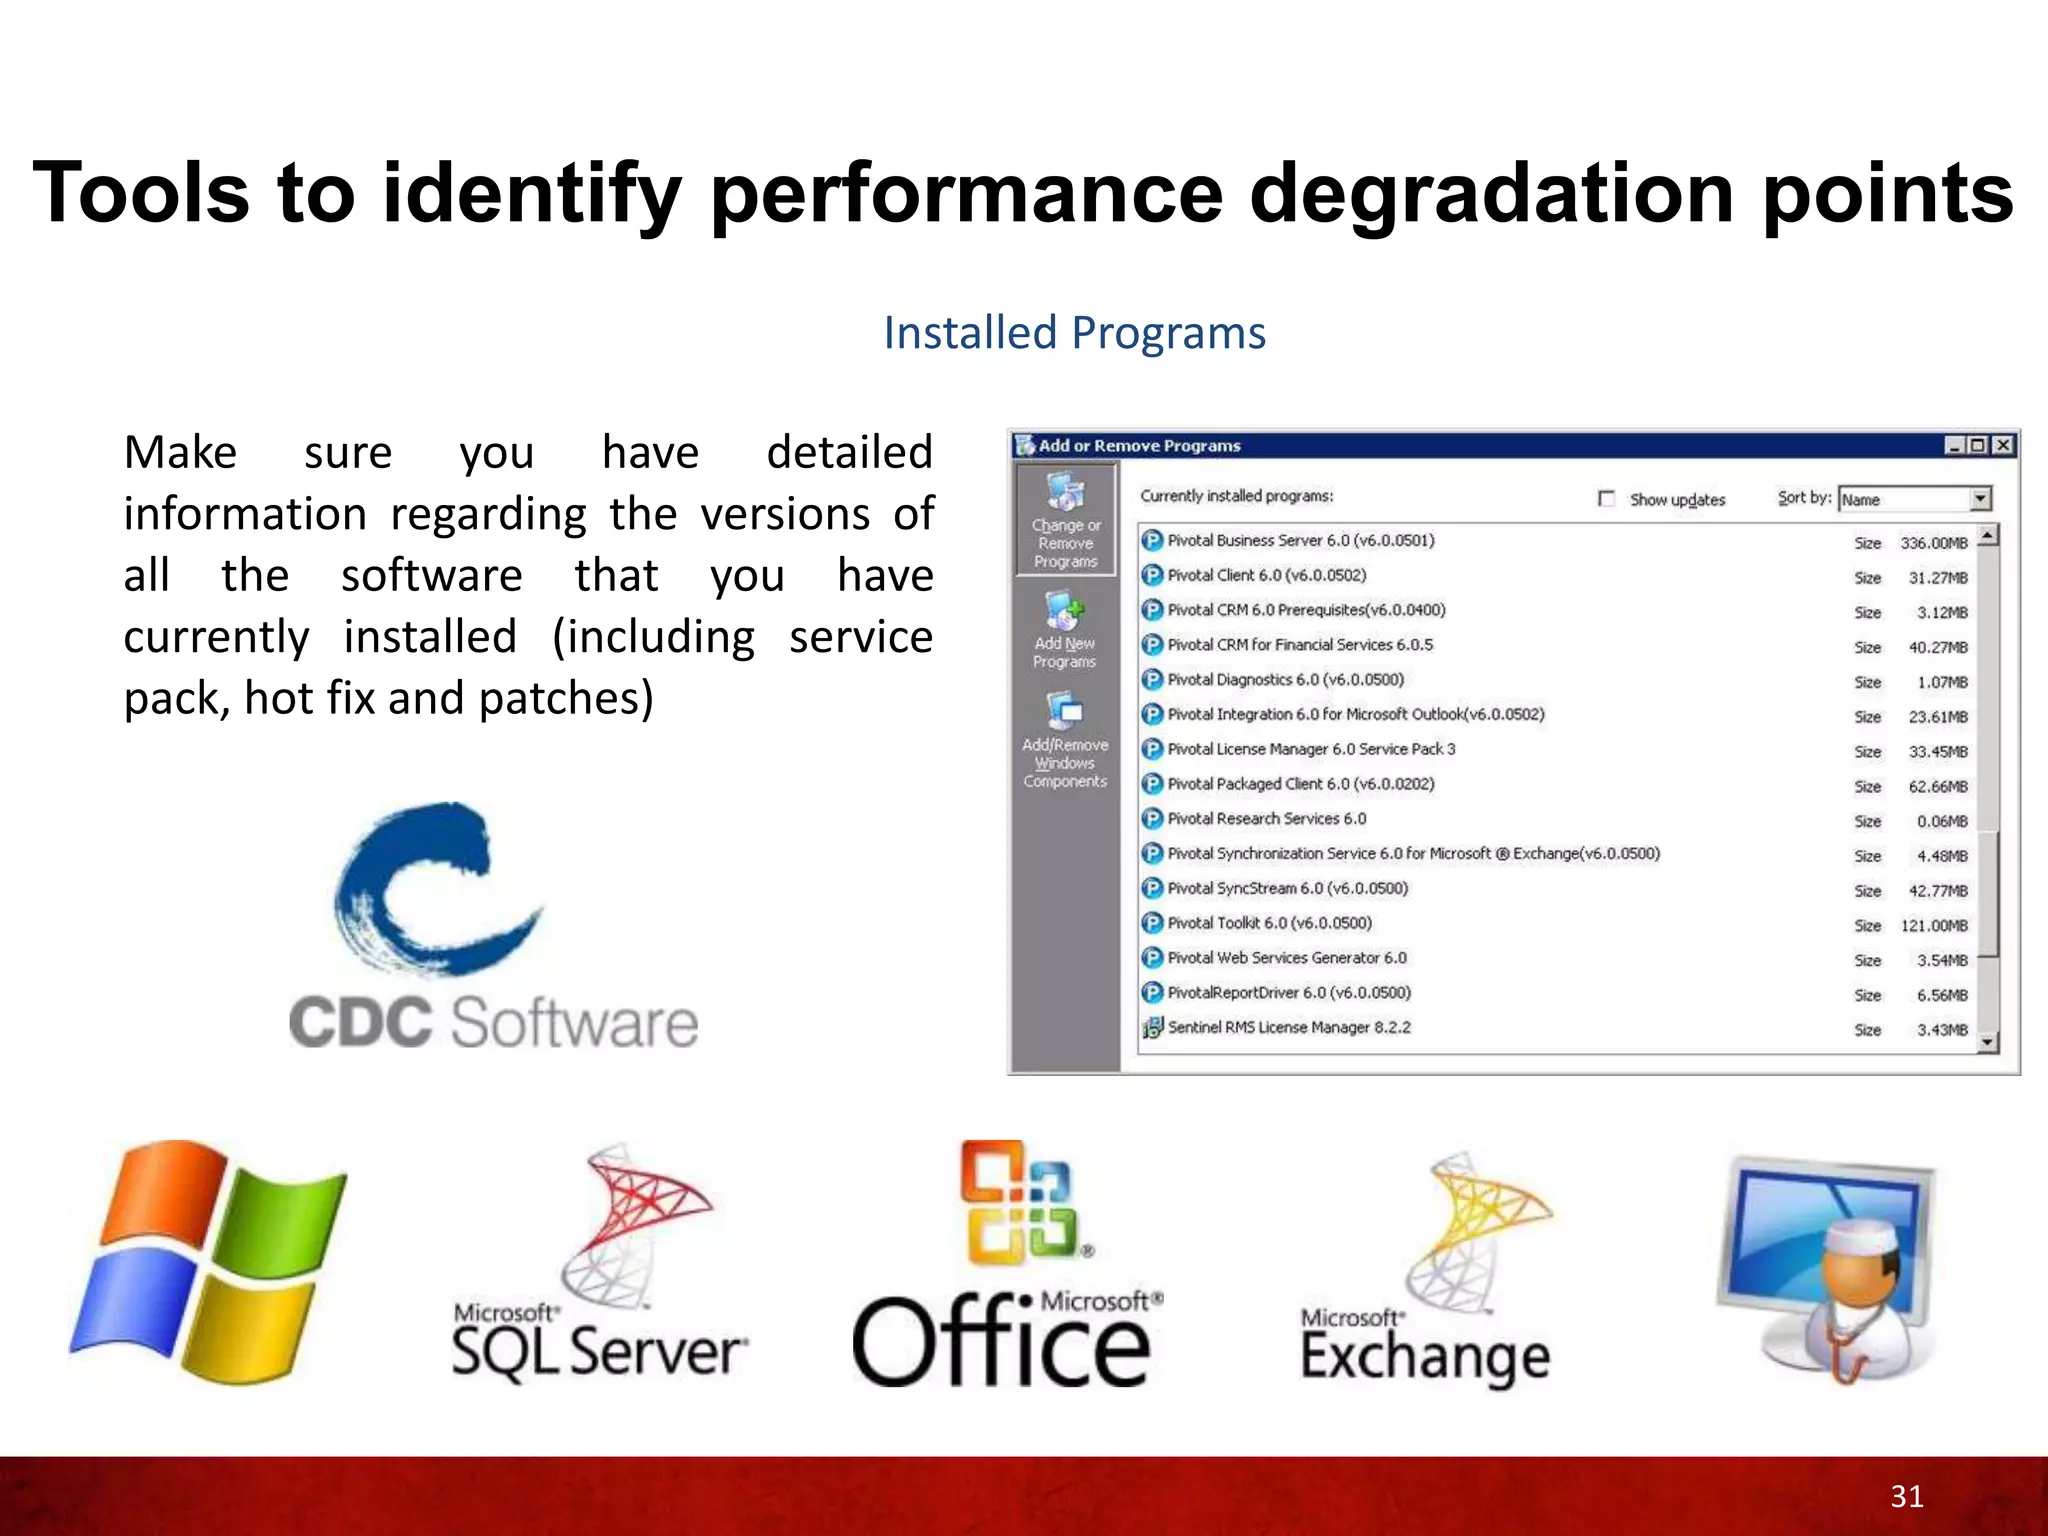
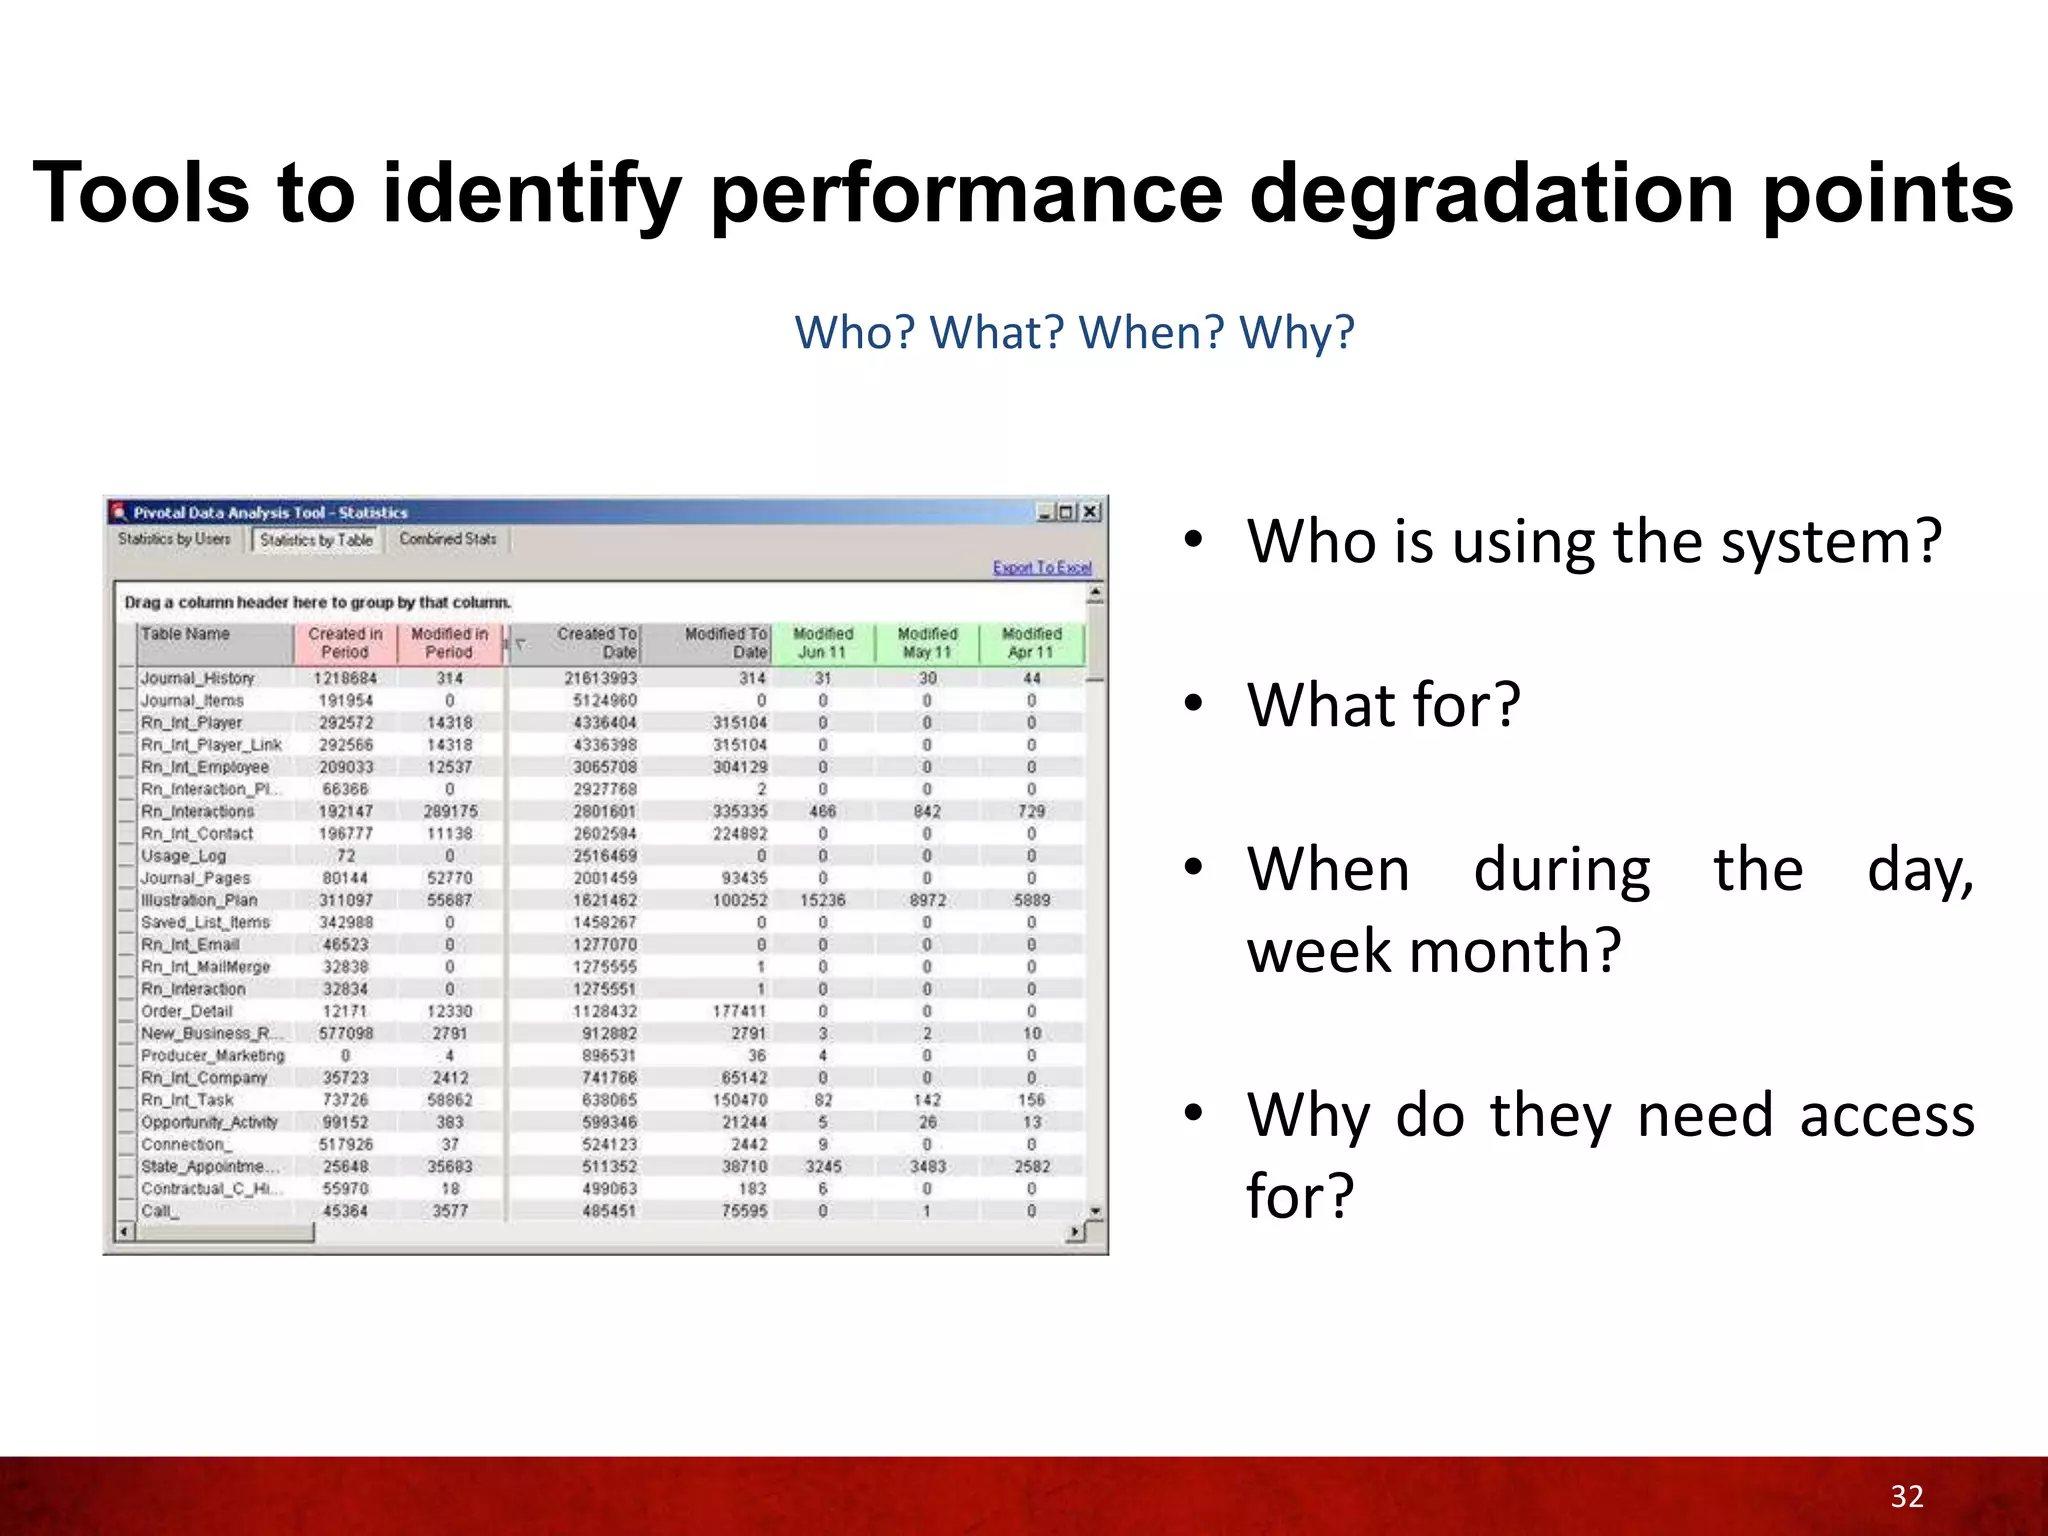
Pivotal CRM: Optimize your
Pivotal Implementation
Cesar Ceniceros
Manager, Technical Advisory & Education Services
Agenda
•   How do I achieve an optimal configuration?
     – What resources are needed
     – How do I know if my system is configured to support my existing users
     – What and where to look for performance bottle-necks

•   Tools to identify performance degradation points
     – Database Server Performance
     – Pivotal Business Server Performance
     – Pivotal Client Performance
     – Reviewing and identifying areas of improvement

•   Creating a baseline
     – How to assess changes needed
     – How to implement changes
     – Best practices for comparing results

•   Q&A Session

                                                                               2
How do I achieve an optimal
configuration?
How do I achieve optimal configuration?
                 What resources are needed

    Tier 1                   Tier 2                  Tier 3


                            Business
                             Server


             Integration                SyncStream
                Server                    Server

                           SharePoint
                             Server


                                                              4
How do I achieve optimal configuration?
             Typically two things are needed… number one

    Tier 1                       Tier 2                    Tier 3


                                Business
                                 Server


                 Integration                SyncStream
                    Server                    Server

                               SharePoint
                                 Server


                                                                    5
How do I achieve optimal configuration?
                       Number two

    System Design – Architecture & application
    Administration – Day to day operation
    Maintenance – Review logs periodically
    Troubleshooting – Research and be accountable
    Upgrading – Keep up to date


                                                    6
How do I achieve optimal configuration
               Examples of Best Practices


           System Design – Assign appropriate
           resources to your Pivotal CRM
           application like having dedicated
           servers with enough resources


 Administration – Do not cut
 corners when managing your
 Pivotal CRM environment.


                                                7
How do I achieve optimal configuration
                  Quiz # 1


                                    8
How do I achieve optimal configuration
                  Quiz # 1


                                    9
How do I achieve optimal configuration?
                   Examples of Best Practices


                Maintenance – Be proactive in reviewing
                your logs, do not wait until your users
                are complaining about performance
                issues

  Troubleshooting and Upgrading
  – Try to keep your environment
  error free and up to date


                                                    10
How do I know if my system is properly
configured to support my existing users?

        Most likely, you’ll know because your
        Pivotal Users will let you know when and
        if your system is performing slow


        Performance monitor tools can alert you
        when a Pivotal component is behaving
        sluggish


                                                   11
What and where to look for
performance bottle-necks

 Pivotal logs should be the first place
 where to look when troubleshooting
 non-optimal performance


 Event Viewer log can also contain very
 useful information related to overall
 performance, not just from the Pivotal
 side but also from the OS perspective


                                          12
Tools to identify performance
degradation points
Tools to identify performance degradation points
                 Which resources are needed?

     Tier 1


                                               14
Tools to identify performance degradation points
                              Database Server Performance - Tier 1

                               Database File Structure (.mdf & .ldf)

                               •   The reason the data file and log file are typically
                                   recommended to be on separate drives is that when
                                   you’re doing inserts/updates/deletes both have to write
                                   at the exact same time

 So when is it appropriate to put the data and log files on the same drive, and use the
 leftover drive for something else?

 •   When the database is rarely updated

 •   When one drive is dramatically faster than the other drive

 •   When your application extensively uses the TempDB more than anything else

 •   When the application does heavier disk activity than your SQL Server (same server)


                                                                                          15
Tools to identify performance degradation points
                                                        Database Server Performance - Tier 1
                Setting           Min value     Max Value    Setting    Running Value
 Ad Hoc Distributed Queries
 affinity64 I/O mask
                                            0
                                  -2147483648
                                                         1
                                                2147483647
                                                                    1
                                                                    0
                                                                                   1
                                                                                   0
                                                                                        sp_configure: Displays or changes
 affinity64 mask
 Agent XPs
                                  -2147483648
                                            0
                                                2147483647
                                                         1
                                                                    0
                                                                    1
                                                                                   0
                                                                                   1
                                                                                        global configuration settings for the
 awe enabled
 blocked process threshold
                                            0
                                            0
                                                         1
                                                     86400
                                                                    0
                                                                    0
                                                                                   0
                                                                                   0    current server
 cost threshold for parallelism             0        32767          5              5
 cross db ownership chaining                0            1          0              0
 cursor threshold                          -1   2147483647         -1             -1
 Database Mail XPs
 default full-text language
                                            0
                                            0
                                                         1
                                                2147483647
                                                                    1
                                                                 1033
                                                                                   1
                                                                                1033    This information will allow you to ensure
                                                                                        your SQL Server configuration is in line
 default language                           0         9999          0              0
 default trace enabled                      0            1          1              1
 fill factor (%)                            0          100          0              0
 ft crawl bandwidth (max)
 ft crawl bandwidth (min)
                                            0
                                            0
                                                     32767
                                                     32767
                                                                  100
                                                                    0
                                                                                 100
                                                                                   0
                                                                                        with your business needs and
 ft notify bandwidth (max)
 ft notify bandwidth (min)
                                            0
                                            0
                                                     32767
                                                     32767
                                                                  100
                                                                    0
                                                                                 100
                                                                                   0
                                                                                        requirements.
 index create memory (KB)                 704   2147483647          0              0
 in-doubt xact resolution                   0            2          0              0
 locks                                   5000   2147483647          0              0
 max degree of parallelism
 max full-text crawl range
                                            0
                                            0
                                                        64
                                                       256
                                                                    0
                                                                    4
                                                                                   0
                                                                                   4
                                                                                        • AWE enabled
 max server memory (MB)                    16   2147483647      38912          38912
 max text repl size (B)
 max worker threads
                                            0
                                          128
                                                2147483647
                                                     32767
                                                                65536
                                                                    0
                                                                               65536
                                                                                   0
                                                                                        • Max Server Memory
 media retention
 min memory per query (KB)
                                            0
                                          512
                                                       365
                                                2147483647
                                                                    0
                                                                 1024
                                                                                   0
                                                                                1024    • Etc.
 min server memory (MB)                     0   2147483647        128            128
 nested triggers                            0            1          1              1
 network packet size (B)                  512        32767       4096           4096


                                                                                                                             16
Tools to identify performance degradation points
                             Database Server Performance - Tier 1

                              SQL Traces

                              •   SQL Trace is a performance tuning tool, which can be
                                  used to fine tune your Pivotal application. It traces the
                                  time taken to fetch the data from the database thus
                                  having a better understanding on how to reduce the
                                  time
 The data contained on a SQL trace will help you analyze and possibly identify any long
 running query, non-optimize searches and even deadlocks within your Pivotal application
 caused by

 •   Non-optimized code

 •   Improper indexing (over-indexing /under-indexing)

 •   Unnecessary trips to the SQL Server

 •   Lack of server resources and other server issues (hardware)

                                                                                          17
Tools to identify performance degradation points
                              Database Server Performance - Tier 1

                                  Database Engine Tuning Advisor

            Database Engine       Helps you select and create an optimal set of indexes,
                                  indexed views, and partitions without requiring an expert
             Tuning Advisor
                                  understanding of the structure of the database or the
                                  internals of Microsoft SQL Server

 With this tool you can perform the following optimization tasks:

 •   Recommend the best mix of indexes for databases by using the query optimizer to
     analyze queries in a workload

 •   Analyze the effects of the proposed changes, including index usage, query distribution
     among tables, and query performance in the workload

 •   Recommend ways to tune the database for a small set of problem queries

 •   Etc.

                                                                                          18
Tools to identify performance degradation points
               Database Server Performance - Tier 1
                                        User data can adversely impact
                                        performance depending on various
                                        factors, in order to optimize a
                                        Pivotal environment it is important to
                                        understand the impact that your
                                        data is having on the system.


                                                                          19
Tools to identify performance degradation points
                   What resources are needed

                               Tier 2


                              Business
                               Server


               Integration                SyncStream
                  Server                    Server

                             SharePoint
                               Server


                                                       20
Tools to identify performance degradation points
         Pivotal Business Server & SharePoint Server Performance - Tier 2

                              System information (msinfo32.exe).- Displays a
                              comprehensive view of your hardware, system
                              components, and software environment.
                              With this tool you will be able to get a first look at all
                              the resources allocated to your servers. Be aware of
                              VM environments, for these type of environments
                              the resources allocated can be shared resources.


                                                                                   21
Tools to identify performance degradation points
            Pivotal Business Server & SharePoint Server Performance - Tier 2


    Windows Reliability and Performance Monitor is a Microsoft Management
    Console (MMC) snap-in that combines the functionality of previous stand-
    alone tools:
    • Performance Logs and Alerts
    • Server Performance Advisor
    • System Monitor.

                                                                               22
Tools to identify performance degradation points
            Pivotal Business Server & SharePoint Server Performance - Tier 2

   Server
   Performance
   Advisor
   is a server
   performance
   diagnostic tool
   developed to
   diagnose root
   causes of
   performance
   problems in a
   Microsoft
   Windows
   Server™ 2003
   operating system


                                                                               23
Tools to identify performance degradation points
                 What resources are needed

                                             Tier 3


                                                      24
Tools to identify performance degradation points
                              Pivotal Client Performance - Tier 3

 Pivotal Diagnostics is a feature used to identify performance issues related to Pivotal
 Client. This utility allows you to determine which part of your system is causing
 performance slowdown of Pivotal Client:


                                                                                     25
Tools to identify performance degradation points
                       Pivotal Client Performance - Tier 3

  Event Viewer logs:


                                                             26
Tools to identify performance degradation points
                                   Pivotal Client Performance - Tier 3

 Pivotal Client log:
                  ..Documents and Settings<username>LocalSettingsApplication DataCDC SoftwareSmart
                  ClientPivotalClient.<InstanceServerName>exe

                  <drive>UsersAdministratorAppDataRoamingCDC SoftwareSmart
                  ClientPivotalClient.PerMachineCMS6


  Levels of Verbosity:             Change: In the IafConfig.xml file, locate, and replace the
  1) ERROR: Least verbose          logging level in the code <level value="WARN" /> with
  2) WARN                          the logging level of your choice, for example:
  3) INFO
  4) DEBUG: Most verbose           <level value="INFO" />.

                                   By default in the IafConfig.xml, the logging level is set to
                                   WARN.


                                                                                                      27
Tools to identify performance degradation points
                                  Pivotal Client Performance - Tier 3

 Office Integration log:
                 ..Documents and Settings<username> CDC Software

                 For Windows Vista and Windows 7 operating systems:

                 ..users<username>CDC Software


  Levels of Verbosity:            Change: In the IafConfig.xml file, locate, and replace the
  1) ERROR: Least verbose         logging level in the code <level value="WARN" /> with
  2) WARN                         the logging level of your choice, for example:
  3) INFO
  4) DEBUG: Most verbose          <level value="INFO" />.

                                  By default in the IafConfig.xml, the logging level is set to
                                  WARN.


                                                                                             28
Tools to identify performance degradation points
                              Pivotal Client Performance - Tier 3

 Additional logs:

 IafTrace.log       Logs the interaction between Pivotal Client and the remote Smart
                    Updater service (an ASP.NET v4.0 Web Service Extension)


 SmartLauncher.log Logs issues while connecting and downloading from the deployment
                   server.


                                                                                       29
Tools to identify performance degradation points
                     Reference resources available on ePartner / eService


 If you do not have an eService / ePartner ID, please make sure you follow up with me


                                                                                        30
Tools to identify performance degradation points
                                     Installed Programs

  Make sure you have detailed
  information regarding the versions of
  all the software that you have
  currently installed (including service
  pack, hot fix and patches)


                                                          31
Tools to identify performance degradation points
                  Who? What? When? Why?


                                • Who is using the system?

                                • What for?

                                • When during the day,
                                  week month?

                                • Why do they need access
                                  for?


                                                        32
Tools to identify performance degradation points
                         Business Module – Best Practices

             Several Pivotal Toolkit tools and commands are available that would
             help you identify possible areas of opportunity where performance can
             be enhanced:
             An Invalid ID is an element ID which has lost its link to
             its referenced element.
             Duplicates: Objects of the same type must have
             unique names within their domain

 An orphaned database record is one that links,
 through a many-to-one relationship, to
 another record in the database that has been
 deleted since the link was established
                                                                              33
Creating a baseline
Identifying areas of improvement

Ok, you have gathered all the
information about areas where
your Pivotal implementation can
be improved…
Now what?


                                         35
How to assess changes needed


                               36
How to implement changes

There no specific order or best practices rule on how to
implement any of the changes needed.
                                                        Optimize
                                                         forms

                   Optimize                DB Changes
                    forms

         Add                   Software
       indexes                 Upgrades


                  DB Changes


      Hardware                   Load
      Resources                Balancing

                    Purge                   Purge          Add
                   Orphans                 Orphans       indexes


                                                                   37
Best practices for comparing results
                                                                  ….
                                                    Collect
                                                    Performance
                                      Implement     Data
                                      Changes (2)
                            Analyze
                            Results
              Collect
              Performance
Implement     Data
Changes (1)


                                                                       38
QUESTIONS?
THANK YOU

Cesar Ceniceros
Manager, Technical Advisory & Education Services

Pivotal CRM: Optimize your Pivotal Implementation

  • 1.
    Pivotal CRM: Optimizeyour Pivotal Implementation Cesar Ceniceros Manager, Technical Advisory & Education Services
  • 2.
    Agenda • How do I achieve an optimal configuration? – What resources are needed – How do I know if my system is configured to support my existing users – What and where to look for performance bottle-necks • Tools to identify performance degradation points – Database Server Performance – Pivotal Business Server Performance – Pivotal Client Performance – Reviewing and identifying areas of improvement • Creating a baseline – How to assess changes needed – How to implement changes – Best practices for comparing results • Q&A Session 2
  • 3.
    How do Iachieve an optimal configuration?
  • 4.
    How do Iachieve optimal configuration? What resources are needed Tier 1 Tier 2 Tier 3 Business Server Integration SyncStream Server Server SharePoint Server 4
  • 5.
    How do Iachieve optimal configuration? Typically two things are needed… number one Tier 1 Tier 2 Tier 3 Business Server Integration SyncStream Server Server SharePoint Server 5
  • 6.
    How do Iachieve optimal configuration? Number two System Design – Architecture & application Administration – Day to day operation Maintenance – Review logs periodically Troubleshooting – Research and be accountable Upgrading – Keep up to date 6
  • 7.
    How do Iachieve optimal configuration Examples of Best Practices System Design – Assign appropriate resources to your Pivotal CRM application like having dedicated servers with enough resources Administration – Do not cut corners when managing your Pivotal CRM environment. 7
  • 8.
    How do Iachieve optimal configuration Quiz # 1 8
  • 9.
    How do Iachieve optimal configuration Quiz # 1 9
  • 10.
    How do Iachieve optimal configuration? Examples of Best Practices Maintenance – Be proactive in reviewing your logs, do not wait until your users are complaining about performance issues Troubleshooting and Upgrading – Try to keep your environment error free and up to date 10
  • 11.
    How do Iknow if my system is properly configured to support my existing users? Most likely, you’ll know because your Pivotal Users will let you know when and if your system is performing slow Performance monitor tools can alert you when a Pivotal component is behaving sluggish 11
  • 12.
    What and whereto look for performance bottle-necks Pivotal logs should be the first place where to look when troubleshooting non-optimal performance Event Viewer log can also contain very useful information related to overall performance, not just from the Pivotal side but also from the OS perspective 12
  • 13.
    Tools to identifyperformance degradation points
  • 14.
    Tools to identifyperformance degradation points Which resources are needed? Tier 1 14
  • 15.
    Tools to identifyperformance degradation points Database Server Performance - Tier 1 Database File Structure (.mdf & .ldf) • The reason the data file and log file are typically recommended to be on separate drives is that when you’re doing inserts/updates/deletes both have to write at the exact same time So when is it appropriate to put the data and log files on the same drive, and use the leftover drive for something else? • When the database is rarely updated • When one drive is dramatically faster than the other drive • When your application extensively uses the TempDB more than anything else • When the application does heavier disk activity than your SQL Server (same server) 15
  • 16.
    Tools to identifyperformance degradation points Database Server Performance - Tier 1 Setting Min value Max Value Setting Running Value Ad Hoc Distributed Queries affinity64 I/O mask 0 -2147483648 1 2147483647 1 0 1 0 sp_configure: Displays or changes affinity64 mask Agent XPs -2147483648 0 2147483647 1 0 1 0 1 global configuration settings for the awe enabled blocked process threshold 0 0 1 86400 0 0 0 0 current server cost threshold for parallelism 0 32767 5 5 cross db ownership chaining 0 1 0 0 cursor threshold -1 2147483647 -1 -1 Database Mail XPs default full-text language 0 0 1 2147483647 1 1033 1 1033 This information will allow you to ensure your SQL Server configuration is in line default language 0 9999 0 0 default trace enabled 0 1 1 1 fill factor (%) 0 100 0 0 ft crawl bandwidth (max) ft crawl bandwidth (min) 0 0 32767 32767 100 0 100 0 with your business needs and ft notify bandwidth (max) ft notify bandwidth (min) 0 0 32767 32767 100 0 100 0 requirements. index create memory (KB) 704 2147483647 0 0 in-doubt xact resolution 0 2 0 0 locks 5000 2147483647 0 0 max degree of parallelism max full-text crawl range 0 0 64 256 0 4 0 4 • AWE enabled max server memory (MB) 16 2147483647 38912 38912 max text repl size (B) max worker threads 0 128 2147483647 32767 65536 0 65536 0 • Max Server Memory media retention min memory per query (KB) 0 512 365 2147483647 0 1024 0 1024 • Etc. min server memory (MB) 0 2147483647 128 128 nested triggers 0 1 1 1 network packet size (B) 512 32767 4096 4096 16
  • 17.
    Tools to identifyperformance degradation points Database Server Performance - Tier 1 SQL Traces • SQL Trace is a performance tuning tool, which can be used to fine tune your Pivotal application. It traces the time taken to fetch the data from the database thus having a better understanding on how to reduce the time The data contained on a SQL trace will help you analyze and possibly identify any long running query, non-optimize searches and even deadlocks within your Pivotal application caused by • Non-optimized code • Improper indexing (over-indexing /under-indexing) • Unnecessary trips to the SQL Server • Lack of server resources and other server issues (hardware) 17
  • 18.
    Tools to identifyperformance degradation points Database Server Performance - Tier 1 Database Engine Tuning Advisor Database Engine Helps you select and create an optimal set of indexes, indexed views, and partitions without requiring an expert Tuning Advisor understanding of the structure of the database or the internals of Microsoft SQL Server With this tool you can perform the following optimization tasks: • Recommend the best mix of indexes for databases by using the query optimizer to analyze queries in a workload • Analyze the effects of the proposed changes, including index usage, query distribution among tables, and query performance in the workload • Recommend ways to tune the database for a small set of problem queries • Etc. 18
  • 19.
    Tools to identifyperformance degradation points Database Server Performance - Tier 1 User data can adversely impact performance depending on various factors, in order to optimize a Pivotal environment it is important to understand the impact that your data is having on the system. 19
  • 20.
    Tools to identifyperformance degradation points What resources are needed Tier 2 Business Server Integration SyncStream Server Server SharePoint Server 20
  • 21.
    Tools to identifyperformance degradation points Pivotal Business Server & SharePoint Server Performance - Tier 2 System information (msinfo32.exe).- Displays a comprehensive view of your hardware, system components, and software environment. With this tool you will be able to get a first look at all the resources allocated to your servers. Be aware of VM environments, for these type of environments the resources allocated can be shared resources. 21
  • 22.
    Tools to identifyperformance degradation points Pivotal Business Server & SharePoint Server Performance - Tier 2 Windows Reliability and Performance Monitor is a Microsoft Management Console (MMC) snap-in that combines the functionality of previous stand- alone tools: • Performance Logs and Alerts • Server Performance Advisor • System Monitor. 22
  • 23.
    Tools to identifyperformance degradation points Pivotal Business Server & SharePoint Server Performance - Tier 2 Server Performance Advisor is a server performance diagnostic tool developed to diagnose root causes of performance problems in a Microsoft Windows Server™ 2003 operating system 23
  • 24.
    Tools to identifyperformance degradation points What resources are needed Tier 3 24
  • 25.
    Tools to identifyperformance degradation points Pivotal Client Performance - Tier 3 Pivotal Diagnostics is a feature used to identify performance issues related to Pivotal Client. This utility allows you to determine which part of your system is causing performance slowdown of Pivotal Client: 25
  • 26.
    Tools to identifyperformance degradation points Pivotal Client Performance - Tier 3 Event Viewer logs: 26
  • 27.
    Tools to identifyperformance degradation points Pivotal Client Performance - Tier 3 Pivotal Client log: ..Documents and Settings<username>LocalSettingsApplication DataCDC SoftwareSmart ClientPivotalClient.<InstanceServerName>exe <drive>UsersAdministratorAppDataRoamingCDC SoftwareSmart ClientPivotalClient.PerMachineCMS6 Levels of Verbosity: Change: In the IafConfig.xml file, locate, and replace the 1) ERROR: Least verbose logging level in the code <level value="WARN" /> with 2) WARN the logging level of your choice, for example: 3) INFO 4) DEBUG: Most verbose <level value="INFO" />. By default in the IafConfig.xml, the logging level is set to WARN. 27
  • 28.
    Tools to identifyperformance degradation points Pivotal Client Performance - Tier 3 Office Integration log: ..Documents and Settings<username> CDC Software For Windows Vista and Windows 7 operating systems: ..users<username>CDC Software Levels of Verbosity: Change: In the IafConfig.xml file, locate, and replace the 1) ERROR: Least verbose logging level in the code <level value="WARN" /> with 2) WARN the logging level of your choice, for example: 3) INFO 4) DEBUG: Most verbose <level value="INFO" />. By default in the IafConfig.xml, the logging level is set to WARN. 28
  • 29.
    Tools to identifyperformance degradation points Pivotal Client Performance - Tier 3 Additional logs: IafTrace.log Logs the interaction between Pivotal Client and the remote Smart Updater service (an ASP.NET v4.0 Web Service Extension) SmartLauncher.log Logs issues while connecting and downloading from the deployment server. 29
  • 30.
    Tools to identifyperformance degradation points Reference resources available on ePartner / eService If you do not have an eService / ePartner ID, please make sure you follow up with me 30
  • 31.
    Tools to identifyperformance degradation points Installed Programs Make sure you have detailed information regarding the versions of all the software that you have currently installed (including service pack, hot fix and patches) 31
  • 32.
    Tools to identifyperformance degradation points Who? What? When? Why? • Who is using the system? • What for? • When during the day, week month? • Why do they need access for? 32
  • 33.
    Tools to identifyperformance degradation points Business Module – Best Practices Several Pivotal Toolkit tools and commands are available that would help you identify possible areas of opportunity where performance can be enhanced: An Invalid ID is an element ID which has lost its link to its referenced element. Duplicates: Objects of the same type must have unique names within their domain An orphaned database record is one that links, through a many-to-one relationship, to another record in the database that has been deleted since the link was established 33
  • 34.
  • 35.
    Identifying areas ofimprovement Ok, you have gathered all the information about areas where your Pivotal implementation can be improved… Now what? 35
  • 36.
    How to assesschanges needed 36
  • 37.
    How to implementchanges There no specific order or best practices rule on how to implement any of the changes needed. Optimize forms Optimize DB Changes forms Add Software indexes Upgrades DB Changes Hardware Load Resources Balancing Purge Purge Add Orphans Orphans indexes 37
  • 38.
    Best practices forcomparing results …. Collect Performance Implement Data Changes (2) Analyze Results Collect Performance Implement Data Changes (1) 38
  • 39.
  • 40.
    THANK YOU Cesar Ceniceros Manager,Technical Advisory & Education Services